10 XI November 2022 https://doi.org/10.22214/ijraset.2022.47563
ISSN: 2321 9653; IC Value: 45.98; SJ Impact Factor: 7.538
Volume 10 Issue XI Nov 2022 Available at www.ijraset.com

ISSN: 2321 9653; IC Value: 45.98; SJ Impact Factor: 7.538
Volume 10 Issue XI Nov 2022 Available at www.ijraset.com
Nazish Nazir1 , Ravinder Pal Singh2 , Dr. Monika Mehra3
1M. Tech Scholar, Department of ECE Engineering, RIMT University, Mandi Gobingarh, Punjab, India
2Technical Head and Professor, Dept of Research, Innovation & Incubation, RIMT University, Mandi Gobingarh, Punjab, India

3HOD and Professor, Department of ECE Engineering, RIMT University, Mandi Gobingarh, Punjab, India
Abstract: Spleen is the largest secondary lymphoid organ and play a crucial role in the regulation of innate and adaptive immune. Among all cancers, spleen cancer is one of the serious diseases which effects minor population across the globe but is potentially fatal, especially if diagnosed in a later stage of development with a 20% survival rate at 6 months. Given the intricacy of the problem, several computer-aided diagnostic methods have been proposed and developed to increase the survival rate Spleen Cancer is a malignancy of white blood cells involving tumour deposits in the spleen. Most splenic cancer do not start in the spleen, and those that do, are almost always lymphomas. Lymphoma is a type of blood cancer that develops in the lymphatic system. Although there are many systems available with the medical industry, but this research is proposed to improve the performance of existing system by employing deep learning feature of Artificial Intelligence (AI) using Convolution Neural Networks (CNN), where Convolution Neural Networks (CNN) has been implemented using DenseNet 201. This research accomplished the desired parameters with values to achieve 99.60% accuracy and 0.1240 % loss while training and testing the model. The research has been supported with the datasets from Kaggle, IEEE transactions on information technology in biomedicine and IEEE International Symposium on Biomedical Imaging. The data set contains three clinical types spleen cancer, such as CLL (chronic lymphocytic leukemia); FL (follicular lymphoma); MCL (mantle cell lymphoma). Keywords: Artificial Intelligence (AI), Convolution Neural Networks (CNN), CLL (chronic lymphocytic leukemia); FL (follicular lymphoma); MCL (mantle cell lymphoma).
The spleen is the body's largest lymphatic organ as well as its largest ductless gland. Red blood cell destruction, immunologic monitoring, and splenic contraction to increase blood volume following haemorrhage are all splenic functions. The universal organ among vertebrates is the spleen. It primarily functions as a blood filter[1] Spleen cancer is a condition in which aberrant cells proliferate quickly and start to disrupt the organ's regular function. The body's lymphatic system includes the spleen, which is situated behind the rib cage. Spleen cancer is uncommon since it rarely occurs within the actual organ. The majority of cases involve the disease spreading from another organ to the spleen. Typically, the invasive tumours are either luekemias, which are blood cancers of the circulatory system, or lymphomas, which have their origins elsewhere in the lymphatic system. The prognosis for a person with this ailment will vary depending on their age, general health, type of cancer, stage of development, and whether the cancer started in the spleen or invaded the organ from another region. There are 2 types of Spleen Cancers, primary or secondary. If it is primary it starts in the spleen. Primary malignant neoplasms involving the spleen are lymphoma and angiosarcoma[2]. If it’s secondary, it starts in another organ and spreads to the spleen. Leukaemia’s and lymphomas are the most frequent causes of secondary spleen cancer. Sometimes the malignancy is caused by another cancer, such as breast, lung, stomach, pancreatic, liver, or colon. Most of the time, cancer in the spleen is a lymphoma a type of cancer that affects the lymphatic system. Another blood cancer, leukemia, can affect spleen. Sometimes, leukemia cells gather and build up in this organ.
1) Chronic Lymphocytic Leukaemia: A malignant blood condition known as chronic lymphocytic leukaemia (CLL) causes an accumulation of white blood cells in the lymphoid tissue. Instead of normal white blood cells, CLL causes the production of aberrant lymphocytes, also known as leukemic cells, which subsequently build up over time. There is less room for healthy blood cells as the number of unhealthy blood cells increases. Less healthy cells combined with CLL lymphocytes' subpar ability to fight infections might result in recurrent infections, anaemia, and simple bleeding. The uncontrolled growth and development of lymphoid tissue can happen in a number of locations throughout the body, including the lymph nodes, spleen, bone marrow, and lungs.

ISSN: 2321 9653; IC Value: 45.98; SJ Impact Factor: 7.538 Volume 10 Issue XI Nov 2022 Available at www.ijraset.com

2) Acute Lymphocytic Leukaemia: Acute lymphocytic leukaemia (ALL), also called acute lymphoblastic leukaemia, is a type of blood cancer that arises from lymphocytes. When the bone marrow produces excessive numbers of immature white blood cells that grow uncontrollably, acute lymphocytic leukaemia is the result. It is the most prevalent kind of cancer among kids. In 2022, the American Cancer Society (ACS) estimates that over 6,660 persons will be given an ALL diagnosis, and roughly 1,560 of them will pass away as a result of the illness.
3) Chronic Myelogenous Leukaemia: A specific type of blood cancer called CML develops in the bone marrow's blood forming cells. Although it rarely affects children, it accounts for roughly 15% of adult cases of leukaemia, according to the ACS. CML begins in myeloid cells, which produce red blood cells, platelets, and white blood cells, whereas CLL originates in white blood cells called lymphocytes. An infrequent myeloproliferative cancer called chronic myelogenous leukaemia is characterized by increased production of white blood cells in the spongy tissue found inside the body's big bones (bone marrow), spleen, liver, and blood. The intestinal tract, kidneys, lungs, gonads, and lymph nodes are among the bodily parts that leukemic cells enter as the condition worsens.


A form of blood cancer is lymphoma. In the UK, it is the fifth most prevalent type of cancer. At any age, it can have an impact on both adults and kids. The majority of lymphoma forms can be effectively treated. When white blood cells called lymphocytes multiply out of control, lymphoma develops. Our immune system, which assists in battling illness, is made up of lymphocytes. Lymphatic system carries a fluid called lymph on lymphocytes as they circulate throughout it. Lymph nodes, which are glands dispersed throughout your body, are via which the lymph fluid travels. Because of this, lymphoma is sometimes referred to as an immune system cancer[4]
Only a few lymphomas are spleen cancerous and these are
1) Haemangioma: The most frequent primary benign tumour of the spleen, a hemangioma is made up of blood filled, endothelium lined arterial channels. A rare benign vascular disorder called diffuse hemangiomatosis of the spleen can present as systemic angiomatosis or, less frequently, solely affect the spleen. There may also be a serious impairment in blood coagulation[3].
2) Lymphangioma: Even less often than haemangioma of the liver, lymphangioma of the spleen can present clinically as small, incidental observations or as big, symptomatic multicystic splenic tumours needing surgical intervention. The latter are observed in association with disseminated lymphangiomatosis, a paediatric condition in which the lymphangiomatous process diffusely includes various locations or organs, such as the bone, soft tissue, or viscera. Single or several splenic lymphangiomas are possible.
ISSN: 2321 9653; IC Value: 45.98; SJ Impact Factor: 7.538 Volume 10 Issue XI Nov 2022 Available at www.ijraset.com
3) Littoral Cell Angioma: The vascular tumour known as a littoral cell angioma (LCA) of the spleen is a lesion that only affects the spleen and has no soft tissue analogue. The lining cells of the splenic red pulp sinuses, which often exhibit both endothelial and histiocyte/macrophage appearances and characteristics, are thought to be the source of LCAs. Without regard to sex, these lesions can develop at any age, although middle age is when they most frequently appear. It may be accompanied by splenomegaly[5], which can cause anaemia or thrombocytopenia.
4) Angiosarcoma: A uncommon kind of cancer called angiosarcoma develops in the inner lining of lymph and blood arteries. Although it may develop anywhere in the body, skin, breast, liver, and spleen are where it usually does. Patients with splenic angiosarcoma are generally between the ages of 50 and 60. The link between splenic angiosarcoma and environmental or occupational variables like thorium dioxide or monomer vinyl chloride has recently received attention. Angiosarcoma most frequentlyaffects the spleen after developing in another organ, generallythe liver.
5) Littoral Cell Angiosarcoma: A uncommon primary splenic hemangioma called a littoral cell angioma (LCA) can develop in the red sinus shore cells of the spleen's reticuloendothelial system (RES). LCA is an uncommon splenic vascular tumour that may be found accidentally or in people who have abdominal discomfort[6]. The majority of recorded instances, however, affect middle aged adults, with relatively few affecting youngsters. There is no gender preference, and both boys and females appear to have the same occurrence.
6) Haemangioendothelioma: A contentious condition known as haemangioendothelioma of the spleen may be a vascular lesion with morphological and clinical characteristics in between haemangioma and angiosarcoma. The uncommon malignant vascular tumour known as epithelioid hemangioendothelioma (EHE) is heterogeneous, frequently low to intermediate grade, and aggressive. EHE has a 1% per million incidence and mostly affects middle aged people.
7) Lymphoid Splenic Neoplasms: A kind of white blood cell known as a "lymphocyte" is the source of numerous related subtypes of cancer together referred to as lymphoma. Hodgkin lymphoma (HL) and non Hodgkin lymphoma are the two main classifications of lymphoma (NHL). Three different kinds of lymphocytes, including B lymphocytes (B cells), T lymphocytes (T cells), and natural killer (NK) cells, can develop lymphoma. Aside from natural killer cells, which also target cancer cells and eradicate viruses, B lymphocytes, T lymphocytes, and T assist fight infections and attack early stage cancer cells. B lymphocytes produce antibodies to combat infection. Compared to T cell lymphomas, B cell lymphomas are more prevalent.
8) Hodgkin’s disease: A malignancy that affects the lymphatic system, a component of the body's immune system that fights infection, is called Hodgkin's lymphoma. White blood cells known as lymphocytes overgrow in Hodgkin's lymphoma, resulting in enlarged lymph nodes and growths all over the body. Hodgkin's disease is another name for Hodgkin's lymphoma. Hodgkin's disease frequently has secondary involvement in the spleen. There are Reed Sternberg cells in Hodgkin's lymphoma. Overall, primary splenic tumours that are lymphoid in nature are rare. It has always been difficult to evaluate the presence or absence of the disease in the spleen, using non invasive methods. Most published series show disappointing results in the assessment of the histological state of the spleen using CT. Histological examination following surgical removal, seems to be the most accurate technique to establish splenic involvement. It has never been simple to detect whether the sickness is present or absent in the spleen using non invasive methods. When assessing the histological state of the spleen using CT, the bulk of reported studies provide unimpressive results. Histological analysis following surgical excision appears to be the most accurate way to identify splenic involvement[7]
9) Non Hodgkin’s Lymphoma: The Reed Sternberg cell is not present, the lymphoma is classified as non Hodgkin's. Follicular lymphoma is a type of non Hodgkin lymphoma (NHL). NHL is a cancer of the lymphatic system. Follicular lymphoma develops when the body makes abnormal B lymphocytes. These lymphocytes are a type of white blood cell that normally helps us fight infections.
10) Mantle Cell Lymphoma: One of around 70 distinct subtypes of NHL is mantle cell lymphoma (MCL). The malignant alteration of a B lymphocyte in the periphery of a lymph node follicle causes mantle cell lymphoma (MCL) (the mantle zone). The unregulated growth of the altered B lymphocyte leads to the buildup of lymphoma cells, which enlarges the lymph nodes. These lymph nodes may occasionally be referred to as "tumours" if develop in other places of the body or become particularly big. The lymphatic system and blood are both entry points for MCL cells, which can then migrate to other lymph nodes or organs, including the marrow, liver, and gastrointestinal tract. To assess the disease's metabolic activity, imaging examinations are used, such as computed tomography (CT) scans of the chest, abdomen, and pelvis, either with or without a complementary positron emission tomography (PET) scan[22]. Measurements of lactate dehydrogenase (LDH) and beta2 microglobulin are particularly important since they are indirect indicators of the severity and rate of development of the illness.
ISSN: 2321 9653; IC Value: 45.98; SJ Impact Factor: 7.538 Volume 10 Issue XI Nov 2022 Available at www.ijraset.com
11) Follicular Lymphoma: An indolent non Hodgkin lymphoma is follicular lymphoma. In contrast to "aggressive" cancers, which have rapidly proliferating cells, "indolent" cancers grow slowly over time. The lymphatic system, which is a component of the immune system, is where follicular lymphoma spreads. White blood cells start to multiply abnormally in follicular lymphoma. B lymphocytes or B cells are other names for white blood cells. These then amass in various places on the body, including lymph nodes. Although follicular lymphoma is mostly incurable, treatment is effective. After diagnosis, a person can have follicular lymphoma for many years or even decades[8,9].
Prior to the introduction of more sophisticated imaging techniques like computed tomography (CT) and magnetic resonance (MR) imaging, the spleen was a radiologist's "invisible" organ that was frequently difficult to see on standard plain films. It was challenging to identify the spleen's pathologic states. But modern cross sectional imaging methods enable thorough analysis of splenic structure and disease. Various imaging modalities, such as standard plain radiography, ultrasonography, CT, MR imaging, and angiography, can show how the normal spleen looks[10]
Transfer learning is a machine learning research subject that is concerned with the storage of knowledge obtained while resolving one problem and its subsequent application to another, related problem. Transfer learning is the ability to retain knowledge gained from addressing one problem and apply it to a different one later on. With transfer learning, models are created utilising prior knowledge that demonstrate greater effectiveness and learn more quickly with less training data. The best thing about transfer learning is that only a portion of the trained model needs to be learned in order to use it. Transfer learning helps us accomplish this while saving time.
Pretrained models can be used as a testbed by AI engineers to build deep neural networks based on pre existing architectures. It's impossible to create a model from scratch due to computational constraints or time constraints. Given that there are a few highly developed CNN models, including AlexNet, LeNet, VGGNet, and others, AI engineers are more likely to employ pretrained models these days to create their own models for specific applications. AlexNet, which competes with the other CNN model and was the winner of ImageNet Large Scale Visual Recognition, was proposed by Krizhevsky et al. in 2012. LeNet and AlexNet's structures are similar, however AlexNet uses newer techniques like max pooling and ReLU nonlinearity. Karen Simonyan (2015) offered a new CNN model named VGGNet in 2014, which was a 19 layer deep neural network and won the 2nd place of ILSVRC2014. In the same year, the winner of ILSVRC2014 GoogleNet was proposed by Szegedy et al. (2015) combined some new ideas including 1x1 convolutions, which can help to reduce feature maps’ size and made the network deeper and wider. For the ILSVRC 2015, the winner ResNet provided a deeper network with 152 layers, which introduce the new idea that skip 2 layers at least or shortcut connection. Then in 2016, Huang et al. (2017) developed a new idea named as DenseBlock, which will introduce the feature reuse into the whole network. In this research work, we adopted DenseNet for Spleen Cancer detection[11] as it provided the best performance based on the ImageNet classification
Each layer is connected to every other layer in a feed forward fashion by the Dense Convolutional Network (DenseNet). They alleviate the vanishing gradient problem, strengthen feature propagation, encourage feature reuse, and substantially reduce the number of other parameters. In Dense Net 201, which is made up of four dense blocks, depicts the overall arrangement of a dense block. The initial layer in a thick block has l inputs since all prior multilayer frames' previews are delivered together with their respective key points to all following layers in a thick block. The layer above reads the state of the layer below and writes it to the layer below. Along with modifying the state, it conveys data that must be retained. Dense Net architecture explicitly distinguishes between information that is provided to the network and input that is preserved by concatenating features rather than summing them like ResNet does.
ISSN: 2321 9653; IC Value: 45.98; SJ Impact Factor: 7.538 Volume 10 Issue XI Nov 2022 Available at www.ijraset.com
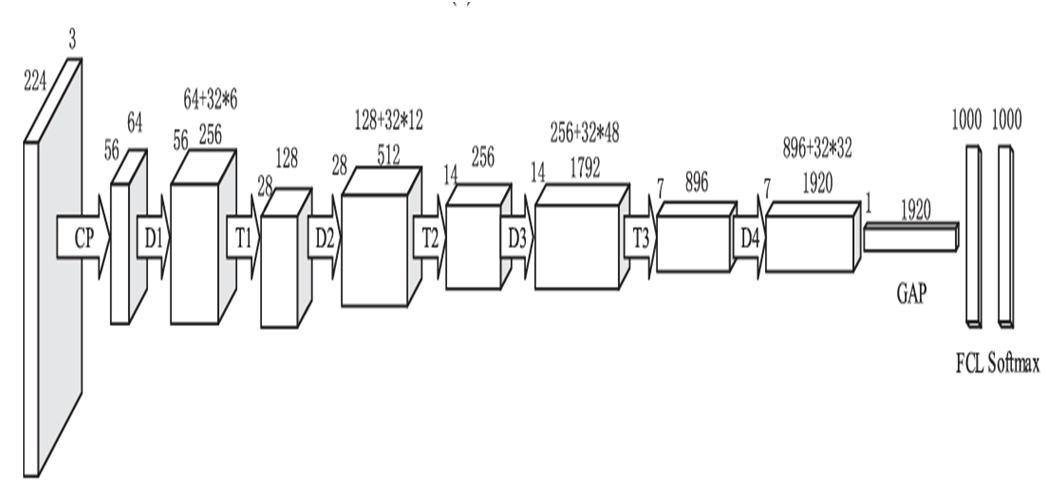
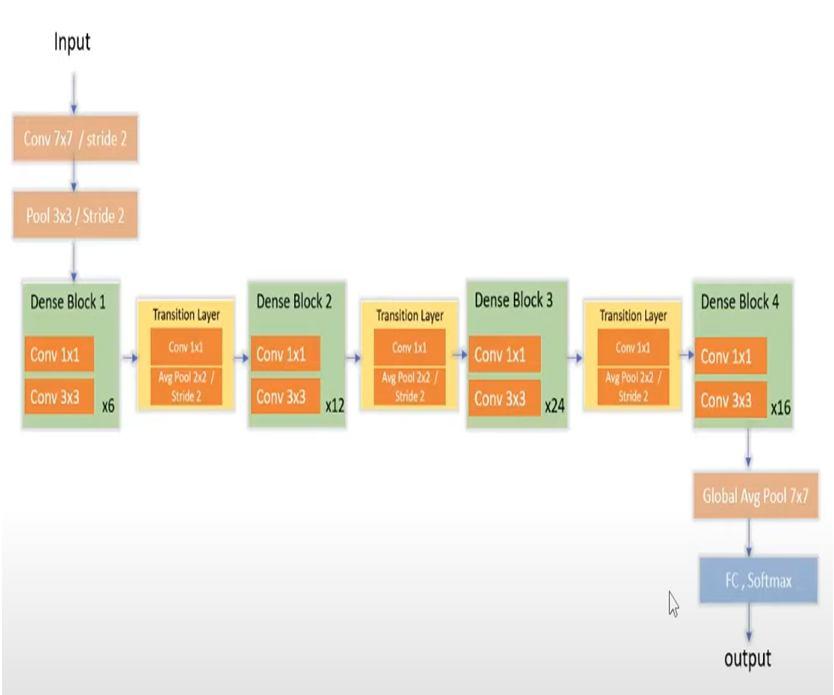
In order to prevent the model from overfitting for too long, a parameter is used to keep only the versions that are more effective on the road validation data. Using a composite function that incorporates three operations batch normalisation, ReLU, and a 3x3 convolution one layer in a dense block generates feature maps. Between each thick block, a transition layer is built using convolution and pooling layers. Dense Net 201 is composed of four dense blocks, the final one (which has 32 layers) being the one that will be adjusted. The Dense Net is improved using the same training technique as in the earlier rounds. The top layers of DenseNet 201 were tuned over 30 epochs. A parameter is used to maintain just the versions that are more successful on the road validation data, preventing the model from overfitting for an extended period of time.Since the majority of training can be completed with this number of epochs, 30 are utilised as a constant for all models[12].
Khaled M. Elsayes, Jay P. Heiken et al (2021) [13] in the paper titled “MR Imaging of the Spleen: Spectrum of Abnormalities” Similar to how lymph nodes relate to the lymphatic system, the spleen is connected to the circulatory system. The spleen can be harmed by a variety of illnesses. The following categories can be used to group pathologic splenic conditions: Congenital conditions; trauma; inflammation; vascular issues ; hematologic conditions ; benign tumours . Similar to how lymph nodes relate to the lymphatic system, the spleen is connected to the circulatory system. The spleen can be harmed by a variety of illnesses. Congenital diseases, trauma, and inflammation are the three main categories of pathologic conditions of the spleen. New magnetic resonance (MR) imaging techniques have increased the role of MR imaging in detection and characterization of splenic diseases. For the diagnosis and assessment of localised lesions and pathologic states of the spleen, MR imaging is a superb tool.
Zeyad Ghaleb Al Mekhlaf et al (2022) [14] Diagnosis of Histopathological Images to Distinguish Types of Malignant
Using Hybrid Techniques Based on Fusion Features. One of the forms of malignant tumours that might cause mortality is malignant lymphoma. A histological examination of pictures of lymphoma tissue is the diagnostic procedure for determining malignant lymphoma. The identical physical traits of the many lymphoma forms make it challenging for medical professionals to manually differentiate between them. Therefore, deep learning and automated learning approaches are designed to address this issue and aid physicians in reevaluating their diagnostic choices. This work sought to extract features using multiple methods and deep learning models and merge them into feature vectors since the physical traits of different lymphoma kinds are comparable.
ISSN: 2321 9653; IC Value: 45.98; SJ Impact Factor: 7.538 Volume 10 Issue XI Nov 2022 Available at www.ijraset.com
The application of two datasets with two distinct algorithms for the accurate diagnosis of malignant lymphoma. The first system used a mix of DenseNet 121 and ResNet 50 to extract low dimensional deep features, decrease their dimensionality using principal component analysis (PCA), then classify them using the SVM algorithm. The second system was based on manually created features extracted by the grey level co occurrence matrix (GLCM), fuzzy colour histogram (FCH), discrete wavelet transform (DWT), and local binary pattern (LBP) algorithms. These features were combined with the hand crafted features extracted by DenseNet 121 and ResNet 50, and they were then classified using a feed forward neural network (FFNN) classifier. With regard to identifying malignant lymphomas in the two datasets, all algorithms produced superior outcomes. For the first dataset, an FFNN classifier using ResNet 50 and custom features achieved accuracy, specificity, sensitivity, and AUC values of 99.5%, 100%, 99.33, and 99.86 respectively.
Sungwon Lee, Daniel C. Elton et al (2022) [15] in the paper titled “Fully Automated and Explainable Liver Segmental Volume Ratio and Spleen Segmentation at CT for Diagnosing Cirrhosis”, A deep learning based model measuring the volume of liver Couinaud segments and spleen at contrast enhanced CT performed similar to that of manual measurements in predicting histopathologic cirrhosis and advanced fibrosis .The ability of a deep learning (DL) model to predict cirrhosis and advanced fibrosis is measured by the liver segmental volume ratio (LSVR) and spleen volumes from CT scans.
Ms. Julie Wang; Alexander Wood et al (2021) [16] in the paper namely “Automated Spleen Injury Detection Using 3D Active Contours and Machine Learning” In this work, a machine learning based automated spleen damage diagnosis approach has been suggested. The Crash Injury Research Engineering Network (CIREN) dataset and Michigan Medicine both provided CT images from trauma victims. Ninety nine scans of healthy and lacerated spleens were divided into training and test sets, and 5 fold cross validation was used to train models for random forest (RF), naive Bayes, SVM, k NN ensemble, and subspace discriminant ensemble. With an Area Under the Receiver Operating Characteristic Curve (AUC) of 0.91 and an F1 score of 0.80 on the test set, Random Forest outperformed the other models. According to these findings, a quantitative, automated evaluation of traumatic spleen damage has the potential to expedite triage and enhance patient outcomes. In this work, a suggested automated approach for spleen lacerations in CT images. The classification method, which utilised histogram, Gabor filters, fractal dimension, and shape cues to discriminate lacerated spleens from healthy controls, was based upon a previously described localization and segmentation procedure. The classifiers RF, naive Bayes, SVM, k NN ensemble, subspace discriminant ensemble, and a CNN based architecture were all taken into consideration. With an AUC of 0.91 and an F1 of 0.80, the RF approach fared better than other models in differentiating between lacerated and healthy spleens. A leave one site out study was also conducted, which illustrated the method's resistance to variability resulting from variations in the data from two separate locations. The study's findings show that automated quantitative assessment of traumatic spleen damage has the potential to enhance patient outcomes and triage effectiveness.
After an extensive literature review, it is found that there are some gaps in the research The similarities between the characteristics of the many types of lymphomas and the diversity of malignant lymphomas have limited the accuracy of manual diagnosis. Analysis of tissue samples takes a lot of practise and effort. Spleen cancer is very swiftly growing, and lymph nodes double in size within a few days to a few weeks. While it is swiftly growing, it is curable in many patients when diagnosed early. When any individual has stage 3 4 lymphoma, it skill that the most cancers has unfold to different areas of the physique beyond the lymphoma nodes[54]. We are using machine learning and it is a category of an algorithm that allows software application to become more accurate in predicting. Our aim is to build algorithm that can receive input data and use statistical analysis to predict an output. Under these circumstances, machine learning provides a much easier way in detection of Spleen cancer with the help of dataset. CNNs have recently become one of the most widely used technologies in the field of medical imaging. CNNs are the foundation for the majority of deep learning applications in cancer detection. Using a slide stained with hematoxylin and eosin, the histopathological diagnosis of malignant lymphoma infers the kind of lymphoma or leukaemia. To determine the kind of splenic cancer, a certain immunohistochemistry (IHC) set is chosen. The ability to distinguish classes of lymphoma from biopsies sectioned and stained with Hematoxylin/Eosin (H+E) would allow for more consistent and less demanding diagnosis of this disease. The purpose of this work was to create methods for identifying the kind of spleen cancer using histopathological tissues stained with H&E. A system's capacity to generalise is dependent on the training dataset. By using the data augmentation approach, we hoped to increase the system's capacity so that it can be generalised when trained on a short dataset. In this study, a DenseNet201 Model was created to identify splenic carcinoma in histopathological pictures. The goal of this work was to use deep learning to extract features to categorise them
ISSN: 2321 9653; IC Value: 45.98; SJ Impact Factor: 7.538
Volume 10 Issue XI Nov 2022 Available at www.ijraset.com
1) To study spleen cancer detection and classification model based on Deep Learning.
2) To improve the training accuracy and validation accuracy using DenseNet 201 Model and enhance the performance of the model using pretrained dataset
The methodology of cardiac disease detection and classification using CNN is as follows:
a) Collection of Data Set: Early spleen cancer identification requires the application of efficient models and further research into the application of machine learning in healthcare settings. After being recognised and categorised by CNN, cardiovascular cases can be forwarded to human medical specialists for inspection, which will ease their workload, save them time, and guarantee that treatment is started as soon as possible to avoid complications.
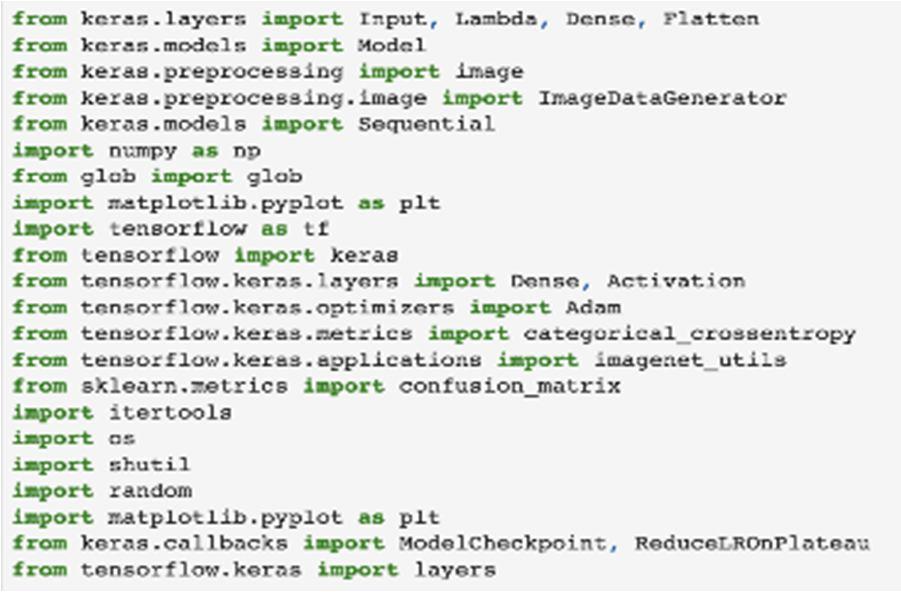
b) Importing the Libraries: Before beginning the programming portion, it is necessary to set up an environment that can run the code without producing any errors. The required libraries are downloaded, then imported into the code to establish the environment. The core principle of developing and designing models is made easier by libraries.
c) Determining the Path of Dataset: The dataset must be imported into the code for additional processing after it has been gathered and stored. In some situations, the obtained data must be processed before being used to train the model. The processing could involve image scaling, colour adjustment, etc
d) Data Pre processing: The photographs in the dataset need to be pre processed in order to convert them to the standard format because they are quite polluted, including images that are out of focus, have excessive exposure, have extra lighting, have a dark background, etc. The preliminary process involves completing the following tasks:
Removing the black border: The black border surrounding the pictures has been removed because it does not offer any information to the fundus image and is therefore superfluous.


Remove the black corner: The fundus image is round, so even after the black border was removed, there were some dark corners left. In this step, the dark edges of the image are removed.
Image resizing: The images have been shrunk to 120*120 pixels (width*height).
Adding the Gaussian Blur: By setting the kernel size, the pictures are given a Gaussian blur. Gaussian noise can be reduced with the use of this method.
ISSN: 2321 9653; IC Value: 45.98; SJ Impact Factor: 7.538 Volume 10 Issue XI Nov 2022 Available at www.ijraset.com
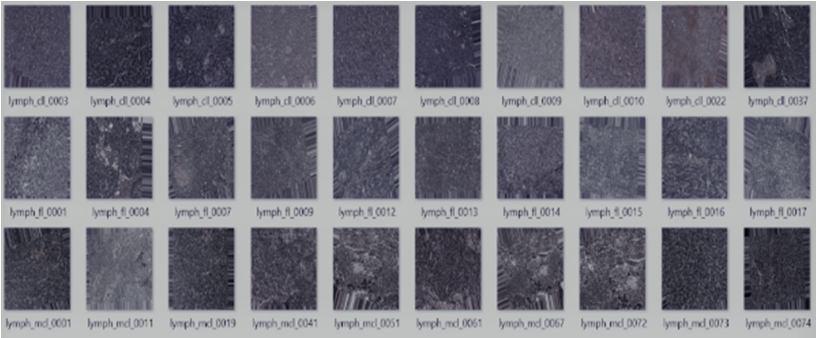
Figure 5 Sample spleen cancer images from the dataset
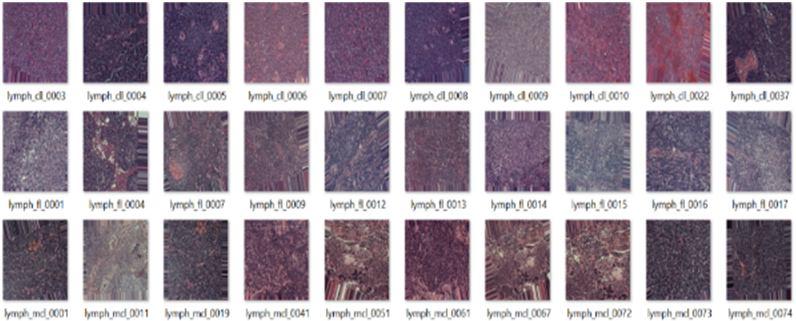
e) Data Augmentation: It is an integral process in deep learning, as in deep learning a need of large amounts of data is required and in some cases it is not feasible to collect thousands or millions of images, so data augmentation comes to the rescue.
Figure 6 Images obtained after data augmentation
f) Visualizing the Designed Model: To clearly understand all the layers involved into the model architecture, the DenseNet 201 model is created and shown.
g) Training the Model: The model must now be trained after being designed. Multiple epochs are used to feed the dataset into the DenseNet 201layers, which results in the creation and application of an appropriate learning mechanism.
h) Plotting the Graph: With regard to epochs, the pattern of losses and accuracy in training and validation is depicted. The training process is ended and the model is saved if the training parameters and validation parameters, such as training loss, training accuracy, validation loss, and validation accuracy, do not improve as the number of epochs increases
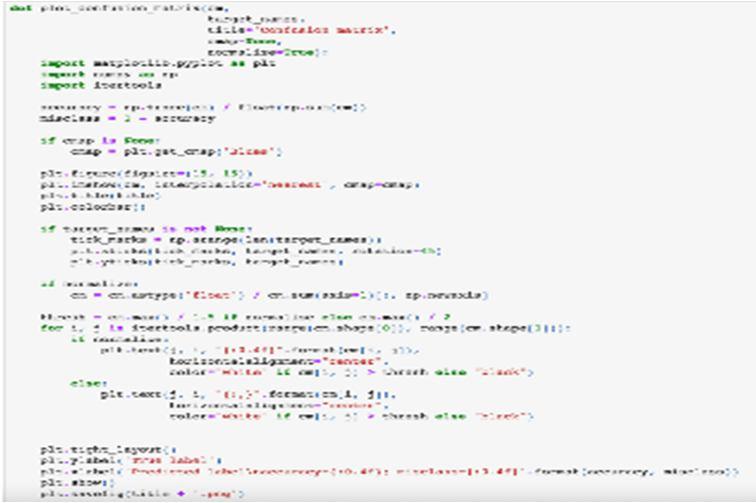
i) Plot Confusion Matrix: The model that was previously saved is now put to the test using the testing dataset, and the results are presented as a confusion matrix.
The most popular machine learning technique for classifying photos with CNN is deep learning. The best Python library for this is Keras, which makes creating a CNN model quite easy. Tensorflow, another library employed in this architecture, aids in providing the framework for backend operations. Testing, training, and designing are further uses for Keras. The other one that has been utilised is Matplotlib. Graphs can be plotted with it. For performing mathematical operations and converting data into arrays, utilise Numpy. Confusion matrix is plotted using Scikit Learn and is displayed in the results section. Each block's purpose after importing the libraries is described below.
Figure 7 Libraries
ISSN: 2321 9653; IC Value: 45.98; SJ Impact Factor: 7.538
Volume 10 Issue XI Nov 2022 Available at www.ijraset.com
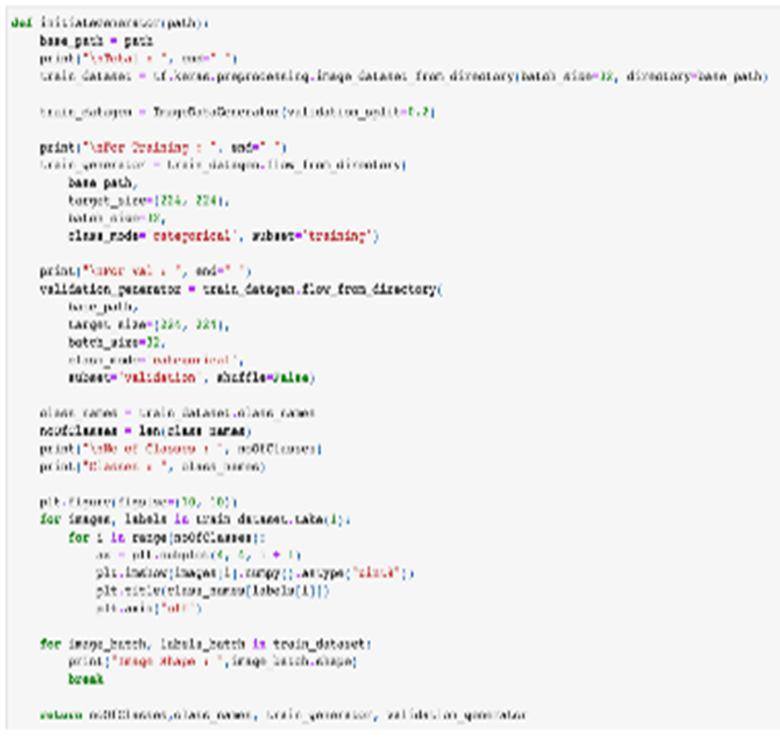
My dataset's path is provided by the "Initiate Generator" block in the first block. This procedure also involves a number of other operations. Creating a training and validation set from the data is the first of these. 20% of the overall dataset is still reserved for validation.
1) Transforming the 224x224 pixel photos in my training and validation dataset.
2) Determining a batch size of 32. While the model is being optimised, it can be altered.
3) Putting up a picture from each class in my dataset.
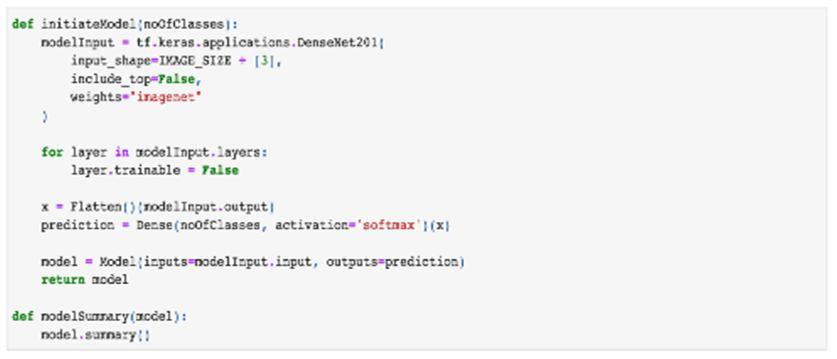
"InitiateModel" is in the second block. It requires as an input the number of classes. This approach is used for the subsequent work.
1) Including ImageNet as a pretrained data model in the model of models.
2) enabling training of the model.
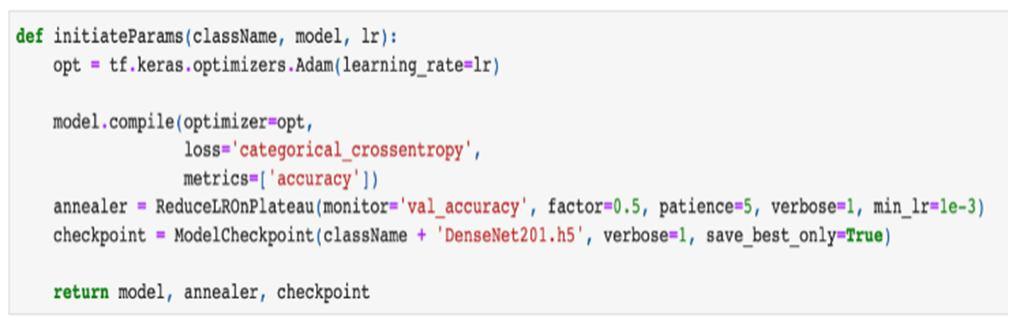
The "InitiateParams" block follows, and it accepts the class names, the model, and the learning rate as input. This technique is used for the subsequent work.
1) This model makes use of an optimiser named "Adam."
2) With the focus on validation accuracy, a feature of early stopping has been included. If the validation accuracy does not improve in the following patience number of epochs, additional epochs are stopped, which helps to save time.
3) When the model is saved, a checkpoint is made that includes the model's name and path.
Figure10 Initiate Params
ISSN: 2321 9653; IC Value: 45.98; SJ Impact Factor: 7.538
Volume 10 Issue XI Nov 2022 Available at www.ijraset.com
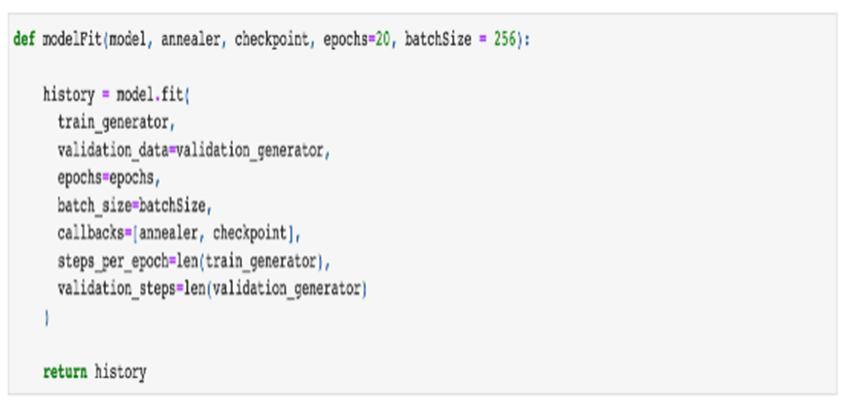
The "model Fit" block comes next. The following work is done using the model, checkpoint, number of epochs, and batch size as inputs.
1) The model training process begins with the specified number of epochs.
2) The input for training the model is the training and validation data.
3) It returns the Model history once the model has been trained so that the training procedure can be seen.
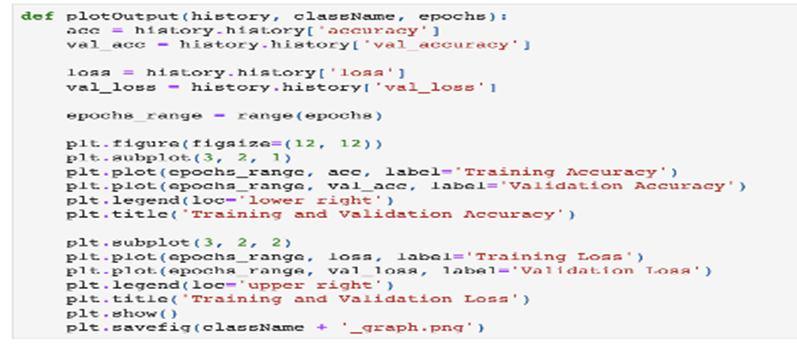
The "PlotOutput" performs the following actions when given the model history, class names, and number of epochs as input: 1) Displays a graph of the Training and Validation accuracy in relation to epochs.
2) The training and validation loss is plotted against epochs.
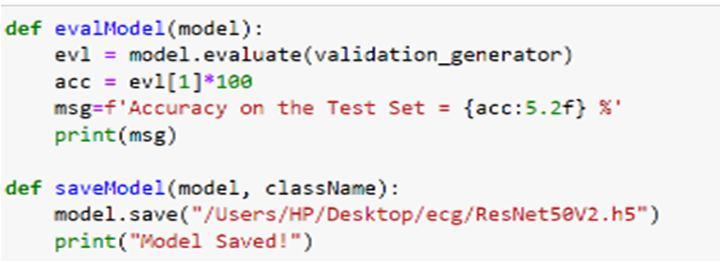
The "EvalModel" and "SaveModel" come next.
EvalModel assesses the trained model's accuracy against the test dataset. Model saving option two saves the model at the specified checkpoint.
Figure
The "plot confusion matrix" approach is the next. Based on the outputs that our model is anticipated to produce, it depicts the confusion matrix.
Figure 14 plot confusion matrix
ISSN: 2321 9653; IC Value: 45.98; SJ Impact Factor: 7.538 Volume 10 Issue XI Nov 2022 Available at www.ijraset.com
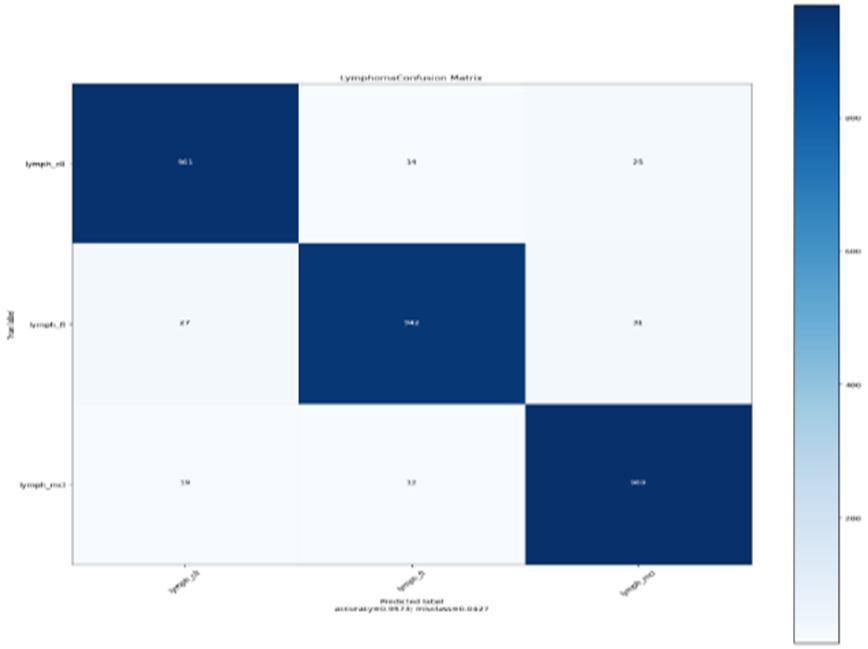
The DenseNet image had an exceptional accuracy of 99.42%. The loss is going down and the precision is becoming better and better as more images are being taught. Weights are updated after an epoch is complete. The training was finished with a 99.42% accuracy rate. The testing results for several epochs are shown below.
Figure 15 (A) Figure 15 (B) Graphs showing accuracy and loss for 5 epochs
Figure 15(A) represents the graphs for training and validation accuracy for 5 epochs. X axis represents the epochs and Y axis represents accuracy percentage. The blue line represents the training accuracy and the yellow line represents the validation accuracy. It is clear from the graph that the training and validation accuracy increases as the epochs increase. Figure 15(B) represents the training and validation loss. As per the graph the training loss decreases over the increasing epochs.
B. Epoch 10
Figure 16 (A) Figure 16 (B) Graphs showing accuracy and loss for 10 epochs
Figure 16(A) represents the graphs for training and validation accuracy on 10 epochs. X axis represents the epochs and the Y axis represents the accuracy percentage. The blue line represents the training accuracy and the yellow line represents the validation accuracy. It is clear from the graph that the training accuracy increases over the increasing epochs. However, Validation accuracy remains somehow constant.
Figure 16(B) represents training and validation loss. The Validation loss decreases over the increasing epochs. However, Validation loss increases slightly over increasing epochs. The overall accuracy on the Test Set is 95 73%.
ISSN: 2321 9653; IC Value: 45.98; SJ Impact Factor: 7.538 Volume 10 Issue XI Nov 2022 Available at www.ijraset.com
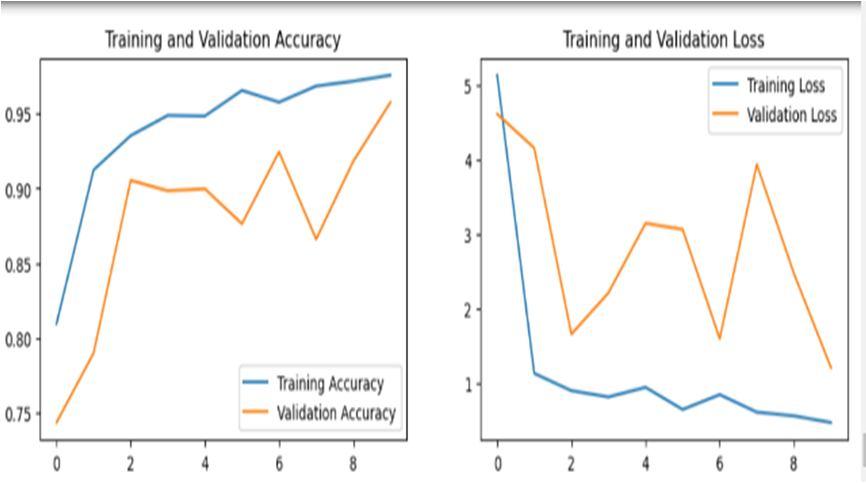
C. Epoch 20
Figure 17(A) Figure 17(B) Graphs showing accuracy and loss for 20 epochs
Figure 17(A) represents the graphs for training and validation accuracy on 20 epochs. X axis represents the epochs and the Y axis represents the accuracy percentage. The blue line represents the training accuracy and the yellow line represents the validation accuracy. It is clear from the graph that the training and validation accuracy increases as the epochs increase. Figure 17(B) represents the graph for training and validation loss. As per the graph the training loss decreases over the increasing epochs. However, the validation loss increases as the epochs increase. The accuracy on the Test Set is 96.33%.
As seen from the confusion matrix, the accuracy of the model is 96.33%. It is more than the previous models.
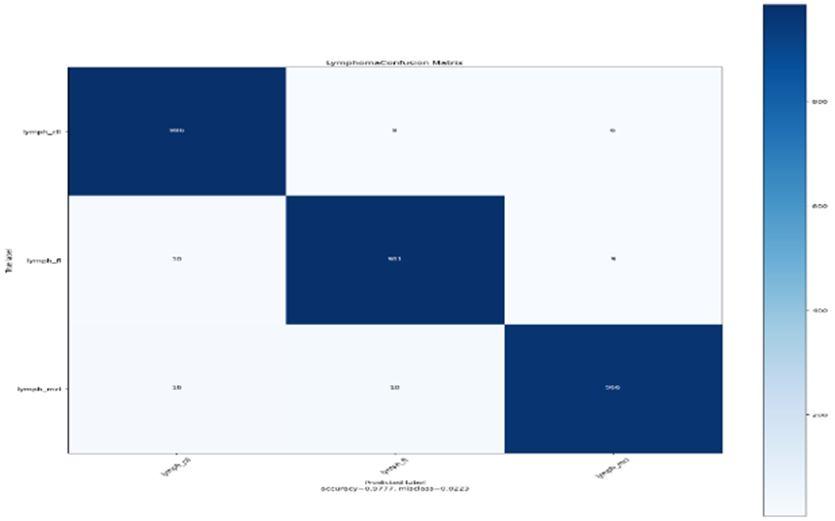
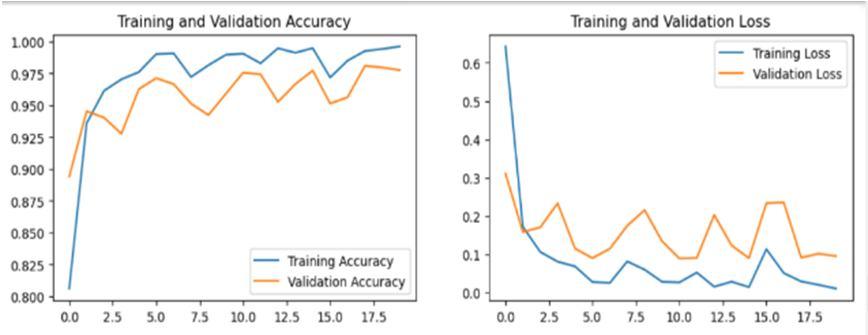
D. Epoch 30
Graphs showing accuracy and loss for 30 epochs Figure 18(A) represents the graphs for training and validation accuracy for 30 epochs. X axis represents the epochs and Y axis represents accuracy percentage. The blue line represents the training accuracy and the yellow line represents the validation accuracy. It is clear from the graph that the training and validation accuracy increases as the epochs increase. Figure 18(B) represents the training and validation loss. As per the graph the training loss decreases over the increasing epochs.
ISSN: 2321 9653; IC Value: 45.98; SJ Impact Factor: 7.538 Volume 10 Issue XI Nov 2022 Available at www.ijraset.com
Figure 18(A) Figure 18(B) Graphs showing accuracy and loss for 30 epochs
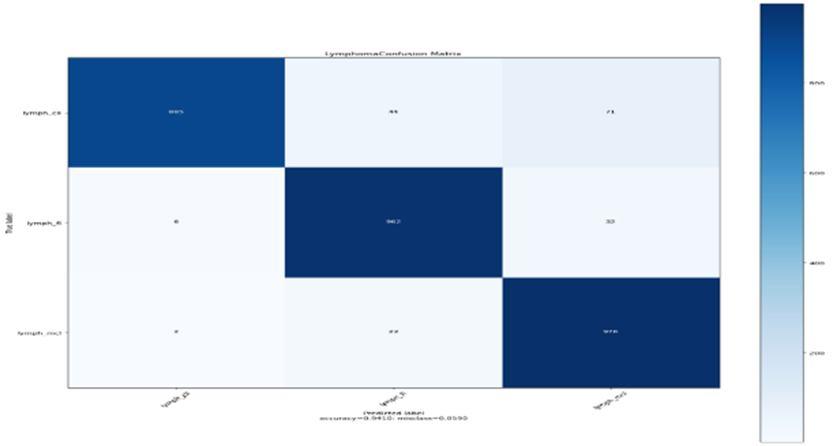
As seen from the confusion matrix, the accuracy of the model is 96.60%. It is more than the previous models.
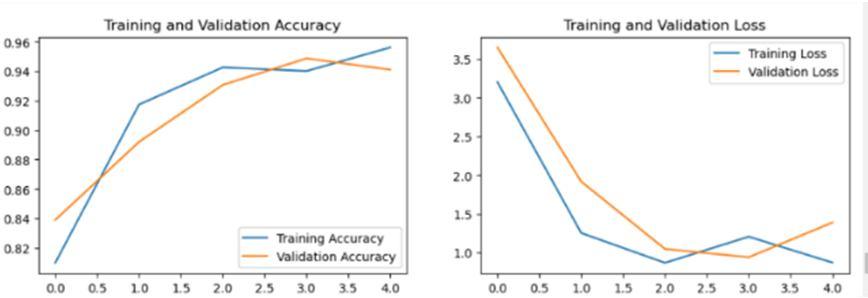
Graphs showing accuracy and loss for 30 epochs Figure 19(A) represents the graphs for training and validation accuracy for 50 epochs. X axis represents the epochs and Y axis represents accuracy percentage. The blue line represents the training accuracy and the yellow line represents the validation accuracy. It is clear from the graph that the training and validation accuracy increases as the epochs increase. Figure 19(B) represents the training and validation loss. As per the graph the training loss decreases over the increasing epochs.
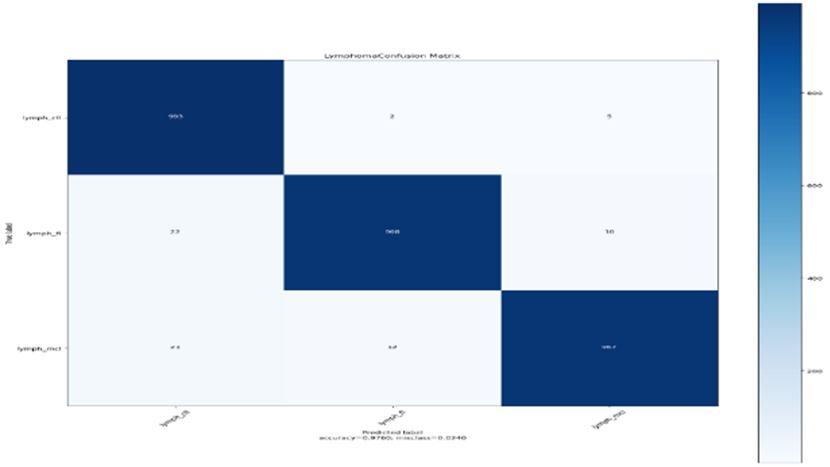
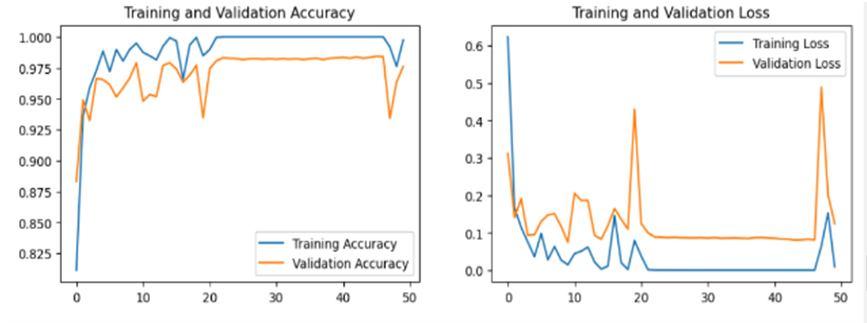
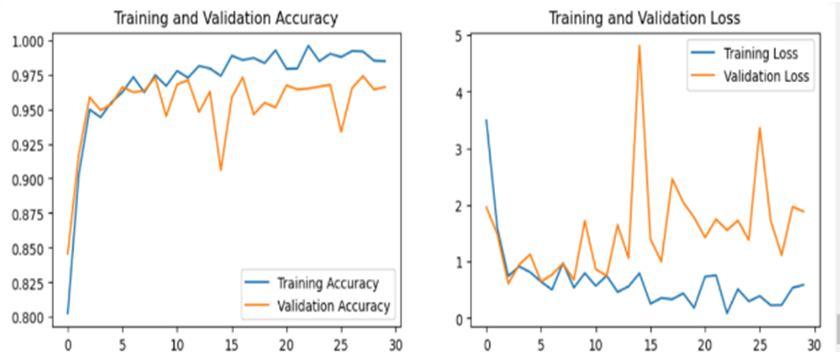
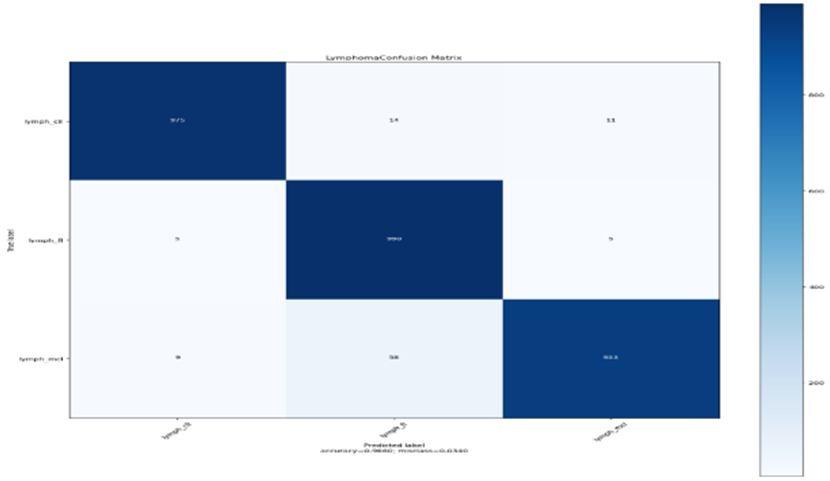
Figure 19(A) Figure 19(B) Graphs showing accuracy and loss for 50 epochs
As seen from the confusion matrix, the accuracy of the model is 97.60%. It is more than the previous models.
Number of Epochs
ISSN: 2321 9653; IC Value: 45.98; SJ Impact Factor: 7.538
Volume 10 Issue XI Nov 2022 Available at www.ijraset.com
Table 1 Comparison of results for various epochs
Accuracy Loss Validation Accuracy Validation Loss
5 Epochs 95.61 0.8707 95.61 1.387
10 Epochs 97.55 0.4644 95.73 1.2016 20 Epochs 97.61 0.9491 96.33 1.7687 30 Epochs 98.47 0.5902 96.60 1.8826 50 Epochs 99.74 0.0049 97.60 0.1240 70 Epochs 99.99 0.004 99.42 0.112
Due to the complexity of the challenge, deep learning technologies have shown to be the most effective technique for detecting spleen cancer. This research includes an automated system for splenic cancer identification from histopathological pictures that is based on deep CNN transfer learning. The results demonstrate that the DenseNet 210 deep learning architecture performed very well in both feature extraction and image categorization. The efficiency of the 5 distinct CNN models was assessed for the classification of 3 different classes of splenic cancers: CLL (chronic lymphocytic leukemia); FL (follicular lymphoma); MCL (mantle cell lymphoma), HL(Hodgkins lymphoma) and NHL(Non Hodgkins lymphoma) It received a precision and accuracy score of 99.42%. Statistics demonstrate that the DenseNet 201 architecture outperforms competing designs. DenseNet 201 is based on the idea that by making connections between the layers close to the input and the layers close to the output shorter, convolutional networks may be taught to be more deeper, more accurate, and more efficient. There are a wide range of accuracy ratings for the techniques and tools used to locate nodules, extract characteristics, and determine if the malignancy is CLL (chronic lymphocytic leukemia); FL (follicular lymphoma); MCL (mantle cell lymphoma). This cutting edge technique has the potential to save a sizable number of people who pass away annually as a consequence of a misdiagnosis or delayed diagnosis of splenic cancer.
Possible futuristic works have been discussed below:
1) Future proposals for boosting the accuracy of this model include making use of various Deep Learning techniques.
2) The lack of earlier data in the disciplines of radiography and cancer further limited the methodological possibilities. This work can be made better in the future by continually improving the model's accuracy by training it on larger and more comprehensive datasets.
3) The accuracy of feature extraction and classification would be enhanced by isolating the spleen area from the other organs in this method.
[1] Lippi, M.; Gianotti, S.; Fama, A.; Casali, M.; Barbolini, E.; Ferrari, A.; Bertolini, M. “Texture analysis and multiple instance learning for the classification of malignant lymphomas. Comput. Methods Programs Biomed”. 2020, 185, 105153.
[2] Nicola Altini, Berardino Prencipe, Giacomo Donato Cascarano, Antonio Brunetti, Gioacchino Brunetti, Vito Triggiani “Liver, kidney and spleen segmentation from CT scans and MRI with deep learning: A survey in science direct” Volume 490, 14 June 2022, Pages 30 53
[3] Zhen Yuan, Esther Puyol Antón, Haran Jogeesvaran, Nicola Smith, Baba Inusa, Andrew P. Kingl “Deep learning based quality controlled spleen assessment from ultrasound images in SCIENCE DIRECT Biomedical Signal Processing and Control” Volume 76, July 2022, 103724
[4] Meddeb, Aymen, Tabea Kossen, Keno K. Bressem, Bernd Hamm, and Sebastian N. Nagel. "Evaluation of a Deep Learning Algorithm for Automated Spleen Segmentation in Patients with Conditions Directly or Indirectly Affecting the Spleen" Tomography 7, no. 4: 950 960. (2021).
[5] Gabriel E. Humpire Mamani , Joris Bukala, Ernst T. Scholten, Mathias Prokop, Bram van Ginneken, Colin Jacobs (2020) Fully Automatic Volume Measurement of the Spleen at CT Using Deep Learning
[6] Gaidano, V.; Tenace, V.; Santoro, N.; Varvello, S.; Cignetti, A.; Prato, G.; Saglio, G.; De Rosa, G.; Geuna, M. A Clinically Applicable Approach to the Classification of B Cell Non Hodgkin Lymphomas with Flow Cytometry and Machine Learning. Cancers 2020, 12, 1684.
[7] Monica Ortenzi, Mariano Tomatis, Lucia Puca, Desiree Cianflocca, Daniela Rega, Annalisa Maroli, Ugo Elmore, Francesca Pecchini, Marco Milone, Roberta La Mendola, Erica Soligo, Simona Deidda, Domenico Spoletini, Diletta Cassini, Alessandra Aprile, Michela Mineccia, Herald Nikaj, Francesco Marchegiani, Fabio Maiello, Cristina Bombardini, Michele Zuolo, Michele Carlucci, Luca Ferraro, Armando Falato, Alberto Biondi, Roberto Persiani, Patrizia
ISSN: 2321 9653; IC Value: 45.98; SJ Impact Factor: 7.538 Volume 10 Issue XI Nov 2022 Available at www.ijraset.com
Marsanich, Daniele Fusario, Leonardo Solaini, Sara Pollesel, Gianluca Rizzo, Claudio Coco, Alberto Di Leo, Davide Cavaliere, Franco Roviello, Andrea Muratore, Domenico D’Ugo, Francesco Bianco, Paolo Pietro Bianchi, Paola De Nardi, Marco Rigamonti, Gabriele Anania, Claudio Belluco, Roberto Polastri, Salvatore Pucciarelli, Sergio Gentilli, AlessandroFerrero, Stefano Scabini, Gianandrea Baldazzi, Massimo Carlini, Angelo Restivo, Silvio Testa, Dario Parini, Giovanni Domenico De Palma, Micaela Piccoli, Riccardo Rosati, Antonino Spinelli, Paolo Delrio, Felice Borghi, Marco Guerrieri & Rossella Reddavid “Minimally invasive vs. open segmental resection of the splenic flexure for cancer: a nationwide study of the Italian Society of Surgical Oncology Colorectal Cancer Network” in Springer (SICO CNN)(2022)
[8] Qingchen Zhang, Changchuan Bai, Zhikui Chen, Peng Li,Hang Yu, Shuo Wang, He Gao( 01 April 2019) in “Deep learning models for diagnosing spleen and stomach diseases in smart Chinese medicine with cloud computing”
[9] Naina Bagrodia, MD; AnnaM. Button, MS; PhilipM. Spanheimer, MD; Mary BeldingSchmitt, MS; LoriJ. Rosenstein; James J. Mezhir, MD “Morbidity and Mortality Following Elective Splenectomy for Benign and Malignant Hematologic Conditions” in JAMA Surgery(2014)
[10] Stephen Falk ,Hans Jochen Stutte MD “Primary malignant lymphomas of the spleen: A morphologic and immunohistochemical analysis of 17 cases” Volume 66, Issue 12 15 December 1990 Pages 2612 2619
[11] Miyoshi, H.; Sato, K.; Kabeya, Y.; Yonezawa, S.; Nakano, H.; Takeuchi, Y.; Ohshima, K. “Deep learning shows the capability of high level computer aided diagnosis in malignant lymphoma.” Lab. Investig. 2020, 100, 1300 1310.
[12] Andrei Stefancu, Vlad Moisoiu, Minodora Desmirean, Stefania D. Iancu, Adrian B. Tigu, Bobe Petrushev, Ancuta Jurj, Ramona G. Cozan, Liviuta Budisan, Bogdan Fetica, Andrei Roman, Gina Dobie, Cristina Turcas, Mihnea Zdrenghea, Patric Teodorescu, Sergiu Pasca, Doina Piciu, Delia Dima, Zoltán Bálint, Nicolae Leopold, Ciprian Tomuleasa, “SERS based DNA methylation profiling allows the differential diagnosis of malignant lymphadenopathy” in Science Direct, Volume 264, 5 January 2022, 120216
[13] Nicola Altini ;Berardino Prencipe “Liver, kidney and spleen segmentation from CT scans and MRI with deep learning: A survey” https://doi.org/10.1016/j.neucom.2021.08.157
[14] Zeyad Ghaleb Al Mekhlafi , Ebrahim Mohammed Senan, Badiea Abdulkarem Mohammed, Meshari Alazmi, Abdulaziz M. Alayba, Abdulrahman Alreshidi and Mona Alshahrani “Diagnosis of Histopathological Images to Distinguish Types of Malignant Lymphomas Using Hybrid Techniques Based on Fusion Features”(2022)
[15] Sungwon Lee, Daniel C. Elton, Alexander H. Yang, Christopher Koh, David E. Kleiner, Meghan G. Lubner, Perry J. Pickhardt , Ronald M. Summers(2022) “Fully Automated and Explainable Liver Segmental Volume Ratio and Spleen Segmentation at CT for Diagnosing Cirrhosis”, Science Direct, volume 15 number 35
[16] Ms. Julie Wang; Alexander Wood; chao gao; Kayvan Najarian; Dr. Jonathan Gryak“Automated Spleen Injury Detection Using 3D Active Contours and Machine Learning” entropy 2021, 23(4), 382