11 I January 2023 https://doi.org/10.22214/ijraset.2023.48501
ISSN: 2321-9653; IC Value: 45.98; SJ Impact Factor: 7.538 Volume 11 Issue I Jan 2023- Available at www.ijraset.com


ISSN: 2321-9653; IC Value: 45.98; SJ Impact Factor: 7.538 Volume 11 Issue I Jan 2023- Available at www.ijraset.com
Department
of Electrical and Computer Engineering, Florida Agricultural and Mechanical University-Florida State University College of Engineering, Tallahassee, Florida, United States of AmericaAbstract: The colour palette of each urban metropolis reflects its cultural identity and its unique flair. For urban development and urban renewal projects, incorporating a city’s existing colour palette into a construction plan would ensure that the completed project would be in harmony with the existing colour schemes of a neighbourhood. An earlier investigation implemented Fuzzy C-Means (FCM) colour extraction to identify five dominant colours from the images of each of the twelve major cosmopolitan cities that are situated on six continents. These cities were Cairo, Cape Town, Singapore, Tokyo, Perth, Sydney, London, Madrid, Mexico City, New York City, Buenos Aires, and Lima. This current research is a follow-on investigation of the previous city colour extraction study. It applies K-Means clustering to acquire five dominant colours for each of these 12 cities. The goal of this current research is to determine if the type of clustering method implemented would impact the results of the extracted colours. This is accomplished by comparing the city colours obtained by executing the K-Means clustering technique on these 12 cities and comparing these colours with those that were obtained from the previous FCM study. Keywords: K-Means clustering, Fuzzy C-Means (FCM), colour extraction, hard clustering, soft clustering, urban metropolis, dominant colours, city colour palettes
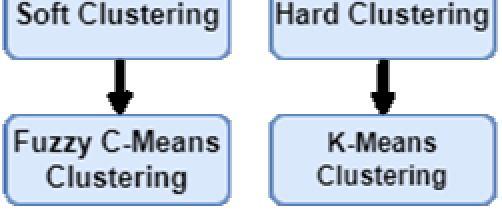
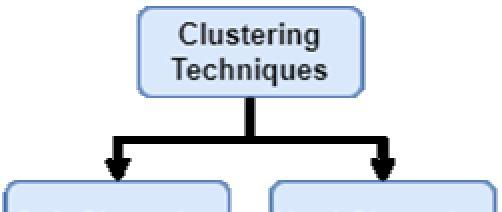
Colour extraction techniques are computer vision algorithms that identify dominant colours of a picture [1-2]. These techniques are employed in several applications, such as mobile phone app design, urban development and renewal, and colour quantization [3-7]. For mobile phone app design, colour extraction obtains dominant colours for user interfaces [3]. For urban development and urban renewal projects, incorporating extracted dominant colours of existing neighbourhoods in design plans would ensure that completed construction endeavours would be in harmony with a city’s existing colour schemes so as to preserve its cultural identity [4]. Colour extraction is also employed for colour quantization to reduce the number of colours in an image thereby reducing its file size [5-7]. Dominant colours could be extracted from images by using clustering methods. These are unsupervised machine learning algorithms that group pixels into clusters of similar colours [8-9]. Each cluster is defined by a centroid that is one of the dominant colours of an image [10]. Clustering methods are divided into soft and hard clustering techniques [11]. Soft clustering techniques, such as Fuzzy C-Means (FCM) clustering, assign each pixel a probability of being in each cluster [12]. Hard clustering methods, such as K-Means clustering, classify each pixel as belonging to only one cluster. The relationship between these clustering techniques is shown in Fig. 1.
Previous research implemented FCM clustering to extract dominant colours from publicly available images of 12 cosmopolitan cities to determine if there were similarities in their colour palettes. These locations included Cairo, Cape Town, Singapore, Tokyo, Perth, Sydney, London, Madrid, Mexico City, New York City, Buenos Aires, and Lima. The hexadecimal (hex) codes and the colour names for the five dominant colours for each of these cities were determined [4].
ISSN: 2321-9653; IC Value: 45.98; SJ Impact Factor: 7.538 Volume 11 Issue I Jan 2023- Available at www.ijraset.com
This current research is a follow-on study. It implements K-Means clustering to obtain five dominant colours from these 12 cities. It compares the colours that were obtained by implementing K-Means clustering with the colours that were previously obtained by implementing FCM clustering to determine if the type of clustering method would impact the extracted dominant colours. The remainder of this paper is organized as follows: Section 2 reviews background information on colour extraction. Section 3 describes the experimental procedure. Section 4 discusses the experimental results, and Section 5 provides the conclusions and a brief discussion of future work.
This section provides background information on the Red Green Blue (RGB) colour space, FCM clustering, and K-Means clustering.
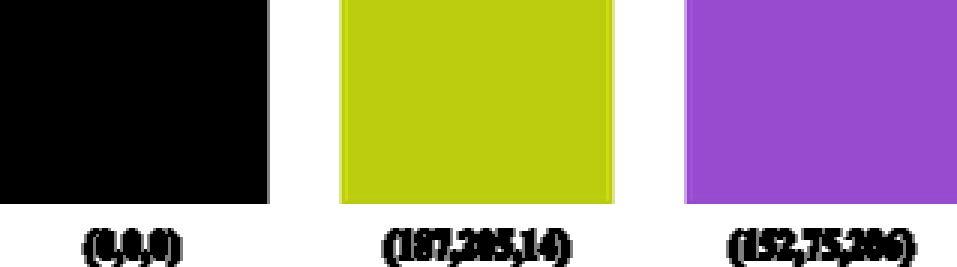
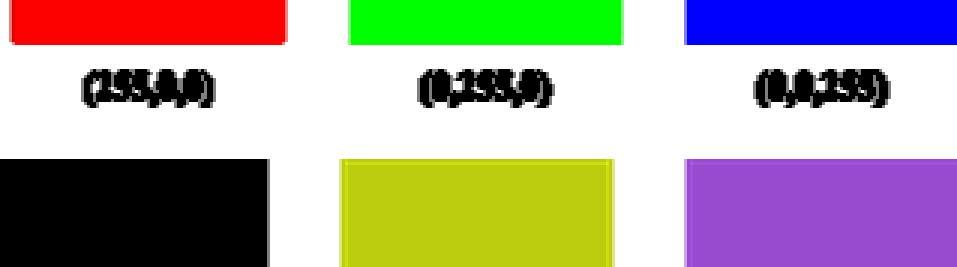
The RGB colour space is a method for specifying the colour of each pixel of an image by using a red, a green, and a blue coordinate. Intensity for each colour coordinate varies from 0 to 255 [13]. The minimum value of zero indicates that a colour is not present in a pixel. The colour black, which has coordinates of (0,0,0), does not have any red, green, or blue colours. The maximum value of 255 indicates that a pixel has the highest amount of a colour [14]. The colour white, which has coordinates of (255, 255, 255), has the maximum amount of red, green, and blue colours. Other colours are represented by using various combinations of RGB coordinate values. Fig. 2 provides examples of the representation of RGB coordinates for six colours.


The RGB colour difference formula compares two colours, and it calculates the Euclidian distance between the colour coordinates. This equation is provided as follows: (1)
where dE is the colour difference value, R1, B1, and G1 are the colour coordinate values for colour 1, and R2, B2, and G2 are the colour coordinate values for colour 2 [15]. RGB colours could also be described by using hex colour codes, which consist of a “#” symbol followed by a string of six alphanumeric characters [16-17]. Furthermore, RGB coordinates could be converted to hex codes by converting each coordinate from base 10 to base 16 [18]. The first two hex code characters correspond to the red coordinate, the second two correspond to the green coordinate, and the last two correspond to the blue coordinate [19-20]. The relationship between each part of a hex code and each part of its corresponding RGB coordinates is provided in Fig. 3.
The hex code for vivid purple, for example, is #6a0f8e, whereas the emerald colour has a hex code of #50c878 [21-22].
ISSN: 2321-9653; IC Value: 45.98; SJ Impact Factor: 7.538 Volume 11 Issue I Jan 2023- Available at www.ijraset.com
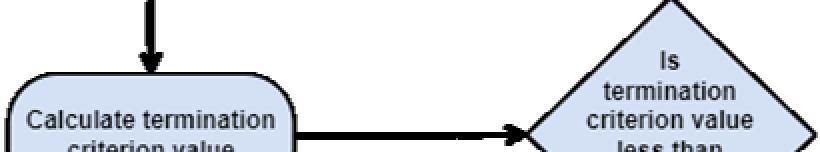
FCM clustering is a soft clustering technique that identifies dominant colours for a RGB picture. It begins by defining the input variables. They are the threshold value, fuzzifier, number of clusters, and maximum number of iterations [4]. Next, the centroids are initially set to random RGB colours, and each membership degree in the membership matrix is initialized with a random probability under the constraint that the membership degrees corresponding each pixel add up to one. Next, the cluster centroids, membership degrees, and the termination criterion value are calculated. This algorithm then determines if the termination criterion is smaller than the threshold. If not, it continues to calculate the centroids, membership degrees, and termination criterion until the termination criterion is less than the threshold. The FCM method ends, and the final centroids are outputted as the dominant colours. The FCM activity diagram is provided in Fig. 4.
Fig. 4 FCM Activity Diagram [4]


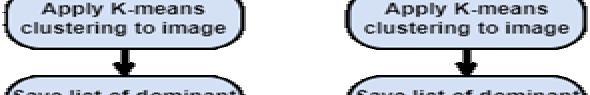
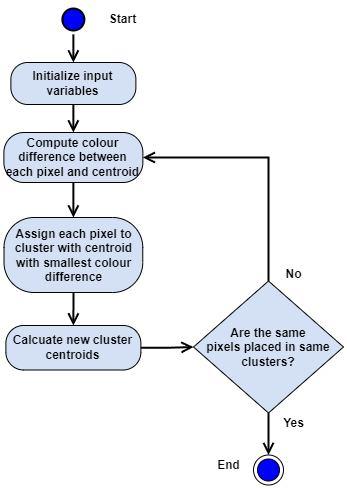
K-Means clustering is a hard clustering technique that identifies dominant colours for a RGB image. This procedure begins by defining the input variables to include the number of clusters and the maximum number of iterations. The cluster centroids are then initialized with random RGB colours. The colour difference between each pixel and centroid is then calculated [23]. Each pixel is assigned to the cluster that has the centroid with the smallest colour difference. The new centroids are then computed by using the colour coordinates of all the pixels that are assigned to each cluster. The equations for the red, green, and blue coordinates for the centroid of the first cluster are provided as follows: (2) (3) (4)
ISSN: 2321-9653; IC Value: 45.98; SJ Impact Factor: 7.538 Volume 11 Issue I Jan 2023- Available at www.ijraset.com
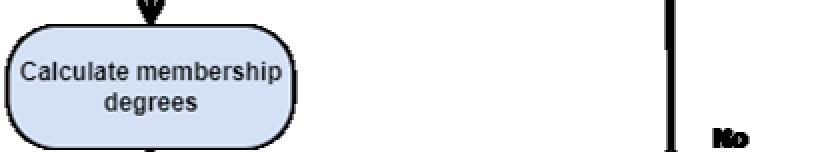
where n is the total number of pixels in the cluster, j is the current pixel, Rj is the red coordinate value for the current pixel, Gj is the green coordinate value for the current pixel, and Bj is the blue coordinate value of the current pixel. The procedure to calculate the centroid for the first cluster is then repeated to calculate the centroids for the other clusters. The K-Means clustering algorithm then checks to see if the same pixels are placed in the identical clusters. If this is not the case, this technique repeatedly calculates the colour differences, assigns the pixels to clusters, and calculates the centroids until the same pixels are placed in the identical clusters. This algorithm then terminates, and the centroids are used as the dominant colours. The KMeans clustering activity diagram is given in Fig. 5.
Fig. 5 K-Means Clustering Activity Diagram

A Python program to implement K-Means clustering was written to extract dominant colours for each of the 12 cities that were used in the earlier FCM colour extraction study. The results were displayed as hex codes and colour names The K-Means clustering colour extraction results were then compared with the previous FCM colour extraction results for these cities to determine if the type of clustering method executed would impact the extracted dominant colours [4].


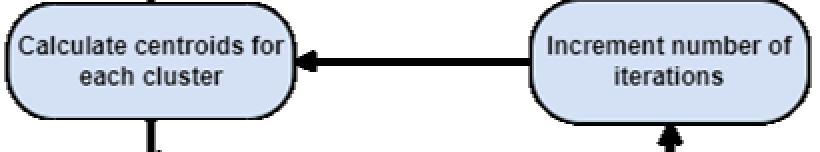
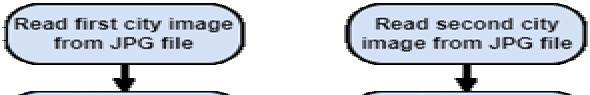
The K-Means clustering computer program began by loading each of the two RGB images for a city from their Joint Photographic Experts Group (JPG) files. The dimensions of all these JPGs were set to 1080x1080-pixel to ensure that the dimensions of the pictures were consistent. Next, K-Means clustering, with 5 clusters and a maximum number of iterations of 200, was applied to each picture to obtain the 5 dominant colours for each image. These input variables for this investigation were identical to the ones that were used in the earlier FCM colour extraction study so that the results for the colour extraction techniques could be compared [4]. The dominant colours for each picture were each saved to a list. A combined list was formed by appending together the dominant colour lists for each picture. K-Means clustering was then applied to this combined list to obtain the 5 overall dominant colours, outputted as hex codes, for a city. The workflow for the K-Means clustering program is provided in Fig. 6. The hex codes for the extracted colours were then entered into the color-name.com website to obtain the corresponding name for each colour [24]. The colour extraction results, displayed as hex codes along with their colour names, were then tabulated
Fig. 6 K-Means Clustering Colour Extraction Program Workflow

ISSN: 2321-9653; IC Value: 45.98; SJ Impact Factor: 7.538 Volume 11 Issue I Jan 2023- Available at www.ijraset.com
The K-Means clustering results were compared with the FCM results from the previous study by comparing the colour names and the hexadecimal codes for the five dominant colours that were obtained by using each colour extraction method [4]. The results for the FCM and K-Means clustering colour extraction techniques are provided in Table I.
TABLEI
COLOUR EXTRACTION RESULTS TABLE
Contine nt City FCM [4]
Hex Codes Colours Hex Codes Colours
K-Means Clustering Number of Colours in Common
Africa Cairo #948971 #2a2418 #5f5038 #d6c0ac #52b9d3
Cinereous Raisin Black Olive Drab Camouflage Dark Vanilla Sea Serpent
#92887 2 #61523 a #2d271 a #d5c4b 0 #51bad 5
Cinereous Umber Pine Tree Dark Vanilla Sea Serpent
3
Cape Town #757674 #3b3d36 #c5cdd1 #86aed9 #0b83e4
Asia Singapore #7e8d96 #52606a #262d2c #d5dee4 #8bb3d8
Sonic Silver Black Olive Chinese Silver Light Cobalt Blue Blue Cola
Roman Silver Black Coral Charleston Green Gainsboro Light Cobalt Blue
Tokyo #6b6c6e #46474b #939394 #bdbdbb #1d1f23
Dim Grey Outer Space Spanish Grey Grey (X11) Dark Jungle Green
Australia Perth #323537 #787871 #cfd8e0 #86b2db
Jet Sonic Silver Columbia Blue Light Cobalt Blue
#3f423a #c6cdd1 #7b797 7 #8aaac7 #0f87e7
#262d2 b #d4dee4 #74828 b #4d5a6 3 #9aacbb
#1f2125 #bdbdb b #6c6d6e #48484 b #93949 4
#353a3c #cfd8e0 #807f77 #8ab3d
Black Olive Chinese Silver Sonic Silver Ceil Blue Cola
Charleston Green Gainsboro Slate Grey Independence Pewter Blue
4
Raisin Black Grey (X11) Dark Silver Outer Space Spanish Grey
2
3
Onyx Columbia Blue Grey (HTML/CSS
3
ISSN: 2321-9653; IC Value: 45.98; SJ Impact Factor: 7.538 Volume 11 Issue I Jan 2023- Available at www.ijraset.com
#467bc5 Cyan-Blue Azure 9 #457cc7 Grey) Light Cobalt Blue Cyan-Blue Azure
Sydney #a4c3db #727779 #24303d #727e95 #145174
Pale Cerulean Sonic Silver Gunmetal Slate Grey Dark Cerulean
#747e8 9 #32556 e #8fb3d3 #bdcbd 5 #25323 d
Slate Grey Police Blue Dark Sky Blue Lavender Grey Gunmetal
2
Europe London #22201d #62615a #8e9391 #a7b7b8 #bfd2e8
Raisin Black Granite Grey Philippine Grey Cadet Blue (Crayola) Beau Blue
Madrid #403327 #8e796b #e4d6c6 #bca797 #5a93ed
Jacko Bean Shadow Bone Khaki (HTML/CSS) United Nations Blue
#65645 c #b7c7d 1 #17151 2 #3a393 4 #8f9491
#a18d7f #e4d5c6 #68554 5 #372b2 1 #5b93ea
Granite Grey Pastel Blue Chinese Black Black Olive Philippine Grey
2
North America Mexico City #5b4840 #9f7965 #bca89e #201a18 #e6e3e1
Olive Drab Camouflage Blast-Off Bronze Tuscany Eerie Black Platinum
New York City #e0dde5 #484549 #a59fa4 #1c1b20 #746f71
Platinum Outer Space Quick Silver Eerie Black Dark Silver
South America Buenos Aires #c8b39f #191513 Khaki (HTML/CSS)
#32262 2 #715a5 0 #bd785 a #b6a29 8 #dfdbd9
#dedbe3 #1e1d2 2 #a59fa3 #49464 a #74707 2
Cinereous Bone Quincy Bistre United Nations Blue
Temptress Boy Red Deer Tuscany Gainsboro
2
Gainsboro Raisin Black Quick Silver Outer Space Nickel
1
2
#c5b19f #eaecee Khaki (HTML/CSS) 5
#86786d #4b433d #ebeef0
Lima #5b5555 #a2a1a6 #847874 #2c2c2d #dcdad8
Black Chocolate Shadow Dark Puce Bright Grey
Davy's Grey Quick Silver Grey (HTML/CSS Grey) Charleston Green Gainsboro
ISSN: 2321-9653; IC Value: 45.98; SJ Impact Factor: 7.538 Volume 11 Issue I Jan 2023- Available at www.ijraset.com
#4e443e #88786 c #1b181 5
#80736 d #dbd9d 6 #47454 6 #a6a4a6 #21262 7
Bright Grey Dark Puce Shadow Black Chocolate
Sonic Silver Light Silver Outer Space Quick Silver Dark Gunmetal
1
For the images of Cairo, the colour extraction studies showed that there were three dominant colours in common. They were cinerous, dark vanilla, and sea serpent. Even though the colour names for the two other colours were different, the appearances of these colours were similar. The olive drab camouflage colour from the FCM results was similar to the umber colour from the KMeans clustering results, while the raisin black colour from the FCM results was similar to the pine tree colour from the K-Means clustering results.
For Cape Town, there were four dominant colours in common to include sonic silver, black olive, Chinese silver, and blue cola. Despite the colour name for the fifth colour being different, the light cobalt blue colour from the FCM results was comparable to the ceil colour from the K-Means clustering results.
For the images of Singapore, two dominant colours were the same. These colours were Charleston green and Gainsboro. Even though the colour names for the three other colours were different, they were similar in appearance. The roman silver, black coral, and light cobalt blue colours for the FCM results corresponded to the slate grey, independence, and pewter blue colours for the KMeans clustering experiments.
For Tokyo, three dominant colours were the same to include outer space, Spanish grey, and grey (X11). Even though the colour names for the two other colours were dissimilar, their appearances were comparable. The dim grey colour for the FCM experiments resembled the dark silver colour for the K-Means clustering experiments, and the dark jungle green colour was similar to the raisin black colour.
For Perth, both clustering techniques resulted in three of the same dominant colours to include Colombia blue, light cobalt blue, and cyan-blue azure. For the two other sets of colours, the Jet colour for the FCM results was similar to the onyx colour for the K-Means clustering results, while sonic silver resembled HTML/CSS grey
For the pictures of Sydney, there were two dominant colours in common. These colours were gunmetal and slate grey. Concerning the three other sets of colours, the pale cerulean, sonic silver, and dark cerulean colours for the FCM technique resembled the dark sky blue, lavender grey, and police blue colours for the K-Means clustering method
For London, two dominant colours were the same: granite grey and Philippine grey. Although the names for the three other colours were different, the appearances of these colours were alike. The raisin black, cadet blue, and beau blue colours for the FCM algorithm were similar to the Chinese black, black olive, and pastel blue colours for the K-Means clustering technique.
For the Madrid images, two dominant colours were the same: bone and United Nations blue. Although the names for the three other colours were different, these colours were comparable. Jacko bean, shadow, and khaki from the FCM results corresponded to bistre, Quincy, and cinereous from the K-Means clustering results.
For Mexico City, both colour extraction techniques identified the Tuscany colour. Despite the names for the four other colours being different, these colours were similar. The olive drab camouflage, blast-off bronze, eerie black, and platinum colours for the FCM results corresponded to the boy red, deer, temptress, and Gainsboro colours for the K-Means clustering results.
For New York City images, the colour extraction studies showed that there were two of the same dominant colours to include outer space and quick silver. Even though the names of the other colours were different, the platinum, eerie black, and dark silver colours from the FCM method corresponded to the Gainsboro, raisin black, and nickel colours from the K-Means clustering algorithm.
ISSN: 2321-9653; IC Value: 45.98; SJ Impact Factor: 7.538 Volume 11 Issue I Jan 2023- Available at www.ijraset.com
For Buenos Aires, FCM and K-Means clustering resulted in the same five dominant colours. They were khaki, black chocolate, shadow, dark puce, and bright grey
For the Lima results, both colour extraction methods identified the quick silver colour. Although the colour names for the four other colours were different, their appearances were similar. The Davy’s grey, grey (HTML/CSS grey), Charleston green, and Gainsboro colours for the FCM results corresponded the outer space, sonic silver, dark gunmetal, and light silver colours for the K-Means clustering results.
This colour extraction study also showed that each city had at least one colour in common when FCM and K-Means clustering were applied to the city images. Two cities had one colour in common, five cities had two colours in common, and three cities had three colours in common. One city had four colours that were the same, while one city had all five colours that were identical. This research showed that the dominant colours for these 12 cities obtained by implementing FCM and K-Means clustering were comparable to each other. Hence, this analysis showed that either of these colour extraction methods could be used to generate city colour palettes. The colour extraction frequency table is provided in Table II.
TABLEIII
Number of Colours in Common Frequency 1 2 2 5 3 3 4 1 5 1
This follow-on research implemented K-Means clustering to identify dominant colours for 12 international cities. These colours were compared with the dominant colours that were obtained in a previous study that implemented FCM clustering to extract dominant colours for these locations [4]. Mexico City and Lima had one colour that was the same for both the FCM and K-Means clustering results. They were the cities with the fewest number of colours that were the same for both techniques. Although the colour names for the four other colours were different, the appearances of these colours were similar. Buenos Aires, on the other hand, had all five dominant colours that were the same when FCM and K-Means clustering were applied to its cityscape images. It was the city with the highest number of colours that were the same. This study also showed that the FCM and K-Means clustering colour extraction techniques successfully extracted dominant colours from photographs of cities, and the extracted colours were consistent with each other. Because of this reason, either of these techniques could be employed to perform colour extraction successfully so as to obtain colour palettes for cities. Future research could include applying other types of colour extraction techniques, such as hierarchical cluster analysis and gaussian mixture models, to extract colours from these cityscape images. The colours from this future study could be compared with the results of this current study.
A hearty thank you to the SMART Scholarship program for their financial support with this project
[1] “Color Palette Extractor.” MDIGI.tools. https://mdigi.tools/color-extractor/ (accessed Dec. 21, 2022).
[2] R. Golemanova. “What’s in a color? The Basics About Image Recognition Color Extraction.” Imagga.com. https://imagga.com/blog/whats-color-basicsimage-recognition-color-extraction/ (accessed Dec. 21, 2022).
[3] V. Valkov. “Color palette extraction with K-Means clustering | Machine Learning from Scratch (Part IV).” Curiousily.com. https://curiousily.com/posts/colorpalette-extraction-with-k-means-clustering/ (accessed Dec. 29, 2022).
[4] J. Jermyn, "A Comparison of Extracted Dominant Colours of Twelve Cosmopolitan Cities," in International Journal for Research in Applied Science and Engineering Technology (IJRASET), vol. 10, no. 3, pp. 1569-1582, 10.22214/ijraset.2022.40934.
[5] M. E. Celebi, “Improving the Performance of K-Means for Color Quantization,” in Image and Vision Computing, vol. 29, no. 4, 2011, pp. 260-271, doi: 10.1016/j.imavis.2010.10.002.
ISSN: 2321-9653; IC Value: 45.98; SJ Impact Factor: 7.538 Volume 11 Issue I Jan 2023- Available at www.ijraset.com
[6] “Color Quantization Using K-Means.” Scikit-learn.org. https://scikit-learn.org/stable/auto_examples/cluster/plot_color_quantization.html (accessed Dec. 29, 2022).
[7] E. Simo. “Reduce Image Sizes with Color Quantization.” Blog.filestack.com. https://blog.filestack.com/tutorials/color-quantization/ (accessed Jan 1, 2023).
[8] Y. Chang and N. Mukai, "Color Feature Based Dominant Color Extraction," in IEEE Access, vol. 10, pp. 93055-93061, 2022, doi: 10.1109/ACCESS.2022.3202632.
[9] Y. Hamasuna and Y. Endo, "On Kernelized Sequential Hard Clustering," 2016 Joint 8th International Conference on Soft Computing and Intelligent Systems (SCIS) and 17th International Symposium on Advanced Intelligent Systems (ISIS), 2016, pp. 416-419, doi: 10.1109/SCIS-ISIS.2016.0094.
[10] V. A. Blancada. “Color Palettes Using K-Means Clustering.” Victorangeloblancada.github.io. https://victorangeloblancada.github.io/blog/2019/10/01/colorpalette-clustering.html (accessed Dec. 28, 2022).
[11] J. Petrus, Ermatita and Sukemi, "Soft and Hard Clustering for Abstract Scientific Paper in Indonesian," 2019 International Conference on Informatics, Multimedia, Cyber and Information System (ICIMCIS), 2019, pp. 131-136, doi: 10.1109/ICIMCIS48181.2019.8985231.
[12] V. Maheshwari. “Clustering Algorithms.” Medium.com. https://medium.datadriveninvestor.com/clustering-algorithms-9fd35f34caa3 (accessed Dec. 22, 2022).
[13] “What is the RGB color space?” Baslerweb.com. https://www.baslerweb.com/en/sales-support/knowledge-base/frequently-asked-questions/what-is-the-rgbcolor-space/15179/ (accessed Dec. 24, 2022).
[14] D. Alscher. “RGB vs CMYK: Why the Difference Makes a Difference.” G2.com. https://www.g2.com/articles/rgb-vs-cmyk (accessed Dec. 24, 2022).
[15] P. Antoniadis. “How to Compute the Similarity of Colours.” Baeldung.com. https://www.baeldung.com/cs/compute-similarity-of-colours (accessed Dec. 25, 2022).
[16] W. M. Albritton. “RGB Hexadecimal Color Codes.” Hawaii.edu. https://www2.hawaii.edu/~walbritt/dmed120/examples/rgb.htm (accessed Dec. 28, 2022).
[17] N. K. Kottayil. “Color Hex Code.” Techopedia.com. https://www.techopedia.com/definition/29788/color-hex-code (accessed Dec. 28, 2022).
[18] “How to Convert RGB to Hex Color.” Rapidtables.com. https://www.rapidtables.com/convert/color/how-rgb-to-hex.html (accessed Dec. 28, 2022).
[19] B. Gremillion. “Hex Color – The Code Side Of Color.” https://www.smashingmagazine.com/2012/10/the-code-side-of-color/ (accessed Dec. 28, 2022).
[20] “Web Colors.” Stuyhsdesign.wordpress.com. https://stuyhsdesign.wordpress.com/basic-html/web-colors/ / (accessed Dec. 28, 2022).
[21] “Vivid Purple Color.” Color-name.com. https://www.color-name.com/vivid-purple.color (accessed Dec. 29, 2022).
[22] “Emerald Color.” Color-name.com. https://www.color-name.com/emerald.color (accessed Dec. 29, 2022).
[23] U. Baid, S. Talbar, and S. Talbar, “Comparative Study of K-Means, Gaussian Mixture Model, Fuzzy C-means Algorithms for Brain Tumor Segmentation,” Advances in Intelligent Systems Research, vol. 137, pp. 592-597, 2017.
[24] “Find Your Color.” Color-name.com. https://www.color-name.com/ (accessed Dec. 28, 2022).