10 XI November 2022 https://doi.org/10.22214/ijraset.2022.47297
ISSN: 2321 9653; IC Value: 45.98; SJ Impact Factor: 7.538 Volume 10 Issue XI Nov 2022 Available at www.ijraset.com
ISSN: 2321 9653; IC Value: 45.98; SJ Impact Factor: 7.538 Volume 10 Issue XI Nov 2022 Available at www.ijraset.com
1, 2
 Deptt.of Computer Science & Engineering, R.D. Engineering College, Ghaziabad, India

Abstract: The Parabolic Concentrator (CPC) is a uniform photovoltaic thermal (PVT) compound linked to solar photos (N) of water collectors called PVT CPC Active Solar Filtration System Analysis. New Delhi Analysis is done for a solar filter system for a given particle size under weather conditions. We assess efficiency, system productivity, and life cycle cost analysis. The Thermal Model Life cycle cost efficiency (LCCE), designed for LCCE analysis, is considered the only and double doubled effective PVT-CPC system for filtering solar energy recovery time. In this work, we need to analyze the appropriate points of the collector and extract the bulk of the system. Tests were performed on dual solar and dual inclined PVT CPC operating systems with a single basin size and a water depth of 0.14 m, with yield on yearly basis, factor of energy payback, and efficiency of life cycle cost conversion analysis of 5.0%, 12.63%. Moreover, 22.21% is two times higher than the solo inclined system. In addition, the water return, one PVT CPC, and two turns have been found to have a recovery time (EPT) with an interest rate of 5%. The solar filter system is 10.89% and 17.99% higher than the solo inclined photovoltaic thermal compound parabolic concentrator activated solar filter system, respectively. The above analysis concluded, we can confirm that the two bends are better than the active PVT CPC system for solar filtering, which is the only inclination of the depth of 0.14 m in water based on daily based analysis. If depth of water 0.14 m is more significant, for basin size provided the performance of one inline is improved and is better than curved solar powered filtering systems. The upgraded system lasts longer and can meet potable water and DC electricity on sunny commercial days.
The solar distillation system in the remote area is the best choice to overcome and overcome the drinking water supply crisis economically, it does not create several adverse outcome on the surroundings, it is simple to keep up, with even for the period of the day, it provides D.C power supply, it is really simple and ease to design and manufacture. This is a role in the response circle that is differing from hydrological cycle or else, it is called a scanned view of hydrological cycle. Through a study of our literature, I have found that many researchers in solar distillation are researching active solar filtration systems there. Roy and Tiwari (1993) were the first to theoretically explore the forced mode to study solar energy and compare their results on the traditional solar distiller system and got a yield of 24% higher per day. For the same duration, Jackie et al. (19 Made 3), For the first time, researched active solar distillation studies in natural convection mode and compared his results still with conventional solar and found that the yield in natural convection mode increased by 33%. Tiwari and Dheeman (1991) researched and tested active solar filtration systems and provided still system models, and verified them with experimental results with a solar collector. 100% increases, 12% more thermal energy. Lawrence and Tiwari (1990) take an enormous breakthrough in the solar distiller system; with the theoretically results, they can develop an experiential relationship to the coefficient of internal heat transfer. Hamadou and Abdelatif (2014) studied solar because the cost is a significant factor in any research; both types of research can develop the proper design in the solar filtration system, due to which cost optimization and improved heat transfer to circulating water.
Kumar and Tiwari (1998) found that those who obtained the system for profit connected an 8 m2 collector2 to a solar distillation system, thereby minimizing thermal losses. However, after research, he also pointed out that there is a limit to this area. If there is a more significant increase in area, the heat storage capacity is larger for the same water depth, and as a result, the average thermal capacity and daily production decrease.
ISSN: 2321 9653; IC Value: 45.98; SJ Impact Factor: 7.538 Volume 10 Issue XI Nov 2022 Available at www.ijraset.com
Tris et al. (1998) conducted experimental experiments on two flat plate collectors, and the results obtained are still comparable to conventional solar and give 100% average increase results. Badran and Al Tahinesh, (2005) conducted their research and concluded that as the depth increases, the active solar productivity decreases, but increasing the solar flux increases this result. Tripathi and Tiwari (2005) researched solar distillation differently, where they change the depth of the basin water and find its effect on internal heat and mass transfer. The effect on heat transfer varies by changing the depth of convection water. Sinha et al. (1994) demonstrate their research on distiller units using hot water instead of cold water, and afrt doing this research they gave conclusion on annual maintenance value of the system using hot water will increase, but the price of hot water is much lower than that of filtered distillate Kumar and Sinha (1996) demonstrated their work with help of cylindrical parabolic collector connected to a double inclined solar distillation system and obtained their results and compared their results with a flat plate collector and reported a higher yield than the flat collector. Lourdes et al. (2002) performed breakthrough research. They conducted a comparative study of the solar connected to the solar pond, FPC, emptied tube collector, compound parabolic collector, and parabolic truffle collector for direct vapor production (DSG), and then he provided it. The conclusion is that the direct steam generation method is the best technology for the desalination of sea water.
Yusuf H. Juriget et al. (2004) research renewable types of solar, and after conclusion their research give the result that the water lays affects the solar ray and the first layer of the condensing cover reduces the productivity the entire second layer that releases water. He was followed by Tiwari et al. completed their research on solar using different parameters like basin type flat plate collector, evacuated tube collector (ETC), ETC pipe, this research provide gross thermal efficiency of 13.15, 17.56, 17.21 and 18.26% respectively. They determined that the average external efficiency ranges from 0.59 to 1.82%. Abdel Rehim and Leschen (2007) conducted experiments on the sun with the help of a heat exchanger and tracking concentration and found that the result was 18% more productive than the traditional solar still system. Increase.
E1 Sebai et al. (2009) demonstrated their research. Theoretically, they used sand as sensitive storage material, developed results with this system in conjunction with a single slope distillation system, and concluded that 23% higher productivity if we use the storage system daily. Compared to a non storage system Arslan (2012) researched closed loop active solar stills of various sizes and concluded that the spherical shape box provides the total daily capacity of all shapes. Taghgei et al. (2014) concluded in their research the effect of water depth needs to be more significant for the practical use of the solar. Kern and Russell (1978) took the most significant break in their research work, and they initially developed photovoltaic thermal and said that when water or air passes through the photovoltaic module, they are removed from the module, and this causes the temperature module to be lower and the power efficiency increases due to this phase down in temperature. Hendry (1979) developed his research work theoretically and theoretically developing a prototype for PVT distillation systems. Garg and Officer (1999), they research on compound parabolic concentrator with PVT collector which improves electrical output. Guang et al. (2012), in their research study, built a system that uses PVT CPC collectors, and after research, they concluded that due to that increases the efficiency of PV module.
Kumar and Tiwari, developed flat plate collector in research and the result is that the solar system is activated. By achieving yields 3.49 times higher previous system, they estimated the energy payback time is amid 3.89 and 23.99 years. Singh et al. (2011) enhance the work of Kumar and Tiwari in their research, experimentally on double slope. Etavil and Omara (2014) research on solar distiller, in which they used data from PVT and flat plate collector and calculated the results and compared their results with conservative solar and found that production increased from 50.9% to 147.9%. In his research, Kallis et al. (2014) developed a system in which he used the balance of multi impact distillers, PVT solar inductors, absorption retailers, storage tanks, auxiliary heaters, and plant equipment, due to which it is used for multi generation systems. Tiwari et al. (2015) and Singh et al. (2016) developed the solo inclined active solar distiller with PVT CPC, and decided that the thermal efficiency obtained by this system is lower than that of Kumar and Tiwari. The proposed system (2010) and Singh et al. (2011) concluded that the system had good exhaust and overall thermal capacity. Sayeedi et al. found 0.044 Kg /s the optimal mass flow rate. To date, many researchers have researched integrated solar. Tripathi and others participated. (2016) provided an equation of the relationships between PVT CPC water collectors and their shelters, which were somewhat sheltered during their study on the N alike chain connection, although the researcher has not done much analysis on this type of pairing system with basin type There are two significant differences amid the previous researchers and proposed. The prime difference is that the beam intensity connected to the photovoltaic thermal compound parabolic concentrator’s receiver surface with the help of a photovoltaic thermal FPC. The water depth is second difference and proper marking and mass discharge of the flat plate. The calculations are made for different parameters: exergoeconomonic parameters, environeconomic parameters, energy matrix, productivity, and different capacities. But no such kind of literature is available in matrices analysis of N PVT CPC active for solo and dual inclined distiller.
ISSN: 2321 9653; IC Value: 45.98; SJ Impact Factor: 7.538
Volume 10 Issue XI Nov 2022 Available at www.ijraset.com
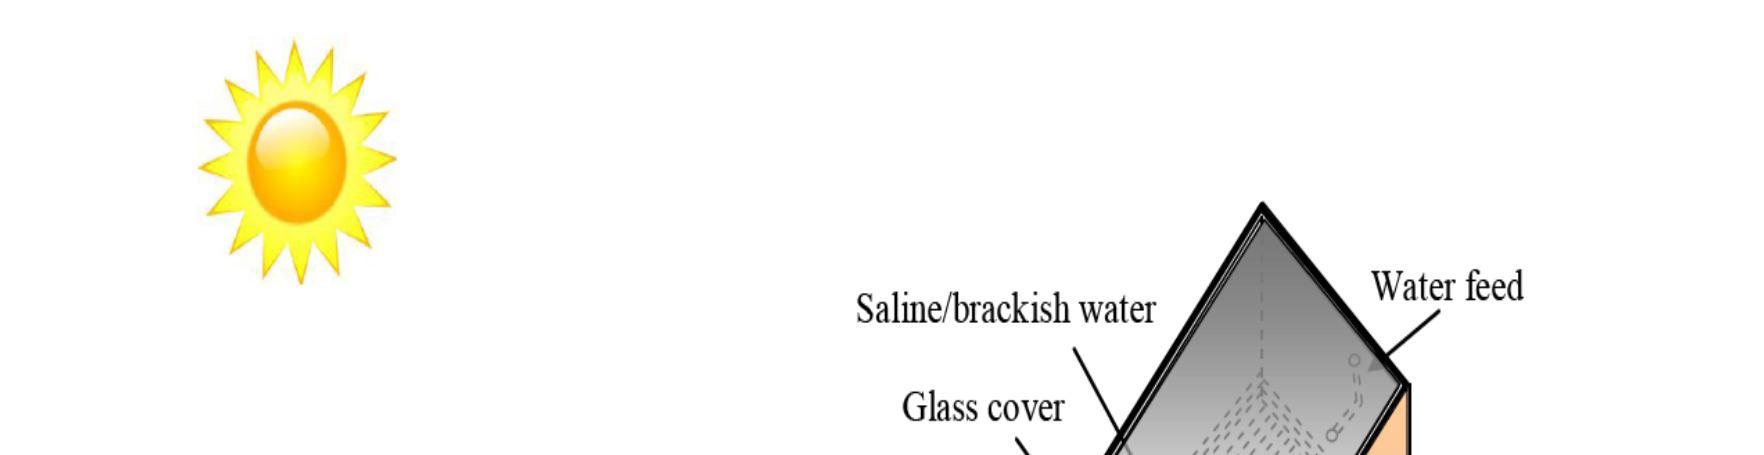
Solo inclined active solar still using CPC basin type as shown in Fig. 3.1 is analyzed. Table 3.1 shows the system specifications. Table 3.2 shows the mean velocity of each month in year. Partly covered PVT CPC is 0.25 m × 1 m kept below the collector because the minimum temperature of water there is shallow (Chow et al. 2006). The collector is mounted in series that means second inlet is joint first the outlet, the 3rd inlet is connected to the 2nd outlet, and this arrangement continues until the plate. Our focus is on raising Basin's water temperature and the chain connection arrangement for it being the best; we can get more distilled by raising the temperature of the basin. This arrangement in which collectors are connected in such a way is called as series connection and outlet of compound parabolic concentrator is connected to basin. Now we need some supply source to operate this system, for which a pump is applicable, which acts as medium to feed basin and collectors. Solar basin is connected to inlet of pump and the first PVT CPC water collector inlet to exit the pump, but the pump needs to be powered and powered by a DC motor. It is connected with help of pipes. In a box system made of aluminum to capture absorption, for heat reduction, the top box 0.1m thickness insulation is made of wool insulation thickness 0.004 m parabolic shaped CPC collector aluminum coating. There are basically two fields used in this system. The area of aperture and receiver is half of aperture area. With the help of a parabolic surface, the radiation beam is reflected towards the receiver surface.
The collectors PVT CPC with 30° inclined to horizontal to get maximum radiation. The pump is connected to motor which consumes power generated by PVT. The surrounding water PVT is get heat through the convection mode through the pipes connected.
The 2 m × 1 m basin size is connected to a solo inclined active solar distiller is made of reinforced plastic and inclined at 15° the condensing cover, with the help of putty to close the upper system properly. To absorbed maximum heat the basin box wall is coated with black paint. The radiation energy is flows through reflection, absorption transmit with help of glass cover on top surface.
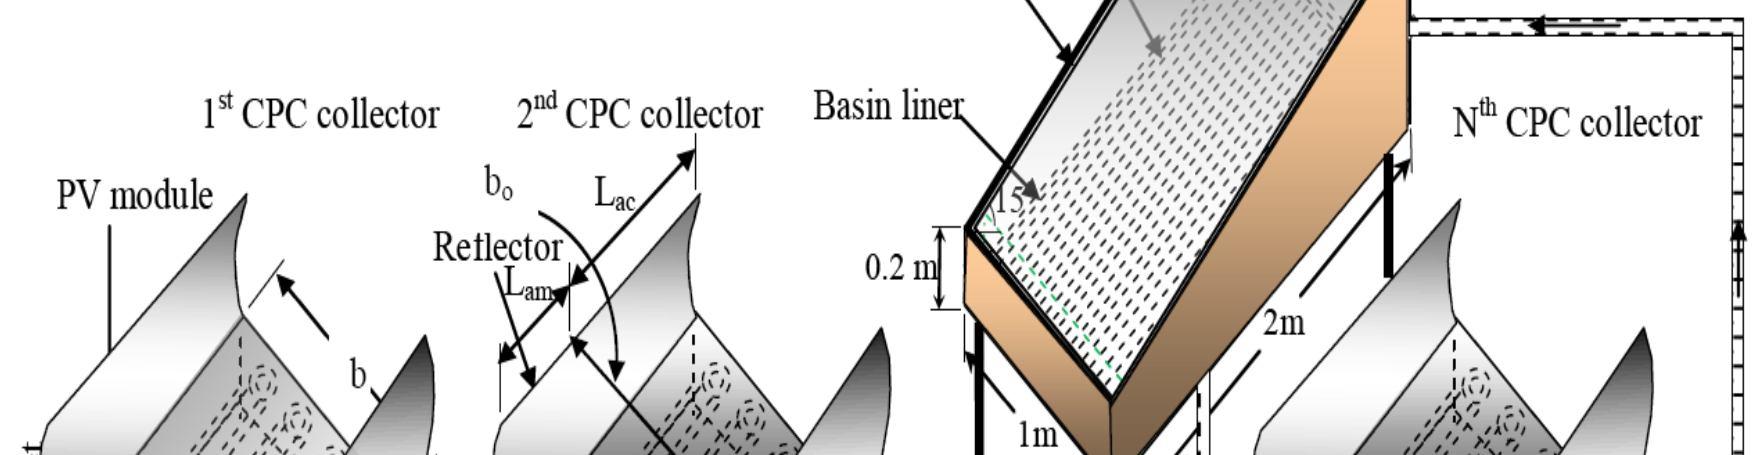
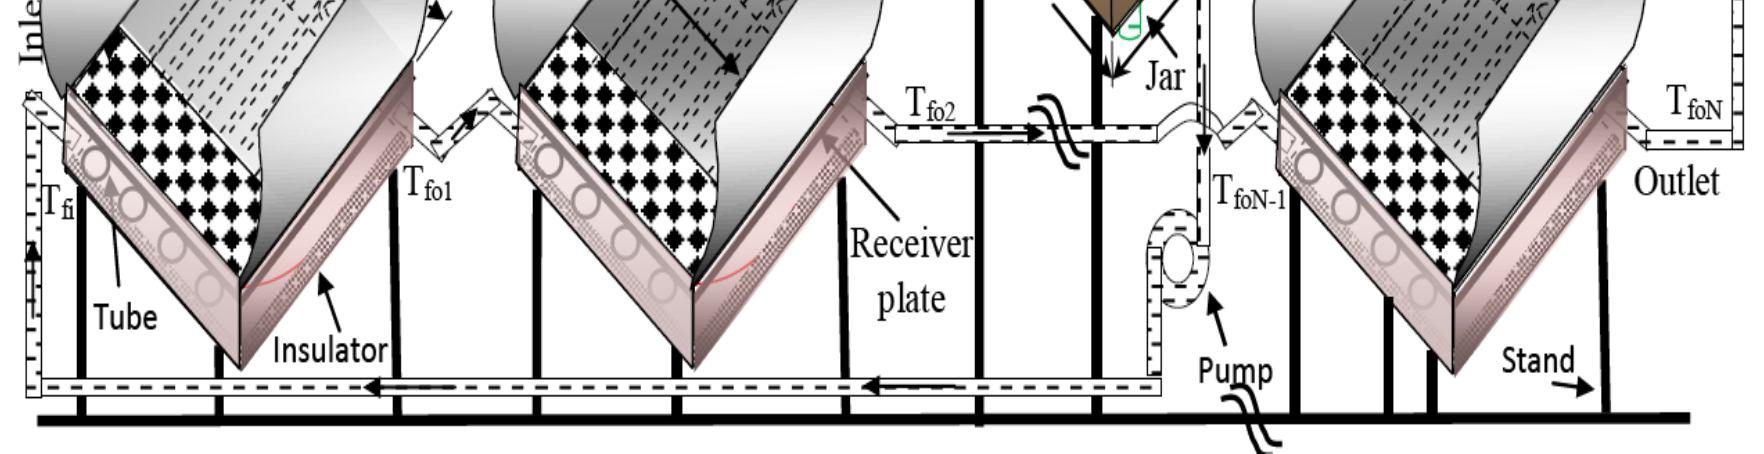
Fig. 3.1 Solo inclined PVT CPC active solar filtration system
ISSN: 2321 9653; IC Value: 45.98; SJ Impact Factor: 7.538
Volume 10 Issue XI Nov 2022 Available at www.ijraset.com
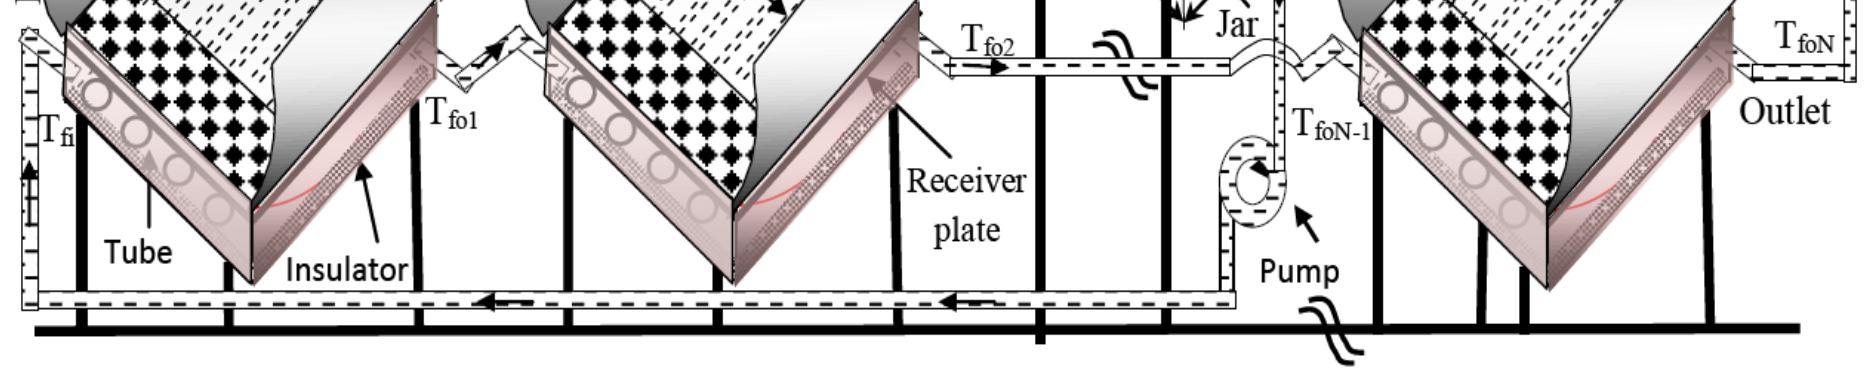
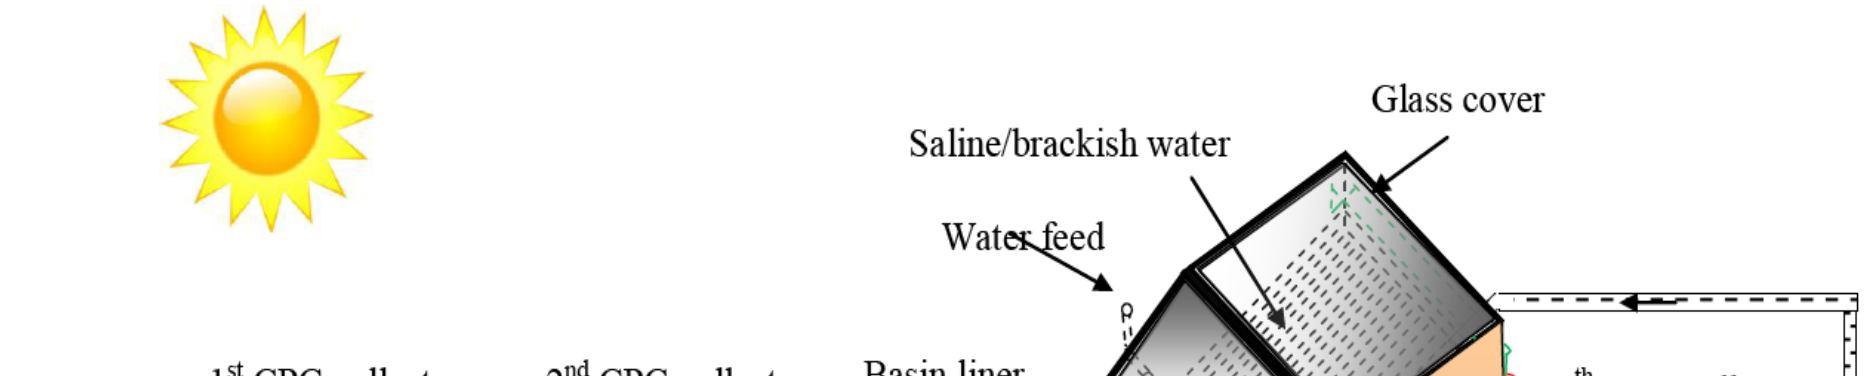
Fig. 3.2 Dual inclined PVT CPC active solar filtration system.
In Fig. 3.2 the diagram of dual inclined solar distiller, the direction of unit basin is east west facing, and the specifications are shown in Table 3.1. For solo and dual inclined, PVT CPC active solar distiller has same working principle as solo inclined.
Table 3.2 for active solar distiller average wind velocity of each month year for PVT CPC
Month Jan Feb March April May June July Aug Sep Oct Nov Dec Velocity (m/s) 2.77 3.13 3.46 3.87 4.02 4.11 3.39 2.91 2.85 2.16 1.83 2.4
From
The expression for partly covered N PVT CPC is given by Tripathi et al. (2016) uN = (1 Kp N )/(1 Kp) ( ( ))1 ( ) + (1 Kp N )/(1 Kp)( 1( wi − ) (4.1) The exhaust temperature of the Nth photovoltaic thermal compound parabolic concentrator water collector (Tfon) is given by TwoN = (AFR( ))1/ fiCfi*(1 Kp N )/(1 Kp)Ib(t) +(AFRUL)1/ fiCfi *(1 Kp N )/(1 Kp)Ta + Kp NTfi anywhere, Twi = Tw, and Two = TwoN Nth is outlet temperature of the solar photovoltaic thermal compound parabolic concentrator water collector, which is given in the basin. = [1 (TcN To)] (4.2) Anywhere, the typical capacity of the test conditions the mean high temperature of the Nth PVT CPC collectors is TwoN, an expression is given to calculate the value of Tripathi et al. (2016).
The balancing equations for solo inclined distiller is given ref. Singh et al. (2015) 4.2.1 glass cover inside surface α i i + h1( ) =Kg/Lg(Tgi Tgo)*Agi (4.3)

ISSN: 2321 9653; IC Value: 45.98; SJ Impact Factor: 7.538 Volume 10 Issue XI Nov 2022 Available at www.ijraset.com
Anywhere, i = (1 Rg) i representation of fraction of solar current falling from the glass cover and h1w = hrwg + hcwg + hewg which refers to internal heat transfer constant of the glass cover and the surface of water.
4.2.2 Outer surface of glass cover
Kg/Lg (Tgi Tgo)*Agi = h1g (Tgo Ta)*Agi (4.4)
Anywhere, h1g = hr,g + hc,g or h1g = 5.7 + 3.8V
4.2.3 Mass of basin water
uN + wi ( ) b + hbw( b w)* = h1w(tw tgi)*Ab + Mwcw(dtw/dt) (4.5)
Anywhere, uN represents thermal energy overall outcome and wi = (1 Rg) (1 g) (1 Rw)* wi Perceive This refers to the solar flux absorbed from the total solar flow through water from a hybrid PVT collector when n is connected in a single collector chain arrangement.
4.2.4 Basin liner
( )* = hbw (Tb Tw)*Ab + hba (Tb Ta)*Ab (4.6)
Where, i = (1 Rg)(1 g)(1 Rw)(1 w)* bi representation of absorption portion of the solar flux from the total solar flux through the basin liner.
By solving the above equations, the equations for basin water temperature can be obtained. dTw/dt + 1Tw = f1(t) (4.7)
The following assumptions are taken to obtain the inexact explanation of above equations
(i) Time hiatus (Δt) that is (0 < t < Δt). (ii) 1 constant for time interval time Δt. (iii) At mean amount of Ta, Ib(t) and Ic(t) amid ‘0’ and ‘t’ and can represent as a, b(t) and s(t). Therefore, f1(t) give a steady rate and its mean amount representation as 1(t).
Preliminary conditions are as Tw =Tw0 at t=0, in the equation 4.7 we obtained the result as Tw = {( 1(t))/α1)*(1 e 1t) + Tw0*e 1t} (4.8) We can determine glass temperature by using Tw, Tgi = ( gIc(t)*Ag + h1wTw *Ab + Uc,gaTaAg)/(Uc,ga *Ag + h1w *Ab) (4.9) Tgo ={(Kg/Lg)Tgi + h1gTa}/{(Kg/Lg) + h1g} (4.10) Per hour yield can be expressed as mew mew = {hewg *Ab(Tw Tgi)/L} *3600 (4.11) The following equation represents yield in single slope solar still.
Dwivedi and Tiwari gives the balancing equations
4.3.1 East side 4.3.1.1 For inside condensing cover giISE *AgE + h2wE(Tw TgiE)*(Ab/2) hEW(TgiE TgiW)*AgE = (Kg/Lg)(TgiE TgoE)*AgE (4.12)
Representation of overall heat transfer coefficients h1wE = hrwgE + hcwgE + hewgE
4.3.1.2 For outside condensing cover (Kg/Lg)(TgiE TgoE)*AgE = h1gE(TgoE Ta)*AgE (4.13) Where, h1gE = hrgE + hcgE or h1gE = 5.7 + 3.8V
4.3.2 West side
4.3.2.1 For inside glass cover giISW(t)*AgW + h1wW(Tw TgiW)*(Ab/2) + hEW(TgiE TgiW)*AgE = (Kg/Lg)*(TgiW TgoW)*(AgW) (4.14)
Where, h1wW = hrwgE + hcwgE + hewgE is representation of overall heat transfer coefficients from glass cover to water outside in westside.
4.3.2.2 For outside glass surface (Kg/Lg)(TgiW TgoW)*Agw = h1gW(TgoW Ta)*AgW (4.15)
ISSN: 2321 9653; IC Value: 45.98; SJ Impact Factor: 7.538 Volume 10 Issue XI Nov 2022 Available at www.ijraset.com
Where, h1gW = hrgW + hcgW or h1gw = 5.7 + 3.8V 4.3.2.3 For basin liner bi{ISE(t) + ISW(t)}*(Ab/2) = hbw(Tb Tw)*Ab + hba(Tb Ta)*Ab (4.16) Where, bi is representation of variation by basin liner from total solar radiation falls on it. 4.3.2.4 Mass of water in basin (Mw * Cw)*(dTw/dt) = (ISE(t) + ISW(t)) wi (Ab/2) + hbw*(Tb Tw)*Ab h1w*(Tw TgiE)*(Ab/2) h1w *(Tw TgiE)*(Ab/2) + uN (4.17) the expression get for (Tw) solving the equations (4.1), (4.12) to (4.17) and by initial input Tw = Tw0 at t = 0
Tw = ( 2(t)/ α2)*(1 e α2t) + Tw0e α2t (4.18)
comparative study shows in single and dual inclined solar still water temperature is same, but constants of equation (4.18) is of dual inclined photovoltaic thermal compound parabolic concentrator active solar distiller unit is different from the solo inclined distiller system and they are given in appendix.
By solving Tw from equation 4.18 we can calculate the glass temperature as follows
TgiE = (A11 + A12Tw)/p (4.19)
Tgiw = (B11 + B12Tw)/p (4.20)
TgoE = {(Kg/Lg)*(TgiE) + h1gETa}/{(Kg/Lg) + h1gE} (4.21)
TgoW = {(Kg/Lg)*(Tgiw) + h1gwTa}/{(Kg/Lg) + h1gw} (4.22)
By using the following equations we can get the water temperature for dual inclined solar still. East and West side yield can be obtained as follows.
mew,E = [hewE*(Ab/2)(Tw TgiE)]/L × 3600 (4.23) ew,W = [hewW*(Ab/2)(Tw TgiW)]/L × 3600 (4.24) equations represents hourly yield in east and west side.
To obtain high power equipment each year we must make a summary of the available energy from the N PVT CPC solar distiller system by satisfying first law of thermodynamics. Eout1 of distiller is given as Eout1 = [{(Mew × L)/3600} + {(Pm Pu)/0.38}] (5.1)
According to (Huang et al., 2001) a factor of 0.38 used in the standard power generation system per hour (E ̇xe) will be labeled as xe1 = Am *Ib(t) ∑ (ατgηcN) (5.2) Energy consumed can be eliminated by adding 10 h daily energy. So the taken out of monthly energy can be assessed by looking at specific dates by multiplying the daily energy consumption in the per annum energy that can be used equation (5.1).
Following Nag (2004), in order to obtain an effective solar filtering system hourly output is labeled as EXout1= Ab*hewg [(Tw Tgi) (Ta + 273) × ln{(Tw + 273)*(Tgi + 273) 1}] (5.3) Where, hewg = 16.273 * 10 3hc,wg{(Pw Pgi)*(Tw Tgi) 1} (Copper,1973) (5.4) hc,wg = 0.884{(Tw Tgi) + (Pw Pgi)Tw*(268.9 *103 Pw)}( 1/3) (Dunkle, 1961) Pwi1 = exp[ 25.317 (5144)*(Tw + 273) 1] And Pgi1 = exp[ 25.317 (5144)*(Tgi + 273) 1]
The annual overall thermal energy kWh, overall thermal exergy kWh, annual yield in kg can be calculated using monthly energy, exergy and yield. Using equation (5.3), to find solar energy in pairs, the term energy gain can be given as hourly exergy gain = hewgE* (Ab/2) * [(Tw Tgie) (Ta + 273) * loge{(Tw + 273)*(TgiE + 273) 1}] + hewgW * (Ab/2) * [(Tw Tgiw) (Ta + 273) * loge{(Tw + 273)*(Tgiw +273) 1}] (5.5)
ISSN: 2321 9653; IC Value: 45.98; SJ Impact Factor: 7.538 Volume 10 Issue XI Nov 2022 Available at www.ijraset.com
Table 5.1 Solo inclined PVT CPC for daily screening daily, monthly and annual yield Month weather weather weather weather Yield monthly Ya a ma Yb b mb Yc c mc Yd d md
Jan 24.49 3 73.47 22.79 8 182.32 6.26 11 68.82 1.46 9 13.10 337.71
Feb 24.29 3 72.87 23.53 4 94.12 6.70 12 80.37 1.40 9 12.64 260.00
Mar 26.46 5 132.3 27.39 6 164.34 11.38 12 136.61 5.41 8 43.30 476.55
Apr 28.1 4 112.4 27.91 7 195.37 12.18 14 170.52 9.25 5 46.23 524.51
May 28.73 4 114.92 22.54 9 202.86 15.85 12 190.15 7.88 6 47.29 555.22
Jun 27.03 3 81.09 22.72 4 90.88 12.07 14 169.01 5.08 9 45.76 386.74
Jul 24.09 2 48.18 19.28 3 57.84 12.58 10 125.78 3.15 17 53.49 285.29
Aug 23.47 2 46.94 20.92 3 62.76 9.79 7 68.55 3.93 19 74.59 252.84
Sep 27.98 7 195.86 25.58 3 76.74 15.96 10 159.64 5.49 10 54.94 487.18
Oct 25.12 5 125.6 18.72 10 187.2 12.45 13 161.83 3.43 3 10.30 484.93
Nov 23.93 6 143.58 15.19 10 151.9 5.28 12 63.34 3.87 2 7.75 366.57
Dec 24.48 3 73.44 18.71 7 130.97 8.62 13 112.08 1.66 8 13.28 329.77 Annual Yield(Kg) 4747.307
Table 5.2 Dual inclined PVT CPC effective daily filtering system, monthly and annual yield
Month weather weather weather weather Yield monthly ya a ma yb b mb yc c mc yd d md
Jan 26.56 3 79.67 22.91 8 183.27 7.93 11 87.20 1.68 9 15.12 365.26
Feb 25.43 3 76.29 23.69 4 94.76 7.64 12 91.72 1.65 9 14.85 277.61
Mar 26.79 5 133.97 27.47 6 164.80 11.36 12 136.29 6.04 8 48.33 483.39
Apr 29.46 4 117.83 28.65 7 200.57 12.33 14 172.65 9.97 5 49.84 540.90
May 27.77 4 111.07 21.36 9 192.20 14.91 12 178.92 8.92 6 53.49 535.69 Jun 26.94 3 80.81 21.83 4 87.33 13.14 14 184.02 3.89 9 34.97 387.14
Jul 24.52 2 49.04 18.54 3 55.63 12.64 10 126.37 3.5 17 59.53 290.56 Aug 22.62 2 45.24 19.56 3 58.68 10.13 7 70.91 3.83 19 72.68 247.51 Sep 31.42 7 219.91 26.51 3 79.54 15.13 10 151.34 5.68 10 56.77 507.56
Oct 26.95 5 134.74 18.57 10 185.75 12.98 13 168.76 3.86 3 11.57 500.81 Nov 25.43 6 152.58 15.24 10 152.35 5.40 12 64.80 4.19 2 8.38 378.11 Dec 24.07 3 72.20 18.80 7 131.58 9.46 13 122.98 1.75 8 14.01 340.77
Annual Yield(kg) 4855.31
Using equation (5.4) hewgE and hewgW can be calculated the value of solo and dual inclined N PVT CPC distiller units for profit calculated using sums (5.4) and (5.5). Solo and Dual inclined N PVT CPC solar distiller equipment that operates maximum power per year (Gex1, annual) is determined by Gex1, annual = Exout1 + (Pm Pu) (5.6) Where, Exout1 represents the solar emissions that are still active every year, Pm represents the electrical power available from PVT CPC water collectors where the same N plate is connected to the series and the power pump is represented by Pu.
ISSN: 2321 9653; IC Value: 45.98; SJ Impact Factor: 7.538
Volume 10 Issue XI Nov 2022 Available at www.ijraset.com
The duration of energy recovery, efficiency of the life cycle cost conversion can be determined by using energy matrices. With a renewable energy source, it does not matter if the energy produced is less than the energy used by it in its production, for which reason the above parameters are considered according to [Tiwari and Mishra (2012)].
Table 5.3 Daily, monthly and annual thermal exergy for single slope PVT CPC active solar still Month weather weather weather weather Yield monthly
Exa a Exma Exb b Exmb Exc c Exmc Exd d Exmd
Jan 2.4868 3 7.5 2.2635 8 18.108 0.5 11 5.806 0.041 9 0.3654 31.7391
Feb 2.3548 3 7.1 2.0605 4 8.2418 0.3 12 3.045 0.01 9 0.0914 18.4426
Mar 2.4462 5 12 0.6395 6 3.8367 0.4 12 4.263 0.213 8 1.7052 22.0357
Apr 2.3041 4 9.2 2.2635 7 15.844 0.6 14 8.242 0.396 5 1.9793 35.2814
May 2.1823 4 8.7 1.3094 9 11.784 0.7 12 8.404 0.426 6 2.5578 31.4752
Jun 2.2432 3 6.7 1.7357 4 6.9426 0.5 14 6.537 0.183 9 1.6443 21.853
Jul 1.8981 2 3.8 1.3601 3 4.0803 0.5 10 4.568 0.091 17 1.553 13.9969
Aug 1.8067 2 3.6 1.4718 3 4.4153 0.5 7 3.41 0.081 19 1.5428 12.9819
Sep 2.5172 7 18 2.2635 3 6.7904 0.7 10 7.41 0.122 10 1.218 33.0383
Oct 2.6695 5 13 0.8729 10 8.729 0.9 13 11.35 0.102 3 0.3045 33.7285
Nov 2.3751 6 14 0.9034 10 9.0335 0.2 12 2.801 0.213 2 0.4263 26.5118
Dec 2.2939 3 6.9 1.7458 7 12.221 0.3 13 4.486 0.071 8 0.5684 24.157
Annual Exergy (kwh) 305.241
Table 5.4 Daily, monthly and annual thermal exergy for dual slope PVT CPC active solar still Month weather weather weather weather Yield monthly
Exa a Exma Exb b Exmb Exc c Exmc Exd d Exmd
Jan 2.8249 3 8.5 2.4098 8 19.278 0.3 11 3.453 0.051 9 0.4556 31.6609
Feb 2.5515 3 7.7 2.3693 4 9.477 0.3 12 3.281 0.03 9 0.2734 20.6854
Mar 2.7439 5 14 3.2501 6 19.501 0.6 12 7.533 0.142 8 1.134 41.8871
Apr 2.8148 4 11 2.8553 7 19.987 0.5 14 6.379 0.334 5 1.6706 39.2951
May 2.4908 4 10 1.7415 9 15.674 0.7 12 8.141 0.425 6 2.5515 36.3285
Jun 2.8755 3 8.6 1.9845 4 7.938 0.5 14 7.229 0.071 9 0.6379 24.4316
Jul 2.2073 2 4.4 1.4074 3 4.2221 0.9 10 8.606 0.091 17 1.5491 18.792
Aug 2.1364 2 4.3 1.4884 3 4.4651 0.5 7 3.331 0.081 19 1.539 13.608 Sep 3.1894 7 22 2.8958 3 8.6873 0.8 10 7.898 0.122 10 1.215 40.1254
Oct 3.321 5 17 1.4681 10 14.681 0.8 13 10.4 0.081 3 0.243 41.9276
Nov 2.8958 6 17 1.2859 10 12.859 0.2 12 2.916 0.192 2 0.3848 33.534
Dec 2.4806 3 7.4 1.8833 7 13.183 0.6 13 8.424 0.051 8 0.405 29.4536
Exergy annually (Kwh) 371.729
ISSN: 2321 9653; IC Value: 45.98; SJ Impact Factor: 7.538 Volume 10 Issue XI Nov 2022 Available at www.ijraset.com
The enhancement in energy using material to produce this energy is known as the combined energy and the time required recovering the total energy lost in the photovoltaic thermal compound parabolic concentrator organization.
Energy payback time (EPT) = (Energy in (Ein1)/Energy out annually (Eout)) (5.7) Exergy payback time (EPT) = (Energy (Ein1)/exergy out annually (Gex1,annual) (5.8)
Corresponding to Tiwari and Mishra (2012), determining the number of EPFs yearly on the basis of photovoltaic thermal compound parabolic concentrator (PVT CPC) effective solar distiller tools is provided as follows, EPF on energy basis = Eout1/Ein1 (5.9) EPF on exergy basis = Gex1,annual/Ein1 (5.10) Anywhere, Gex1, per annum, Ein1, Eout1 is used in PVT CPC active solar filtering tools that represent the total gains per year, the power incorporated into the content used and the power that comes out yearly represent. With the help of equation (5.1) and equation (5.6) we can find the total annual amount of the total energy output and the total annual profit on the test. Similarly with the help of equation (5.9) and equation (5.10) PVT CPC alone and EPF performance is taken out and its amount is presented in table (5.5).
For photovoltaic thermal compound parabolic concentrator (PVT CPC) solar distiller unit the operation of the LCCE is obtained using Tiwari and Mishra (2012) provided as Based on energy LCCE = {(Eout1 * n Ein1}*(Esol1 * n) 1 (5.11) Based on exergy LCCE= {(Gex1,annual *n) Ein1}*{(annual solar exergy) * n} 1 (5.12) using equation 5.12 the LCCE can be calculated for PVT CPC active and dual inclined presented in Table (5.6).
Table 5.5 embodied energy Ein, for solo inclined and dual inclined N PVT CPC active solar still. Components name Solo inclined N PVT CPC active solar still Dual inclined N PVT CPC active solar still Embodied energy (kwh) Embodied energy (kwh) Solo inclined distiller 1747.95 1491.66 compound parabolic concentrator collector (N = 7) 5741.90 5741.90 Glass to glass PV (N = 7) 1719.37 1719.37 Others 25 25
Table 5.6 energy payback time (EPT), time of energy payback (EPT), embodied energy Ein, and life cycle cost conversion efficiency for solo inclined and dual inclined N PVT CPC active solar still. Solo inclined N PVT CPC active solar still
Total embodied energy 9234.13 kWh Annual yield 4747.3 kg annual energy available 3389.0 kWh Annual exergy 305 kWh (EPT)e 2.72473591 (EPT)ex 30.27583607 (EPF)e 0.367008045 (EPF)ex 0.033029641 (LCCE)e 0.126542591 (LCCE)ex 0.000115172
ISSN: 2321 9653; IC Value: 45.98; SJ Impact Factor: 7.538 Volume 10 Issue XI Nov 2022 Available at www.ijraset.com
Dual inclined N PVT CPC active solar still
Total embodied energy 8977.81 kWh Annual yield 4855.31 kg annual energy available 3537.67 kWh Annual exergy 371.72 kWh (EPT)e 2.537774863 (EPT)ex 24.15272659 (EPF)e 0.394045987 (EPF)ex 0.041403193 (LCCE)e 0.132999262 (LCCE)ex 0.002975458
In N PVT CPC alone and prone to using a solar filter system the calculation is done using a number of method measures.
1) Step I: Using Liu and Jordon formula with MATLAB 2016a and providing input details for calculation according by IMD, Pune, India for type (a), type (b), type (c) and type (d) days.
2) Step II: For the inclined distiller PVT CPC, TwoN, ŋcN, Tw, Tgi, Tgo, and hewg is listed, and the yield is checked. Correspondingly the photovoltaic thermal compound parabolic concentrator (PVT CPC) active system with dual value of TgoE, TgiW, TgoW, TgiE, Tw and the heat transfer coefficient is calculated. After that, with photovoltaic thermal compound parabolic concentrator (PVT CPC) effective solar filtering tools the advantages of ew,E and ew,W are calculated. For both active N PVT CPC distiller units, the total water generation is taken out by the insertion of mewE, mewW
3) Step III: Eqs. (5.1) and Eqs. (5.6), the photovoltaic thermal compound parabolic concentrator (PVT CPC) solar filtering devices the maximum thermal energy and emissions are to be calculated.
4) Step IV: With the help of equation 5.7 to 5.15 energy payback time (EPT), energy payback factor (EPF), and life cycle cost conversion efficiency (LCCE) can be calculated
At MATLAB2016 we can provide all statistics related to weather data especially general velocity, solar radiation and ambient temperature and emissions that can be found in MATLAB shown in Fig. 5.2 to 5.12 Fig 5.1
ISSN: 2321 9653; IC Value: 45.98; SJ Impact Factor: 7.538 Volume 10 Issue XI Nov 2022 Available at www.ijraset.com
T foN, max ( o C)
T foN, max ( o C)
160
140
120
100
80
60
40
20
0
1 2 3 4 5 6 7 8 9 10 11 12 13 14 15
Fig. 5.2 For solo inclined water temperature collector (TfoN,max) in the month of June
140
120
100
80
60
40
ṁf = 0.01 kg/s ṁf = 0.02 kg/s ṁf = 0.03 kg/s ṁf = 0.04 kg/s ṁf = 0.05kg/s ṁf = 0.06 kg/s ṁf = 0.07 kg/s 0
ṁf = 0.01 kg/s
ṁf = 0.02 kg/s
ṁf = 0.03 kg/s3 ṁf = 0.04 kg/s
ṁf = 0.05 kg/s
ṁf = 0.06 kg/s
ṁf = 0.07 kg/s ṁf = 0.08 kg/s
20
160 1 2 3 4 5 6 7 8 9 10 11 12 13 14 15
Fig. 5.3 For Dual inclined water temperature collector (TfoN,max) in the month of June
ISSN: 2321 9653; IC Value: 45.98; SJ Impact Factor: 7.538 Volume 10 Issue XI Nov 2022 Available at www.ijraset.com
ṁf = 0.01 kg/s
ṁf = 0.02 kg/s
140
120
100
80
60
40
20
0
160 1 2 3 4 5 6 7 8 9 10 11 12 13 14 15
ṁf = 0.03 kg/s
ṁf = 0.04 kg/s
ṁf = 0.05 kg/s
ṁf = 0.06 kg/s
140
120
100
80
60
40
20
Fig. 5.4 For solo inclined water temperature collector (TfoN,max) in the month of January
160 1 2 3 4 5 6 7 8 9 10 11 12 13 14 14
Fig. 5.5 For dual inclined water temperature collector (TfoN,max) in January
ṁf = 0.01 kg/s ṁf = 0.02 kg/s
ṁf = 0.03 kg/s ṁf = 0.04 kg/s
ṁf = 0.05 kg/s ṁf = 0.06 kg/s ṁf = 0.07 kg/s ṁf = 0.08 kg/s
ṁf = 0.07 kg/s ṁf = 0.08 kg/s 0
For June a collector PVT CPC specific solar distiller with a specified size that emits high temperature fluids as correspondingly shown in likewise in January it is shown in Fig. 5.4 and Fig. 5.5 in the order of the effective and efficient solar filtering tools. The weight loss increases it can be found that when there is a decrease in the rise in the temperature of the liquid.
ISSN: 2321 9653; IC Value: 45.98; SJ Impact Factor: 7.538 Volume 10 Issue XI Nov 2022 Available at www.ijraset.com
It is computed that up to 0.04 kg / s of fluid is released, in the collector there is a high rise in temperatures after which can be computed cracks in the curves are small, indicating that there is a slightly modify or a very high temperature increase in of weight can be controlled and increased continuously as the curve begins to meet. So from Fig. 5.2 to Fig. 5.5 after discharge of 0.04 kg/s small reduction in the temperature of the liquid in the collectors. Therefore, it can be concluded that the total weight loss is 0.04 kg/s. The reason for this slight increase in temperature after 0.04 kg/s the water receives very little time to receive heat from the PVT CPC water collector. The high temperature effect on varying flow rate of weight is shown in Fig. 5.2 to Fig. 5.5, and found reduction in collector outlet temperature with increasing emissions. The main reason for this is increased flow rate the heat transfer from collector to the water. As flow rate increases from 0.01 kg/s to 0.04 kg/s, it is evident the seventh collector set is decreased of about 40 °C Fig. 5.2 and Fig. 5.3 at high temperature of the outlet. As a result, getting a higher yield can connect a larger number of collectors to the series and another liquid can be used with a higher boiling point than water and a heat exchanger. With a discharge of 0.04 kg / s, if there are more than 7 numbers of photovoltaic thermal compound parabolic concentrator (PVT CPC) collectors the water gets temperature above 100 °C Fig. 5.2 to Fig. 5.3. has been observed that as the number of water collectors increases, there is a higher rate of heat loss which is why the water temperature rises. Therefore for the due to above reason the total PVT CPC water collector is limited to seventh. PVT CPC privately operated and advanced solar operating fluctuations of varying temperatures per hour Fig. 5.6 and Fig. 5.7 show correspondingly on a typical June day especially the glass temperature, TwoN, the temperature closest to the water temperature. Similarly the representation date in January Fig. 5.8 and Fig. 5.9 show solo and dual inclined integrated photovoltaic thermal compound parabolic concentrator (PVT CPC) solar distiller respectively. In the total number of collectors and the maximum flow rate temperature can be determined. And from Fig. 5.6 to Fig. 5.9 obtained the maximum temperature of the glass cover is available at 15:00 to 16:00 h and the Tw is most commonly available from 14:00 to 15:00 h. As we know that most solar energy is available at 12:00 h, so only is a big dissimilarity in the water temperature and the glass cover. In the solo and dual inclined photovoltaic thermal compound parabolic concentrator (PVT CPC) filtration systems there are different types of thermal fluctuations that change, emit, lighten, transmit and equal the amount of heat exchange rate per hour on the typical June Fig. 5.10 and Fig. 5.11 show correspondingly In the same way with the solo and dual inclined PVT CPC solar distiller on January of the month is shown in Fig. 5.12 and Fig. 5.13 correspondingly. The collectors have been tested maximum yield and equity of heat transfer. Fig. 5.10 to Fig. 5.13 it is evident the maximum yield is obtained at 14:00 h and the maximum coefficient of evaporative heat transfer at 16:00 h. This is because as we know that yield depends on the difference in glass and water temperature and the coefficient of evaporative heat transfer. It is much advanced than the luminous and coherent heat transfer coefficient because it is responsible for the loss.
Fig. 5.6 for solo inclined hourly temperature disparity for the June
ISSN: 2321 9653; IC Value: 45.98; SJ Impact Factor: 7.538 Volume 10 Issue XI Nov 2022 Available at www.ijraset.com
Heat transfer coeff.(W/m 2k) Time (h)
ISSN: 2321 9653; IC Value: 45.98; SJ Impact Factor: 7.538 Volume 10 Issue XI Nov 2022 Available at www.ijraset.com
ṁf = 0.04 kg/s, N = 7
Fig. 5.11 For solo inclined hourly heat transfer coefficient disparity for June
4.50
4.00
3.50
3.00
ṁf = 0.04 kg/s, N = 7 Yield
2.50
2.00
1.50
hcwg hrwg hewg h1w 0.00
Yield (kg) Time (h)
1.00
0.50
5.00 8:00 10:00 12:00 14:00 16:00 18:00 20:00 22:00 0:00 2:00 4:00 6:00
ISSN: 2321 9653; IC Value: 45.98; SJ Impact Factor: 7.538 Volume 10 Issue XI Nov 2022 Available at www.ijraset.com
180
160
140
120
100
80
60
40
Heat transfer coeff. (w/m 2k) Time (h)
20
0
200 8:00 10:00 12:00 14:00 16:00 18:00 20:00 22:00 0:00 2:00 4:00 6:00
Fig. 5.13 For dual inclined hourly heat transfer coefficient disparity for June
4.50
4.00
3.50
3.00
ṁf = 0.04 kg/s, N = 7 Yield
2.50
2.00
1.50
ṁf = 0.04 kg/s, N = 7 hcwgE hcwgW hrwgE hrwgW hewgE hewgW h1wE h1wW 0.00
5.00 8:00 10:00 12:00 14:00 16:00 18:00 20:00 22:00 0:00 2:00 4:00 6:00
1.00
0.50
Yield (kg) Time (h)
Fig. 5.14 For solo inclined hourly yield disparity for January
ISSN: 2321 9653; IC Value: 45.98; SJ Impact Factor: 7.538 Volume 10 Issue XI Nov 2022 Available at www.ijraset.com
Heat transfer coeff. (w/m 2k) Day time (h)
Fig. 5.15 For solo inclined hourly heat transfer coefficient disparity for January
4.50
4.00
3.50
3.00
ṁf = 0.04 kg/s, N = 7 Yield
2.50
2.00
1.50
ṁf = 0.04 kg/s, N = 7 hcwg hrwg hewg h1W 0.00
5.00 8:00 10:00 12:00 14:00 16:00 18:00 20:00 22:00 0:00 2:00 4:00 6:00
1.00
0.50
Yield (kg) Time (h)
Heat transfer coeff.(w/m 2k)
100
80
60
40
20
0
ISSN: 2321 9653; IC Value: 45.98; SJ Impact Factor: 7.538 Volume 10 Issue XI Nov 2022 Available at www.ijraset.com
ṁf = 0.04 kg/s, N = 7 hcwgE hcwgW hrwgE hrwgW hewgE hewgW h1wE h1wW
Fig. 5.17 For dual inclined hourly of heat transfer coefficient disparity for January
24 26 28 30
Fig. 5.18 For solo and dual inclined hourly yield disparity for June and January
The correct value of the collector N = 7 in this case is the flow of the equity yield of the single and double the trend of PVT CPC effective solar filters the difference in the production day of the day represented in June and January in Fig. 5.14, and 5.16 as expected, water generation rate is deduced as the flow rate increases.
ISSN: 2321 9653; IC Value: 45.98; SJ Impact Factor: 7.538 Volume 10 Issue XI Nov 2022 Available at www.ijraset.com
This is because water tubes get less time to absorb heat at which the water absorbs heat transfer increases and the temperature of the Nth collection store becomes lower as flow rate increases. Since the output of the Nth collector is connected to the solar distiller and the temperature of the Nth collection is relatively low which is why it contributes to the small temperature increase of the water container. So that the temperature of the water tank rises slightly, the temperature difference is made between the glass settlement and the lower water, as a result of which the yield is lower because evaporation occurs lower.
Solo inclined N-PVT-CPC active solar still

Corresponding Units
2.5
2
1.5
1
0.5
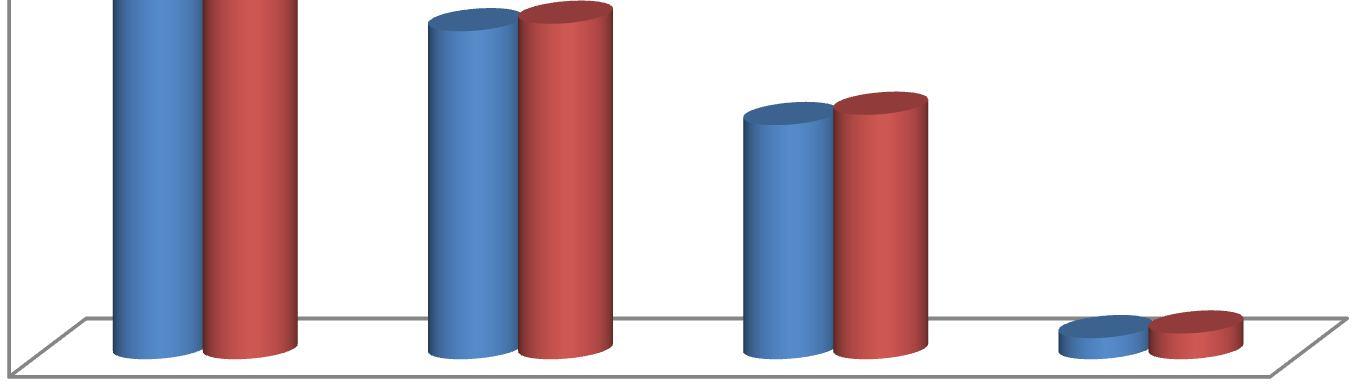
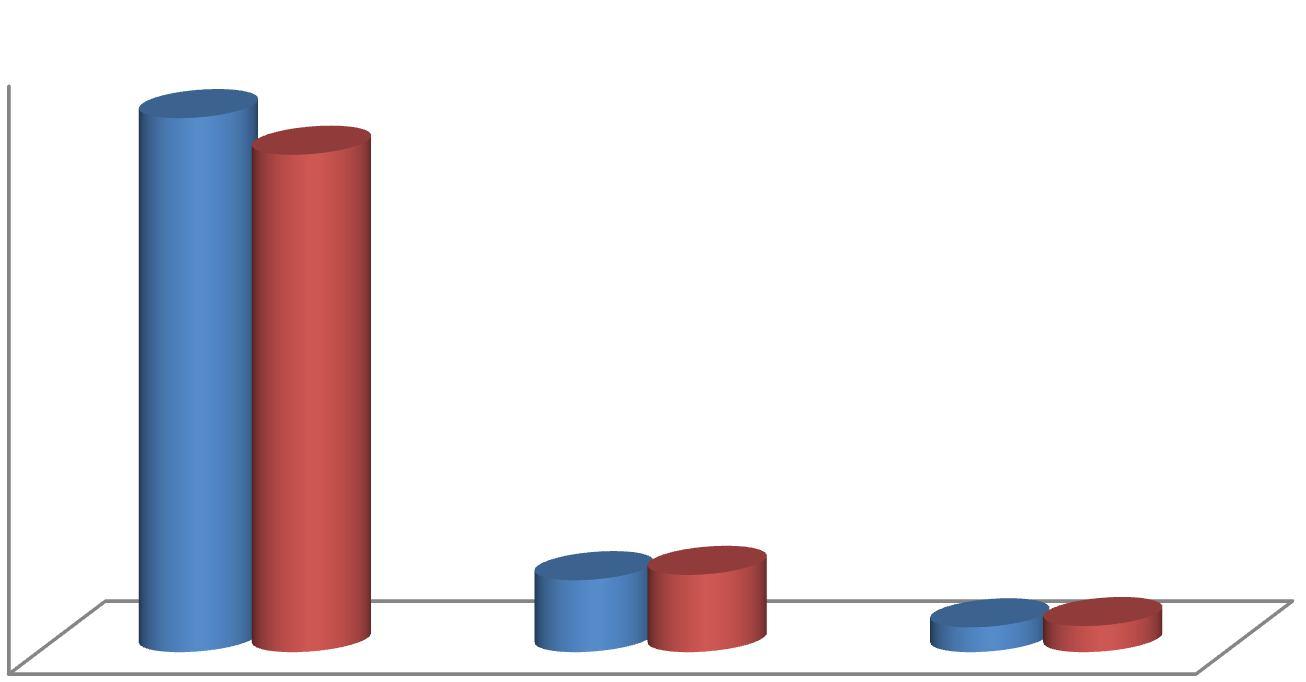
3 (EPT)e (EPF)e (LCCE)e
inclined N-PVT-CPC active solar still
0
Fig. 15.19 energy matrices analysis of the solo and dual inclined distillation system
Solo inclined N-PVT-CPC active solar still
Dual inclined N-PVT-CPC active solar still
Fig. 15.20 economic analysis of the solo and dual inclined distillation system
In the analysis of single and dual inclined solar filter systems, we can find that the change in the analysis of the cost of a life cycle in energy matrices and their effect on the recovery time by energy. Finally, the measurement of practical PVT CPC tools for solar thermal differs from the depth of the gorge water is analyzed and included with their effect on performance and efficiency on an hourly basis. Sole and dual inclined PVT CPC active distiller apparatus basin type for daily product items of 0.04 kg / s, 0.7, and 0.74 are ideal for weight loss, a large number of collectors, and great depth of systems, correspondingly. However, since the lake's water depth is 0.74 m, the system will be extensive, and as a result, we have re evaluated the durability of the system, efficiency, and strength.
ISSN: 2321 9653; IC Value: 45.98; SJ Impact Factor: 7.538 Volume 10 Issue XI Nov 2022 Available at www.ijraset.com
Considering that there are four types of climates type (a), (b), (c), and (d) and in this case, we can use a depth of 0.14 m water channel to test the strength and output power and complete the total output volume of the collectors. In each analysis, we find that at a water depth of less than 0.19 m, the two slopes provide much better performance than the active PVT CPC filters operating at a given range of weight loss and plate number and vice versa at a depth of less than 0.19 m. At a depth of 0.14 m of brook water, a double sided solar filtering system is better than the single inclination operating system because the amount of energy, energy, and energy metrics are better than the given number of collector plate and weight flow rate. In the EPBT components, the loss or reduction in the amount of power and energy of two trends than the end of the active PVT CPC system filtering the sun by 17.98% and 7.5%, respectively. According to the EPF, the operating capacity and power received a higher value of two trends than a single filtering device of 12.72% and 5.12%. Similarly, according to LCCE, the maximum output power is 22.223% and 5.557%, respectively, of the two trends than the reduction of PVT CPC only solar energy efficiency. We calculate the production price of water in ₹ / kg and the cost of electricity in ₹ / kwh. The total volume output and the collection plate number of 0.14 m, the maximum energy, and thermal energy each year are determined because both slopes have a higher value than the only active PVT CPC 12.79% 4.2% correspondingly. In the same way, at 0.14 m basin water deepness 50 year life cycle and interest rate is 5%. Considering the typical daily production, high operating capacity, daily mean heat capacity, and overall heat efficiency, the absolute value of gorge sole water depth and dual incline PVT CPC practical solar filtering tools available at 0.7 m. with a water depth of less than 0.31 m in terms of daily energy consumption, daily production and heat efficiency both tend to have the best performance of PVT CPC solar filtering equipment. When the basin depth is higher than 0.31 m, then dua inclined performance is much better than the dual inclined PVT CPC active solar filtration system. The above analysis shows that the overall energy, total thermal energy, productivity, and thermal efficiency in both active and two fewer solar filters will decrease as the water depth increases. At sunrise, the various components are produced hourly, thermal energy, exergy, complete exergy, and thermal efficiency of both trends are better than when PVT CPC only works with solar immersion apparatus at all basin depths
[1] Abu Arabi M. and Zurigat Y. (2005), Year round comparative study of three types of solar distillation units, Desalination 172, pp. 137 143
[2] Desh Bandhu Singh (2016), Exergoeconomic and Enviroeconomic analysis of active solar stills: A comparative study, Centre for energy studies Indian institute of technology Delhi
[3] Abdel Rehim. S., Lasheen A. (2007), Experimental and theoretical study of a solar desalination system located in Cariro, Egypt, Desalination, 217, PP. 52 54
[4] Agrawal S. and Tiwari G.N (2012), Exergoeconomic analysis of glazed hybrid photovoltaic thermal module air collector, sol. Energy 86(9), 2826 2838
[5] Della porta, G.B. (1589) Magiae naturals libri XX, Napoli
[6] Delyannies E.F.(1987) Status of solar assisted desalination: a review. In proceedings of 3rd world congress on desalination, Cannes, p.67
[7] Delyannis A. and Delyannis E. (1983), Recent solar distillation developments. Desalination, 45, P.361
[8] Delyannis A. and Delyannis E, (1973), Solar distillation plant of high capacity, in proceedings of 4th Int. Symposium on fresh water from Sea, 4 p 487
[9] Delyannis E. (2013). Historic background of desalination and renewable energies, energy, 75(5), p. 357 366
[10] Dwivedi V.K., Tiwari G.N,(2010), Experimental validation of thermal model of double slope active solar still under natural circulation mode, Desalination Vol. 250(1), pp. 49 55
[11] Dwivedi V.K. and Tiwari G.N.(2008), Annual energy and exergy analysis of single and double slope solar stills, trends in applied science research 3(3), pp. 225 241
[12] Dwivedi V.K. and Tiwari G.N. (2009), Experimental validation of thermal model of a double slope active solar still under natural circulation mode, Desalination 250 (2010) 49 55, Elsevier.
[13] Dwivedi V.K. (2009), performance study of various designs of solar stills, Ph.D thesis: IIT New Delhi (india)
[14] El Sebaii A.A, Yashmour S.J, Al Hazmi F.S., Faidah A.S., Al Marzouki F.M. and Al Ghamdi A.A(2009), Active single basin solar still with a sensible storage medium, desalination, vol. 249, pp. 699 706
[15] El Sebaii. A. (2003), The effect of wind speed on active and passive solar stills, Energy conversion and management, 45(7 8), p.1187
[16] Estahbanati M R K, Feilzadeh M, Jafarpur K, FeiliZadeh M and Rahimpour M R, (2015): Experimental investigation of a multi effect active solar still: The effect of the number of stages’, Applied Energy 137,46 55
[17] Hamadou O.A. and Abdellatif K(2014), Modeling an active solar still for sea water desalination process optimization’, Desalination 354, p.1 8
[18] Huang B.J. Lin, T.H., Hung, W.C. and Sun F.S.(2001), Performance evaluation of solar photovoltaic thermal systems, Solar Energy 70(5), pp. 443 448
[19] Jafarkazemi F. and Ahmadifard E.(2012), Energetic and Exergetic evaluation of flat plate solar collectors, Renewable Energy 56 (2013) 55 63
[20] Kumar S and Tiwari A.(2008), An experimental study of hybrid Photovoltaic thermal(PVT) active solar still. International journal of Energy research, vol. 32 pp. 847 58
[21] Kumar S and Tiwari G.N. (2009), Estimation of internal heat transfer coefficients of a hybrid (PVT) active solar still solar Energy 2009;83:1656 67
[22] Kumar S and Tiwari G.N. (2009a), Life cycle cost analysis of single slope Hybrid (PVT) active solar still. Applied energy 2009: 1995 2004
[23] Kumar S., Tiwari G.N., Singh H.N. (2000), Annual performance of an active solar distillation system, Desalination 127, p 79 88
[24] Kumar S, and Tiwari G.N.(1998): Optimization of collector and basin areas for a higher yield for active solar stills, Desalination, Vol. 116 pp. 1 9
ISSN: 2321 9653; IC Value: 45.98; SJ Impact Factor: 7.538 Volume 10 Issue XI Nov 2022 Available at www.ijraset.com
[25] Kumar S. and Tiwari A. (2010), Design, Fabrication and performance of a hybrid photovoltaic thermal (PVT) active solar still, Energy Conversion and management 51, pp.1219 1229
[26] Kumar S. and Tiwari G.N.(2009), Life cycle cost analysis of single slope hybrid (PVT) active solar still, Applied energy 86, 1995 2004
[27] Kumar S. Tiwari G.N., Gaur M.K. (2010a), Development of empirical relation to evaluate the heat transfer coefficient and Fractional energy in basin type hybrid (PVT) active solar still. Desalination 250, 214 221
[28] Nag, P.K., (2004), Basic and applied thermodynamics, Tata Mcgraw hill
[29] Petela R.(2003), Exergy of undilutedthermal radiation, solar energy 86, p.241 247
[30] Saeedi F, Sarhaddi F. and Behzadmehr A.,(2015), optimization of a PVT active solar still Energy, Vol. 87, pp.142 152
[31] Singh, D.B. Yadav, Dwivedi. V.K.. Kumar S., Tiwari G.N. and Al Helal, I.M(2016), Experimental studies of active solar still integrated with Two Hybrid PVT collectors, solar Energy, 130, pp.207 223
[32] Kern, E.C., Russell, M.C., (1978), combined photovoltaic and thermal hybrid collector systems,
[33] In: Proceedings of the 13th IEEE Photovoltaic Specialists, June 5 8. Washington, DC, USA, pp. 1153 1157
[34] Rai S.N. and Tiwari G.N., (1983), Single basin solar still coupled with flat plate collector, Energy Conversion and Management Vol. 23(3) p.145 149.
[35] Zaki, G.M., A. Al Turki, AI Fatani, M. (1992), Experimental investigation on concentrator assisted solar stills. Solar Energy 11, p.193
[36] Lawrence, S.A. and Tiwari, G.N. (1990), Theoretical evaluation of solar distillation under natural circulation with heat exchanger, Energy Conversion and Management, 30, p.205.
[37] Tripathi, R., Tiwari, G.N. and Al Helal, I.M, (2016), Thermal modeling of N partially covered photovoltaic thermal (PVT) Compound parabolic concentrator (CPC) collectors connected in series, Solar Energy, 123, pp. 174 184