
10 VII July 2022 https://doi.org/10.22214/ijraset.2022.41654

Abstract: The world has been struggling with the outbreak of Covid 19 virus for past 21 months. It is a severe acute respiratory syndrome caused by a highly transmissible novel coronavirus. Every country, including India adopted certain measures to combat the pandemic, like announcing lockdown in phases. India has been severely struck by the Covid pandemic. In fact, the third wave of Covid has already knocked in. The development of vaccines against the Covid virus helped the world heal. Different countries are testing the Covid vaccine candidates. The world’s largest vaccination drive started in India on January 16, 2021. The Indian Government has taken a great step forward to vaccinate every individual along with manufacturing the Covid vaccine domestically. The Government of India has also taken effective measures to launch a digital platform Aarogya Setu for the vaccine registration and obtaining the proof that the individual has been vaccinated with the name of the vaccine given and the date on which he/she got vaccinated. In this paper, we have studied the use of Covaxin and Covishield doses in different states of India and found that people who received both doses of the Covid vaccination, whether Covishield or Covaxin, are safe against the Covid virus, according to the government, but they must follow the covid protocols for best outcomes.
The first coronavirus case was discovered two years ago, and the entire globe has been in a state of terror since then. The coronavirus is thought to have originated in the city of Wuhan, China, with the first case recorded in December 2019. The COVID 19 virus quickly spread over the world. On January 30, 2020, the World Health Organization (WHO) declared the outbreak a Public Health Emergency of International Concern, and on March 11, 2020, it was declared a pandemic (Supady, 2020). In India, the first case of COVID was discovered in Kerala in January 2020 (Brijesh Sathian, 2020). The number of new cases in India increased from 88,600 to 88,600 in just nine months, with a week average of 84,559. The initial wave of the Corona virus was discovered to have a greater impact on the health of the elderly. With their own processes, all countries proclaimed a lockdown. The world came to a halt. The second wave of the Corona virus swept the world soon after, and this strain was found to be lethal. It was discovered that the virus attacked children and adults more aggressively. At first, the aim was to slow down the speed of spreading of the virus. Later, when the cases started to rise enormously and no particular symptoms were available, it became an urgent need for the development of the vaccine. To prevent the virus from spreading, those who were infected were isolated for at least 14 days and were kept in complete quarantine. The Covi 19 virus is very contagious and can strike at any time. The world had never been prepared for a pandemic of this magnitude, and we were racing to produce a vaccine to stop it from spreading. The world appears to have gone insane in its search for a treatment for the coronavirus, an extremely hazardous disease that has engulfed the planet in panic. Medical researchers must produce a vaccine that will provide acquired immunity against the coronavirus 2 (SARS CoV 2) that causes severe acute respiratory illness. The first COVID vaccination, the Pfizer BioNTech COVID 19 vaccine, was licenced by the US Food and Drug Administration for people aged 16 and up. Countries such as China, Russia, and the United States of America, for instance. On January 16, 2021, India launched the world's largest vaccination campaign. Considering India's large population, importing vaccines would have been prohibitively expensive. Furthermore, because the Indian government wanted to vaccinate every citizen, it was ideal to manufacture the COVID 19 vaccines in India. India also planned to export vaccines to countries that couldn't afford the more expensive vaccines. The goal of manufacturing COVID vaccines in India is to ensure that each citizen in the country receives all of the required doses, as well as to make them affordable to the world's poorest countries. Covishield and Covaxin are mostly used in India at the moment. There were also rumours about the COVID vaccinations' ineffectiveness. Some of them include the following: they are unsafe, they induce infertility, they modify DNA, they are unsafe for persons with allergies, vaccines are not thoroughly evaluated, and so on. All of these, however, turned out to be rumours
International Journal for Research in Applied Science & Engineering Technology (IJRASET) ISSN: 2321 9653; IC Value: 45.98; SJ Impact Factor: 7.538 Volume 10 Issue VII July 2022 Available at www.ijraset.com 4431©IJRASET: All Rights are Reserved | SJ Impact Factor 7.538 | ISRA Journal Impact Factor 7.894 |
Keywords: Covid 19, India, vaccination drive, Covishield, Covaxin, Aarogya Setu I. INTRODUCTION
Department of Mathematics and Statistics, School of Chemical Engineering and Physical Sciences, Lovely Professional University, Phagwara, Punjab (India)
AComparativeAnalysis on the Doses of Covaxin and CovishieldVaccinesAdministered in India
Uma Bhattacharya1 , Mohit Nain2


International Journal for Research in Applied Science & Engineering Technology (IJRASET) ISSN: 2321 9653; IC Value: 45.98; SJ Impact Factor: 7.538 Volume 10 Issue VII July 2022 Available at www.ijraset.com 4432©IJRASET: All Rights are Reserved | SJ Impact Factor 7.538 | ISRA Journal Impact Factor 7.894 |
1) Updated On: This column contains information about the date starting from 16 01 2021 to 15 08 2021 with no gaps.
III. MATERIALS AND METHODS
Ever since the SARS CoV2 Virus has struck the world, there is a constant urge and interest of people to know, to find out and research about it. What is this Corona Virus? From where and how did this even originated? Why is this virus so dangerous to people? How is the world handling it? What precautions do we need to take to curb its growth? Is there a requirement for a vaccine? If yes, will the vaccine be able to provide shield to us from the virus? All these questions led people and researchers to dive into this topic and bring into light the cause, effect and remedies of this SARS CoV 2. V.M. Kumar et al. (2021) in Strategy for COVID 19 vaccination in India: the country with the second highest population and number of cases, has vividly described each and every Covid Vaccine manufactured in India, explained their trial phase alongwith the strategy adopted by India for Covid 19 vaccination (Velayudhan Mohan Kumar, 2021). H. Dai et al. (2020) in their editorial who is running faster, the virus or the vaccine? has described about the pros and cons of the virus as well as the vaccine. They have explained how the pace of people being vaccinated is getting affected. Also, what measures are taken for vaccinating the mass (Han Dai, 2020) J. Connor et al (2020) in their review article Health risks and outcomes that disproportionately affect women during the Covid 19 pandemic: A review has brought out the risk factors that affected women during the Covid pandemic. The article concluded that Gender differences in health risks and implications are likely to be expanded during the Covid 19 pandemic (Jade Connor, 2020) J. Muthukrishnan et al. (2021) has done a cross sectional study based on a designated COVID hospital in New Delhi. This study was done on all the patients admitted to the hospital having moderate to severe COVID 19 symptoms. They fitted a logistic regression model to the data and concluded that people with complete vaccination status and of younger age were associated with survival (Vaccination status and COVID 19 related mortality: A hospital based cross sectional study, 2021) Samaddar et al. in their paper (The Enigma of Low COVID 19 Fatality Rate in India, 2020) has talked about how the Indian SARS CoV 2 Strains differ from the strains elsewhere. They discussed the mutations and does variations in host factors determine the susceptibility to sars cov 2. Sharma et al (2020) and Wang et al. (2020) has discussed about the challenges that came through in the development of Covid vaccine. They studied about the immune response to SARS COV2 virus. Then, various clinical trials and phases of vaccine development and their various platforms like DNA and RNA based vaccines, non replicating viral vector vaccines, inactivated vaccines, etc. (A Review of the Progress and Challenges of Developing a Vaccine for COVID 19, 2020) (The COVID 19 Vaccine Race: Challenges and Opportunities in Vaccine Formulation, 2020). We wanted to study how the COVID 19 vaccination drives throughout India was carried out. Our primarygoal is to investigate how the two COVID 19 vaccines now in use in India, Covishield and Covaxin, affect the survival rate Another goal of this research is to determine which of the two COVID vaccines is superior in terms of providing robust immunity and having the least negative impact on people's health.
The following are the fields in the dataset:
2) State: This column contains all the States and Union Territories of India in Alphabetical order starting from Andaman and Nicobar Islands to West Bengal.
There are three types of data in the dataset used for this investigation. The initial set of data pertains to COVID 19 cases that have been detected, cured, and died across India's states and union territories. It takes place between January 30, 2020, and August 11, 2021. The second type of information is state by state testing information for COVID 19 cases found, including the number of positive and negative cases. From April 17, 2020, to August 10, 2021, it was recorded. The third kind has the combined data of Covid 19 vaccinations, which distinguishes between Covishield and Covaxin doses. The dataset is also segmented by the Indian government's age group slabs. From January 16, 2021, to August 9, 2021, it was recorded. This entire dataset was taken from Kaggle's official website (https://www.kaggle.com/) (https://www.kaggle.com/sudalairajkumar/covid19 in india) Tableau and MS Excel were used to conduct the analysis. The dataset consists 7643 rows and 24 columns.
All of the COVID 19 vaccines that have been licenced for use have been thoroughly evaluated, are entirely safe, and appropriately trigger the COVID virus, according to studies. Furthermore, the race to develop a powerful cure (vaccine) for the sickness drove them to develop and release the most effective vaccine, which might potentially trigger the symptoms of any future form of the Corona Virus.
3) Total Doses Administered: This column contains information on the total number of doses administered in each state and union territory of India.
II. RELATED WORKS
6) First Dose Administered: This column tells the number of first doses of vaccines administered in the state on the given date.
11) Covaxin (Dose Administered): It contains information about the number of Covaxin doses administered in the State/UT.
23) Transgender (Individuals Vaccinated): It contains information about the number of Transgender Individuals vaccinated in the State/UT on the particular date.
18) 18 44 Years (Individuals Vaccinated): It contains information about the number of Individuals vaccinated in the age group 18 44 years in the State/UT on the particular date
7) Second Dose Administered: This column tells the number of second doses of vaccines administered in the state on the given date.
22) Female (Individuals Vaccinated): It contains information about the number of Female Individuals vaccinated in the State/UT on the particular date.
21) Male (Individuals Vaccinated): It contains information about the number of Male Individuals vaccinated in the State/UT on the particular date.
24) Total Individuals Vaccinated: It contains information about the Total number of Individuals vaccinated in the State/UT on the particular date.
IV. COVID VACCINATION IN INDIA
17) 60 + Years (Dose Administered): It contains information about the number of doses administered for the age group 60+ years in the State/UT.
5) Sites: This column contains numeric information about the number of sites formed for vaccination campaign in the particular state.
10) Transgender (Dose Administered): It contains information about the number of doses administered among which Transgender were administer.
9) Female (Dose Administered): It contains information about the number of doses administered among which Females were administer.
15) 18 44 Years (Dose Administered): It contains information about the number of doses administered for the age group 18 44 years in the State/UT.
8) Male (Dose Administered): It contains information about the number of doses administered among which Males were administer.
The Indian government took significant measures to respond to the worldwide pandemic and began preparing the health system to handle all elements of COVID 19 management. As a result, India was able to maintain the lowest mortality rate and the highest recovery rate in the world during the pandemic (www.mohfw.gov.in, 2021). On January 16, 2021, free immunisation against SARS CoV 2 began. Vaccinating a large portion of the population during the COVID epidemic and its variants was a big task for the Indian government. According to the most recent statistics, India has a population of 1.39 billion people. As a result, mass vaccination faced a significant challenge, but the current government's management was able to overcome it. The following vaccinations are produced in India:
16) 45 60 Years (Dose Administered): It contains information about the number of doses administered for the age group 45 60 years in the State/UT.
12) Covishield (Dose Administered): It contains information about the number of Covishield doses administered in the State/UT.
International Journal for Research in Applied Science & Engineering Technology (IJRASET) ISSN: 2321 9653; IC Value: 45.98; SJ Impact Factor: 7.538 Volume 10 Issue VII July 2022 Available at www.ijraset.com 4433©IJRASET: All Rights are Reserved | SJ Impact Factor 7.538 | ISRA Journal Impact Factor 7.894 | 4) Sessions: This column contains information about the number of sessions that are held in each state and union territory.
19) 45 60 Years (Individuals Vaccinated): It contains information about the number of Individuals vaccinated in the age group 45 60 years in the State/UT on the particular date.
1) Covaxin by Bharat Biotech International Limited in collaboration with National Institute of Virology of ICMR. It is the first domestic covid vaccine manufactured in India.
20) 60+ Years (Individuals Vaccinated): It contains information about the number of Individuals vaccinated in the age group 60+ years in the State/UT on the particular date.
13) Sputnik V (Dose Administered): It contains information about the number of Sputnik V doses administered in the State/UT.
2) Covishield by Serum Institute of India (Pune).
14) AEFI: It tells us about an adverse event following immunization (AEFI). It is any untoward medical occurrence which follows immunization and which does not necessarily have a causal relationship with the usage of the vaccine.
3) ZyCoV D by Cadila Healthcare (Ahmedabad)
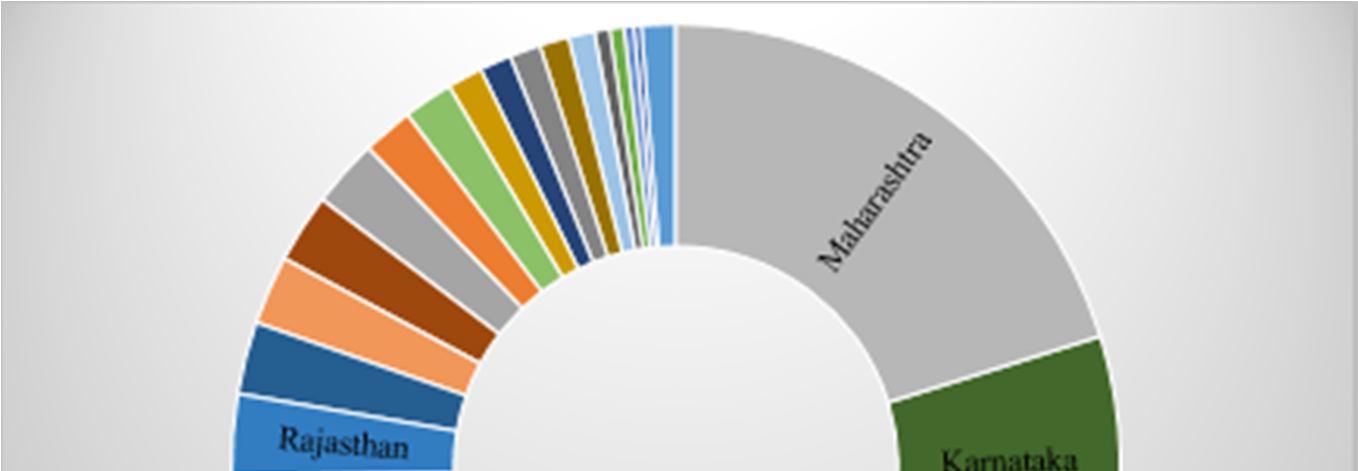
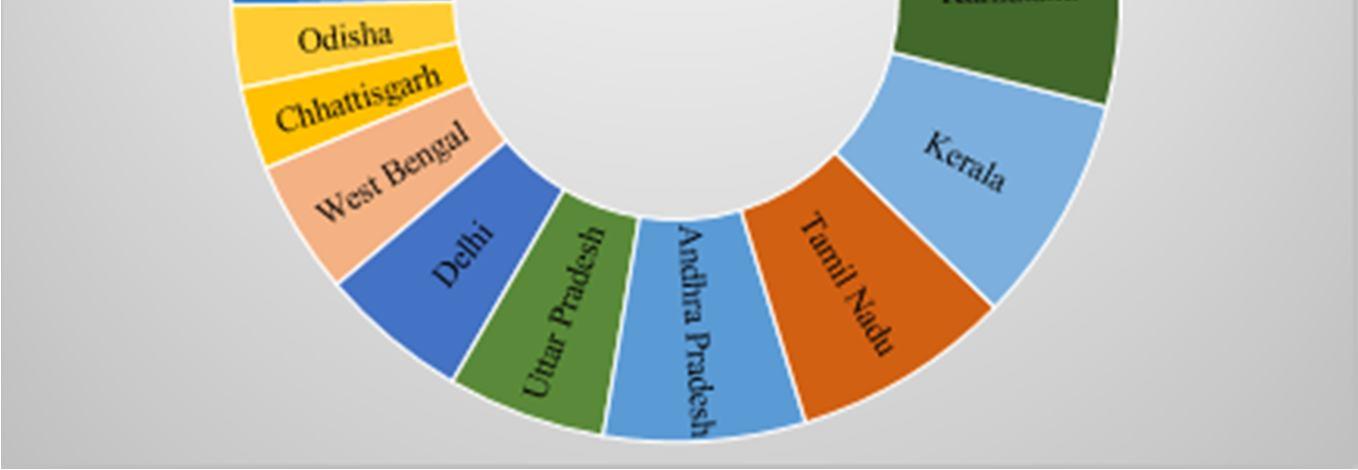
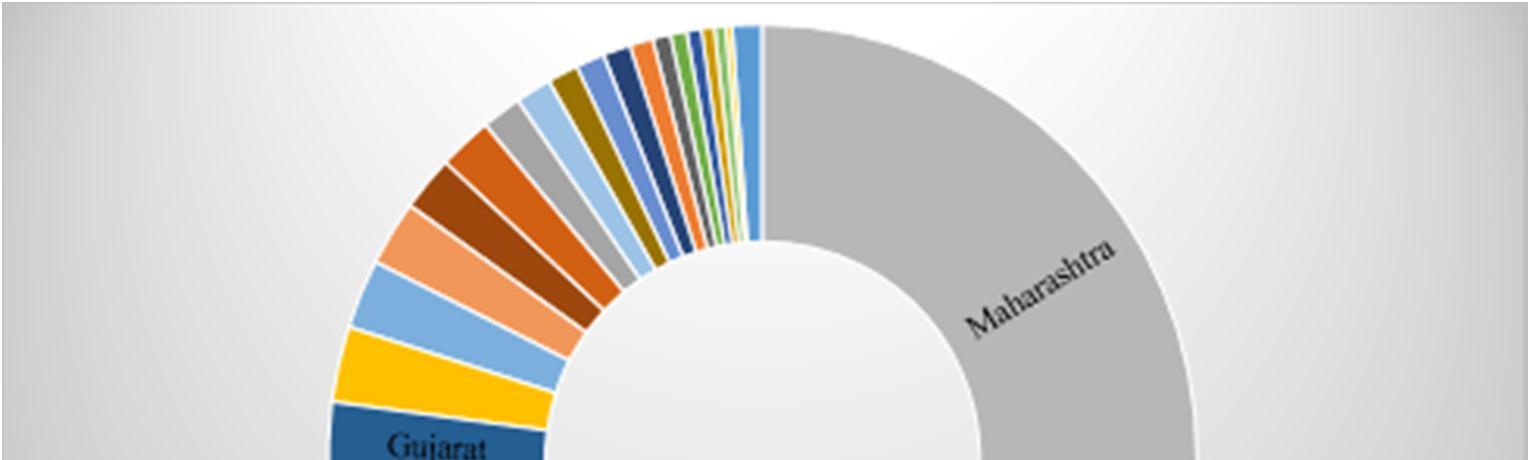
Following are the analysis of the dataset taken for this study using the software Tableau & MS Excel Figure 1 Doses of Vaccines Administered In States/UTs of India
Figure 1 depicts the total dosages provided in India's various states and union territories from January to August 2021, which shows that the Andaman and Nicobar Islands have the fewest vaccination doses delivered, while Maharashtra has the most, followed by Uttar Pradesh and Gujarat.
4) Sputnik V by Dr. Reddy’s Laboratories (Hyderabad), originally developed by Gamaleya National Center of Epidemiology and Microbiology of Moscow, Russia.
VACCINESOFDOSES ADMINISTERED STATES/UNION TERRITORIES OF INDIA
International Journal for Research in Applied Science & Engineering Technology (IJRASET) ISSN: 2321 9653; IC Value: 45.98; SJ Impact Factor: 7.538 Volume 10 Issue VII July 2022 Available at www.ijraset.com 4434©IJRASET: All Rights are Reserved | SJ Impact Factor 7.538 | ISRA Journal Impact Factor 7.894 |
V. EXPLORATORY DATA ANALYSIS
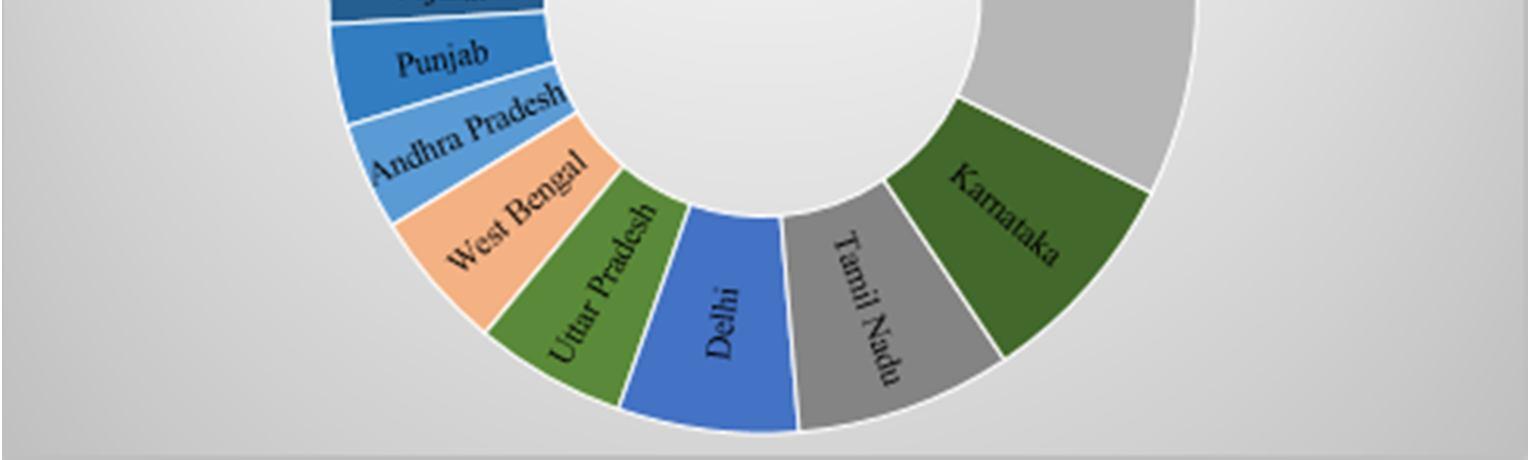
Figure 2 State wise doses administered Figure 2 shows a 3 D representation of the state by state distribution of total doses separated into first and second doses in India from January to August 2021. The sum of total doses administered in the particular state or UT is represented by the blue bar; the sum of the first dose administered in the particular state or UT is represented by the grey bar; and the sum of the second dose administered in the particular state or UT is represented by the orange bar. This graph depicts the total number of immunizations given vs. the first and second doses.
50000000001E+091.5E+092E+092.5E+093E+093.5E+094E+09 Andaman… Andhra… Arunachal… Assam Bihar Chandigarh Chhattisgarh and…Dadra Delhi Goa Gujarat Haryana Himachal… and…Jammu Jharkhand Karnataka Kerala Ladakh Lakshadweep Madhya… Maharashtra Manipur Meghalaya Mizoram Nagaland Odisha Puducherry Punjab Rajasthan Sikkim NaduTamil Telangana Tripura PradeshUttar Uttarakhand BengalWest (blank) 5E+090 PradeshAndhra PradeshArunachal Assam Bihar Chandigarh Chhattisgarh Nagar…andDadra Delhi Goa Gujarat Haryana PradeshHimachal and…Jammu Jharkhand Karnataka Kerala Ladakh Lakshadweep PradeshMadhya Maharashtra Manipur Meghalaya Mizoram Nagaland Odisha Puducherry Punjab Rajasthan Sikkim NaduTamil Telangana Tripura PradeshUttar Uttarakhand BengalWest
and…Andaman
5) mRNA vaccine by Gennova Biopharmaceuticals Ltd (Pune) in collaboration with HDT Biotech Corporation (USA).
ADMINISTEREDDOSESVACCINE STATES AND UNION TERRITORIES OF INDIA Sum of Total Doses Administered Sum of Second Dose Administered Sum of First Dose Administered
The Indian government established the NEGVAC (National Expert Group on Vaccine Administration) for COVID 19. It was designed specifically to provide guidelines covering all aspects for the Covid Vaccine Administration in India. According to NEGVAC, it was determined that the COVID vaccines would be distributed initially to frontline workers, health personnel, and those over the age of 60. Several centres were established around India to make the vaccine more accessible. Vaccines were next made available to adults between the ages of 45 and 60, and then to those between the ages of 18 and 44.
Figure 3 State wise Confirmed vs Cured cases
CASESCOVIDOFNUMER STATE AND
IslandsNicobarandAndaman
Figure 3 provides a graphical representation of confirmed Covid cases and cured cases among those confirmed patients in various Indian states, with data spanning January to August 2021. A clustered column graph and a line graph are combined in Figure 3. The green colored clustered column graph depicts confirmed Covid Positive cases, while the blue colored line graph depicts the Cured Covid Patients in different Indian states and union territories. Maharashtra has the largest confirmed number of COVID patients as well as the greatest number of COVID cases that have been cured. With the use of Treemaps, this figure is further explained below.
TERRITORIES OF
Figure 4 Confirmed Covid Positive Cases 1,200,000,0001,000,000,000800,000,000600,000,000400,000,000200,000,0000
PradeshArunachal Bihar to…reassignedbeingCases Chhattisgarh and…HaveliNagarandDadra Delhi Gujarat PradeshHimachal KashmirandJammu Karanataka Kerala Lakshadweep Pradesh***Madhya Maharashtra*** Meghalaya Nagaland Puducherry Rajasthan NaduTamil Telengana Unassigned Uttarakhand UNION INDIA Confirmed Cured
International Journal for Research in Applied Science & Engineering Technology (IJRASET) ISSN: 2321 9653; IC Value: 45.98; SJ Impact Factor: 7.538 Volume 10 Issue VII July 2022 Available at www.ijraset.com 4435©IJRASET: All Rights are Reserved | SJ Impact Factor 7.538 | ISRA Journal Impact Factor 7.894 |
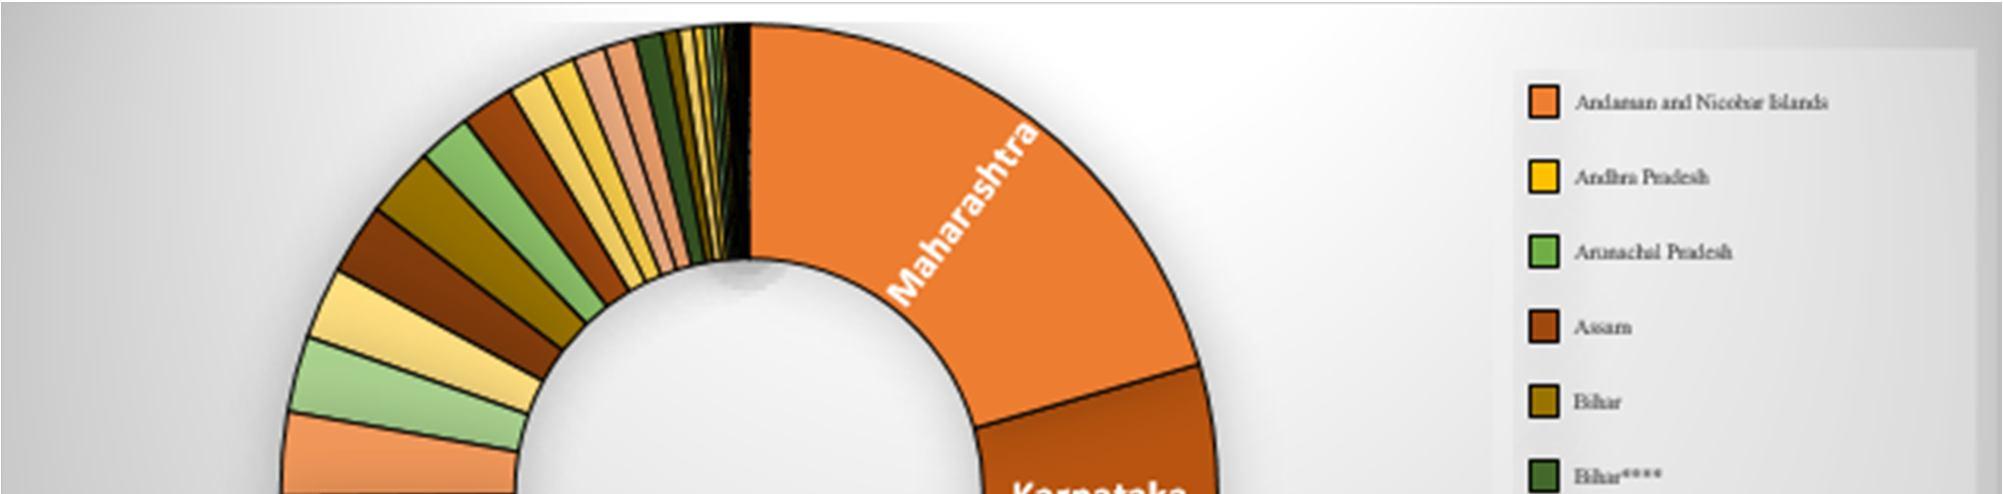
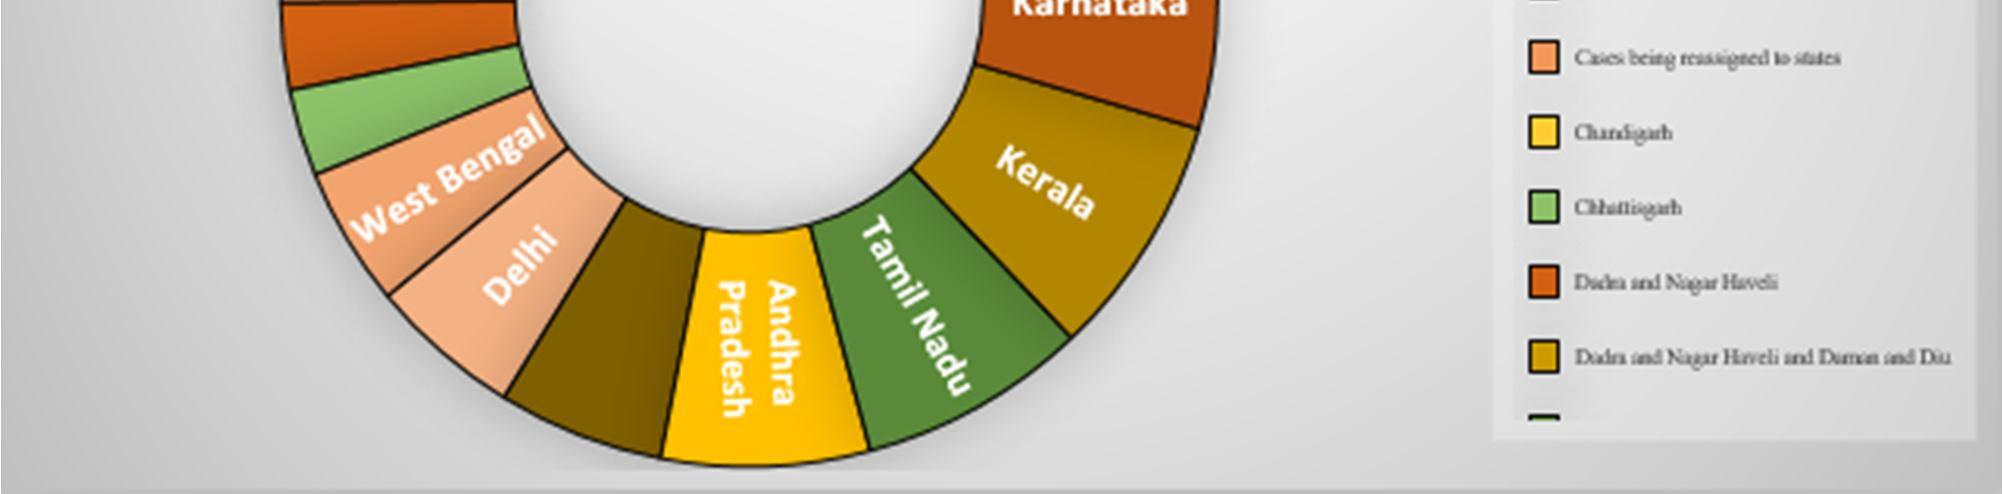
Figure 5 shows a tree map of treated COVID patients from the confirmed COVID 19 cases depicted in Figure 4. We may predict that the state of Maharashtra has the greatest number of healed COVID cases based on the sizes of the rectangles in the preceding graphic.
Figure 6: Number of Deaths of Covid Cases
Figure 6 depicts the number of deaths caused by Covid 19 among the confirmed cases of Covid 19 in India's various states and union territories. Based on the diameters of the rectangles, we may deduce that Maharashtra has the largest number of deaths among the confirmed covid positive cases in India.
International Journal for Research in Applied Science & Engineering Technology (IJRASET) ISSN: 2321 9653; IC Value: 45.98; SJ Impact Factor: 7.538 Volume 10 Issue VII July 2022 Available at www.ijraset.com 4436©IJRASET: All Rights are Reserved | SJ Impact Factor 7.538 | ISRA Journal Impact Factor 7.894 |
Figure 4 shows a tree map of confirmed COVID 19 positive cases from various Indian states and union territories. A tree map is a way for showing hierarchical data that uses nested objects, usually rectangles, to display it. We can see that Maharashtra has the most verified COVID cases, with 19, followed by Karnataka, Uttar Pradesh, and so on, by comparing the sizes of the rectangles. Similarly, the number of verified COVID positive cases is lowest in Daman and Diu.
Figure 5 : Number of Cured Covid Cases
International Journal for Research in Applied Science & Engineering Technology (IJRASET) ISSN: 2321 9653; IC Value: 45.98; SJ Impact Factor: 7.538 Volume 10 Issue VII July 2022 Available at www.ijraset.com 4437©IJRASET: All Rights are Reserved | SJ Impact Factor 7.538 | ISRA Journal Impact Factor 7.894 | Figure 7 Count of Total Samples vs Count of Positive & Count of Negative Cases
In Figure 7, the orange bar represents the total number of samples collected, the yellow bar represents the number of positive instances, and the green bar represents the number of negative cases from April 2020 to August 2021. It depicts a comparison study that compares the number of total samples to the number of positive and negative cases. According to the graph above, the number of positive instances is largest in July 2020 and lowest in August 2021, whereas the number of negative cases is highest in May 2020 and lowest in August 2021. Furthermore, we can see that the number of positive cases in 2021 is lower than in 2020 due to the Covid Vaccination Drive. Table 1 contains a tabular representation of Figure 4 that provides a detailed perspective of the above graphical representation.
RowLabels Count of Total Samples Count of Negative Count of Positive AndamanandNicobarIslands 453 1 430 2020 232 1 231 2021 221 199 AndhraPradesh 488 436 123 2020 266 237 123 2021 222 199 ArunachalPradesh 477 428 116 2020 255 254 116 2021 222 174 Assam 469 48 114 2020 247 48 114 2021 222 Bihar 489 1 126 2020 267 1 126 2021 222 Chandigarh 479 478 127 2020 264 264 127 2021 215 214 Chhattisgarh 482 63 126 2020 260 63 126 2021 222 120010008006004002000 <01-04-2020 2021 2021 2021 2020 2021 2020 2021 2020 2021 2020 2021 2020 2021 2020 2020 2020 2020 (blank) Jan Feb Mar Apr May Jun Jul Aug Sep Oct Nov Dec Count of TotalSamples Count of Positive Count of Negative

International Journal for Research in Applied Science & Engineering Technology (IJRASET) ISSN: 2321 9653; IC Value: 45.98; SJ Impact Factor: 7.538 Volume 10 Issue VII July 2022 Available at www.ijraset.com 4438©IJRASET: All Rights are Reserved | SJ Impact Factor 7.538 | ISRA Journal Impact Factor 7.894 | DadraandNagarHaveliandDamanandDiu 170 170 151 2020 170 170 151 Delhi 489 22 123 2020 267 22 123 2021 222 Goa 483 2 125 2020 261 2 125 2021 222 Gujarat 487 95 171 2020 267 95 171 2021 220 Haryana 492 341 148 2020 270 270 147 2021 222 71 1 HimachalPradesh 488 487 128 2020 266 266 128 2021 222 221 JammuandKashmir 489 489 129 2020 267 267 129 2021 222 222 Jharkhand 484 483 416 2020 263 263 220 2021 221 220 196 Karnataka 491 108 131 2020 269 108 131 2021 222 Kerala 497 73 307 2020 275 73 275 2021 222 32 Ladakh 294 249 93 2020 175 161 93 2021 119 88 Lakshadweep 195 2021 195 MadhyaPradesh 492 411 140 2020 270 270 130 2021 222 141 10 Maharashtra 488 195 196 2020 266 195 196 2021 222 Manipur 406 80 2020 193 80 2021 213 Meghalaya 409 346 106
International Journal for Research in Applied Science & Engineering Technology (IJRASET) ISSN: 2321 9653; IC Value: 45.98; SJ Impact Factor: 7.538 Volume 10 Issue VII July 2022 Available at www.ijraset.com 4439©IJRASET: All Rights are Reserved | SJ Impact Factor 7.538 | ISRA Journal Impact Factor 7.894 | 2020 212 150 106 2021 197 196 Mizoram 465 2 125 2020 260 2 125 2021 205 Nagaland 484 69 130 2020 264 69 130 2021 220 Odisha 492 13 142 2020 270 13 142 2021 222 Puducherry 478 464 276 2020 257 257 223 2021 221 207 53 Punjab 491 51 132 2020 269 51 132 2021 222 Rajasthan 491 263 134 2020 269 263 134 2021 222 Sikkim 413 64 93 2020 229 64 93 2021 184 TamilNadu 491 83 135 2020 269 83 135 2021 222 Telangana 419 30 75 2020 200 30 75 2021 219 Tripura 447 444 431 2020 248 245 237 2021 199 199 194 UttarPradesh 490 69 121 2020 268 68 121 2021 222 1 Uttarakhand 491 490 132 2020 269 269 132 2021 222 221 WestBengal 493 1 130 2020 271 1 130 2021 222 Grand(blank)<01042020Total 16336 6969 5662 Table 1 Tabular Representation of Figure 5
Figure 9 Sum of Individuals Vaccinated based on Age Groups
Figure 10 Daily Vaccination Grouped Age Wise
DosesofSum Administered Months 50000000001E+091.5E+092E+092.5E+09
The Government of India announced age slabs for the smooth movement of vaccination drive. The age slabs were 60+ Years, 45 60 Years, and 18 44 Years. Based on this, Figure 6 shows the graphical representation of individuals vaccinated from January 2021 to August 2021. The Green bar shows vaccination of individuals aged 60+ years; Blue bar shows vaccination of individuals aged 45 60 years; and the yellow bar shows the vaccination of individuals aged 8 44 years. We can see from the representation that maximum number of individuals were vaccinated in the month of June. If we look deeper into the representation, we can see that the maximum number of individuals vaccinated are of the age group 45 60. One point to note here is that, since the vaccination drive in India started in phases and that the vaccination of individuals aged between 18 44 years were at the last, the number of individuals vaccinated is therefore less.
International Journal for Research in Applied Science & Engineering Technology (IJRASET) ISSN: 2321 9653; IC Value: 45.98; SJ Impact Factor: 7.538 Volume 10 Issue VII July 2022 Available at www.ijraset.com 4440©IJRASET: All Rights are Reserved | SJ Impact Factor 7.538 | ISRA Journal Impact Factor 7.894 |
Figure 10 represents the line graph of daily vaccinations of individuals grouped Age wise as allocated by the government.
Figure 8 Monthly Sum of doses Administered of Covishield & Covaxin
Figure 8 displays the monthly sum of Covaxin and Covishield dosages given from January to August 2021. The green line graph indicates the total number of Covishield vaccine doses administered, whereas the blue line graph depicts the total number of Covaxin doses administered. It is a comparison of the two doses provided. The aggregate of each dose grows from January to July, then declines in August. The figure above shows that the total number of Covishield vaccine doses administered is more than the total number of Covaxin doses administered. Furthermore, we can forecast that the month of July would have the highest total of all doses provided.
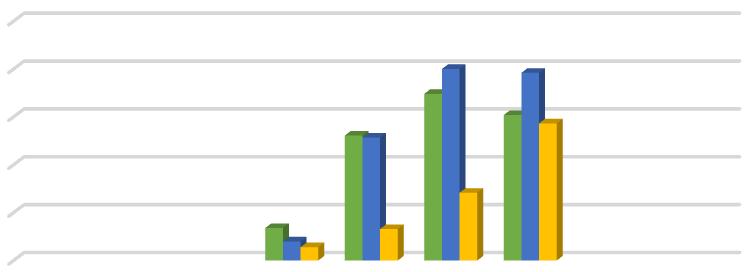
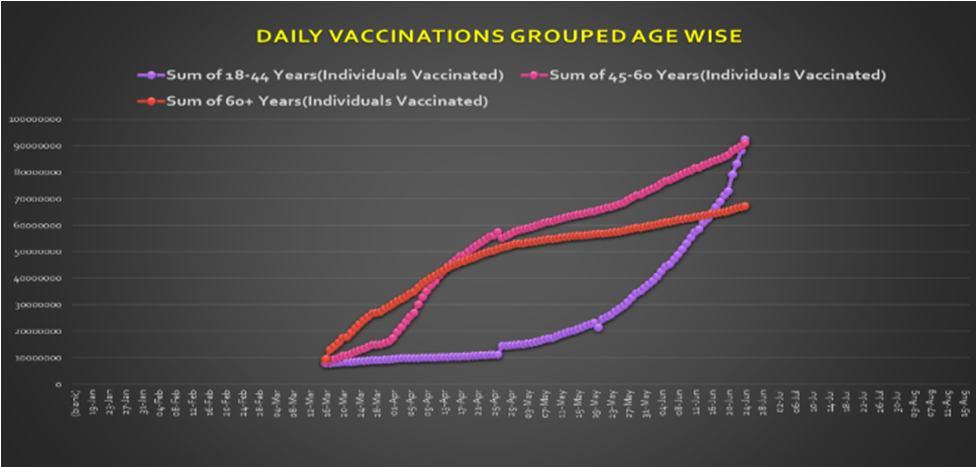
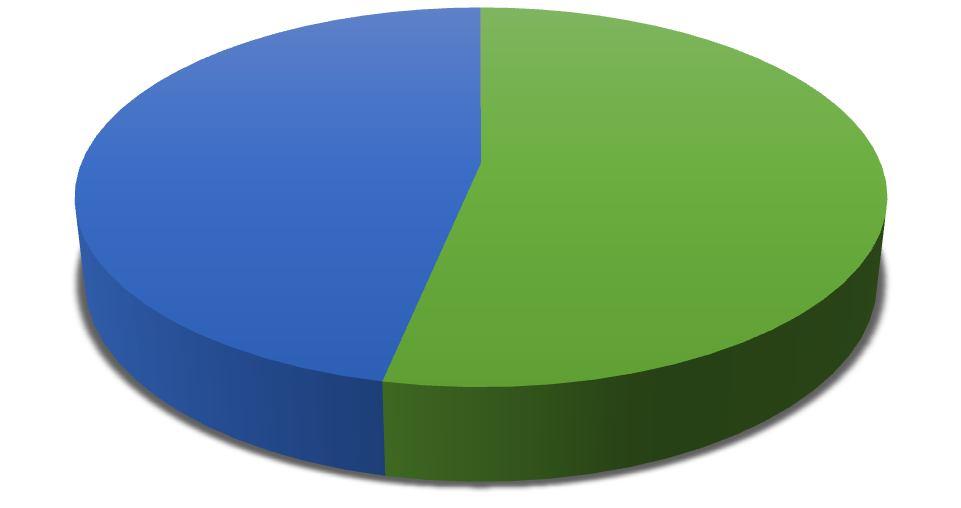
Figure 11 Individuals Vaccinated based on Gender
Sum
Implementing mass vaccination in a country with a large population, such as India, is undoubtedly a difficult assignment for the government. India, on the other hand, was able to overcome the obstacle by efficiently managing the immunisation drives. The federal government directed those states begin teaching worried healthcare workers in the correct use of vaccines. Groups were constituted and established for the scientific guidance on the vaccination programme. National Expert Group on Vaccine Administration for COVID 19 (NEGVAC) was constituted in August 2020, to formulate comprehensive action plan for vaccine administration (2021). National Task Force for Focused Research on Corona Vaccine was established in April 2020 to guide the process for coronavirus vaccine development, encourage domestic Research & Development of Drugs, Diagnostics and Vaccines. An Empowered Group on Vaccine Administration for COVID 19 (EGVAC) has also been constituted in January 2021, to facilitate optimal utilization of technology so as to make COVID vaccination all inclusive, transparent, simple and scalable, headed by CEO, National Health Authority. National Technical Advisory Group on Immunization (NTAGI), through its Standing Technical Sub Committee (STSC) and COVID 19 Working Group, has been providing advice on technical matters with respect to COVID 19 vaccination (mohfw.gov.in, 2020). The National Informatics centre under the Ministry of Electronics and Information Technology developed a mobile application named Aarogya Setu on 6 July 2020. It is an Indian COVID 19 contact tracing, syndromic mapping and self assessment digital service app. This app is available in 12 different languages. It is a tracking app which takes into account the GPS and Bluetooth features of ones device to determine the risk if one has been within six feet of a Covid 19 infected person, by scanning through a database of known cases across India. Using location information, it determines whether the location one is in belongs to one of the infected areas based on the data available. The app crossed 5 million installations within three days of its launch. It was revealed that this app has been able to identify more than 3,000 hotspots in 3 17 days ahead of time. Similarly , the Co Win Software is a one of a kind digital app that allows individuals to apply online for vaccine slots using their mobile number and unique ID such as Aadhar No., Voter ID, and so on, and book the closest place accessible to them without having to drive far to obtain the vaccine. It is an Indian government web portal for Covid 19 vaccination registration, owned and operated by India’s Ministry of Health and Family Welfare. It is available in 12 different languages. It was launched on 16 January 2021. The platform has been integrated in the Aarogya Setu App. After successfully receiving the vaccine, the individual could download the vaccination certificate, which included information such as the name of the vaccine taker, the name of the vaccine giver, the location and date on which the individual received the vaccine dose (first/second), and the date on which the individual is eligible to receive the next dose. of
International Journal for Research in Applied Science & Engineering Technology (IJRASET) ISSN: 2321 9653; IC Value: 45.98; SJ Impact Factor: 7.538 Volume 10 Issue VII July 2022 Available at www.ijraset.com 4441©IJRASET: All Rights are Reserved | SJ Impact Factor 7.538 | ISRA Journal Impact Factor 7.894 |
Administered)(DosesMale53% Sum of Administered)(DosesFemale47% Sum Administered)Transgenderof(Doses0%
Figure 11 illustrates the total number of people vaccinated and differentiated by gender, i.e., male and female, from January 2021 to August 2021with the help of a pie chart. We can infer from the preceding figure that the number of males vaccinated is greater than the number of females vaccinated, i.e. 53% Males have been vaccinated while 47% Females got vaccinated according to the data used.
VI. DISCUSSION
VII. CONCLUSION
International Journal for Research in Applied Science & Engineering Technology (IJRASET) ISSN: 2321 9653; IC Value: 45.98; SJ Impact Factor: 7.538 Volume 10 Issue VII July 2022 Available at www.ijraset.com 4442©IJRASET: All Rights are Reserved | SJ Impact Factor 7.538 | ISRA Journal Impact Factor 7.894 |
REFERENCES
[3] Forni, G. and Mantovani, A., 2021. COVID 19 vaccines: where we stand and challengesahead. Cell Death &Differentiation, 28(2), pp.626 639.
X. CONFLICT OF INTEREST
VIII. COMPETING INTERESTS
As of now, three vaccines can be registered on the platform Covishield, Covaxin and Sputnik V. Currently, two doses of each vaccine, Covaxin and Covishield, are administered. Individuals aged 18 and up are successfully receiving free vaccinations at various vaccination centres. Trials for vaccine candidates for people under the age of 18 are currently underway, so that children under the age of 18 can receive the vaccination without losing their immunity.
IX. AUTHOR CONTRIBUTION
Both the authors conceived of the presented idea. U.B. developed the theory and performed the computations. U.B. and M.N. verified the analytical methods. M.N. encouraged U.B. and supervised the findings of this work. Both the authors discussed the results and contributed to the final manuscript. M.N. provided critical feedback and helped shape the research, analysis and manuscript.
This article does not contain any studies with human participants or animals performed by any of the authors.
The purpose of this research is to examine the COVID vaccination in India. According to the graphs we utilised, Madhya Pradesh has the maximum total doses provided with Uttar Pradesh at second number and Gujarat at third number of maximum of Total Doses administered. While Lakshadweep has the lowest of total doses administered. Furthermore, Uttar Pradesh has the most number first dosages administered with Maharashtra at second position and Gujarat at third. Maharashtra has the highest number of second doses administered. Maharashtra has the most verified positive COVID cases, as well as the most cured patients. It is observed from our EDA that approximately 91% of the patients who tested positive for Covid 19 virus were cured after taking precautionary measures like being in quarantine for at least fourteen days, adopting a better lifestyle for boosting immunity, wearing masks properly, sanitising regularly etc. Due to proper implementation of the Covid guidelines, the death rate recorded is roughly ranges from 1.12% to 2.12%, in different states of India. Moreover, July 2021 has recorded the highest numbers of total samples collected. Of these total samples collected, the positivity rate is roughly recorded as 51.44% whereas the negativity rate has been recorded as roughly 39.95%. From Figure 8 we conclude that the doses of Covishield vaccine administered are significantly higher than the doses of Covaxin vaccine administered. The July month has been recorded with highest number of both Covaxin and Covishield vaccine administered. Another result drawn from our data analysis is that people aged between 45 60 years were more likely to get themselves vaccinated as compared to individuals aged between 18 44 years and 60+ years or we can say that maximum number of vaccination given to people are of age group 45 60. In addition to this, the percent of Male gender vaccinated (53%) are more than the Females vaccinated (47%). Moreover, from our Figure 10, we can see that the graph for the individuals vaccinated in the age group 18 44 shows an exponential growth. Also, from Figure 10, we are able to see that graphs for the individuals vaccinated in the age group shows a logarithmic graph. The purpose of this analysis is to highlight the vaccination strategy adopted by the Government in the midst of the Covid pandemic that too in a densely populated country, India where the novel Corona Virus can be easily transmitted from one person to another. India's vaccination campaign is the fastest to reach 10 million vaccines. The drives have been supervised at the national, state, and district levels to ensure that they run smoothly. People who have received both doses of the COVID vaccination, whether Covishield or Covaxin, are protected from the COVID virus, according to the government, but they must continue to follow COVID guidelines for best outcomes. Our analysis showed that people who got themselves vaccinated with both the doses have lesser chances of death, maximum people come under the age group of 45 60 years.
[1] Wang, J., Peng, Y., Xu, H., Cui, Z. and Williams, R., 2020. The COVID 19 Vaccine Race: Challenges and Opportunities in Vaccine Formulation. AAPS PharmSciTech, 21(6) [2] Dai, H., Han, J. andLichtfouse, E., 2020. Whois running faster, the virus or the vaccine?. Environmental Chemistry Letters, 18(6), pp.1761 1766.
[4] Kumar, V., Pandi Perumal, S., Trakht, I. and Thyagarajan, S., 2021. Strategy for COVID 19 vaccination in India: the country with the second highest populationand number of cases. npj Vaccines, 6(1).
The authors declare that there are no competing interests.
[8] Ramatillah, D. and Isnaini, S., 2021. Treatment profiles and clinical outcomes of COVID 19 patients at private hospital in Jakarta. PLOS ONE, 16(4), p.e0250147.
[10] Florindo, H., Kleiner, R., Vaskovich Koubi, D., Acúrcio, R., Carreira, B., Yeini, E., Tiram, G., Liubomirski, Y. and Satchi Fainaro, R., 2020. Immune mediatedapproaches against COVID 19. NatureNanotechnology, 15(8), pp.1 16. [11] Mohfw.gov.in. 2022. The World's Largest VAACCINATION Drive. [online] Available at: <https://www.mohfw.gov.in/pdf/COVIDVaccinationBooklet14SEP.pdf> [Accessed10 March2022].
International Journal for Research in Applied Science & Engineering Technology (IJRASET) ISSN: 2321 9653; IC Value: 45.98; SJ Impact Factor: 7.538 Volume 10 Issue VII July 2022 Available at www.ijraset.com 4443©IJRASET: All Rights are Reserved | SJ Impact Factor 7.538 | ISRA Journal Impact Factor 7.894 | [5] Sharma, O., Sultan, A., Ding, H. and Triggle, C., 2020. A Review of the Progress and Challenges of Developing a Vaccine for COVID 19. Frontiers in Immunology, 11. [6] Samaddar, A., Gadepalli, R., Nag, V. and Misra, S., 2020. The Enigma of LowCOVID 19 Fatality RateinIndia. FrontiersinGenetics, 11. [7] Kaplan, R. and Milstein, A., 2021. Influence of a COVID 19 vaccine’s effectiveness and safety profile on vaccination acceptance. Proceedings of the National Academy of Sciences, 118(10).
[9] El Elimat, T., AbuAlSamen, M., Almomani, B., Al Sawalha, N. and Alali, F., 2021. Acceptance and attitudes toward COVID 19 vaccines: A cross sectional study from Jordan. PLOS ONE, 16(4), p.e0250555.