
Sentiment Analysis of User Youtube CommentsUsingClassifierAlgorithm
Shivani WadhwaniOPEN ACCESS
Manuscript ID:
AG-2023-1002
Volume: 2
Issue: 1
Month: February
Year: 2023
ISSN: 2583-7117

Published: 13.02.2023
Citation:
Shivani Wadhwani “Sentiment Analysis of User Youtube Comments Using Classifier Algorithm” International Journal of Innovations In Science Engineering And Management, vol. 2, no. 1, 2023, pp. 25
32
This work is licensed under a Creative Commons Attribution-ShareAlike 4.0 International License
Research Scholar, Computer Science Engineering, Technocrats Institute of Technology, Bhopal (M.P.)
Abstract
“Sentiment Analysis” is the process of extracting other people's (speaker or writer) opinions from a given original source (text) utilizing natural language processing (NLP), linguistics computing, & data mining. In sentiment analysis, sentiment classification of various parameters such as comments, reviews and products has become a significant application. For the interpretation of meaning of each and every comment, “text mining approach” is used. For understanding the meaningfulness of any content, it is important to classify them into positive and negative comments on the basis of user opinion.
In the present study, researcher has performed sentiment analysis on YouTube comments on the most popular topics nowadays by using Classifier techniques.
Keyword: Machine Learning, Support Vector Machine, Data mining, Sentiment analysis
Introduction
Opinion mining is the other name used for sentiment analysis. “Sentiment analysis” is the procedure used to determine the emotional tone behind the series of words. It is also used to understand the opinions, emotions, attitude expressed on the online platform. In social media monitoring, sentiment analysis is mainly used to obtainthe overviewof wider public opinionregardingparticular topic. Sentiment analysis can be used in broad and powerful way. All around the world, organizations are using the ability to extract insights from the social data. The correlation of shift in stock market is shown by the shifts in sentiment on social media. Sentiment analysis can rapidly understand the consumer attitude as well as it can react accordinglybut it does not mean that it is a perfect science at all. Human languages are considered to be the complex language. It is important to make a machine learn the various grammatical nuances, slangs, misspellings which occur online are not an easy way. It is also not easy to make the machine learn the way context canaffect the tone. For example, a sentence is considered here: “Myflight‘s beendelayed.Brilliant!‖”.Somepeople willthinkthatthe personmightbe sarcastic. As we know people do not have good experience on having a delayed flight. So, on this particular sentence by applying the contextual understanding as negative, the sentiments can be analyzed. Machine can easily analyze the word brilliant‖ and it can be observed as positive. This is comparable to how a linguist specialist would educate a machine how to perform basic sentiment classification. The dictionary that robots use to understand emotions will grow as language changes. Language is evolving faster with the usage of social media. 140 character constraints, the urge to be brief and other dominant memes have affected the ways people interact with each other online. Many challenges are coming up with the course. Human beings apply criteria to all words and expressions that indicate positive or negative sentiments, taking into account how circumstance may impact the tone of the information. The software can tell that the first statement below is positive as well as the second is negative thanks to well defined rules.
After studying the above example, the limitations of the sentiment analysis are also observed as it is not exactly used as the 100percent accurate marker. A human eye is always needed to watch it as it is prone to human errors. The extraction of the attitude or mood represented in a block of unstructured data in connection to the subject of the document being studied is called “sentiment extraction (SE)”. There are various steps taken for the extraction as follows: Adjectives and adverbs are used which determines the polarity of the sentence at the very first level. Some of the positive words which can be used as rating are: good‖, ‖awesome‖, ‖excellent‖ and soon. On the other hand, some of thenegative wordsare:―bad‖,―poor‖,―abomination‖and so on.
1. Humans have contextual polarityofthe rating word at the very next level, which takes into consideration local modifiers that come before or after the rating word.
2. Such rating words are tied to some entity, usually the topic of some conversation, at the greatest degree. For instance, in the line "The gouda was awful," the entity is "gouda," as well as a negative feeling is conveyed against it.
Why Sentiment Analysis?
The utilization of “natural language processing”, identification through computational linguistics, text analysis and extraction of subjective information is defined as sentiment analysis. The other name used for Sentiment analysis is opinion mining. The main application of sentiment analysis is in reviews & social media sites. It is used from marketing to customer service. The attitude of the speaker or the writer can be easily determined through sentiment analysis for some particular topics or complete contextual polarity of the document. Attitude can be defined astheaffective state, emotionalstate,evaluationofhisor her judgement or emotional communication. Social networking sites, blogs on World Wide Web are creating huge amount of data every day.
Essential information & data regarding business profits and other important factors of scientific and commercial industries is contained in sentiment analysis. “Sentiment analysis” is needed because it is not possible to extract the information or keep manual tracking on them. Sentiments or
opinion of the users on a particular product, subject or area are expressed which is known as Sentiment Analysis. Computational linguistics, natural language processings and also the text analytics are using sentiment analysis for identification of subjective data from the base or primary data. The sentiments are divided into categories such as: positive or negative. So, the general attitude is determined of the speaker or writer according to the topic.
Objectives of Research
Acquisitions of raw youtube data and converts into standard datasets.
To analyze the content from youtube.
Prediction of content from youtube.
Content Classification and build the opinions of particular events.
Develop Sentiment Analysis Tool
Literature Review
For different aspects of“youtube video features”, several researches have beenperformed [1].Decisionis made onthe basis of one of the important comment among several comments on any specific video [2]. The video objects are annotated by these comments [3, 4]. The behaviour of the user is also analyzed through the comments and it can be used to find the troll users [5]. The sentiments can be analyzed for the comments and the positivity & negativity of the sentiments can also be analyzed [6]. The videos are categorized into different categories on the basis of comments on particular videos [7].
Sentiment Analysis is a methodology for analysing information in the form of text and determining the substance of thoughts from the content. Emotion mining or feeling mining are the other name given to Sentiment Analysis. YouTube, Facebook and Twitter are some of the social media platforms which are also known as “On-line communication channels” and nowadays these channels are creating so much interest in human life. [8] On these social media channels, people share their thoughts, feeling etc. We share similar on opinion mining or feeling evaluation, which is an area of web machine learning and Data Mining, in this research report.
It is important for airline operators to get feedback from their customers particularly for operational planning and strategic planning. To get such type of feedbacks, social media sites are becoming trending. On the other hand, social mediasitesarenottrivialtaskfortheanalysis,categorization and generation of useful data. The capabilities of “Naïve
Bayes classifier” are investigated in the present study for the sentiment analysis of “airline image branding”. The impact of data size is also examined in the present study on the accuracyoftheclassifier.Forsomeonlineconversations,the data is collected according to the incident for airline’s security operations which are managed by the passengers in a case study. A loss of $1 billion was observed about the incident for the company’s corporate value. From Twitter, the data was collected and it was processed & analyzed through “Naïve Bayes Classifier”. [9]
“Multi-label text classification” method is used for sentiment analysis of Hinglish comments on YouTube using Deep learning. Different parameters were used with “Multilayer perceptron (MLP)” to investigate several sentiments in the comments. MLP has been modelled and estimated by making variations in optimizers, neurons, activation functions and several other engineering techniques. Some of the other engineering methods are: customized embedding, pre-trained embedding, tf-idfand count vectorizer. [10]Two different datasets were used for performing these experiments such as: “Nisha Madhulika’s dataset” and “Kabita’sKitchendataset”.Fromtheresults,it wasobserved that 98.53percent of accuracy was observed in Kabita’s Kitchen and 98.48percent accuracy was observed for Nisha Madhulika in MLP. During the present study, careful tests were performed for the evaluation of the experiment.
Methodology
Machine learning techniques
Machine learning (ML) is a data analytics technique which acquires knowledge from the previous practice and provides information directly to the systems without being programmed explicitly. Definition says “a computer program is said to learn from experience E with respect to some task T and some performance measure P, if its performance on T, as measured by P, improves with experience E”. ML has become a key technique for solving problem and for making better decisions and predictions. Mainly we used machine learning techniques every day to make significant decisions in stock trading, medical diagnosis, weather forecasting, and many more. Although the term Machine Learning (ML) was developed by author [26], its advancement and expansion has never been more instrumental than it is today. The prospect of using machine learning for decision making in numerous fields has a important function in the upliftment of the people. Though specialized techniques of machine learning such as NN and SVM are already established, a great deal of effort is being put by the researchers to cater the rising needs of citizens.
Unsupervised learning concepts don’t have any target or outcome variable in the training datasets to draw inferences. Since the samples given to the learner are unlabeled, there is no evaluation of the accuracy of the output by the relevant algorithm. It is commonly used for clustering problems.. Some of the examples that come under this category are Apriori Algorithm and K-Means. Reinforcement learning algorithms uses previous practice to acquire the best knowledge and convert it in taking appropriate decisions in business. In this example, the machine has been introduced to a training environment that uses trial and error to determine which action would offer the highest reward. “Markov Decision Process” is the example of reinforcement learning. However, there are number of techniques present for machine learning and they can be categorized on the basis of applicability to the problems belonging to different domains.
Machine learning techniques such as: classification, clustering and regression can be used to address the categories of problems. On the basis of supervised learning, regression and classification can be categorized on the other hand; clustering is defined as the unsupervised learning. Forecasting outcome is considered as regression if it is continuous. Boolean type is used to represent the forecasting output. In the same groups, clustering is defined as the arrangement alike attributes.
The authors [27] explained basically data analytics, whichis also called analysis of data, maybe categorized into the following four types, also shown in Figure 3.3, considering complexity and value addition.

Descriptive analytics juggles raw historical data to draw conclusion about past and the output is represented by using only right or wrong without stating the reason. It basically handles quarries of type “what happened”.
Diagnostic analytics tries to locate interdependencies and classify the patterns. It handles the question of type “why something happened”, historical data are measured against other data.
Predictive analytics applies the conclusion drawn from above two categories for identifying about the trends and behaviour of data and predicts the future.
Prescriptive analytics is based on the concept of optimization that helps to understand the uncertainties to make better decisions and achieve the best outcomes.

Result And Discussion
Architecture is getting comments from youtube API and directlyimporting to CSV _le .Data cleaning and stop words are extracted from comments so that each word of sentiment calculated and printed their sentiment scores on the graph.
Library Used
Library (devtools)
Library (vosonSML)
Library (magrittr)
Library (tuber)
Library (dplyr)
Library (ggplot2)
Library ("tm")
Library ("SnowballC")
Library ("wordcloud")
Library ("RColorBrewer")
Library (tidytext)
Library (tidyverse)
Library (httr)
Library (SocialMediaLab)
Library (syuzhet)
Library (psych)
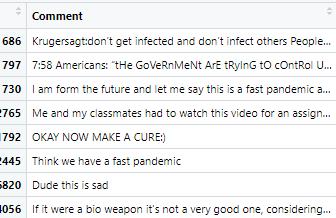
Total video comments extracted: 6846
Getting Youtube comments from youtube Api with the help of api key.
Deriving the sentiment of each comment: Sentiment was calculated for each comment using the sentiment score of the terms in the comment. A comment'ssentimentisequivalenttothetotalofthe sentiment scores for each of the terms in the comment. The _le nrc . containing a list of precomputed sentiment scores was used to determine term score in each tweet.
Deriving the sentiment of new terms: The sentiment for the terms that do not appear in the file nrc was computed based on the overall tweet sentiment deduced in step 2.
Computing term frequency: Frequency of each term was calculated as of occurrences of the term in all comments]/[ of occurrences of allterms in all comments].
# Google developer API key

api_key <-"*******************"

youtubeAuth <- Authenticate("youtube", apiKey = api_key)

#Video ID video <- (c("BtN-goy9VOY"))
Network Analysis
Network analysis is becoming a widely used tool for scholars specially to deal with the complexities of interrelation between actors as well as all sorts. Instead of seeing actors as isolated entities, Network analysis provides a placement of significant on the relationship among the actors. For network analysis, there are numerous applications and the network graph is also created for example: cytoscape and gephi. In network analysis, R has been developed as the powerful tool; however it is not particularly designed for the same. In comparison with the “strength of R”, the stand-alone network analysis software is a threefold. Reproducible research is enabled by R at first which is not possible with GUI. Robust tools are provided by the data analysis power of R for the manipulation of data especially for network analysis. R is transformed into a complete network analysis tool with the ever growing range of packages designed. Statement suite of igraph and packages are included in the essential network analysis packages for R.
Nodes and Edges
“Multitude of separate entities” as well as their connection is the two essential aspects of the network. In this, the vocabulary used might be inconsistent and even technical among the packages, softwares and disciplines. Either nodes or vertices, the entities are considered for the graph and the connections are performed as links or edges. Nomenclature of edges and nodes are mainly used here
except the discussed packages which were using different vocabulary. The data must be in particular way in the networkanalysis packages so that special type of objects can be created which are utilized in each package. Adjacency matrices, sometimes termed as socio matrices, are used to create the object classes network, igraph, and tidygraph.
Edgeandnodelists
In 1585, Daniel van der Meulen received letters to form a network object from the database. In the present study, the researcher also making both edge list & node list. The data frame of letters is manipulated through the necessitated use of the dplyr package which was sent to Daniel and was divided into two different fragments consisting of structure of edge and node lists.
Network Objects
Tidygraphy and igraph are closely related with the network object classes. It is not difficult to translate in betweenthe igraphobject and networkobject. It is important to keep both the packages and objects separately. It will be best if only one package loaded at one time because capabilities of network can overlap the igraph.
Performance Measures
Precision, accuracy and recall performance evaluation are used for the analysis of accuracy value of the SVM method’s results compared with the confusion matrix method. Confusion Matrix is used for the evaluation which includes False Negative Rate (FN rate), True Positive Rate (TP rate), False Positive Rate (FP Rate) and True Negative Rate (TN Rate). These are the indicators used here. For positive class, TP rate is used and for negative class TN rate is used. FP rate is classified as positive class however it is class negative. FN rate is classified as the negative class however it is a class positive. [28]

In performance measures discuss the performance evaluative measures to youtube datasets. Following are the evaluative measures of classifiers. These evaluative measures find the goodness of classifier and suitability of data.
True Positives (TP): TP are the predicted values here which means that value of actual class is YES as well as the value of predicted class is also YES. For example: If the same thing is indicated by actual class and the predicted class that this passenger survived.

True Negatives (TN): TN are the predicted values here which means that value of actual class is NO as well as the value of predicted class is also NO. For example: Actual class and predicted class will say the same thing such as passenger did not survive. When actual class contradicts with the predicted class then false positive and false negatives are obtained.
False Positives (FP): FP are the predicted values here which means that value of actual class is NO and the value of predicted class is YES. For example: Passenger did not survive according to actual class, but passenger will survive according to predicted class.
False Negatives (FN): FN are the predicted values here which means that value of actual class is YES and the value of predicted class is NO. If actual class value indicates that the passenger survived and the predicted class states that passenger will die.
The following section describes the parameters for the calculation of Accuracy, Precision and Recall.
Accuracy: Accuracy is the ratio of correctly predicted observation and the total observations. It is considered as the most intuitive performance measure. People might thinkthat if they got high accuracy then their model is best. And yes accuracy is the great measure but only one condition when values of false positive and values of false negatives are almost same. So, it is important to evaluate the performance of the model by taking other parameters also in consideration.
Accuracy = TP+TN/TP+FP+FN+TN
Precision - The ratio of correctly observed positive observations of predicted class and the total number of observations of predicted class is defined as Precision. The challenge that this measure answers is how many of the passengers who were identified as having survived obviously did. The low false positive rate is related to high precision.
Precision = TP/TP+FP
Recall (Sensitivity) - The ratio between the predicted positive observations and the observations in actual class are defined as Recall. The answers provided by recall are: All the passengers who really survived and how many of them were labelled.
Recall = TP/TP+FN
Table 1: Accuracy Performance Measure
Conclusion
YouTube is defined as the source of comprehensive video information on the web. In all the social media sites, YouTube is one of the most popular sites. As on this site, users can directly interact with rating, sharing and commenting on videos.
Sentiment analysis model is proposed here for YouTube video comments. Naïve Baise Algorithm is also used here. The “neural network's output” is a categorization of negative, positive, or neutral sentiments.
However, it is still challenging for the researchers to classify the general events as well as detection of the sentiment polarities for the comments of the users. On this, huge work has been performed but still there is still a long way to overcome such issues.
Following are the problems emphasized in the present work to identify the polarity of the comments given by the YOUTUBE users.
Challenges in present sentiment dictionaries
Users are using informal language.
On the basis of community-created terms, sentiments are estimated.
Proper labels must be assigned to the events.
To attain satisfactory classification performances
Challenges involved in “social media sentiment analysis”.
In comparison with the statistical model, the results showed that this model achieved better accuracy. The range of classification accuracy is in between 70percent to 89percent.
References
1. S. Siersdorfer, S. Chelaru, J. S. Pedro, I. S. Altingovde and W. Nejdl, “Analyzing and mining comments and comment ratings onthe social web,”