
Stroke Prediction Using a Machine Learning Technique
Dr.Malathi.P Mr.Gokul.RDepartment of Mca Dhanalakshmi College of Dhanalakshmi College of Engineering and Technology Engineering and Technology
Department of Mca
Abstract: A stroke occurs when the blood supply to part of your brain is interrupted or reduced, preventing brain tissue from getting oxygen and nutrients. Brain cells begin to die in minutes. A heart attack occurs when blood flow to a part of the heart is blocked, usually by a blood clot. Without oxygenated blood, the heart muscle begins to die. A stroke is a brain attack, cutting off vital blood flow and oxygen to the brain. Stroke happens when a blood vessel feeding the brain gets clogged or bursts. Nowadays machine learning is applied to healthcare system where there is a chance of predicting the disease early. The main necessity of Artificial intelligence is data. The past dataset is collected and that dataset is used to build a machine learning model. The necessary pre processing techniques are applied like univariate analysis and bivariate analysis are implemented. The data is visualised for better understanding of the features and based on that a classification model is built by using machine learning algorithm and comparison of algorithms are done based on their performance metrics like accuracy, F1 score recall etc.
• They are not classifying stroke machine learning classification technique and not mention any accuracy results.
I. INTRODUCTION

Stroke has become a leading cause of death and long term disability in the world with no effective treatment. Deep learning based approaches have the potential to outperform existing stroke risk prediction models, but they rely on large well labeled data. Due to the strict privacy protection policy in health care systems, stroke data is usually distributed among different hospitals in small pieces. In addition, the positive and negative instances of such data are extremely imbalanced. Transfer learning can solve small data issue by exploiting the knowledge of a correlated domain, especially when multiple source of data are available. balanced stroke data. We have proposed a novel Hybrid Deep Transfer Learning based Stroke Risk Prediction (HDTLSRP) framework which consists of three key components: (1) Generative Instance Transfer (GIT) for making use of the external stroke data distribution among multiple hospitals while preserving the privacy, (2) Network Weight Transfer (NWT) for making use of data from highly correlated diseases (i.e., hypertension or diabetes), (3) Active Instance Transfer (AIT) for balancing the stroke data with the most informative generated instances. It is found that the proposed HDTL SRP framework outperforms the state of the art SRP models in both synthetic and real world scenarios.
2.1 Disadvantages:
• There are not using any artificial intelligence technique
• It can’t thereby better determine the regularity of stroke disease prediction data and achieve more accurate prediction results.

Proposed System:
Exploratory Data Analysis of pulmonary diseasePrediction
Stroke datasets from different sources would be combined to form a generalized dataset, and then different machine learning algorithms would be applied to extract patterns and to obtain results with maximum accuracy.
Data Wrangling
In this section of the report will load in the data, check for cleanliness, and then trim and clean given dataset for analysis. Make sure that the document steps carefully and justify for cleaning decisions.
Data collection
The data set collected for predicting given data is split into Training set and Test set. Generally, 7:3 ratios are applied to split the Training set and Test set.
Building the classification model
The predicting Stroke, ML algorithms prediction model is effective because of the following reasons: It provides better results in classification problem.
6.1 Advantages:
These reports are to the investigation of applicability of machine learning techniques for stroke prediction in operational conditions. Finally, it highlights some observations on future research issues, challenges, and needs.
ALGORITHM AND TECHNIQUES Algorithm Explanation
In machine learning and statistics, classification is a supervised learning approach in which the computer program learns from the data input given to it and then uses this learning to classify new observation. This data set may simply be bi class (like identifying whether the person is male or female or that the mail is spam or non spam) or it may be multi class too. Some examples of classification problems are: speech recognition, handwriting recognition, bio metric identification, document classification etc. In Supervised Learning, algorithms learn from labeled data. After understanding the data, the algorithm determines which label should be given to new data based on pattern and associating the patterns to the unlabeled new data.
Preparing the Dataset:
This dataset contains 5110 records of features. It is classified into 2 classes:
Normal
Stroke
Logistic Regression

It is a statistical method for analysing a data set in which there are one or more independent variables that determine an outcome. The outcome is measured with a dichotomous variable (in which there are only two possible outcomes). The goal of logistic regression is to find the best fitting model to describe the relationship between the dichotomous characteristic of interest (dependent variable = response or outcome variable) and a set of independent (predictor or explanatory) variables. Logistic regression is a Machine Learning classification algorithm that is used to predict the probability of a categorical dependent variable. In logistic regression, the dependent variable is a binary variable that contains data coded as 1 (yes, success, etc.) or 0 (no, failure, etc.).
In other words, the logistic regression model predicts P(Y=1) as a function of X. Logistic regression Assumptions:
Binary logistic regression requires the dependent variable to be binary.
For a binary regression, the factor level 1 of the dependent variable should represent the desired outcome.
Only the meaningful variables should be included.
The independent variables should be independent of each other. That is, the model should have little.
The independent variables are linearly related to the log odds.
Logistic regression requires quite large sample sizes.
Random Forest Classifier
Random forests or random decision forests are an ensemble learning method for classification, regression and other tasks, that operate by constructing a multitude of

decision trees at training time and outputting the class that is the mode of the classes (classification) or mean prediction (regression) of the individual trees. Random decision forests correct for decision trees’ habit of over fitting to their training set. Random forest is a type of supervised machine learning algorithm based on ensemble learning. Ensemble learning is a type of learning where you join different types of algorithms or same algorithm multiple times to form a more powerful prediction model. The random forest algorithm combines multiple algorithm of the same type i.e. multiple decision trees, resulting in a forest of trees, hence the name "Random Forest". The random forest algorithm can be used for both regression and classification tasks.
The following are the basic steps involved in performing the random forest algorithm:
Pick N random records from the dataset.
Build a decision tree based on these N records.
Choose the number of trees you want in your algorithm and repeat steps 1 and 2.
In case of a regression problem, for a new record, each tree in the forest predicts a value for Y (output). The final value can be calculated by taking the average of all the values predicted by all the trees in forest. Or, in case of a classification problem, each tree in the forest predicts the category to which the new record belongs. Finally, the new record is assigned to the category that wins the majority vote.
Naive Bayes algorithm:
The Naive Bayes algorithm is an intuitive method that uses the probabilities of each attribute belonging to each class to make a prediction. It is the supervised learning approach you would come up with if you wanted to model a predictive modeling problem probabilistically.
Naive bayes simplifies the calculation of probabilities by assuming that the probability of each attribute belonging to a given class value is independent of all other attributes. This is a strong assumption but results in a fast and effective method.
The probability of a class value given a value of an attribute is called the conditional probability. By multiplying the conditional probabilities together for each attribute for a given class value, we have a probability of a data instance belonging to that class. To make a prediction we can calculate probabilities of the instance belonging to each class and select the class value with the highest probability.
Naive Bayes is a statistical classification technique based on Bayes Theorem. It is one of the simplest supervised learning algorithms.Naive Bayes classifier is the fast, accurate and reliable algorithm. Naive Bayes classifiers have high accuracy and speed on large datasets.

Naive Bayes classifier assumes that the effect of a particular feature in a class is independent of other features. For example, a loan applicant is desirable or not depending on his/her income, previous loan and transaction history, age, and location.
Even if these features are interdependent, these features are still considered independently. This assumption simplifies computation, and that's
why it is considered as naive. This assumption is called class conditional independence.
an associated decision tree is incrementally developed. A decision node has two or more branches and a leaf node represents a classification or decision. The topmost decision node in a tree which corresponds to the best predictor called root node. Decision trees can handle both categorical and numerical data. Decision tree builds classification or regression models in the form of a tree structure. It utilizes an if then rule set which is mutually exclusive and exhaustive for classification. The rules are learned sequentially using the training data one at a time. Each time a rule is learned, the tuples covered by the rules are removed.
This process is continued on the training set until meeting a termination condition. It is constructed in a top down recursive divide and conquer manner. All the ttributes should be categorical. Otherwise, they should be discretized in advance. Attributes in the top of the tree have more impact towards in the classification and they are identified using the information gain concept.A decision tree can be easily over fitted generating too many branches and may reflect anomalies due to noise or outliers.
Decision Tree Classification:
It is one of the most powerful and popular algorithm. Decision tree algorithm falls under the category of supervised learning algorithms. It works for both continuous as well as categorical output variables.
Assumptions of Decision tree:
At the beginning, we consider the whole training set as the root.
Attributes are assumed to be categorical for information gain, attributes are assumed to be continuous.
On the basis of attribute values records are distributed recursively.
We use statistical methods for ordering attributes as root or internal node.
Decision tree builds classification or regression models in the form of a tree structure. It breaks down a data set into smaller and smaller subsets while at the same time


22. Module description:
Data Pre processing
Validation techniques in machine learning are used to get the error rate of the Machine Learning (ML) model, which can be considered as close to the true error rate of the dataset. If the data volume is large enough to be representative of the population, you may not need the validation techniques. However, in real world scenarios, to work with samples of data that may not be a true representative of the population of given dataset. To finding the missing value, duplicate value and description of data type whether it is float variable or integer. The sample of data used to provide an unbiased evaluation of a model fit on the training dataset while tuning model hyper parameters.
The evaluation becomes more biased as skill on the validation dataset is incorporated into the model configuration. The validation set is used to evaluate a given model, but this is for frequent evaluation. It as machine learning engineers use this data to fine tune the model hyper parameters. Data collection, data analysis, and the process of addressing data content, quality, and structure can add up to a time consuming to do list. During the process of data identification, it helps to understand your data and its properties; this knowledge will help you choose which algorithm to use to build your model.
A number of different data cleaning tasks using Python’s Pandas library and specifically, it focus on probably the biggest data cleaning task, missing values and it able to more quickly clean data. It wants to spend lesstime cleaning data, and more time exploring and modeling.
Some of these sources are just simple random mistakes. Other times, there can be a deeper reason why data is missing. It’s important to understand these different types of missing data from a statistics point of view. The type of missing data will influence how to deal with filling in the missing values and to detect missing values, and do some basic imputation and detailed statistical approach for dealing with missing data. Before, joint into code, it’s
important to understand the sources of missing data. Here are some typical reasons why data is missing:
User forgot to fill in a field.
Data was lost while transferring manually from a legacy database.
There was a programming error.
Users chose not to fill out a field tied to their beliefs about how the results would be used or interpreted.
Variable identification with Uni variate, Bi variate and Multi variate analysis:
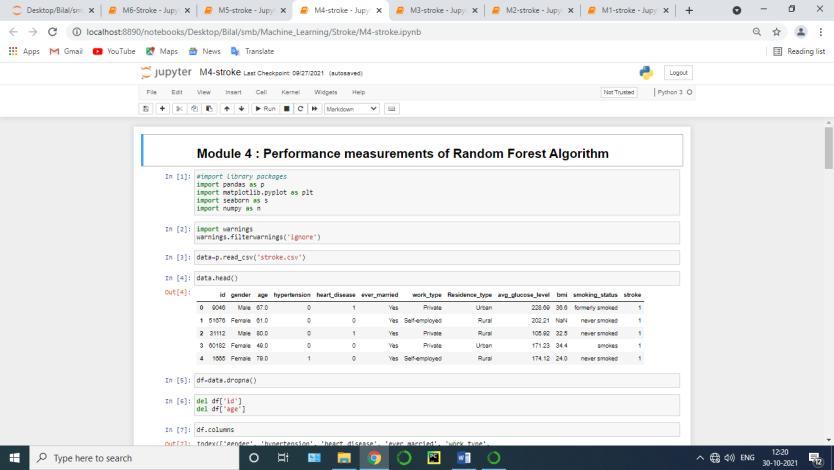
import libraries for access and functional purpose and read the given dataset
General Properties of Analyzing the given dataset
Display the given dataset in the form of data frame
show columns
shape of the data frame
To describe the data frame
Checking data type and information about dataset
Checking for duplicate data
Checking Missing values of data frame
Checking unique values of data frame
Checking count values of data frame
Rename and drop the given data frame
To specify the type of values
To create extra columns
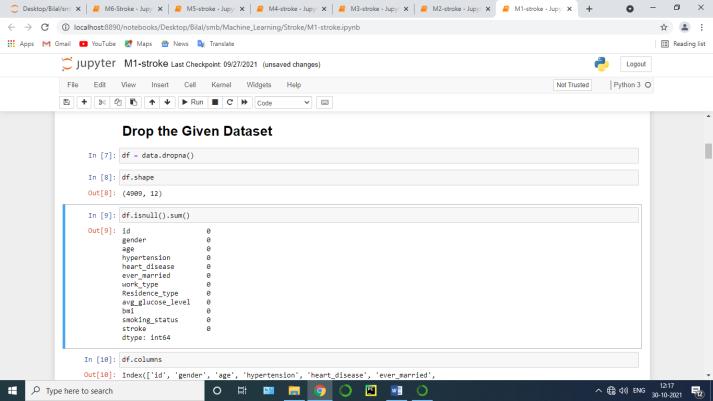
Data Validation/ Cleaning/Preparing Process
Importing the library packages with loading given dataset. To analyzing the variable identification by data shape, data type and evaluating the missing values, duplicate values. A validation dataset is a sample of data held back from training your model that is used to give an estimate of model skill while tuning model's and procedures that you can use to make the best use of validation and test datasets when evaluating your models. Data cleaning / preparing by rename the given dataset and drop the column etc. to analyze the uni variate, bi variate and multi variate process. The steps and techniques for data cleaning will vary from dataset to dataset. The primary goal of data cleaning is to detect and remove errors and anomalies to increase the value of data in analytics and decision making.
Exploration data analysis of visualization
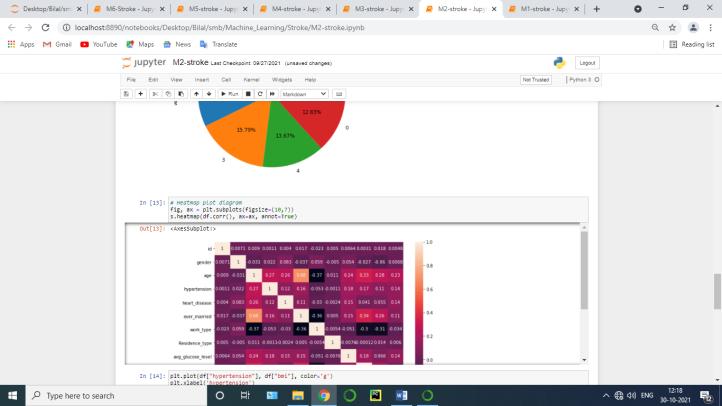
Data visualization is an important skill in applied statistics and machine learning. Statistics does indeed focus on quantitative descriptions and estimations of data. Data visualization provides an important suite of tools for gaining a qualitative understanding. This can be helpful when exploring and getting to know a dataset and can help with identifying patterns, corrupt data, outliers, and much more. With a little domain knowledge, data visualizations can be used to express and demonstrate key relationships in plots and charts that are more visceral and stakeholders than measures of association or significance. Data visualization and exploratory data analysis are whole fields themselves and it will recommend a deeper dive into some the books mentioned at the end.
Sometimes data does not make sense until it can look at in a visual form, such as with charts and plots. Being able to quickly visualize of data samples and others is an important skill both in applied statistics and in applied machine learning. It will discover the many types of plots that you will need to know when visualizing data in Python and how to use them to better understand your own data.


How to chart time series data with line plots and categorical quantities with bar charts.
How to summarize data distributions with histograms and box plots.
Pre processing refers to the transformations applied to our data before feeding it to the algorithm.Data Preprocessing is a technique that is used to convert the raw data into a clean data set. In other words, whenever the data is gathered from different sources it is collected in raw format which is not feasible for the analysis. To achieving better results from the applied model in Machine Learning method of the data has to be in a proper manner. Some specified Machine Learning model needs information in a specified format, for example, Random Forest algorithm does not support null values. Therefore, to execute random forest algorithm null values have to be managed from the original raw data set. And another aspect is that data set should be formatted in such a way that more than one Machine Learning and Deep Learning algorithms are executed in given dataset.
False Positives (FP): A person who will pay predicted as defaulter. When actual class is no and predicted class is yes. E.g. if actual class says this passenger did not survive but predicted class tells you that this passenger will survive.
False Negatives (FN): A person who default predicted as payer. When actual class is yes but predicted class in no. E.g. if actual class value indicates that this passenger survived and predicted class tells you that passenger will die.
True Positives (TP): A person who will not pay predicted as defaulter. These are the correctly predicted positive values which means that the value of actual class is yes
and the value of predicted class is also yes. E.g. if actual class value indicates that this passenger survived and predicted class tells you the same thing.
True Negatives (TN): A person who default predicted as payer. These are the correctly predicted negative values which means that the value of actual class is no and value of predicted class is also no. E.g. if actual class says this passenger did not survive and predicted class tells you the same thing.
Comparing Algorithm with prediction in the form of best accuracy result
It is important to compare the performance of multiple different machine learning algorithms consistently and it will discover to create a test harness to compare multiple different machine learning algorithms in Python with scikit learn. It can use this test harness as a template on your own machine learning problems and add more and different algorithms to compare. Each model will have different performance characteristics. Using resampling methods like cross validation, you can get an estimate for how accurate each model may be on unseen data. It needs to be able to use these estimates to choose one or two best models from the suite of models that you have created. When have a new dataset, it is a good idea to visualize the data using different techniques in order to look at the data from different perspectives. The same idea applies to model selection. You should use a number of different ways of looking at the estimated accuracy of your machine learning algorithms in order to choose the one or two to finalize. A way to do this is to use different visualization methods to show the average accuracy, variance and other properties of the distribution of model accuracies.
In the next section you will discover exactly how you can do that in Python with scikit learn. The key to a fair comparison of machine learning algorithms is ensuring that each algorithm is evaluated in the same way on the same data and it can achieve this by forcing each algorithm to be evaluated on a consistent test harness.
In the example below 4 different algorithms are compared:
evaluated in precisely the same way. Before that comparing algorithm, Building a Machine Learning Model using install Scikit Learn libraries. In this library package have to done preprocessing, linear model with logistic regression method, cross validating by KFold method, ensemble with random forest method and tree with decision tree classifier. Additionally, splitting the train set and test set. To predicting the result by comparing accuracy.
Prediction result by accuracy:
Logistic regression algorithm also uses a linear equation with independent predictors to predict a value. The predicted value can be anywhere between negative infinity to positive infinity. It need the output of the algorithm to be classified variable data. Higher accuracy predicting result is logistic regression model by comparing the best accuracy.
True Positive Rate(TPR) = TP / (TP + FN)
False Positive rate(FPR) = FP / (FP + TN)
Accuracy: The Proportion of the total number of predictions that is correct otherwise overall how often the model predicts correctly defaulters and non defaulters. Accuracy calculation:
Accuracy = (TP + TN) / (TP + TN + FP + FN)
Accuracy is the most intuitive performance measure and it is simply a ratio of correctly predicted observation to the total observations. One may think that, if we have high accuracy then our model is best. Yes, accuracy is a great measure but only when you have symmetric datasets where values of false positive and false negatives are almost same.
Precision: The proportion of positive predictions that are actually correct.
Precision = TP / (TP + FP)
Precision is the ratio of correctly predicted positive observations to the total predicted positive observations. The question that this metric answer is of all passengers that labeled as survived, how many actually survived? High precision relates to the low false positive rate. We have got 0.788 precision which is pretty good.
Recall: The proportion of positive observed values correctly predicted. (The proportion of actual defaulters that the model will correctly predict)
Recall = TP / (TP + FN)
Recall(Sensitivity) Recall is the ratio of correctly predicted positive observations to the all observations in actual class yes.
The K fold cross validation procedure is used to evaluate each algorithm, importantly configured with the same random seed to ensure that the same splits to the training data are performed and that each algorithm is
F1 Score is the weighted average of Precision and Recall. Therefore, this score takes both false positives and false negatives into account. Intuitively it is not as easy to understand as accuracy, but F1 is usually more useful than
accuracy, especially if you have an uneven class distribution. Accuracy works best if false positives and false negatives have similar cost. If the cost of false positives and false negatives are very different, it’s better to look at both Precision and Recall.
General Formula:
F Measure = 2TP / (2TP + FP + FN)
F1 Score Formula:
F1 Score = 2*(Recall
Precision)
Architecture
(Recall
Integration tests are designed to test integrated software components to determine if they actually run as one program. Testing is event driven and is more concerned with the basic outcome of screens or fields. Integration tests demonstrate that although the components were individually satisfaction, as shown by successfully unit testing, the combination of components is correct and consistent. Integration testing is specifically aimed at exposing the problems that arise from the combination of components.
Functional tests provide systematic demonstrations that functions tested are available as specified by the business and technical requirements, system documentation, and user manuals.
Functional testing is centered on the following items:
Valid Input : identified classes of valid input must be accepted.
Invalid Input : identified classes of invalid input must be rejected.
Functions : identified functions must be exercised.
Output : identified classes of application outputs must be exercised.
Systems/Procedures: interfacing systems or procedures must be invoked.
2) SYSTEM TESTING AND IMPLEMENTATION
The purpose of testing is to discover errors. Testing is the process of trying to discover every conceivable fault or weakness in a work product. It provides a way to check the functionality of components, sub assemblies, assemblies and/or a finished product It is the process of exercising software with the intent of ensuring that Software system meets its requirements and user expectations and does not fail in an unacceptable manner. There are various types of test. Each test type addresses a specific testing requirement.
Field testing will be performed manually and functional tests will be written in detail.
Test objectives
All field entries must work properly.
Pages must be activated from the identified link.
The entry screen, messages and responses must not be delayed.
Features to be tested
Verify that the entries are of the correct format
No duplicate entries should be allowed
All links should take the user to the correct page.
Organization and preparation of functional tests is focused on requirements, key functions, or special test cases. In addition, systematic coverage pertaining to identify Business process flows; data fields, predefined processes, and successive processes must be considered for testing. Before functional testing is complete, additional tests are identified and the effective value of current tests is determined.
System testing ensures that the entire integrated software system meets requirements. It tests a configuration to ensure known and predictable results. An example of system testing is the configuration oriented system integration test. System testing is based on process descriptions and flows, emphasizing pre driven process links and integration points.

Integration Testing
Software integration testing is the incremental integration testing of two or more integrated software components on a single platform to produce failures caused by interface defects.
The task of the integration test is to check that components or software applications, e.g. components in a software system or one step up software applications at the company level interact without error.
Test Results: All the test cases mentioned above passed successfully. No defects encountered.
User Acceptance Testing is a critical phase of any project and requires significant participation by the end user. It
also ensures that the system meets the functional requirements
Test Results: All the test cases mentioned above passed successfully. No defects encountered.
SYSTEM IMPLEMENTATION
Implementation is the stage in the project where the theoretical design is turned a working system. The most crucial stage is achieving a successful new system and giving the user confidence in that the new system will work efficiently and effectively in the implementation stage.
Implementation is the stage in the project where the theoretical design is turned into a working system. The most crucial stage is achieving a successful new system & giving the user confidence in that the new system will work efficiently & effectively in the implementation state. The stage consists of
Testing the developed program with simple data.
Detection’s and correction of error.
Creating whether the system meets user requirements.
Testing whether the system.
Making necessary changes as desired by the user.
Training user personnel.
INTRODUCTION
Implementation phase is the last phase regarding any system development, before any system is implemented various tests are performed the system is reviewed thoroughly. The changeover selected is used to change the existing system to the new proposed system. In this phase, the system enters the operation and routine maintenance stage.
IMPLEMENTATION PROCESS
This system is developed in such a way that the existing system facilities are enough for implementation. The hardware facilities are sufficient enough to implement the developed system. The system has been successfully implemented in the organization with full co operation of the management. The users assume their respective responsibilities.
There is no need for specially qualified trained persons or Manual for operating the developed system. Because it has been developed in a user friendly manner with all the necessary help menus.
SECURITY
Password mechanism has been used to provide system Security only authorized persons can access the system. The most commonly used implementation methods are pilot and parallel. They are
Pilot Running
Processing the current data by one user at a time called the pilot running process. When one user is accessing the data at one system, the system is sets to be engaged and connected in network. This process is useful only in system where more than one user is restricted.
Parallel Running
Processing the current data by more than one user at a time simultaneously is said to be parallel running. This same system can be viewed and accessing by more than one user at the time. Hence the implementation method used in the system is a pilot type of implementation.
DOCUMENTATION
Proper documentation has been done at every phase in developing the system which would be helpful to study the problem and the software system, and trace out problems if any. Modification can be done easily by referring these documents.
SYSTEM MAINTENANCE
This project is maintaining the issue to store data’s in a database. Each and every company data details and project data details are kept secrecy. The administrator gets benefited, by viewing the details according to their requirement. Report helps the admin in various ways. The data’s can be ordered by name or their Company ID, Project ID. The motto of the maintenance issue is to keep the user data’s details privacy.
Describing four activities that are undertaken after the program is related or user can give definition of maintenance
The first maintenance activity occurs it is unreasonable to assume that testing will uncover all errors in a large system. The process of including the diagnosis and correction of one or more errors is called corrective maintenance.
The second activity that contributes a definition of maintenance occurs since repaid change is encountered in every aspect of computing.
The third activity involves recommendations for new capabilities, modifications to the excising functions and general enhancements when the software is used. Software is changed to improve future maintainability or reliability. This is called as preventive maintenance.
CONCLUSION AND FUTURE ENHANCEMENT Conclusion
The analytical process started from data cleaning and processing, missing value, exploratory analysis and finally model building and evaluation. The best accuracy on public test set is higher accuracy score is will be find out. This application can help to find the Prediction of Stroke.
Future Work
prediction to connect with AI model.
automate this process by show the prediction result in web application or desktop application.
optimize the work to implement in Artificial Intelligence environment.

REFERENCES
[1] A. Abdelsadek, “Distributed index for matching multimedia objects,” M.S. thesis, School of Comput. Sci., Simon Fraser Univ., Burnaby, BC, Canada, 2014.
[2] A. Abdelsadek and M. Hefeeda, “Dimo: Distributed index for matching multimedia objects using MapReduce,” in Proc. ACMMultimedia Syst. Conf. (MMSys’14), Singapore, Mar. 2014, pp. 115 125.
[3] M. Aly, M. Munich, and P. Perona, “Distributed Kd Trees for retrieval from very large image collections,” in Proc. Brit. Mach. Vis. Conf. (BMVC), Dundee, U.K., Aug. 2011.
[4] J. Bentley, “Multidimensional binary search trees used for associative searching,” in Commun. ACM, Sep. 1975, vol. 18, no. 9, pp. 509 517.