Market Analysis and Feasibility Study
DECEMBER 2022 Report from the Planning Team


(12/16/2022)
This page intentionally left blank.

This page intentionally left blank.
John Maupin, Chairperson (Port District 2) Amy Hunter, Port District 1 Gil Kleinknecht, Port District 3 Ruth Lee, Port District 4 Ambassador Kevin O'Malley, Port District 5 Marianne Ojile, Port District 6 Mike Hejna, Port District 7
Thank you to everyone who was involved in the process. Special thank you to the Saint Louis Zoo for hosting the two public forums, Black Jack Fire Protection District and Zion United Church of Christ for hosting small group discussions, and St. Louis County Councilwoman Shalonda Webb.
The i5Group
Stephen Ibendahl, AICP, ASLA Katie McLaughlin Laura Linn
Saint Louis University Community Planning Lab Robert M. Lewis, FAICP, CEcD Cecile Denny
Added Dimension LLC
MaryAnn Taylor-Crate Kayla Allen
Stock & Associates Consulting Engineers, Inc. George M. Stock, P.E.
&Access, Inc. Bobby Boone
The Advisory Committee met regularly with the planning team six times during the study. The role of the Advisory Committee included: acting as a “sounding board” for the planning team, diving deep into the market analysis and helping develop principles of preferred development, and sharing information with neighbors and networks.
President, Spanish Lake Neighborhood Association Director of Care Coordination & Population Health, Christian Hospital

President, Greater North County Chamber of Commerce
Board President, Spanish Lake CDC Assistant Director of Education, Saint Louis Zoo


 PATTY MURRAY RENE DULLE
Board Member, Old Jamestown Association Senior Program Manager, St. Louis Community College


Resident, Fox Manor Subdivision
Chief Financial Officer and Assistant Superintendent for Finance and Facilities, Hazelwood School District
President/CEO, North County Inc.
Resident, City of Black Jack
Director of Public Works, City of Florissant
Executive Director, A Red Circle


Resident
Resident Resident Resident Resident
Resident
Planning Manager, St. Louis County Department of Planning


Senior Planner, St. Louis County Department of Planning
Community Development Project Manager, St. Louis Economic Development Partnership
 CHANDAN K. MAHANTA
PAUL WEATHERFORD
TOMMIE PIERSON JR. KIM POTTS
JADA D. JENKINS REESE
RANDY SCHROEDER
CHANDAN K. MAHANTA
PAUL WEATHERFORD
TOMMIE PIERSON JR. KIM POTTS
JADA D. JENKINS REESE
RANDY SCHROEDER
This page intentionally left blank.
Background and Context
Preferred Land Use Scenario
Alternative Land Use Scenario
Development Principles
Six Initial Land Use Scenarios
Small Group Meetings
Evaluation Ratings and Criteria
Public Forum #1: Feedback on the Six Scenarios
What We've Heard
Final Three Land Use Scenarios
Public Forum #2: Feedback on the Final Three Scenarios
Section 1 - Existing Land Use
Section 2 - Economic Sector Analysis
Section 3 - Population and Housing Trends and Forces
Section 4 - Real Estate Market Reports
Section 5 - Retail Trade Analysis
Section
and
Note: All information and opinions, as well as any forecasts, estimates information, and price points indicated, are the best available data at that particular time and are subject to change without notice. This report represents the findings, data, and recommendations of the planning team. The report should be considered preliminary.
This page intentionally left blank.
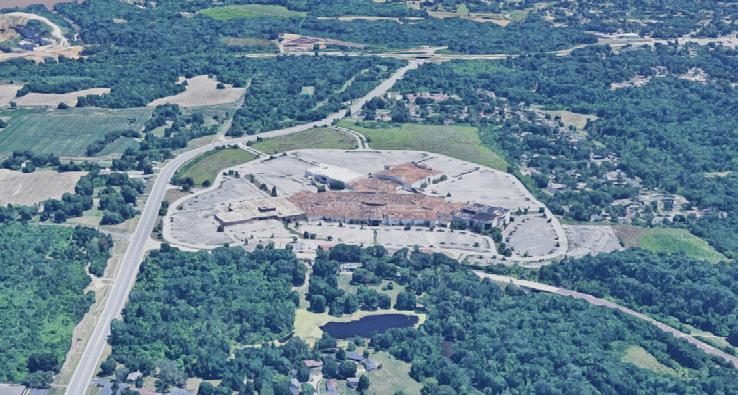
BackgroundJamestown Mall was conceived in the late 1960s and opened in 1973 as a regional shopping mall of about one million square feet. It was ahead of its time while anticipating continued suburban expansion northward in St. Louis County. Ultimately, however, it failed as a regional mall. Several key factors contributed to this failure:
• A great deal of housing potential was eliminated when St. Louis County authorities prohibited further development immediately north of the mall across U.S. 67/Lindbergh Boulevard. The earth in that area remains too unstable as Karst topography (sinkholes) influenced by the geology of the Mississippi and Missouri Rivers. Typical suburban scale densities cannot be supported. A huge potential market for shopping at Jamestown did not materialize.
• Like most of its predecessors in metro St. Louis, Jamestown Mall was located along a major arterial road (Lindbergh Boulevard or U.S. Route 67). The American and St. Louis transportation landscape was changing quickly in the 1970s, however, with the expansion of the interstate highway network. Formerly successful regional shopping centers on arterial roads in St. Louis County have disappeared, such as Crestwood Plaza, Northwest Plaza, and smaller, earlier examples like Northland and River Roads. The latter three, by the way, were also in North County.
• The fewer regional malls that remain in greater St. Louis today are located at interchanges of the interstate system. Think of the Galleria (I 64 and I 170), West County Center (I 270), South County Center (I 55 and I 270), St. Clair Square (I64), and Mid Rivers Mall (I 70). Chesterfield Mall was also an early location on U.S. Route 40, not then an interstate, but it became I 64. But Chesterfield has been pre-empted by the massive shift in retailing that took place in Chesterfield Valley, an alternative to enclosed malls. The only regional mall (technically named) in the region not on an interstate highway is Alton Square, though it is a much smaller version of what it was intended to be.
Jamestown Mall was permanently closed in 2014 and is currently owned by the St. Louis County Port Authority. The property also has been the subject of two redevelopment RFPs issued by the Port in 2018 and in 2020. No action was taken following the 2018 RFP, and a proposal submitted in 2020 to purchase and redevelop the property for a light industrial/logistics use with limited retail was withdrawn due to a lack of community support.
As a result, the Port Authority decided to conduct a Market Analysis and Feasibility Study in 2022 that combined a comprehensive market analysis of a wide range of realistic redevelopment scenarios with extensive community engagement.
In addition to the Market Analysis and Feasibility Study, the Port Authority has overseen environmental remediation of the Jamestown Mall site and prepared demolition and grading plans. Demolition of the Mall is expected in 2023.
Six land use scenarios were initially developed for analysis. Based on the initial market analysis and input from the community, three land use scenarios were chosen for final analysis.
While this report recommends one preferred land use scenario, the result may have included two to three land use scenarios that reflect community feedback, are commercially viable, and provide an acceptable return on public investment.
The feasibility study will position the St. Louis County Port Authority to issue a new request for proposals for the redevelopment of the site.
Community engagement was a very important part of this process. Engagement included:
• An advisory committee that included community members worked with the planning team to dive deep into the market analysis and develop principles of preferred development.
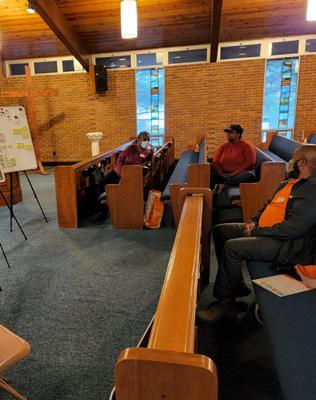
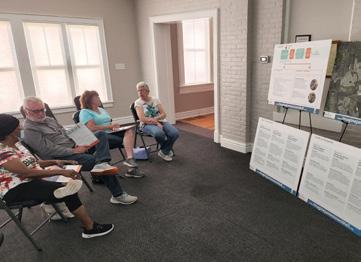
• A series of focused neighborhood conversations in small groups.
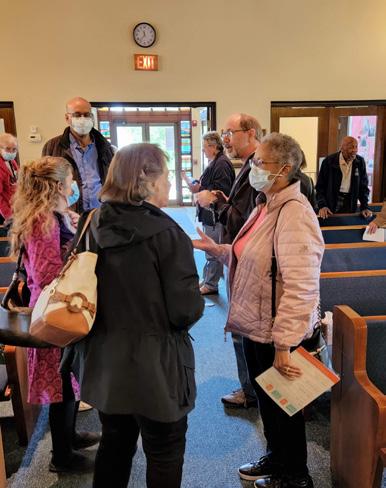
• Two public forums.
The planning team worked with the advisory committee and the community in developing a set of “development principles." These principles will help inform future development proposals and development standards to ensure community expectations are met.
A market analysis evaluates what land uses are commercially feasible given the existing market conditions. The market analysis examines many factors, including current land use; recent or planned development; economic growth sectors in St. Louis County and the St. Louis region; demographic and housing data, trends, and projections; and market area supply and demand.
A key challenge with a market analysis is that the economy is never static, especially in 2022. For example, mortgage rates in 2022 have doubled. Inflation has driven up construction costs and other segments of the economy. Many national economists are predicting a possible recession in 2023. Therefore, this report's data, information, and price points reflect the best available data at that particular time to evaluate the land use scenarios.
This report includes three parts.
• Part 1: Includes the preferred and alternative land use recommendations, a concise overview of the site, and the development principles.
• Part 2: A chronological process of the land use evaluation and community engagement starting with the six initial land use scenarios and progressing to the final three land use scenarios.
• Part 3: The full market analysis and research data.
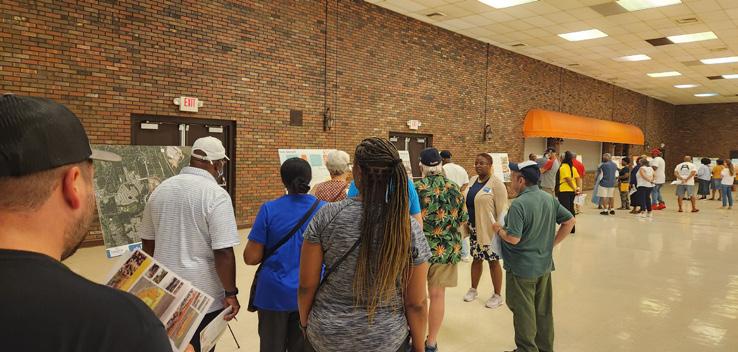
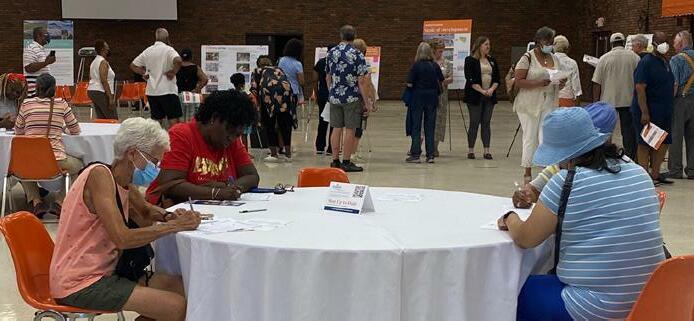
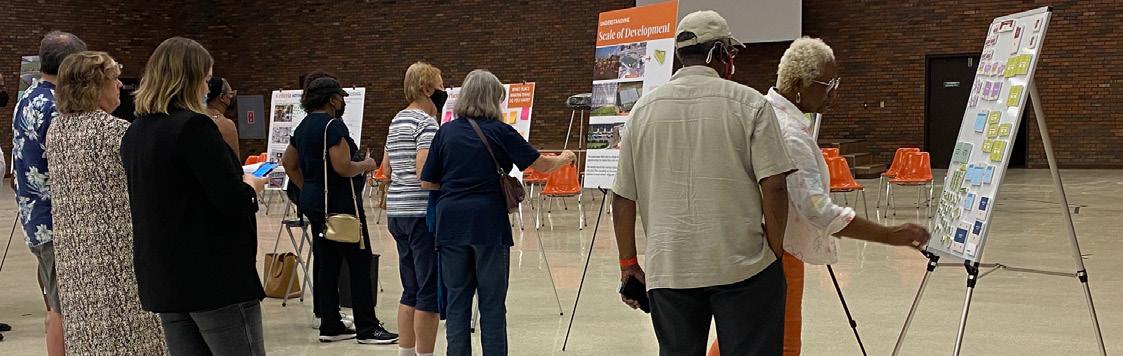
The Market Analysis and Feasibility Study included a robust community engagement process. Highlights of engagement included:

• A 20-person Advisory Committee made up of neighborhood organizations, institutions, residents, and other key stakeholders.
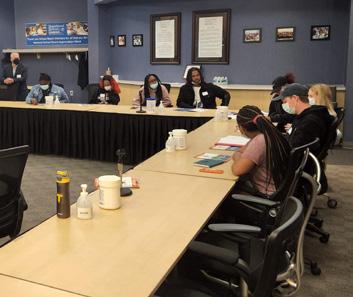
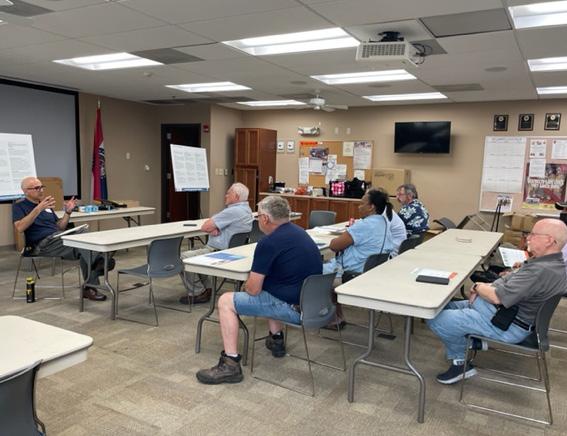
• Twelve (12) small group discussions in late April through early June.
• Two (2) pop-up events at the North County Recreation Center.
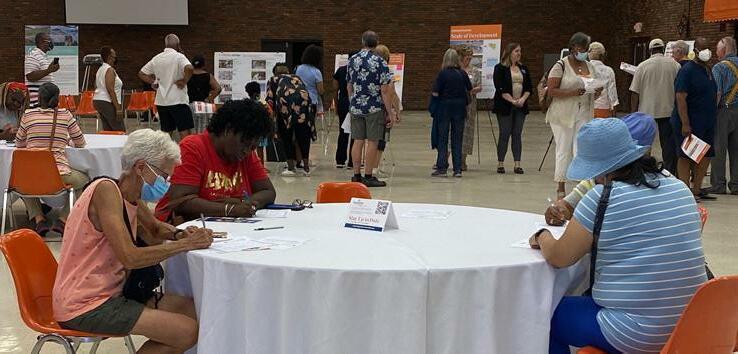
• Two (2) public forums with over 200 attendees per forum.
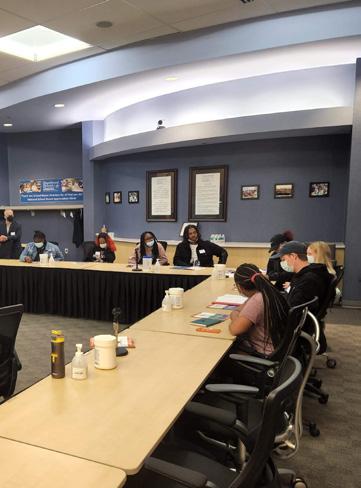
• Three (3) small group listening sessions in early October.
• A dedicated project website with over 4,400 unique visitors.
• Regular e-blasts. Over 500 sign-ups for the e-blast from the project website.
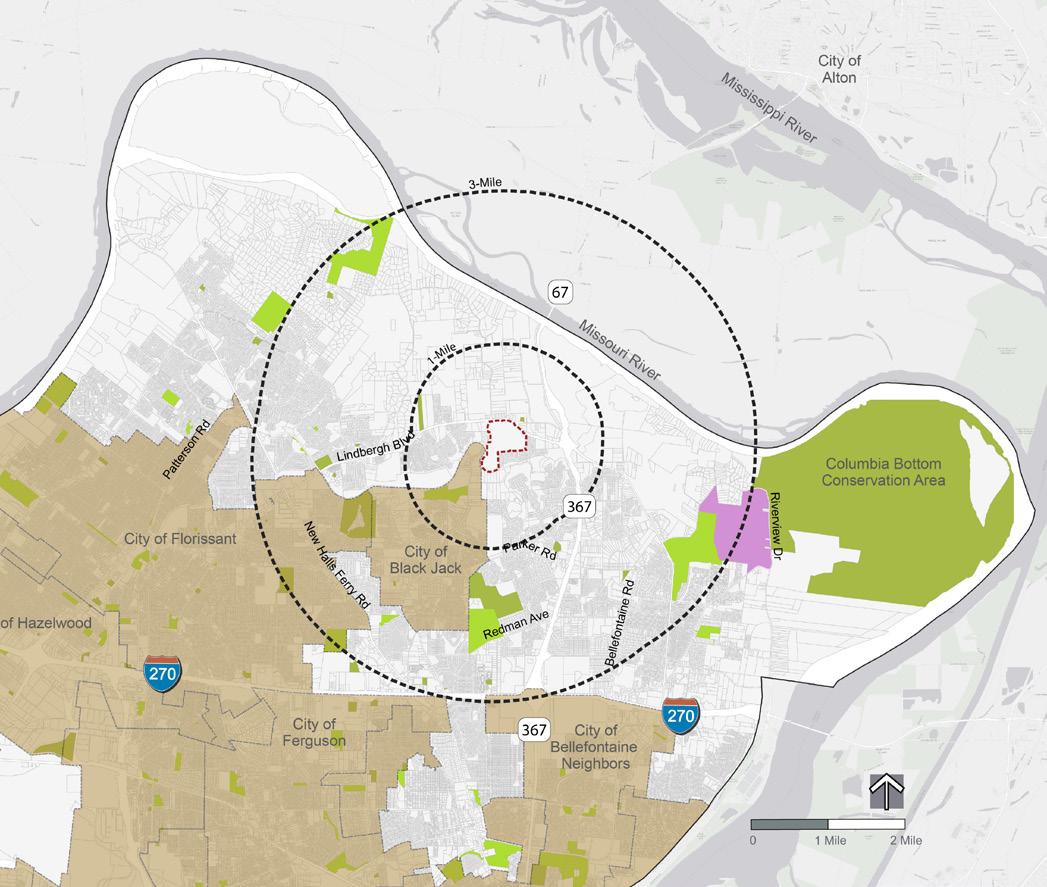
The Jamestown Mall site is located in unincorporated north St. Louis County. The site is adjacent to the City of Black Jack.
The site is near the future Saint Louis Zoo WildCare Park, which is targeted to open in 2027 (see additional information in this section).
Part 3 of this report includes details regarding surrounding land uses. The following pages include important pieces of information regarding zoning and site conditions.
Saint Louis Zoo WildCare Park (Future)
The Jamestown Mall site is currently zoned C-8 Planned Commercial District. The C-8 Ordinance governing the Jamestown Mall site only permits a retail shopping mall. In order to change the permitted uses in the C-8 District, or rezone the property to another zoning district, a new Public Hearing before the St. Louis County Planning Commission will be necessary.
According to the St. Louis County Department of Planning, the overall zoning process typically takes 4-6 months, starting with the submission of an application, survey and legal description of the property, and a preliminary site development plan. Once the application is accepted by the Department of Planning, the petition is scheduled for Public Hearing.
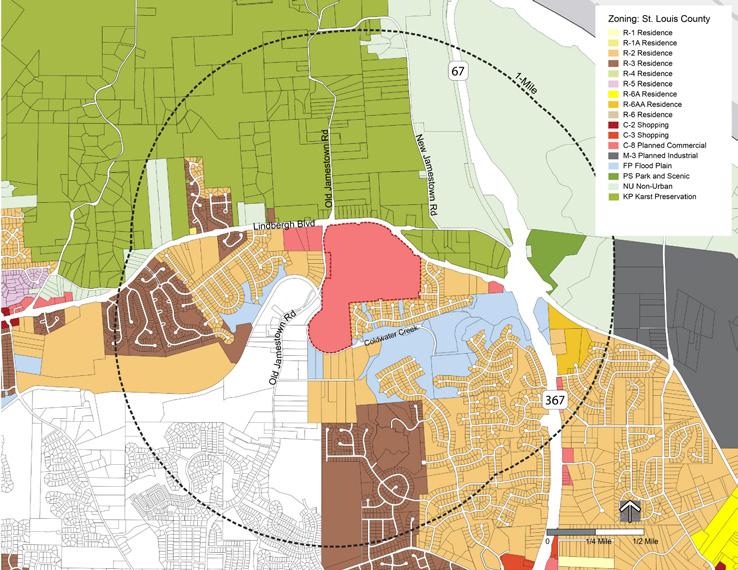
The existing Jamestown Mall site is zoned C-8 "Planned Commercial."
The south side of Lindbergh Boulevard is primarily residential zoning. On the north side of Lindbergh Boulevard is KP 'Karst Preservation.'
'Karst Preservation' zoning seeks to preserve the karst geology in its natural state while allowing development at an intensity that can be accommodated within the constraints of the geological features of this unique area. Thus, any new development north of Lindbergh will have significant limitations. While the 'Karst Preservation' zoning limits potential expansion opportunities for many development scenarios for the Jamestown Mall site, the existing agriculture land north of Lindbergh is a potential strength for the AgTech Annex scenario, as described later in this report.
The St. Louis Planning Commission does not take action at the Public Hearing. Subsequent to the meeting, the Planning Department staff prepare a detailed information report with a recommendation. The recommendation is presented to the Commission at an Executive Meeting, typically the first Monday of the month following the Public Hearing. The Planning Commission votes to accept, reverse, or modify the staff’s recommendation. At a subsequent Executive Session, the Commission votes to forward their Letter of Recommendation to the full County Council. The letter of recommendation includes the report, comments from other reviewing agencies, the preliminary site plan, and detailed conditions of development. All of the Planning Commission Executive Meetings/Sessions are open to the public and included on the County Public Notices webpage. The County Council will usually see the petition on their agenda at four consecutive Tuesday meetings for the following actions:
• Receive and file the Planning Commission’s Letter of Recommendation
• Introduce a bill for the rezoning
• Perfect the bill
• Finally pass the legislation
Once the County Executive signs the ordinance, the rezoning is effective. Only then can the petitioner begin the permitting process. The Planning Department is involved in the review and approval of the Site Development Plan, which must adhere to the conditions of development adopted by the Council. The approved Site Development Plan is required in order for the developer to pull permits, which are issued by the County Department of Transportation and Public Works.
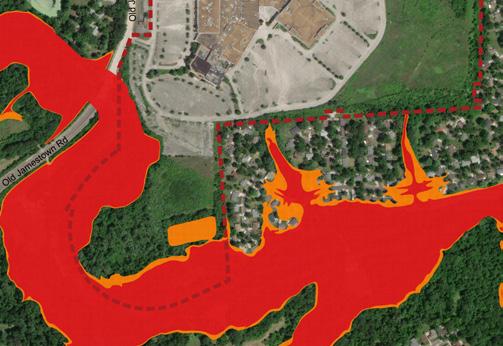
The area outlined in red on the map is the Jamestown Mall site owned by the St. Louis County Port Authority. According to St. Louis County parcel records, the site is 142.4 acres. The southern part of the site has topography and flood hazard areas that limit development in that area of the site.
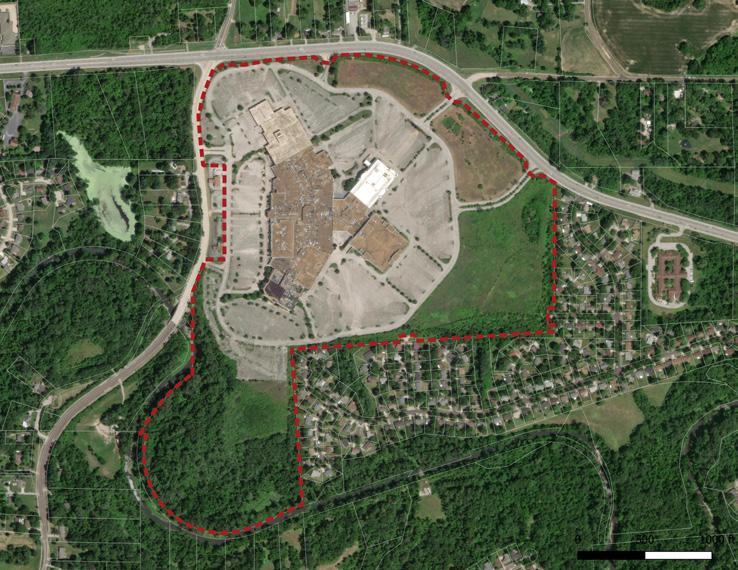
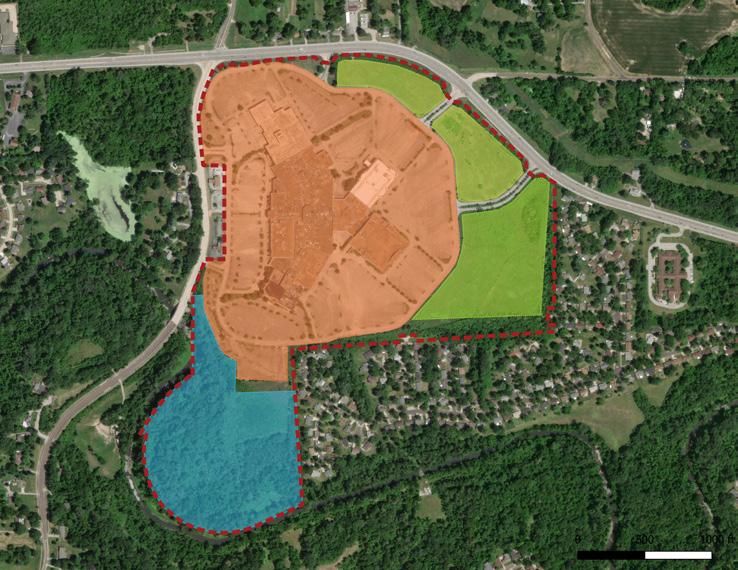
There is an approximately two acre parcel along Old Jamestown Road that the St. Louis County Port Authority does not own. This parcel is privately owned.
The map above shows the approximate acreage of the mall and parking, outlots, and conservation area. The map below shows the flood hazard areas of Coldwater Creek. See Part 3 of the report for additional information.
The Saint Louis Zoo's WildCare Park is targeted to open in 2027. The $230 million WildCare Park will be a major asset and tourist attraction for north St. Louis County. As of the July 2022 Saint Louis Zoo announcement, WildCare park is expected to feature:
• A woodland and savanna safari
• A "zooseum"
• Nature Adventure Area
• Safari observation tower
• Premium safaris
• Giraffe feeding
• Glamping
• Restaurant
• Event center
WildCare Park is approximately three miles (11-12 minute drive) from the Jamestown Mall site. The Saint Louis Zoo has not announced the preferred arrival route for visitors, but it will likely be Riverview Drive from Interstate 270.
While the Jamestown Mall site enjoys proximity to WildCare Park, there is, unfortunately, no direct route between the two. Lindbergh Boulevard ends at Highway 367. The route from Jamestown Mall to WildCare Park includes Lindbergh Boulevard, Highway 367, Parker Road, Bellefontaine Road, Trampe Avenue, and Larimore Road.
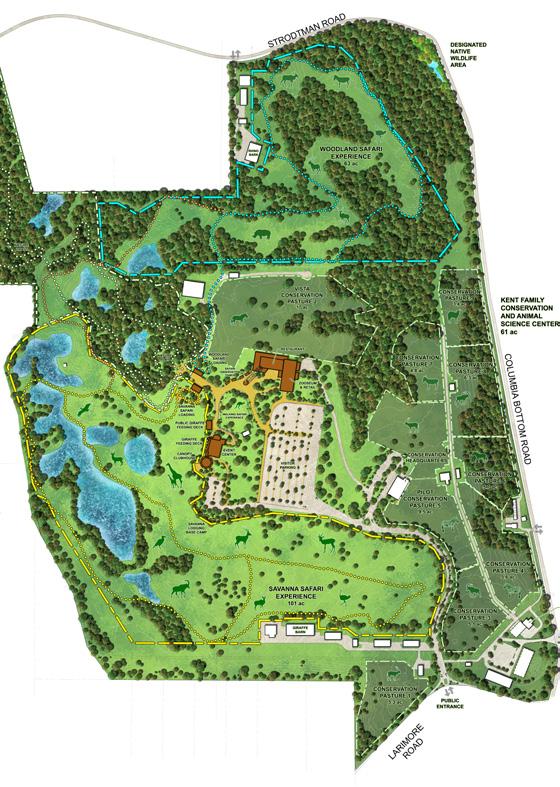
Left: View (future rendering) from the WildCare Park event center. Visitors can take in the breathtaking views of the 101-acre Savanna Safari while also feeding giraffes. Other animals shown in this rendering include Grevy’s zebra, greater kudu, scimitar-horned oryx, eland and ostrich. Above: Conceptual map shows what guests might expect when they come to WildCare Park. There are plans for a 60-acre Nature Adventure Zone, 63 acres of Woodland Safari, 101 acres of Savanna Safari, and 61 acres of the Kent Family Conservation and Animal Science Center. Renderings courtesy of the Saint Louis Zoo WildCare Park (July 2022); created by PGAV.

Of the three final scenarios evaluated by not only the consulting team but also by the Advisory Committee and the public at large, the Ag-Food Technology Campus scenario clearly emerged as the preferred direction for the Jamestown Mall site.
Benefits of the Jamestown Ag-Food Technology Campus include:
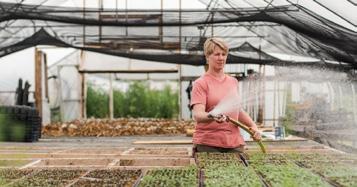
• Opportunities for expansion space to support the growing regional AgTech/Ag-Food sector. In particular, the site has the potential for lower-cost greenhouses as well as test plots without the need to travel greater distances into the rural areas of the metro area.

• Leveraging existing agriculture land north of Lindbergh Boulevard.
• Opportunity for North St. Louis County to align with the Greater St. Louis Jobs Plan.

Life, Physical, and Social Science occupations which numbered 7,526 in 2020 and are projected to increase to 8,209 in the St. Louis region by 2030, a growth rate of 9.1 percent. Total jobs in the St. Louis region are projected to increase by 7.3 percent over the decade, indicating that the science occupations will expand more rapidly than the regional average while food and soil scientists will increase more rapidly than general science occupations.
The numbers are not immense, but they are important in a region that has specialized in plant sciences almost from the founding of St. Louis. The evolution of this economic sector most recently manifested its strength with the creation of the Donald Danforth Plant Science Center in 1998. The Danforth Center attracted hundreds of scientists and
related employees to St. Louis and eventually led to the rebranding of a 600-acre area including and adjacent to the Danforth Center called “39 North,” so named because St. Louis straddles the Earth’s 39th parallel which effectively bisects the most productive agricultural lands around the world.
The Jamestown Mall site can address two critical needs for 39 North and the AgTech/Ag-Food sector.
1. Space for Additional Development: The bulk of the 39 North properties are industrial in nature, having been part of a large and very successful industrial park created in the 1960s.1 There is very little available land for additional development, such as greenhouses, let alone for test plots, though the existing buildings should be suitable for conversion to other agricultural industry purposes, including commercial production as well as research and office space. Moreover, the greenhouses presently in operation at 39 North are said to be equipped with high value technological features which require rents that lower-cost researchers are unwilling or unable to afford.
1) This would not be said of the specific Danforth Center and nearby buildings which are office and research facilities, designed and built as such.
2. Lower Cost Real Estate: The 39 North properties are relatively expensive in real estate terms. They are located in a highly desirable suburban setting with excellent access and visibility. Many needs of the ag-food tech industry presently point to low-value greenhouses and small test plots, if not also fermentation facilities. Early indications are that such needs cannot be economically met at 39 North, while Jamestown Mall, once the existing buildings are cleared, offers potentially substantial real estate cost savings.2
2) Based on analysis of quarterly “market reports” from three commercial real estate firms in metro St. Louis (Newmark Zimmer, Gershman, and Jones Lang LaSalle), office rents in West County (broad location of 39 North) are 32 percent higher than in North County, industrial rents are 46 percent higher, and retail rents are double those in North County.
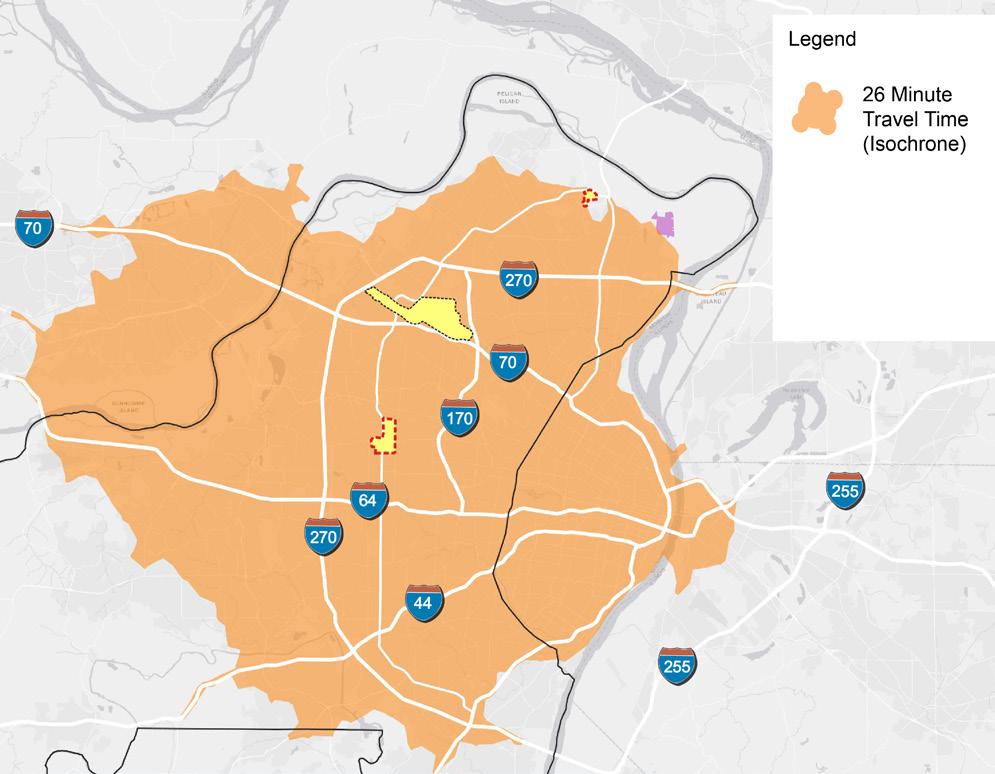
Jamestown Mall site (25-30 minute drive from 39 North)
39 North
Lambert Airport
Future Saint Louis Zoo WildCare Park
Other indicators of the strength of the agricultural industry and scientific jobs in St. Louis provide larger numbers and impressive growth rates over the long run. The U.S. Bureau of Economic Analysis (BEA) publishes county and metropolitan-level jobs by major economic sector every year in a database initiated in 1969 and presently extending to 2021. Prior to 2001, the data relied on the old Standard Industrial Classification (SIC) system, then switched to the North American Industrial Classification System (NAICS). Many of the economic sectors cannot be compared over that entire timeframe because some were “added”3 when NAICS became the standard.
A good example is what used to be called the agricultural services, forestry, and fishing sector within SIC from 1969 to 2000. After 2000, this sector became forestry, fishing, and related activities, dropping the agricultural services component which became part of another sector. Still, that pre-2001 sector in metropolitan St. Louis indicates how important the agricultural services industry was in the metro area.
Between 1969 and 2000, metropolitan jobs in agricultural services, forestry, and fishing increased from 2,740 to 11,915, a 287 percent increase in 31 years, or about 11 percent growth per year. In the U.S. as a whole, the average was nine percent per year. Total employment in the metro area over that time increased by an average of just 1.5 percent per year. Agricultural services, forestry, and fishing jobs tripled their share of all jobs in the metro area from 0.24 percent in 1969 to 0.73 percent in 2000.
While that sector cannot be traced from 2001 to 2021, a “new” sector was defined in the NAICS that has much relevance for the research and technology focus of Jamestown Mall’s third scenario: Professional, scientific, and technical services. The St. Louis metro area had 99,950 jobs in that sector in 2001, increasing to 119,185 by 2021, an average of one percent per year. In comparison, all jobs in the metro area increased by just 0.4 percent per year.
Unfortunately, St. Louis did not keep up with the nation as a whole. Professional, scientific, and technical services jobs in the U.S. grew at a rate of 2.2 percent per year (just over double the St. Louis rate) while all jobs increased an average of 1.1 percent per year—also over double St. Louis.
3) Perhaps a better word might be “disaggregated” because the SIC system effectively lumped many sectors together while NAICS pulled them out as significant sectors of their own.
The better news, however, is that professional, scientific, and technical services jobs in St. Louis gained a larger share of all metro area jobs over the two decades, from 6.1 percent in 2001 to 6.7 percent in 2021. Such jobs in the entire U.S. increased from 6.2 percent to 7.4 percent of all jobs.
Within St. Louis County alone, professional, scientific, and technical services jobs increased from 7.7 percent of all county jobs to 8.0 percent between 2001 and 2021. These jobs in St. Louis County represented 53 percent of all professional, scientific, and technical services jobs in the metro area.4
4) While there was an increase in numbers of professional, scientific, and technical services jobs in the county, this was actually a decline in the share of metro are jobs in this sector from 60 percent in 2001. Meanwhile, professional, scientific, and technical services jobs in the City of St. Louis increased their share from 16 percent of all metro area jobs in this sector to 20 percent.
The Missouri Economic Research and Information Center (MERIC)5 provides estimates and projections of employment in a wide range of economic sectors and occupations for the St. Louis region.6 The latest available is for the decade of 2020 to 2030.7 Three occupational categories (of 749) best represent the AgTech/Ag-Food sector:8
1. Food scientists and technologists who numbered 89 in the St. Louis region in 2020 with projections to 98 by 2030, a 10.1 percent growth rate.
2. Soil and plant scientists who numbered 154 in the St. Louis region in 2020 with projections to 171 by 2030, an 11.0 percent growth rate.
3. Biochemists and biophysicists who numbered 109 in the St. Louis region in 2020 with projections to 113 by 2030, a 3.7 percent increase.
Notwithstanding this projected job growth analysis, an AgTech/AgFood development will not likely create a great many jobs on site at the Jamestown Mall site. The industry isn’t all that large and it depends more on land and facilities for growing plants than on intense employment. Most jobs would be highly skilled, but likely not in large numbers. In some ways, however, this can contribute to the relative serenity of residential life in North County, particularly around the mall site. There can be important economic development without substantial commuting or other commercial traffic.
5) A component of the Missouri state government’s Department of Economic Development.
6) Defined by MERIC for statistical purposes as the City of St. Louis and the counties of St. Louis, St. Charles, Franklin, and Jefferson.
7) Similar projections for the United States as a whole extend to 2031 at present.
8) These do not represent support occupations, such as administrative or management jobs, only those apparently directly involved in agricultural research.
St. Louis County is largely built out, with limited large tracts of vacant (or agriculture) land that could be used for test plots or other complementary uses for the AgTech/Ag-Food sector.
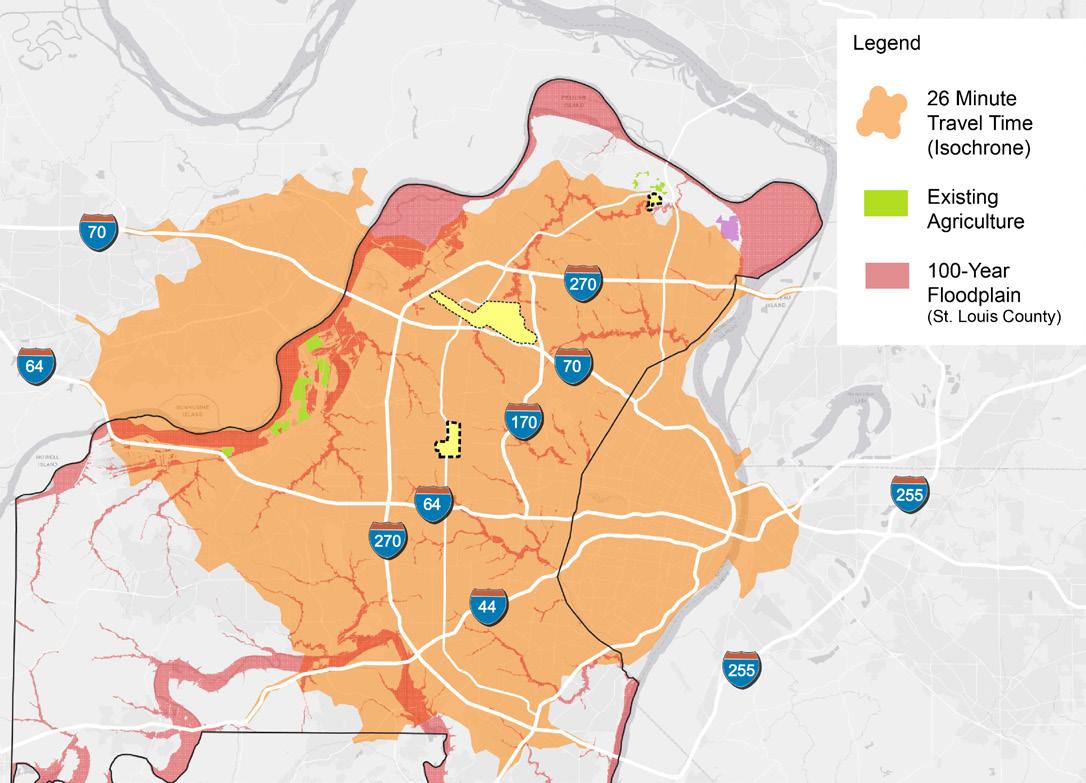
The map on this page shows two areas of vacant/agriculture land not in the 100-year floodplain.
Large expanses of vacant/agriculture land exist in the Chesterfield Bottoms / Howard Bend area (approximately a 15-20 minute drive from 39 North). However, this area has been under increased development pressure in recent years.
North of the Jamestown Mall site, there are over 140 acres of vacant/ agriculture land. Much of the land is already farmed. However, 140 acres is likely a conservative estimate. The actual amount of agriculture land is likely over 200 acres. This area is unlikely to receive development pressure because of the Karst Preservation zoning that places restrictions on development.
Large expanses of vacant/agriculture land (15-20 minute drive from 39 North)
Large expanses of vacant/agriculture north of Lindbergh Blvd
Jamestown Mall site
Future Saint Louis Zoo WildCare Park 39 North
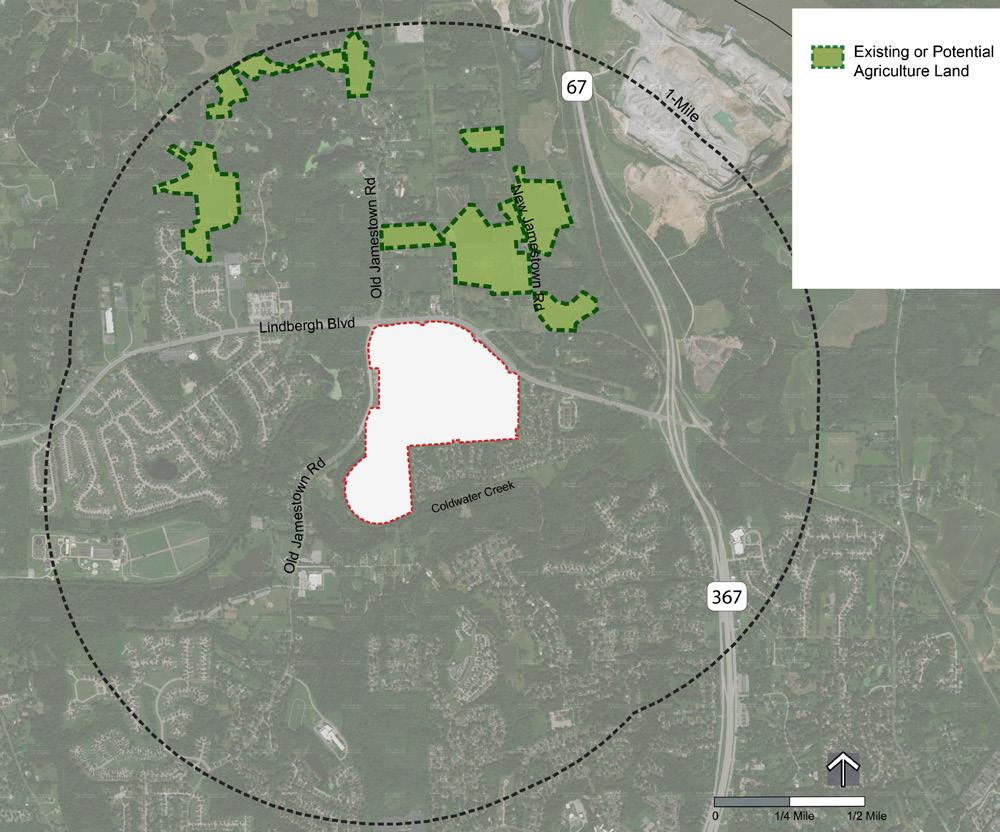
The map on this page shows existing (or potential) agriculture land within one mile of the Jamestown Mall site.
Much of the land within one mile of the Jamestown Mall site is undeveloped (37% of the land use is classified as vacant/agriculture). However, not all this land is suitable for agriculture. Some of the land is wooded, has steep topography, or has other limitations.
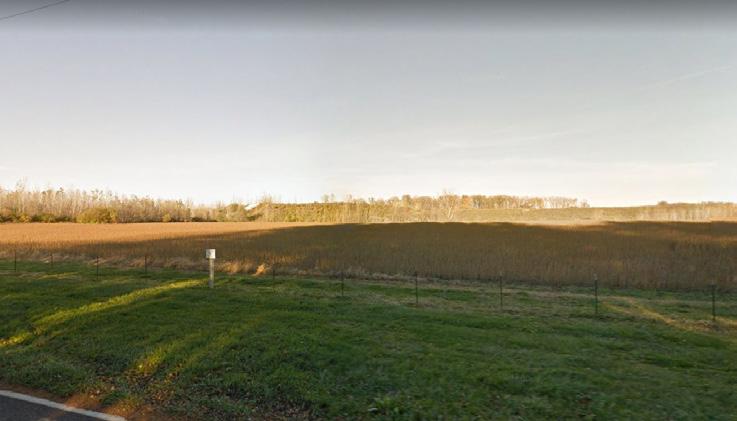
The land highlighted on the map (existing agriculture or potential) totals approximately 140 acres. Much of the land is already farmed. However, 140 acres is likely a conservative estimate. The actual amount of agriculture land is likely over 200 acres.
Released in 2021, the 'STL 2030 Jobs Plan' provides a 10-year roadmap for boosting economic growth, increasing the number of quality, livingwage jobs, and reducing racial disparities in employment and wealthgeneration to boost opportunities for all. The plan is the first metrowide jobs plan in a decade for St. Louis’ 15-county region.
The Ag-Food Technology Campus can align with the 'STL 2020 Jobs Plan' in two key ways:
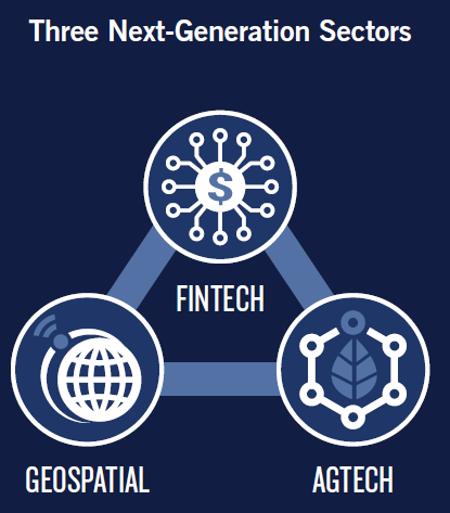
• AgTech is a Next-Generation Sector
• Advancing Racial Equity
AgTech is a Next-Generation Sector
AgTech is identified in the Jobs Plan as a Next-Generation Sector, along with FinTech (Financial) and Geospatial, to make St. Louis Metro a hub for next-generation industries and technologies.
Positioning the Jamestown Mall site to be part of the St. Louis region's AgTech ecosystem goes beyond just individual jobs on the site. Along with other upcoming North St. Louis County investments like the Saint Louis Zoo WildCare Park, the Jamestown Ag-Food Technology Campus will elevate the perception and brand of North County.
Advancing racial equity and social justice is a key element of the Jobs Plan. While the Jobs Plan focuses on the City of St. Louis, the Ag-Food Technology Campus will help extend the goals of the Jobs Plan to an area of the St. Louis region that has seen increased diversity over the last two decades.
The map on this page highlights the existing AgTech "ecosystem" (businesses and organizations in AgTech/Ag-Food) overlaid on a race map of St. Louis County. As the map shows, much of the AgTech "ecosystem" is currently along the Interstate 64 corridor.
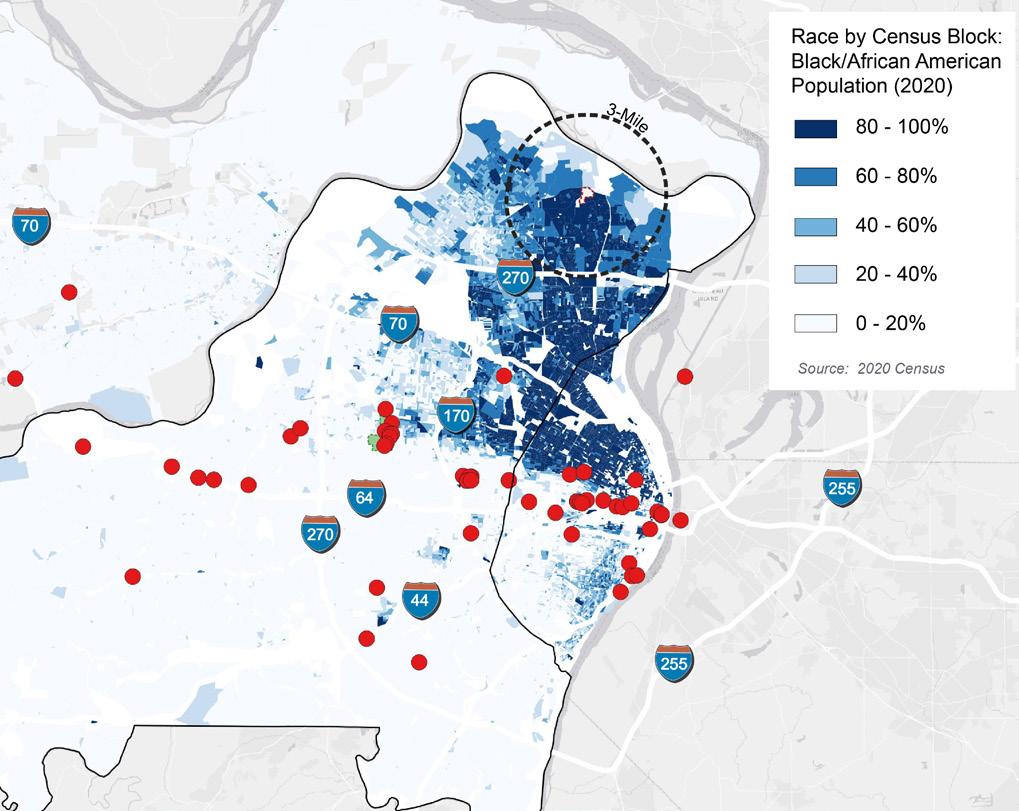
An Ag-Food Technology Campus at the Jamestown Mall site will extend equitable investment in a highly diverse area of St. Louis County.
Jamestown Mall site
Cortex
• Emphasis on expansion space for agriculture technologies and production facilities for growing firms from St. Louis regional AgTech centers.
• In addition to agriculture focus, remain open to research and technology opportunities outside of agriculture that can expand regional opportunities.
• Opportunity for high productivity agriculture facilities utilizing advanced technology in food growth relatively close to population centers.
• Renewable energy (solar) to provide electricity (or partially offset).
• AgTech is a major St. Louis regional economic sector.
• Strong indications of a regional need for additional space for the AgTech sector.
• New science emerging from established companies.
• Spaces/facilities need varies, but could include:
• Greenhouses
• Test plots
• Precision Fermentation
• Lower-cost facility spaces
• Central location in U.S. agricultural belt.
• While onsite jobs may be limited, the site could play an important role in the regional economy.
• Close to skilled labor force
• Close to research centers
• Close to international airport
• Less expensive land
• Agriculture land north of Lindbergh Blvd could support and benefit from this scenario.

• Land is out of flood plain
• Otherwise limited development potential
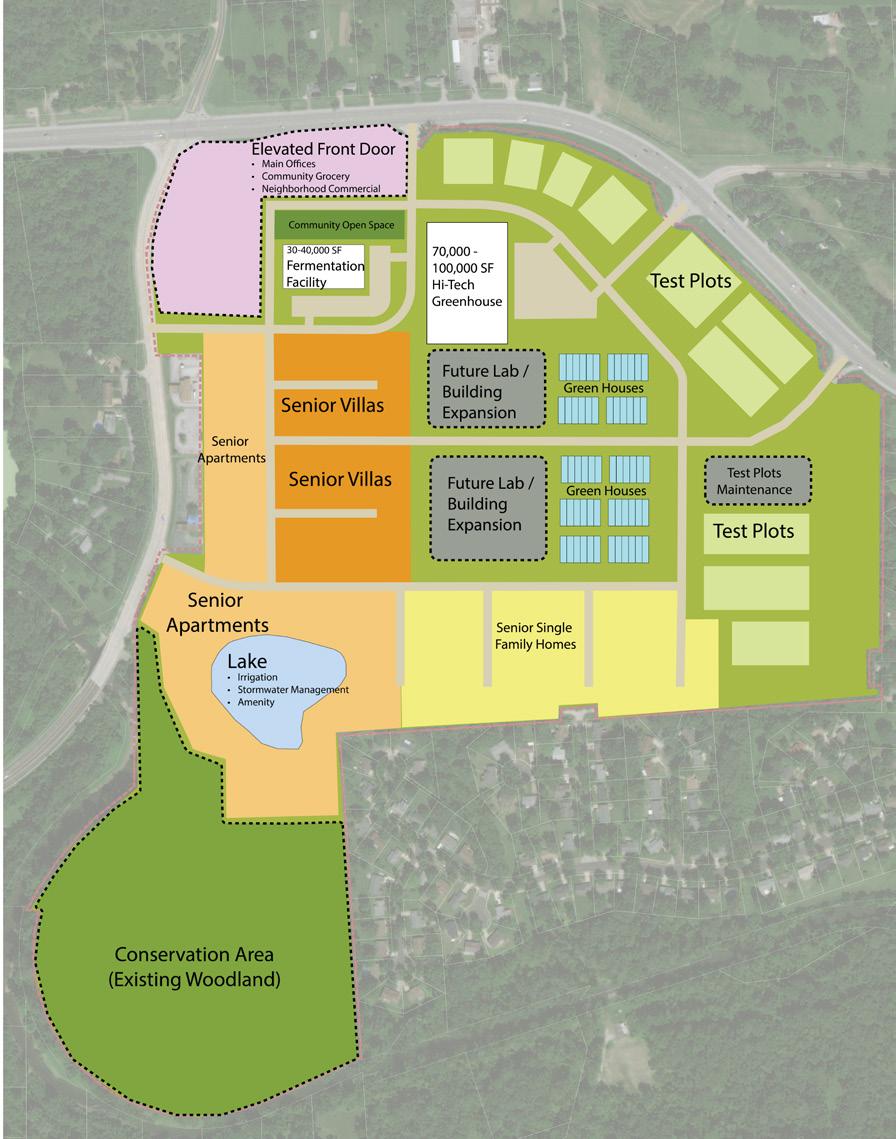
• Hi-Tech Large Scale Green House

• Precision Fermentation Facility
• Greenhouses
• Lower-cost Facilities
• Field Test Plots

• Solar Energy
• Annex Front Door with Office/ Job Training, Neighborhood grocery/retail, Community open space

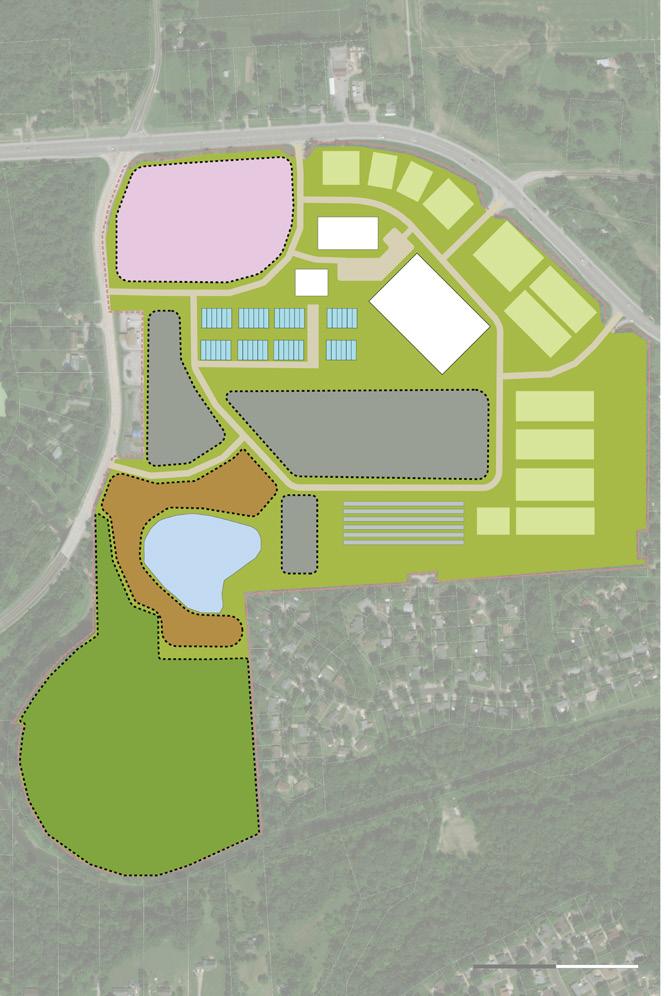
The concept diagram is not a "master plan". It is meant to convey the scale of land uses and potential development principles of the scenario. This is just one example of the potential location of uses on the site.


"Ag-Food Technology Campus" is just a working title for now. Much the same way that "Agriculture and Energy Technologies Annex" or "AgTech Annex" was a working title during the evaluation of the land use scenarios.
However, branding of the Ag-Food Technology Campus will be necessary as the site development moves forward. Alignment with the regional AgTech/Ag-Food ecosystem will elevate the site and north St. Louis County. Therefore, branding is an essential component.
After this Market Analysis and Feasibility Study, the St. Louis County Port Authority intended to issue a request for proposals (RFP) for the site based on the recommendations of this report. The Ag-Food Technology Campus, however, does not lend itself to a traditional developer RFP process. Instead, examples of innovation/technology hubs tend to be a mix of public and private partnerships with a combination of for-sale and for-lease real estate.
The success of this Market Analysis and Feasibility Study has positioned the site to be part of an essential regional economic sector. For the first time in over a decade, there is strong community support for the direction and future of the Jamestown Mall site. The Ag-Food Technology Campus is a forward-thinking economic development opportunity for north St. Louis County that would further elevate the area along with other recent investments, such as the Saint Louis Zoo’s WildCare Park.
AgTech is a “Next-Generation” economic sector for the St. Louis region. In many ways, this is a positive for the Jamestown Mall site. There is an opportunity to be part of the growing momentum and demand for AgTech/Ag-Food investments in the St. Louis region. However, the downside of being a “Next-Generation” sector is that the market demand is not fully realized, at least as part of a linear site development process. There are also limitations to traditional market data to support “Next-Generation” sectors. (Case in point are the recent specialized studies examining the demand for innovation “step-up” space and the demand for a regional specialized fermentation facility.) Much of the market demand is presently based on limited, but illuminating, data and much anecdotal information gleaned from area professionals and economic development advocates.
"For the first time in over a decade, there is strong community support for the direction and future of the Jamestown Mall site."
While the St. Louis County Port Authority could immediately issue an RFP based on the preferred land use scenario (Ag-Food Technology Campus), there are sufficient uncertainties with the AgTech/Ag-Food scenario that it is unlikely that a current RFP will result in an acceptable proposal for the entire site.
Thus, this report recommends the following procedure to initiate the implementation of the Ag-Food Technology Campus scenario.
Complete the demolition of the existing mall and prepare the entire site as an obvious development opportunity. A greenfield site will show progress to the community and greatly increase the marketability of the site moving forward.
Initiate a 24-to-30 month “exploration window” to more fully determine reasonable parameters and financial expectations of the scenario:
• Sponsor or co-lead a “Regional AgTech working group” consisting of economic development organizations serving all or parts of the metropolitan area, workforce and educational organizations training people in ag/tech skills and management, and selected businesses and entrepreneurs in the industry. (The November meeting of such organizations at the St. Louis Economic Development Partnership was a start.) Given the potential national and international impact of this scenario, Greater St. Louis, Inc. and/or the Missouri Partnership could be co-leaders of the working group.
• Create a data-driven and consensus-driven master plan for the site, once again including community input. Residents of north St. Louis County have broadly agreed that this is the preferred scenario, but they did so without a more specific master plan. Only about 100-110 acres of the site’s 142 acres are realistically available for new development in light of the conservation area defined by Cold Water Creek. Still, the AgTech/Ag-Food scenario may not require all 100-110 acres, so other compatible uses should be considered (e.g., senior housing, village-scale retail center).
• Include prospective real estate developers as independent experts to inform the planning process. This will ensure that market potential and financial considerations are realistic. Do not include developers, however, on oversight or planning committees. Keep them at arms-length to preserve their objectivity for eventual RFP responses.
Additional Site Testing
Conduct testing for radioactive contamination. Areas of development on the Jamestown Mall site are well away from Coldwater Creek's floodplain. However, recent conflicting findings at Jana Elementary School of radioactive contamination have created uncertainty about any property adjacent to or near Coldwater Creek. Researchers with the firm Boston Chemical Data Corporation found “entirely unacceptable” contamination levels at Jana Elementary school in samples collected in August 2022. However, the U.S. Army Corps of Engineers St. Louis District issued a preliminary finding in November 2022 that showed no presence of radioactive material above the expected range of background levels (the level of radioactivity Mother Nature already provides) at Jana Elementary school. The Jamestown Mall site should be tested to ease any uncertainty or perceptions of the site.
Issue a developer Request for Proposals (RFP) based on the master plan. With sufficient input from experienced developers during the planning process, the RFP should be explicit enough to encourage competitive responses.
Retain Port Authority control of the site through the exploration window period.
• Assure residents in north St. Louis County that there is and will be consistent oversight of the property by an entity with strong links to St. Louis County government and the range of economic and workforce development entities that should and will be involved.
• Assure that the actions and planning during the exploration window remain consistent with the economic development goals of the Partnership and citizens of North County and with the findings of the current study.
Analyze a variety of techniques to provide public-sector support to assure developer success that also contributes to the socio-economic benefits of the region, the county, and especially North County. Techniques might include, though not necessarily be limited to:
• Provide the site free of charge to the winning development team to reduce its upfront costs. (This will necessarily eliminate direct costrecovery for the Port Authority based on expenditures related to the site.)
• Evaluate financial incentives that could be applied to the development of the site and/or to occupant businesses on the site that improve private sector rates of return. Such incentives could include, but not be limited to:
◊ Property tax abatement
◊ Tax increment financing
◊ Sales tax reductions for construction materials
◊ Income tax credits
◊ Workforce training programs or credits
◊ Retention of employee state withholding taxes
Continue to Generate Local Interest in the Scenario and the Site
• Support schools to teach ag-tech and food growing programs.
• Support collegiate research that reinforces the advanced technology in growing food.
• Sponsor community gardens and related programs that demonstrate the importance and skills in agricultural research as well as techniques for preparing food for human consumption.
Take the current study “on the road” to widely promote that transformation of Jamestown Mall is actively underway, but that input is still being sought for a promising economic development scenario. Sustain top-of-mind interest in the site.
• Maintain an active website, updating with newsworthy accomplishments, meetings, and presentations.
• Make presentations to and participate in meetings with a wide range of professional, community, workforce, educational, and political organizations (among others), including formal presentations to the St. Louis County Council and, possibly, to relevant committees of the Missouri General Assembly. Keep everyone fully, but gently, informed. Continue to reinforce the groundwork for possible future legislative, financial, and community support.
• Create an email list of interested parties for routine (monthly, quarterly) direct communication about progress with the site, its planning, and its accomplishments. This list should include the news media.
• Meet with news media representatives to generate stories about the site, its potential, and its partners. Work with the Saint Louis Zoo’s WildCare Park, surrounding cities, chambers of commerce, and other North County institutions and businesses to prepare joint stories to submit for news media publication.
Given some important circumstances of the housing market in North St. Louis County, such as housing ages, sizes, and relative values, an “easy” solution to the redevelopment of Jamestown Mall could be the creation of newer housing to potentially increase the number of higher quality options for North County residents. New housing might also be a catalyst to attract additional population to North County, which has experienced slight population declines in the last decade.
Public comments during the study period mitigate against a recommendation for “general” housing, however. There is concern that existing housing could be abandoned in favor of new housing in light of no net population growth on the horizon. This could result in more vacancies in older subdivisions leading to conditions of blight. Also, there is concern about owner-occupied housing converting to rental housing over time. (However, as shown in the market research in Part 3, newer housing with higher price points in north St. Louis County has kept very high owner-occupancy rates.)
There is an additional market challenge regarding "general" housing. Increased construction costs have pushed the price point of new singlefamily housing to the margins of what the north St. Louis County market will support.
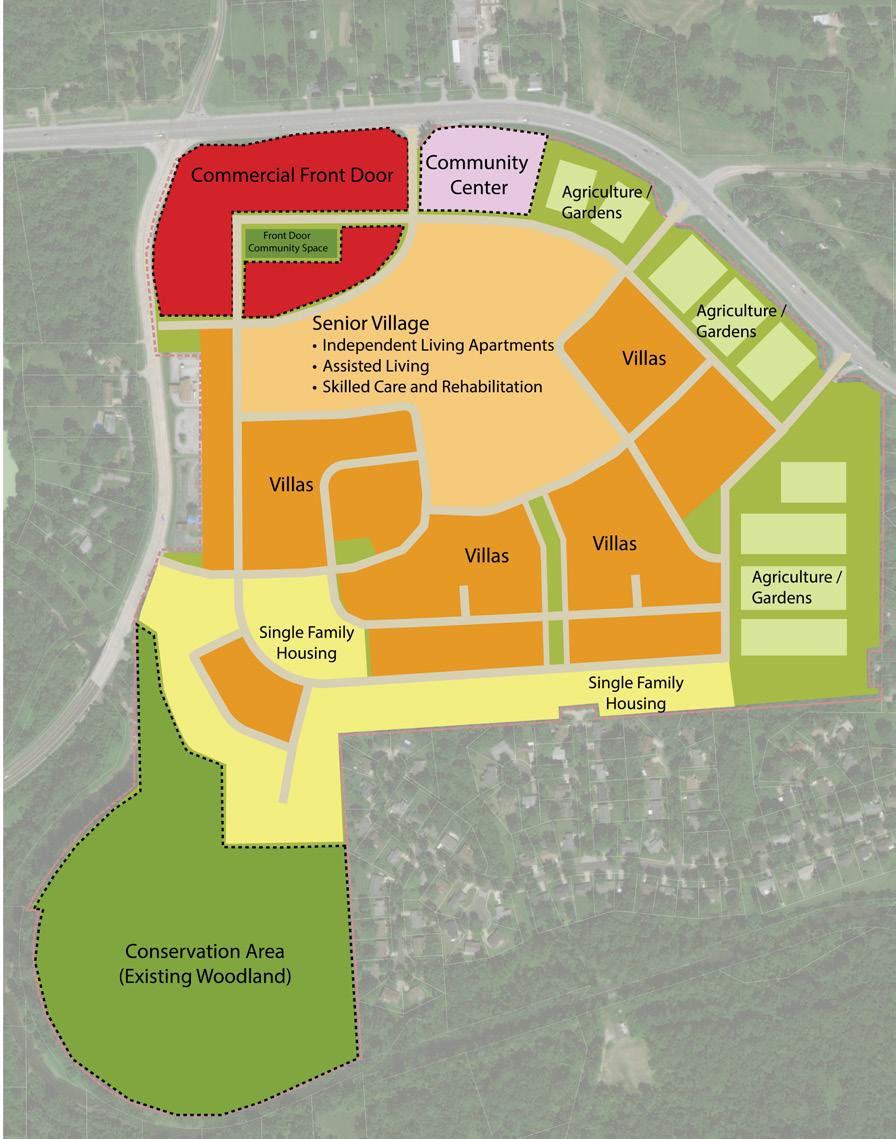
Even with the concerns listed above, the residential scenarios received a substantial amount of favorability from the community. Thus, this report recommends a senior (55+) residential development with agriliving as an alternative land use if the AgTech/Ag-Food Technology Campus is not implemented.
Benefits of the Senior (55+) Agri-Living Residential include:

• Community perspective: More open to senior focused residential.

• Better alignment with market demand with a focus on growing senior population.
• Opportunities for retail/commercial amenities.
• Agri-Living can be a market differentiator.

There is a willingness expressed by the public to support more housing for senior citizens, if only to provide opportunities for elderly residents to remain in North County as their housing needs and physical/ mental capabilities change. Higher density housing for aging citizens is acceptable among the public. New and lower maintenance homes of greater density (units per acre) than prevalent elsewhere in North County could support “aging in place” without violating the general public’s concerns about additional housing. Existing homes occupied by senior citizens can be marketed toward younger families without the need for more single-family homes.
The total senior population is projected to reach nearly 50,000 in North County by 2036, but from just over 40,000 in 2021.
This would be a 20.5% increase in 15 years. While equivalent projections for the entire North County population are not available, U.S. Census projections indicate that America’s total population will increase at only about half that rate.
The senior population is on the rise in North County, though this growth will be concentrated in “older” seniors for the next 15 years or so. These people are part of the post-World War II Baby Boom generation. The Boomers were followed by a smaller cohort.
While the population in general is not increasing in St. Louis County or North County, the population of older adults is increasing. Using a cohort-survival methodology, the number of north St. Louis County residents over the age of 55 is projected to increase from about 41,330 in 2021 to 49,790 in 2031, a jump of more than 20 percent.
This growth will be uneven by age cohort, however. As the baby boomer generation ages, so will the number of people over the age of 70. But smaller cohorts behind the baby boomers will result in declining numbers of people in North County between 55 and 70. Thus, the greatest housing need (opportunity?) is centered on the very old, who are also least likely to be able to maintain their current homes.
Sources: Esri and SLU Community Planning Lab
Above: The total senior population is projected to reach nearly 50,000 in North County by 2036, from just over 40,000 in 2021. This would be a 20.5% increase in 15 years. While equivalent projections for the entire North County population are not available, U.S. Census projections indicate that America’s total population will increase at only about half that rate.
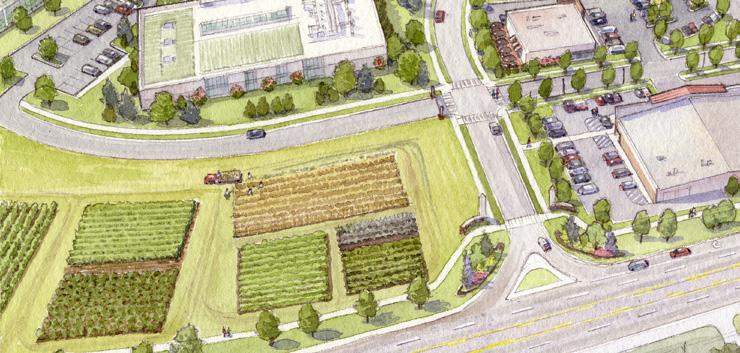
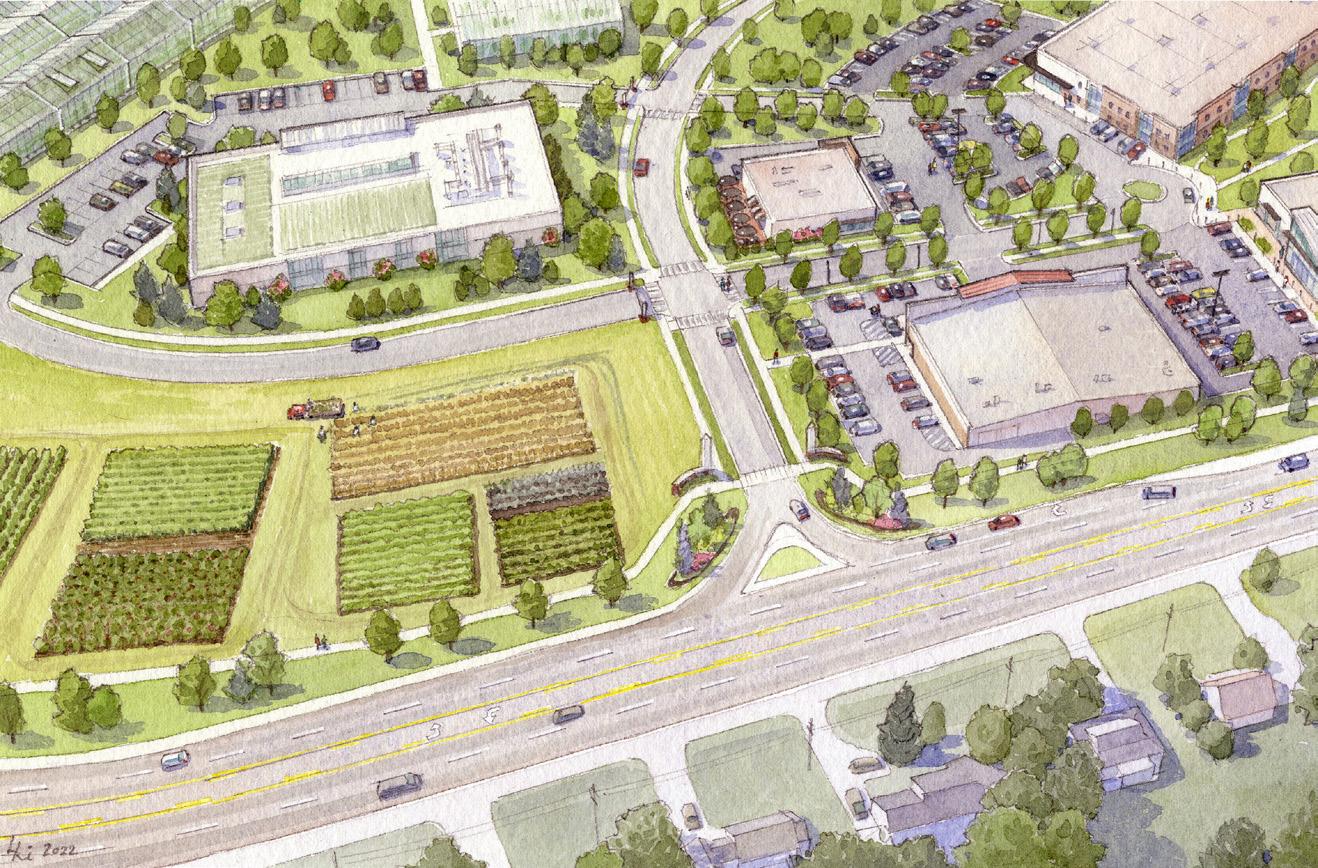
This scenario would also include a “village-scale” commercial center (best located on Lindbergh Boulevard as a re-branded entryway to the site) that is walkable from the senior housing with charming boutique shops and dining places. Walkability is important to minimize the number of on-site vehicle trips while encouraging healthy exercise among the senior residents. The commercial center would also welcome shoppers and diners from throughout North County and the region. Their vehicles, however, would not need to enter the senior housing neighborhoods.
That said, the prospective market for additional retail and dining options in North County is questionable. To date, retail and dining sales in the four zip codes that comprise almost all of North County north of I-270 are about 70 percent higher than the buying power of those zip codes would otherwise indicate. That is, North County retailing (mostly concentrated along Lindbergh Boulevard in Florissant and Hazelwood) is a major net attractor of consumers from other parts of the region— most probably from south of I-270. Attracting more shopping and dining establishments would be difficult in an already over-built environment.
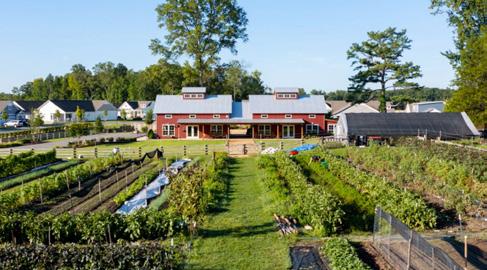
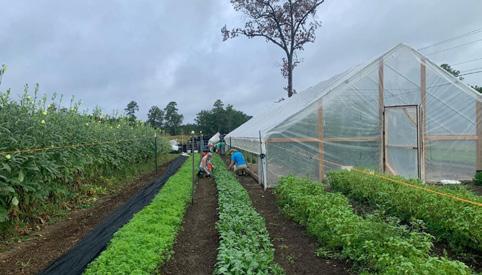
The scenario envisions a combination of senior living with "agri-living" that could be a market differentiator for the residential community. Agri-living residential communities are focused around working farms and/or community gardens. Residents find agri-living communities attractive because of their rural character, farm-to-table aspects, available open space, and amenities.
The twenty-plus acres of outlots at the Jamestown Mall site could serve as the primary area for the working farm. In addition, a potential customer for the working farm could be the nearby Saint Louis Zoo's WildCare Park, which could lend the agri-living development additional branding and cachet.
This alternative scenario goes further with outdoor recreation and exercise. A trail system through the Jamestown Mall site would inspire longer walks, particularly if the trail is lined with natural plantings and interesting architecture of on-site buildings.
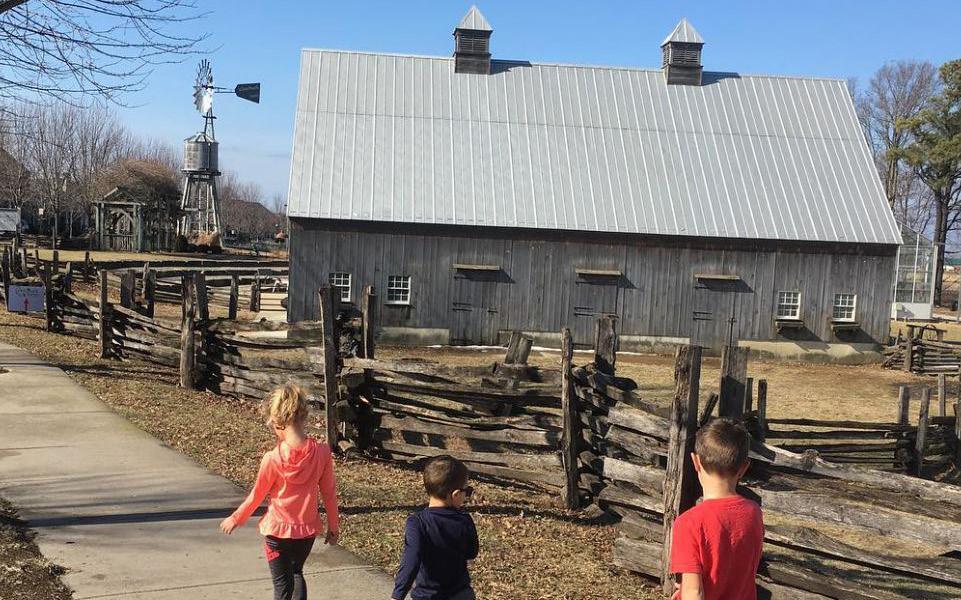
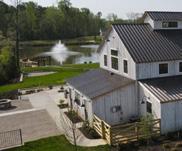
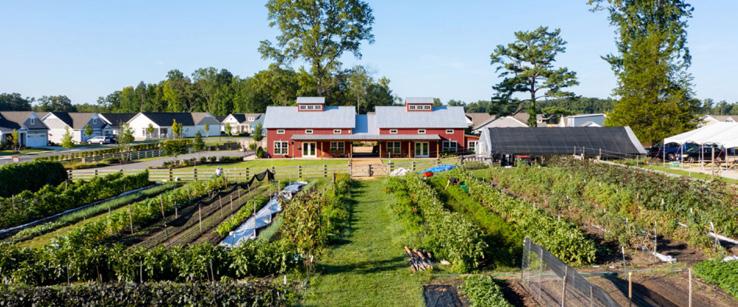
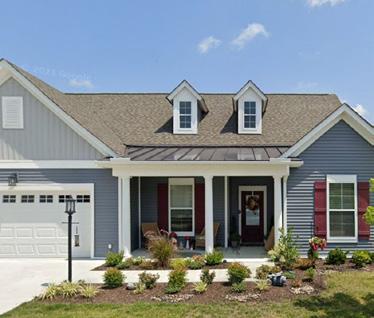
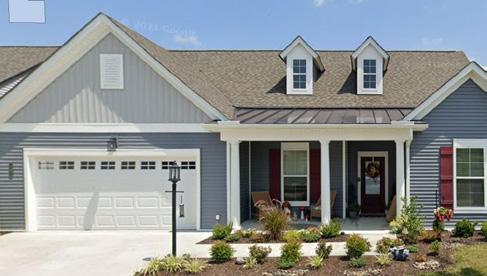
Chickahominy Falls near Richmond, Virginia, is an example of a senior (55+) agri-living residential development. The overall development is approximately 180 acres with a 10-acre working farm. Key amenities include:

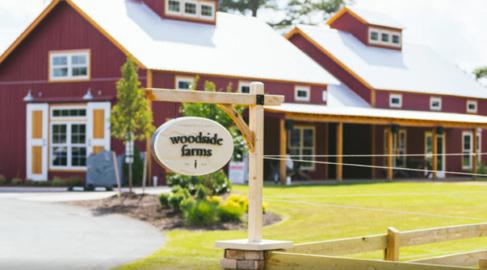
• Event space (The Barn) with demonstration kitchen
• Community clubhouse
• Walking trails
• Fishing pond
• Conservation areas
The working farm is privately owned and operated, separate from the community homeowner association (HOA). Residential housing includes a mix of single-family homes, villas, and townhomes. A low (or no) maintenance lifestyle is a key selling point along with nature, health, and wellness as part of the agri-community concept.
Right: Master Plan of Chickahominy Falls
Working farm
An important challenge, of course, is the well-known “gap” between today’s costs to construct and provide senior housing and the ability of the market to afford the necessary prices and rents. Construction costs for good quality housing almost certainly exceed the ability to pay in lower-middle income areas like North County.1 This lower-middle income dilemma has fueled the extraordinary amount of “institutional buying” of single-family homes in North County in recent years by large real estate firms. These homes are typically upgraded lightly, then rented to households who would like to purchase but whose resources cannot generate sufficient down payments that qualify for mortgage loans. Renting becomes a good alternative for families wanting the benefits of single-family housing, but an increase in renters also means fewer on-site investors (i.e., homeowners) in the neighborhoods.2 These income challenges could well extend to senior housing on the Jamestown Mall site.
Thus, some kind of development subsidy or incentive is likely to be required to support the senior housing alternative. Incentives could take the form of a land donation where parts of the Jamestown Mall site, after clearance, are effectively given to senior housing developers, thus reducing their overall costs and reducing the need for higher prices and rents. Maximum reutilization of existing infrastructure on site (on the surface and underground) could also reduce development costs. There are also housing support payment programs for qualifying households than can be directed to the seniors themselves in addition to incentives to the developer(s).
1) This is a challenge in countless communities throughout the United States and even in the St. Louis metropolitan area. North County is not unique in this regard.
2) North St. Louis County appears to be the most intensive concentration of this “institutional” invasion in the metro area, but it is a phenomenon taking place in virtually every metro area of the U.S.
Of course, the donation of land by the current owner of the Jamestown Mall site would mean no direct recovery of costs that have been and yet-to-be committed to the site. This is an outcome that the St. Louis County Port Authority and the St. Louis Economic Development Partnership must address in the context of larger forces and needs. Returning the site to the property tax rolls is an indirect cost recovery for county government and overlapping taxing districts. Eliminating future costs is another “saving.” There may also be indirect benefits to St. Louis County government from added retail sales taxes, utilities franchise taxes, business licenses, etc.
The concept diagram is not a "master plan". It is meant to convey the scale of land uses and potential development principles of the scenario. This is just one example of the potential location of uses on the site.
The concept diagram is not a "master plan". It is meant to convey the scale of land uses and potential development principles of the scenario. This is just one example of the potential location of uses on the site.
This concept diagram explores combining the preferred land use (AgTech/Ag-Food Technology Campus) with senior housing. A benefit of this approach is the potential for faster build-out of the site.
However, the drawback of utilizing a substantial area of the AgTech/Ag-Food Technology Campus for senior housing is that it limits the available acreage for the expansion of AgTech/Ag-Food facilities.
Development principles are the desired characteristics of development. These principles will help inform future development proposals and standards to help ensure community expectations are met.
The development principles shown are based on conversations with the community.
At the second public forum on September 21, 2022, attendees were asked to rank the development principles in terms of importance. 'Long Term Maintenance and Stewardship' was ranked as the most important development principle with 81% ranking it "Very Important" and 91% of respondents ranking it as "Very Important" or "Moderately Important." 'Walkable' was ranked second.
Ensure on-going programming, maintenance, and security of community open spaces. Strong internal policies should be in place to adequately fund programming, maintenance, and security.
Multi-Use Trail Along Lindbergh Boulevard
St. Louis County 'Action Plan for Walking and Biking' recommends a future trail along Lindbergh Boulevard. The Jamestown Mall site is an important segment for the future Lindbergh trail.


Interconnected System of Sidewalks and Trails
• Connections to Neighborhood Commercial
• Connections to Lindbergh Boulevard
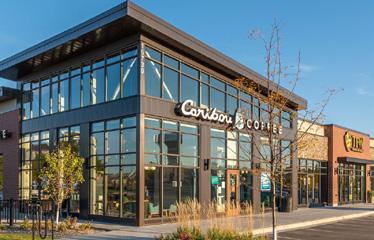
Pedestrian Oriented Commercial
Commercial areas should be readily accessible for pedestrians. Just as important as safe access, commercial areas should feel comfortable for pedestrians through appropriate building scale, architectural edges, and welcoming transitions.


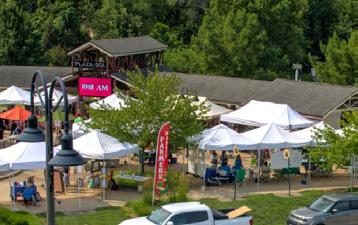
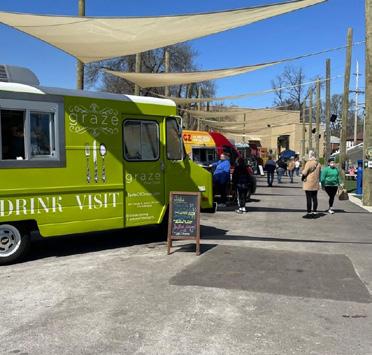
Amenity area part of the commercial node or front door area that can be a flexible outdoor community space.
• Much like a "quad" on a corporate or college campus, an informal neighborhood gathering area becomes a center of activity for active or passive uses.
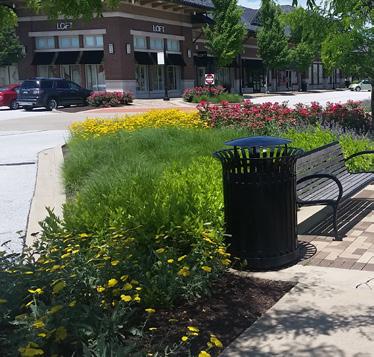
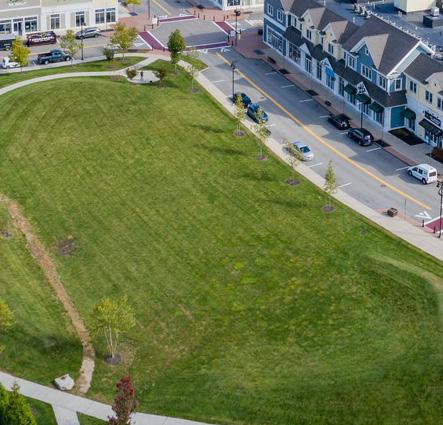
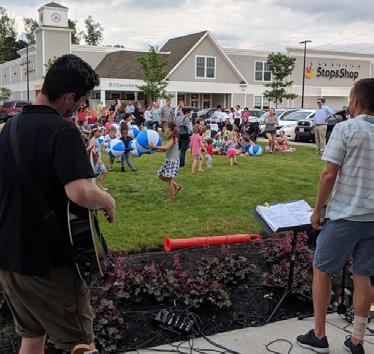
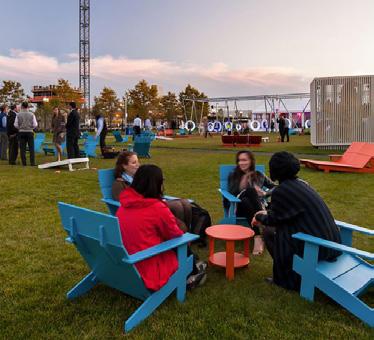
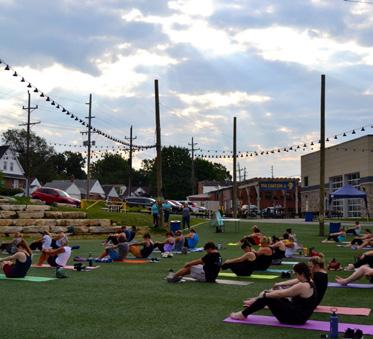
• Regular programming is critical such as food trucks, farmers’ markets, entertainment, etc. Opportunity for adjacent restaurants to utilize the space for additional seating.
• Part of the “front door” arrival experience. High quality design with thoughtful landscaping and site elements.
• Likely 0.5 - 1.5 acres in size.
• Retail, restaurants, and office space should take advantage of the amenity by fronting the space.
• Architecture should include high quality materials, thoughtful building facades (windows, awnings, and other details), signage that is appropriately scaled for the building and compliments the architecture, and architectural lighting.

• Areas should feel comfortable for pedestrians through appropriate building scale, seating and plaza areas, architectural edges, welcoming transitions, and buffering from vehicles and parking.

• Quality details include high attention to pavements, lighting, seating, signage, and entry elements. Thoughtful landscaping should help screen parking areas, reinforce edges, define outdoor spaces, soften hardscape and building edges, and create welcoming textures.
Karst preservation area to the north makes the natural setting of this part of St. Louis County a key strength.
Open space, landscaping, and natural features of development should complement the surrounding context.
Site uses adjacent to existing residential south and east of the site should include residential or landscape/open space buffering.
The diagram on this page highlights the overall approach for the report. An initial six land use scenarios were researched. Then, based on the market analysis and feedback from the community, three land use scenarios were analyzed in order to develop a final land use recommendation.
Public Forum #2 September 21, 2022 Winter/Spring 2022 Fall 2022
Public Forum #1 June 29, 2022
Initial
Final
The preliminary analysis and evaluation for the six scenarios were based on the following factors. These factors were consolidated as part of the evaluation criteria developed in this phase. For the complete market research compilation, see Part 3 of this report.
• Regional Economic Trends
• Regional Business And Employment Concentrations
• Demographic And Population Trends
• Housing Trends
• Labor Force Needs
• Place-Making Opportunities
• Job And Local Business Creation
• Return On Public Investment
• Existing And Potential Changes In Zoning
• Transportation And Parking
• Existing Utilities
• Market Area Supply For Each Use
• Market Area Demand For Each Use
Concurrently with the initial analysis, the planning team began conversations with the community about the scenarios.
Twelve (12) small group meetings starting from late April to early June with subdivisions, neighborhood organizations and other groups.
Open house style forum for the whole community on June 29, 2022 to review and provide feedback on the initial scenarios.

The following pages include a brief description of the initial six land use scenarios that were the starting point for the study. The scenarios were developed based on an initial high-level market assessment and discussions with regional and state economic development professionals. The planning team also researched past community comments, including the Fall 2017 public meeting regarding the Jamestown Mall site.
In addition to the six initial land use scenarios, the planning team considered two other land use scenarios that did not make the cut for the initial six. The two scenarios were:
•
Description
Large scale retail complex anchored by big boxes and national brands.
Saturated North County retail supply, unserved by interstate highway, lack of adjacent population.
Each of the scenarios is organized as shown below.
Short description of the scenario.
•
High quality sports and outdoor recreation complex.
There are many similar places in the St. Louis region.
Potential strengths of the scenario and positive initial factors that the scenario will be commercially viable.
Potential weaknesses or negative aspects of the scenario.
Particular questions and further research for the initial analysis.
Description
Large scale subdivision or set of subdivisions of “middle housing” affordable to middle and working class households. Senior housing component. Village-scale retail shops and restaurants.
High quality, new housing in suburban format for up-and-coming households and seniors; replacement for older North County housing. A competitive product when compared to new housing in St. Charles County and Metro East.
Description
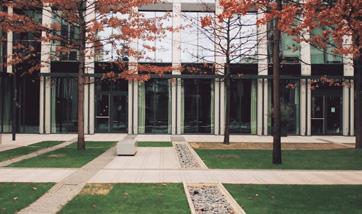
Corporate campus with office buildings, parking, and amenities. Major corporation or two attracted to or expanding in greater St. Louis.
Positive Market Position
Available “inventory” of large land area for regional economic developers; high value opportunity for St. Louis County; the number one strongest economic sector in metro St. Louis is “management of businesses and enterprises.” St. Louis is a headquarters town—build on that strength.
Description
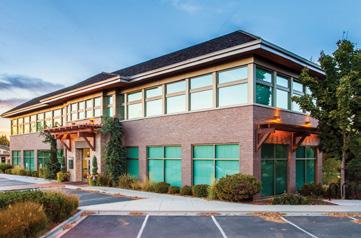
Advanced high tech manufacturing (clean) and/or data center. High quality and higher paying jobs. Draw on large metropolitan labor force as well as academic and corporate research.
Growing demand from center of USA. Competitive strength of greater St. Louis, including ongoing tech skill upgrades of the metro labor force (e.g., LaunchCode). Expansion space for companies graduating from incubators. Available electric power.
Extremely sluggish regional net population growth, could leave older North County housing (that is less attractive to modern home-buyers) behind.
• Opportunity for mix of uses, including some neighborhood retail. Percentages to be determined.
• Could the residential mix include multifamily. Mix of for-sale and rental.
Corporate candidates for site few and far between, long wait for development, and persistent holding costs.
• Opportunity for complementary mix of uses including neighborhood retail, small business space.
Regional competition, site constraints, zoning changes may open door to less desirable uses. Traditionally, data centers are not huge employers.
• Narrowing down the potential type of manufacturing.
Description
Warehousing and distribution center with trucking for movement of goods into and out of greater St. Louis and a large part of the Midwest.
Positive Market Position
Growing demand from center of USA. Competitive geographical strength of greater St. Louis. Previous interest from developer.
Description Research park with consortium of area universities (like UMSL) with concentrations of research, development, post-docs, etc., on cutting edge technologies outside the bio-ag sectors.
Positive Market Position
Expansion space for Cortex and other incubator graduates. Tech skills advancing rapidly in greater St. Louis with LaunchCode, STEM programs at universities. Increased opportunity to retain technological advances in St. Louis.
Description
Intensive outdoor and indoor farming of high value food products; alternative energy field (wind and solar); testing sites for commercialized bio-ag technologies.
Positive Market Position
Growing demand from center of USA. Competitive strength of greater St. Louis in USA agriculture heartland. Supportive infrastructure for ag entrepreneurs in St. Lois (Helix, Danforth, Cortex). Alternative to California and foreign nations for high value food products. Available electric power. Ample local water/irrigation sources.
Competition from, particularly, Metro East.
Truck traffic. Some distance from interstate highways. No railroad adjacency. Community concerns.
• Saturation of the regional logistics market.
• Lower quality, lower paying jobs.
• Compatibility with current land uses.
Potential overlap with other regional centers such as Cortex or 39 North. Likely a long wait for full development and persistent holding costs.
• Scale of growth prospects. How big is the market potential?
Not many jobs. Some jobs high quality, high paying; some entry-level jobs, low paying. Not high value land uses. Tax status— commercial or agricultural.
• Compete with California, etc.
• Reduced transportation costs to markets.
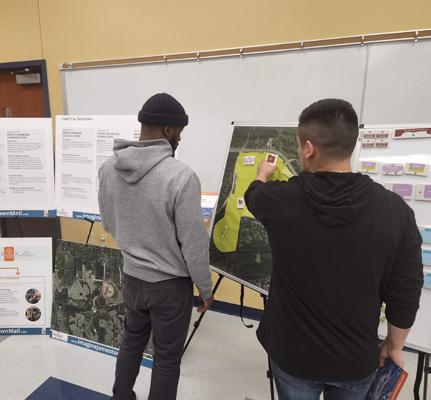
The planning team conducted a listening tour from late April to June to hear from neighborhood associations, subdivisions, and other groups their thoughts on the initial six scenarios. The focused neighborhood conversations allowed residents to have in-depth conversations with the planning team.
April 28, 2022 Williamsburg Manor Subdivision
May 9, 2022 North County Chamber
May 9 , 2022 Spanish Lake CDC
May 10, 2022 Old Jamestown Association
May 12, 2022 Multiple Subdivisions
May 17, 2022 Spanish Lake Neighborhood Assoc.
May 22, 2022 UCC Zion Church
May 23, 2022 Robin Mills Estates Subdivision
May 24, 2022 Students, Hazelwood High School
May 25, 2022 Students, St. Louis Community College
May 26, 2022 North County Inc. Board Meeting
June 2, 2022 Multiple Subdivisions
June 28, 2022 Pop-up at North County Rec Complex
The following criteria were used to evaluate the land use scenarios.
Evaluates the likely number and quality (higher wage) jobs that the scenario is likely to directly support.
Anticipates how much public revenue might be generated by the scenario to pay back or support the public investment in the site.
Assesses the prospects for the fulfillment of the scenario within a reasonable period of time, which might require several years.
Considers the prospective speed of development and occupancy of the site; sooner is better when considering rents and sale prices that could be generated to support investment and public return on investment.
Assesses the opportunities for entrepreneurs and small businesses, especially focused on independent retailers.
Considers place-making aspects such as walkability, architecture, building scale, and community gathering areas that contribute to a welcoming “sense-of-place”.
Anticipates whether existing utilities and infrastructure serving the site are suitable.
Evaluates whether future zoning and land use will be compatible will surrounding land uses.
The evaluation is based on learned analysis of market conditions as evaluated for the initial six scenarios. For the final three scenarios, quantified projections were developed where possible.
Each criteria was rated on a scale of low, fair, moderate, and strong.
Large scale subdivision or set of subdivisions of “middle housing” affordable to middle and working class households. Senior housing component. Village-scale retail shops and restaurants.
Residential development should enjoy relatively rapid market absorption in North County because of the amount of new housing (low maintenance, high quality) while a small retail center would benefit from a large number of local customers.


Residential development lends itself well for walkability with internal streets and trails. Subdivision common areas can host amenities such as community gathering areas. A small retail center will have the opportunity for small plazas and outdoor seating and could take advantage of the adjacent location to other amenities (common ground, community center, etc). A subdivision clubhouse or public community center could anchor the development.
The area around the site is dominated by single-family residential. Thus the scale and land use of new residential development is highly compatible with nearby uses.
The property tax base created by the added market value of the site would be diminished by its residential designation (lower assessed valuations), so the rate of return would likely be in the moderate range.
The on-site residential population provides for an immediate customer to retailers. A ladder of vending opportunities provides the opportunity for more retail space at a lower cost and to align programming (e.g., farmers’ market and food trucks for special event days, brick-and-mortar, kitchen incubator, etc.). Opportunities to pair development with programming to bring people on-site.
Residential may add additional sanitary flows that would require upgrades of the Metropolitan St. Louis Sewer District pump station and increases in storage.
Job creation would likely be low since most of the scenario would be for private housing while wages at retail stores would not be high on the scale.
If - a big if - Jamestown Mall can be patiently set aside as a prospective corporate campus site, the eventual result would likely be strong job prospects at high average wages. The challenge for future such campuses is attracting (or growing) such companies in the greater St. Louis market, a very difficult marketing objective.
Corporate campus with office buildings, parking, and amenities. Major corporation or two attracted to or expanding in greater St. Louis.
The prospective tax revenues generated by the property value and buying power of the employees should generate a strong rate of return on the public investment.
Corporate campuses offer excellent opportunities for placemaking, with businesses wanting to create a vibrant campus atmosphere to attract and retain employees and create a welcoming environment for visitors.
The existing utilities and infrastructure that serve the site and vicinity are generally suitable for the proposed scenario.
Retail and restaurants likely limited with daytime office hours of employees. Opportunity to offer emerging businesses partnership opportunities with corporate office tenants (such as service providers, back office task, and catering). Opportunity for incubator space and mentor programs.

Metro St. Louis has many corporate campuses for large companies. The challenge for future such campuses is attracting (or growing) such companies in the greater St. Louis market. Prospects for a new corporation (or two) are not on the horizon, though they are not uncommon in St. Louis. Thus, there is only a low to fair chance for nearerterm commercial viability or market absorption.
A corporate campus, appropriately scaled with green space and landscaping has fair compatibility with adjacent and nearby low density uses.
Prospects for a new corporation (or two) are not on the horizon, though they are not uncommon in St. Louis. Thus, there is only a low to fair chance for nearer-term commercial viability or market absorption.

Advanced high tech manufacturing (clean) and/or data center. High quality and higher paying jobs. Draw on large metropolitan labor force as well as academic and corporate research.


Manufacturing has been a core of economic strength in greater St. Louis for two centuries. With the virtual build-out of St. Louis County, sufficiently sized sites that attract high-tech, advanced manufacturing companies into the county have all but disappeared. This scenario would offer a large site for multiple manufacturers creating high value products. If that happens, many good-paying jobs can be supported and resultant public revenues triggered by the site can also be strong.
The existing utilities and infrastructure that serve the site and vicinity are generally suitable for the proposed scenario.
Market absorption could be fair if some initial tenants can be attracted (see Commercial Viability).
Market indicators suggest that most manufacturers, and related businesses, are more likely to be attracted to outlying metropolitan counties with higher quality access to railroads and interstate highways, so commercial viability is low.
Many small business opportunities in manufacturing (clothing, jewelry, foods) may better be served in regional incubator spaces or retail oriented spaces.
The functional aspect of logistics buildings (lack of windows, blank facades, etc.) provides limited opportunities for place making. Creative site design standards would be required to improve the ranking for place making.
Unlike most of the scenarios that could be zoned the same as the current zoning (C8 – Planned Commercial), manufacturing would likely require rezoning to a Manufacturing designation. A data center could be considered as “fair” compatibility since it could be zoned under the C8 designation.
The existing utilities and infrastructure that serve the site and vicinity are generally suitable for the proposed scenario.
Logistics and distribution center with trucking for movement of goods into and out of greater St. Louis and a large part of the Midwest.
A moderate number of good-paying jobs can be attracted, though highly automated systems diminish prospects for strong job growth.
Logistics centers are typically considered industrial sites with relatively low property values; the prospects for financial return to the public sector are also moderate.
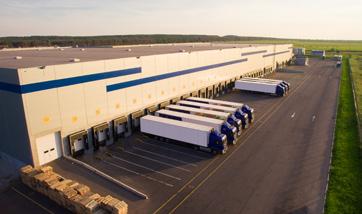


Greater St. Louis has added substantial logistics (distribution, warehousing, and related) facilities with attendant rail, truck, air, and water transportation in the last 25 years or so. It makes sense. St. Louis is in the middle of North America and is served well by many rail companies, multiple highways, massive waterways, and two international airports. Given a great deal of competitive sites in the metro area, a logistics center also has moderate prospects for nearer-term commercial viability (at this location) and its pace of market absorption.
The functional aspect of logistics buildings (lack of windows, blank facades, etc.) provides limited opportunities for place making. The large scale of logistics buildings limits opportunities for walkability. Creative site design standards would be required to improve the ranking for place making.
Smaller, flex space could support growing small business and entrepreneur opportunities but may be better served in niche locations instead of a new logistics center providing larger scale operations. Food service may be an opportunity with the concentrated workforce.
No surrounding or nearby uses that are similar in type or scale. Karst topography north of Lindbergh Boulevard prevents opportunities for the expansion of similar uses.
A campus style environment (think Cortex) offers excellent opportunities for place-making with businesses wanting to create a vibrant campus atmosphere to attract and retain employees and create a welcoming environment for visitors.


Research park with consortium of area universities with concentrations of research, development, post-docs, etc., on cutting edge technologies outside the bio-ag sectors.
The existing utilities and infrastructure that serve the site and vicinity are generally suitable for the proposed scenario.
Job creation could be moderate, though educational and training requirements would likely be high

There is often a large public sector commitment required of advanced tech centers (e.g., public-private partnerships in the advancement of the economy), so a rate of return on public investment from the site would be moderate, though growth in the regional economy could be highly enhanced.
Moderate employment with higher wages could serve to support independent businesses. Modern research parks are mixed-use environments that provide much more opportunity for retailers. Research parks will often include as part of their mission incubators, accelerator, and entrepreneur programs.
Greater St. Louis has accomplished much in the attraction and growth of high tech research, development, and commercial production in technology sectors where the region has particular strengths. These include agricultural, aerospace, and financial technologies but also some in manufacturing advances. If the region can support more land for continued expansion of cutting edge technological growth, Jamestown Mall might be competitive. But, in light of still-growing tech centers like Cortex in the city of St. Louis and 39 North/Danforth Plant Science Center in Creve Coeur, prospects for commercial viability and market absorption in the next decade or so are fair at best.
A corporate campus, appropriately scaled with green space and landscaping has fair compatibility with adjacent and nearby low density uses.
The existing utilities and infrastructure that serve the site and vicinity are generally suitable for the proposed scenario. Renewable energy is an opportunity to generate power for the grid.

Intensive outdoor and indoor farming of high value food products; alternative energy field (wind and solar); testing sites for commercialized bio-ag technologies.


The rate of return on public investment could be moderate in light of the value of the land supported by valuable agricultural production. If the land is designated as agricultural for tax purposes, however, the return on investment might decline.
The low intensity of the land use (agriculture) and/or renewable energy is compatible with surrounding land uses that are suburban and even rural in character. Larger scale indoor ag facilities will need to be properly sited for transitions to nearby uses. Several options for zoning include keeping the current C8 Planned Commercial designation or even down zoning to a less intensive designation.
Feeding the world has long been the central mission of many St. Louis corporations, resulting in St. Louis becoming a world center for ag research and productivity. If other business ventures are too difficult to attract to North County, development of the land for high value food production should be a reasonable alternative for the site. In light of strong urban farming trends and the history of St. Louis as a center of the ag industry, Jamestown Mall could have fair chances for commercial viability and market absorption. But greater St. Louis is also surrounded by some of the most productive farm land in the world, so the costs of production that might be perceived at a suburban location could very well be out-competed by nearby land in outlying counties.
While several trends in indoor agriculture point toward large scale production facilities, the site could be an opportunity for agriculture startups needing additional space.
The lower intensity of the land use may fit well scale wise with surrounding uses. However, a lack of pedestrian and development nodes may limit place-making. Community access, dedicated community space, and programming such as special events will help improve place-making opportunities.
Low job generator given the intensive use of land not requiring jobs.
The first public forum for the Jamestown Mall Market Analysis and Feasibility Study was the opportunity for the community to formally provide feedback on the initial six land use scenarios.
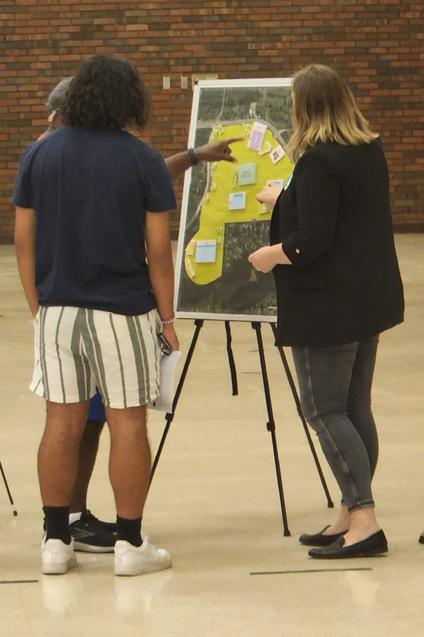
The public forum was held on Wednesday, June 29, 2022, from 4:30 - 7:30 pm at the Saint Louis Zoo WildCare Park. The meeting was an open house style format where attendees had the opportunity to talk one-onone with team members while reviewing and offering feedback on the initial six land use scenarios. Attendees also had the opportunity to help prioritize evaluation criteria.
There was a great turnout with over 200 attendees.
Residents had the opportunity to fill out a comment form at the meeting or an online comment from June 29 through July 20, 2022.

"Love the transparency, Love the sample scenarios."Comment from Forum
the results to the left show, five out of the six scenarios received strong
from the community.
one scenario that received strong unfavorable responses was Scenario D - North Lindbergh Logistic Center.
Below is a summary of key themes heard from the community during the small group meetings, public forums, and comment forms.
The distance someone lived from the site impacted their opinions on scenarios. The farther away someone lived, typically, they were more open to the various scenario options. However, the closer they were to the site, the more concerns there were, especially regarding the logistics centers (as part of the first six land use scenarios).
For the final three scenarios, residents who lived closer to the site greatly preferred the AgTech Annex scenario compared to all respondents.
Especially during the initial evaluation of the first six land use scenarios, there was great openness to learning more about the scenarios. This openness reflected the significant percentage of survey respondents who picked “neutral” when asked, “how do you view each scenario in terms of favorability.” The planning team also heard this in small group discussions. Attendees asked great questions to learn more about the different scenarios.
However, the openness was not universal. Some residents had strong opinions about specific scenarios (or aspects of certain scenarios), but overall most residents were open to learning more about the strengths and weaknesses of the scenarios.
Residents felt some planning fatigue when the planning process started in early Spring 2022. There was also frustration about the lack of progress on the site. However, when news broke later in the Spring about funding for demolition and the sight of workers doing remediation work at the Mall, there was visible excitement among residents that progress was finally happening.
There were mixed opinions in the community about having a clean greenfield (post-demolition) and swift redevelopment of the site. Much of the surrounding area, especially north of Lindbergh, is almost rural in character, with a scattering of agricultural fields, open space, and lowdensity residential. Therefore, many residents would be content to have a greenfield (or other passive use) of the site. However, many residents also expressed the desire to quickly have meaningful development and reuse of the site.
Opinions about the land use scenarios vary based on how close someone lives to the Jamestown Mall site
A key finding of the market analysis showed that retail viability for the site was very low due to several factors. The market analysis showed that existing retail competition in North County (primarily the Lindbergh corridor in Florissant), lack of population density near the site, and overall trends in retail meant that new retail on the site was not commercially viable. While most residents understood the retail challenges for the site, many residents still had a wish list of desired retail, including Trader Joe’s, Whole Foods, and Costco (among others).
Many community comments asked for a “Streets of St. Charles” type of development. Unfortunately, the market demand for the scale of commercial development similar to the “Streets of St. Charles” isn’t realistic for the Jamestown Mall site. However, many qualities of a “Streets of St. Charles” (walkability, programming, and quality architecture) could be part of future development at the Jamestown Mall site.
A consistent theme throughout the small group discussions, public forums, and comments was the desire for community. Ideas from residents on how community could be achieved significantly varied, ranging from physical elements (community center, community open space, etc.) to programming (events, opportunities for families, etc.)
The term “elevate North County” heard in the small group discussions and comments captured a broader sentiment among many residents. Residents would like to see north St. Louis County have the same amenities and resources as other parts of St. Louis County and the region. The future Saint Louis Zoo WildCare Park is an excellent example of “elevating” North County. WildCare Park will be a huge investment and a significant tourist attraction.
While the Jamestown Mall site is a different context, residents want a land use that further elevates the perception of North County.
The vacant Mall has been a community eyesore for many years. Residents were very concerned about future developments (buildings) becoming vacant in ten to fifteen years. Many residents prefer a more conservative development approach, such as keeping a greenfield in the short-term, to ensure long-term, viable development.
The diagram on this page shows how the final three land use scenarios came from the initial six land use scenarios.
Public Forum #1
June 29, 2022
Three Land Use Scenarios for Final Analysis
Public Forum #2 September 21, 2022
Winter/Spring 2022 Fall 2022
Six Initial Land Use Scenarios
Initial Analysis and Community Feedback
1. Jamestown Green Estates 2. Jamestown Village 3. Agriculture and Energy Technologies Annex
Final Analysis and Community Feedback
Final Land Use Recommendations
AT PUBLIC FORUM #1
Scenario A
JAMESTOWN ACRES ESTATES
Scenario B
NORTH LINDBERGH CORPORATE CAMPUS
Scenario C
NORTH LINDBERGH
COMMERCE HUB
Scenario D
NORTH LINDBERGH LOGISTICS CENTER
Scenario E CENTER FOR CRITICAL TECHNOLOGIES
Scenario F GREEN ACRES AGRICULTURAL AND ENERGY CENTER
Based on market research and community feedback, the final three land use scenarios contain aspects from the first six scenarios.
THREE LAND USE SCENARIOS AT PUBLIC FORUM #2
SCENARIO 1: JAMESTOWN GREEN ESTATES
Combination of Scenario A (residential) with aspects of Scenario F (agriculture/open space)
SCENARIO 2: JAMESTOWN VILLAGE
Combination of Scenario A (residential) with aspects of Scenario B (office) and Scenario E (incubator space)
SCENARIO 3: AGRICULTURE AND ENERGY TECHNOLOGIES ANNEX
Combination of Scenario F (agriculture) with Scenario E (ag-tech research).
• Residential mix with a strong emphasis on open space/agriculture as a market differentiator (agri-living).

• Professional agriculture growing facilities, community gardens, or open space/natural areas.


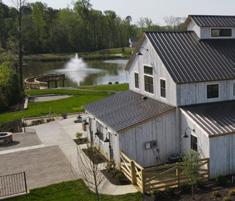

• Higher density residential, ranging up to townhomes/duplexes.


• Small area of higher density for senior living apartments.
• Shared community space like a village green; integrated trails and parks.
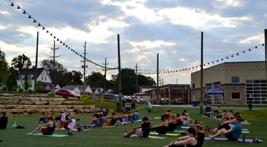
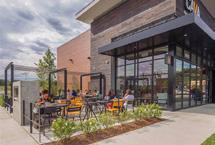
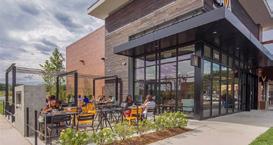
• Emphasis on expansion space for agriculture technologies and production facilities from St. Louis regional AgTech centers.

• In addition to agriculture focus, remain open to other complimentary research and technology opportunities.
• Advanced technology in food growth and renewable energy (solar).
• High impact, high design retail and restaurants to elevate the image of the site and to welcome to visitors.
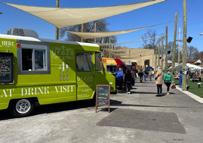
• High quality designed commercial with corporate and incubator office spaces. Strong focus on job generation.
• Offices, job training, community space, and neighborhood commercial.


• Residential mix with a strong emphasis on open space/agriculture as a market differentiator (agri-living).
• Agriculture opportunities could range from professional ag growing facilities to residential amenities such as community gardens or agriculture/natural areas as residential common areas or residential buffering.
• “Front Door” of the development could include high impact, high design retail and restaurants to elevate the image of the site and to welcome to visitors.
• New, modern housing
• Abundant outdoor and nature-based amenities
• Retention and attraction of residents to North County

• Residential marketing niches (e.g., agri-living, conservation design, proximity to WildCare Park)
• Elevated front door commercial
• High impact, high design retail and restaurants
• Enhanced image of the site

• Amount of retail/commercial better aligned with current market demand.
• Rising cost of housing construction
• May force housing price points to exceed market demand


• Increased commercial competition in North County
• Retail upgrades in Florissant/Hazelwood
• 160 -180 homes
• For sale ($325,000 -$450,000)
• 45 acres
Villas (duplex/attached units)
• 200 - 220 units
• For sale ($225,000 - $275,000)
• For rent ($1,900 to $2,400 per month)
• 34 acres
Senior housing
• None
• 70,000 - 82,000 sq. ft.
• 7.5 acres
Neighborhood mixed commercial Community center
• None
• 29.5 acres open space/ agriculture
• 26 acres conservation

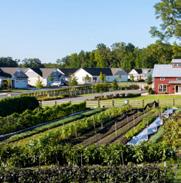
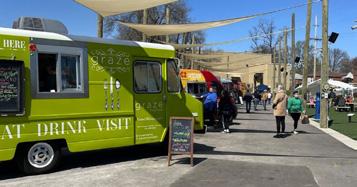
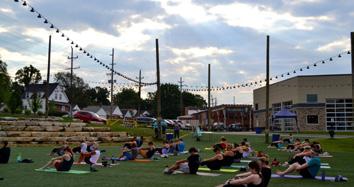
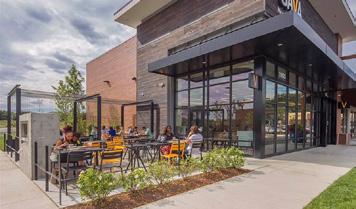
The concept diagram is not a "master plan". It is meant to convey the scale of land uses and potential development principles of the scenario. This is just one example of the potential location of uses on the site.

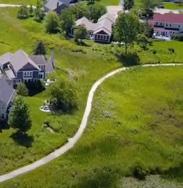
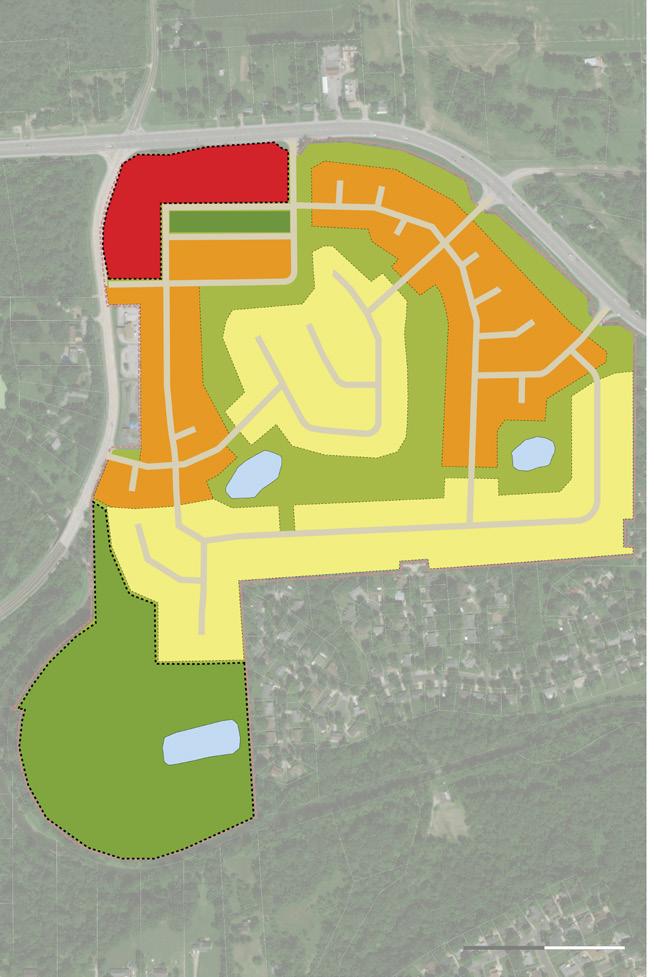
Flexible Outdoor Community Space
• Special Events
• Programs
• Farmers' Market
Residential LindberghBlvd
Note:
The above sketch is only a “concept” meant to convey an example of development to help visualize the land uses and potential development principles as part of the scenario.
• Outdoor Seating and Dining
• Pedestrian Scaled
Neighborhood Mixed Commercial (High impact, high design retail and restaurants to elevate the image of the site and to welcome visitors)
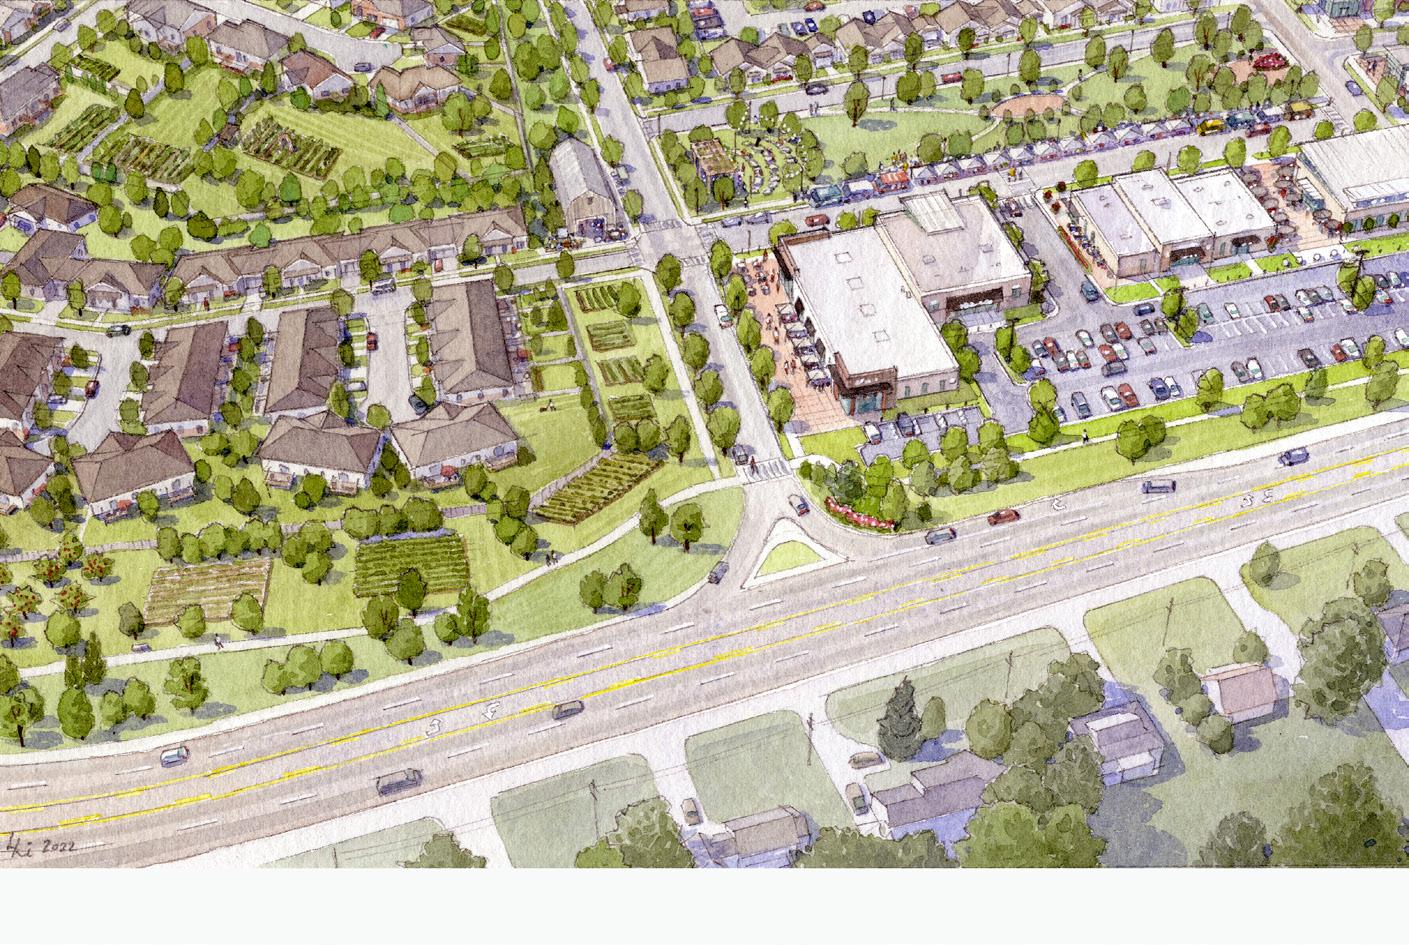
• Higher density of residential (ranging up to townhomes and duplexes).
• Small area of higher density for senior living apartments in “front door village.”
• Commercial front door of high quality design to include corporate and incubator office spaces. Strong focus on job generation, especially as part of elevated front door.
• Greater emphasis on a shared community space such as a village green but also with integrated trails and small parks.
• New, modern housing
• Variety of styles and demographic targets (e.g., seniors)
• Retention and attraction of residents to North County
• Residential marketing niches (e.g., walkable, senior village, proximity to WildCare Park)

• Elevated front door commercial
• High impact, high design retail and restaurants
• Enhanced image of the site
• Office and incubator space
• Amount of retail/commercial better aligned with current market demand.
• Rising cost of housing construction
• May force housing price points to exceed market demand


• Increased commercial competition in North County
• Retail upgrades in Florissant/Hazelwood

• 90 - 110 homes
• For sale ($325,000-$450,000)
• 27 acres
Villas (duplex/attached
• 300 - 330 units
• For sale ($225,000-$275,000)
• For rent ($1,900-$2,400)
• 50 acres
• 100 - 120 senior units
• For rent ($1,500 to $2,000 per month)
• 14 acres
• 150,000 - 179,000 sq. ft.
• 16.5 acres
• Subdivision only: 2.0 acres
• Community: 4-5 acres
Neighborhood mixed commercial Community center Open Space
• 4.5 acres open space
• 26 acres conservation
The concept diagram is not a "master plan". It is meant to convey the scale of land uses and potential development principles of the scenario. This is just one example of the potential location of uses on the site. Neighborhood Commercial Flexible


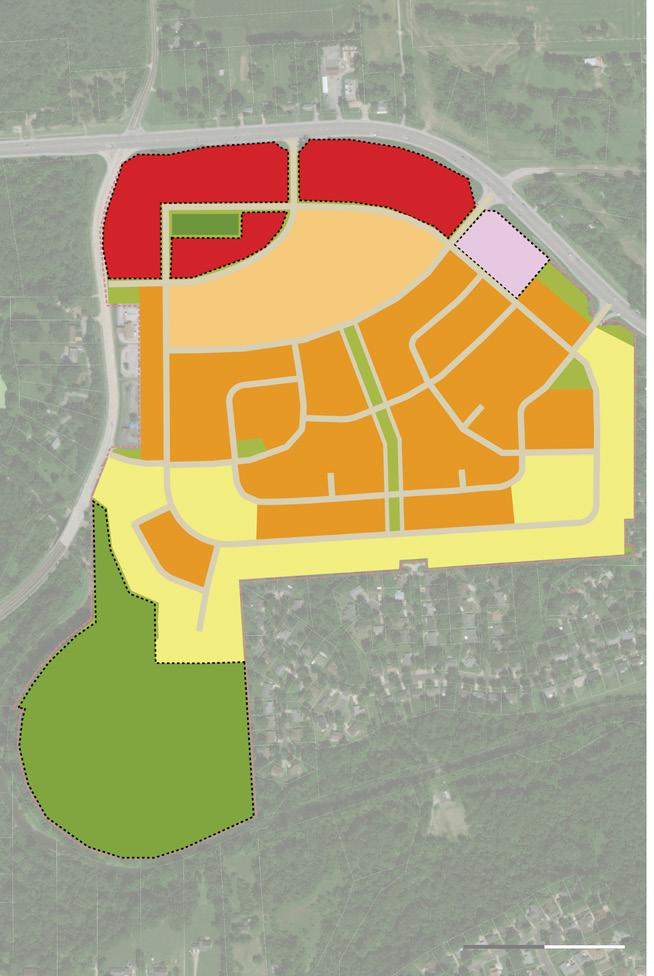
Note:
The above sketch is only a “concept” meant to convey an example of development to help visualize the land uses and potential development principles as part of the scenario.
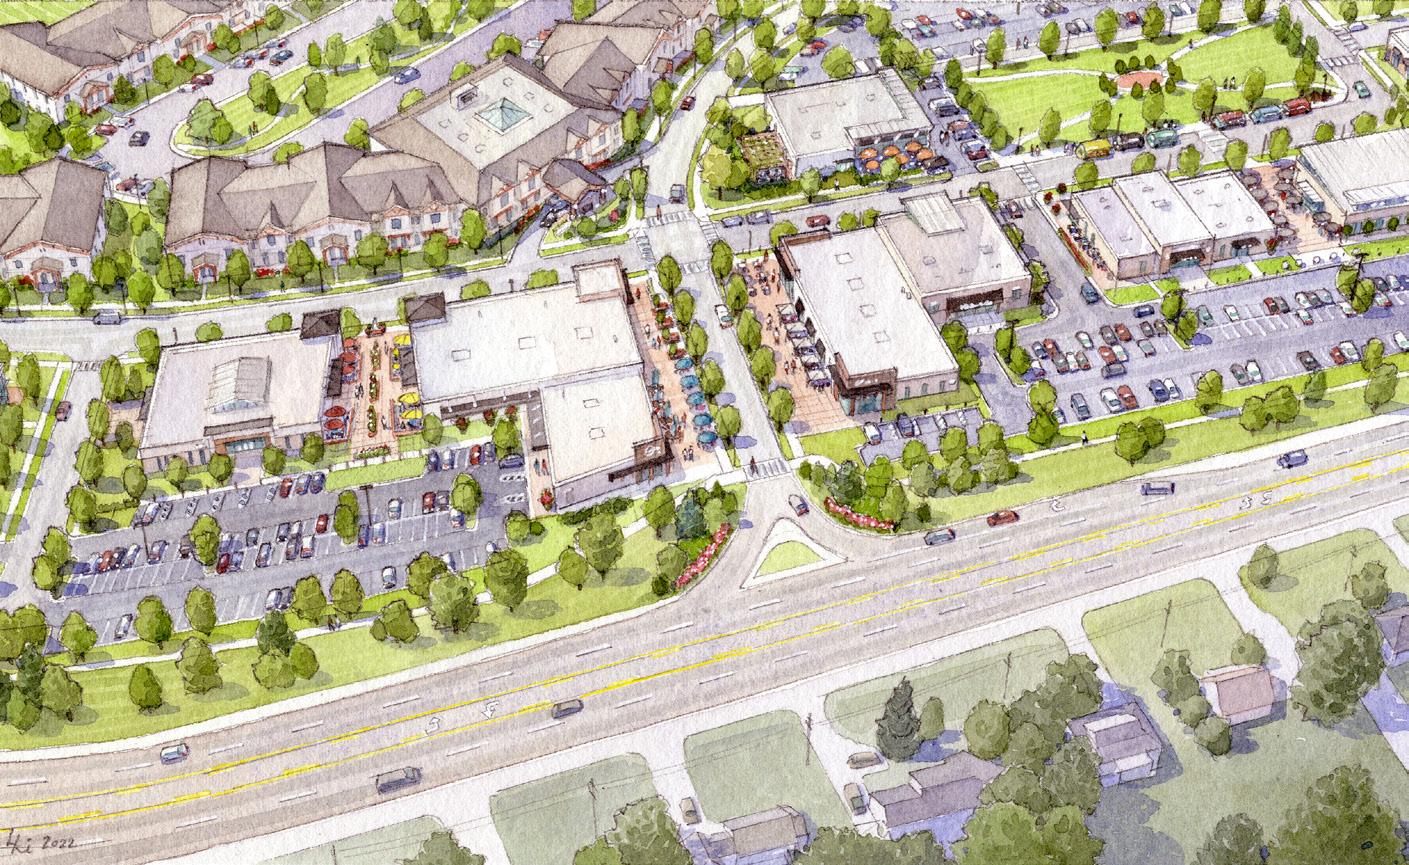
•
•
• Emphasis on expansion space for agriculture technologies and production facilities for growing firms from St. Louis regional AgTech centers.
• In addition to agriculture focus, remain open to research and technology opportunities outside of agriculture that can expand regional opportunities.
• Opportunity for high productivity agriculture facilities utilizing advanced technology in food growth relatively close to population centers.
• Renewable energy (solar) to provide electricity (or partially offset).
• AgTech is a major St. Louis regional economic sector.
• Strong indications of a regional need for additional space for the AgTech sector.
• New science emerging from established companies
• Spaces/facilities need varies, but could include:
• Greenhouses
• Test plots
• Precision Fermentation
• Lower-cost facility spaces
• Central location in U.S. agricultural belt
• While onsite jobs may be limited, the site could play an important role in the regional economy.
• Close to skilled labor force
• Close to research centers
• Close to international airport
• Less expensive land
• Agriculture land north of Lindbergh Blvd could support and benefit from this scenario.
• Land is out of flood plain
• Otherwise limited development potential
• Many unknowns. Better indicators and data likely available in next 12-24 months
• Site may not be close enough to other existing clusters (39 North and Cortex) to be an “annex”
• Workforce training programs still in creation and expansion
• Implementation will require a different model than a developer RFP. Would need regional organization to implement.
• Cooperation among local, regional, and state economic development groups
• Patient money, variety of incentives
• Commitment of regional and national companies/researchers
• Hi-Tech Large Scale Green House
• Precision Fermentation Facility
• Greenhouses
• Lower-cost Facilities
• Field Test Plots
• Solar Energy
• Annex Front Door with Office/ Job Training, Neighborhood grocery/retail, Community open space
The concept diagram is not a "master plan". It is meant to convey the scale of land uses and potential development principles of the scenario. This is just one example of the potential location of uses on the site.
Evaluates the likely number and
quality (higher wage) jobs that the scenario is likely to directly support. Criteria:


JAMESTOWN GREEN ESTATES
Anticipates how much public revenue might be generated by the scenario to pay back or support the public investment in the site.
• Annual Property Taxes (mix of residential and commercial): $1.7 - $1.9 million.
• Annual Local Sales Taxes: $115,000 -$135,000.
• Annual Property Taxes (mix of residential and commercial): $1.8 - $2.3 million.
• Annual Local Sales Taxes: $250,000 -$300,000.

• Annual Property Taxes (mix of commercial and agricultural): Too early to estimate. Mix unknown, property values uncertain.
• Annual Local Sales Taxes: Too early to estimate. Taxable enterprises as yet uncertain.
Considers the prospective speed of development and occupancy of the site; sooner is better when considering rents and sale prices that could be generated to support investment and public return on investment.
• Many unknowns. Better indicators and data likely available in next 12-24 months.
• Years 1-3: Inexpensive greenhouses, small scale test plots.
• Years 2-4: Precision Fermentation Facility (if feasible).
• Years 10+ for full absorption.
• Residential (single-family and duplex/ attached) will likely take 5 - 6 years for build out.
• Commercial areas will trail residential, likely taking 8 years for build out.
• Residential (single-family, duplex/attached, and senior village ) will likely take 5 - 6 years for build out.
• Commercial areas will trail residential, likely taking 8 years for build out.
• Community Center likely in year 4 or 5.

Assesses the opportunities for entrepreneurs and small business, especially focused on independent retailers.
• Less opportunities than Village scenario, but still a fair amount of small business and entrepreneur opportunities.
• On-site residential population provides for immediate customer base.
• Opportunity to pair development with programming and open space amenity.
• Focus on agriculture provides opportunity for tenant alignment including farm-to-table restaurants, farmers market, and locally sourced goods.
• Fair to Moderate opportunities for small business and entrepreneurs.
• Increased density provides opportunities for broader range of goods and services.
• Development amenities can help support ladder of vending opportunities (e.g., farmers market, food trucks, brickand-mortar).
• Office and incubator space.
• The site could play an important role in the regional AgTech economy.
• Opportunity to pair agriculture aspect with programming to bring people on site such as special events/conference space, grocery, farmers market, and restaurant.
Considers place-making aspects such as walkability, architecture, building scale, and community gathering areas that contribute to a welcoming “sense-of-place”.
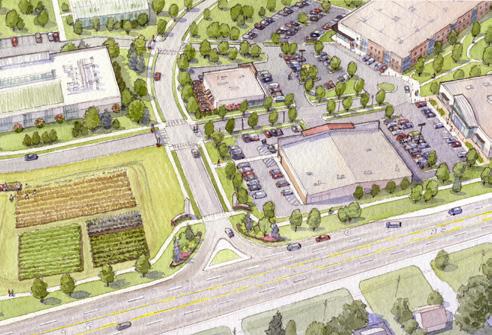
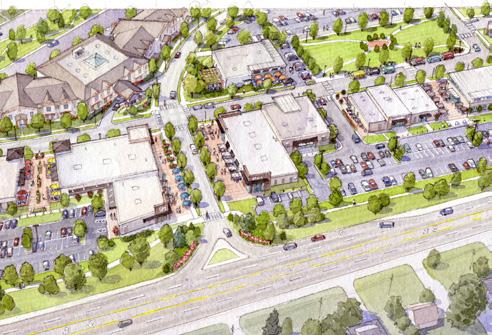
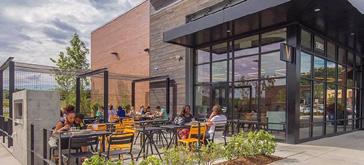


All three scenarios have multiple opportunities for place-making, especially once fully built out. However, Scenario 1 and 2 likely have a better opportunity in the short-term for place-making as they would be built out more quickly.
SCENARIO 1
JAMESTOWN GREEN ESTATES
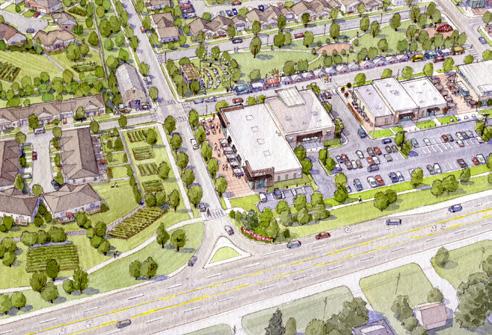
SCENARIO 2 JAMESTOWN
Thoughtful Landscaping and Details
Gathering Areas
High Quality Architecture
Comfortable for Pedestrians
Thoughtful Landscaping and Details
Gathering Areas
Comfortable for Pedestrians
High Quality Architecture
Gathering Areas
Thoughtful Details Walkable
High Quality Architecture Comfortable for Pedestrians
The second public forum for the Jamestown Mall Market Analysis and Feasibility Study was the opportunity for the community to formally provide feedback on the final three land use scenarios.
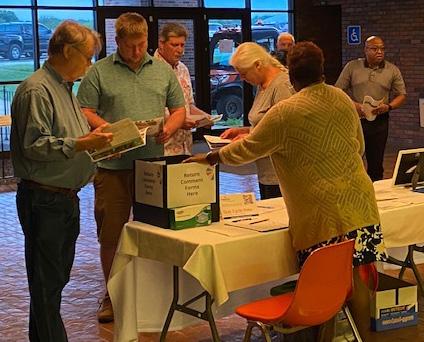
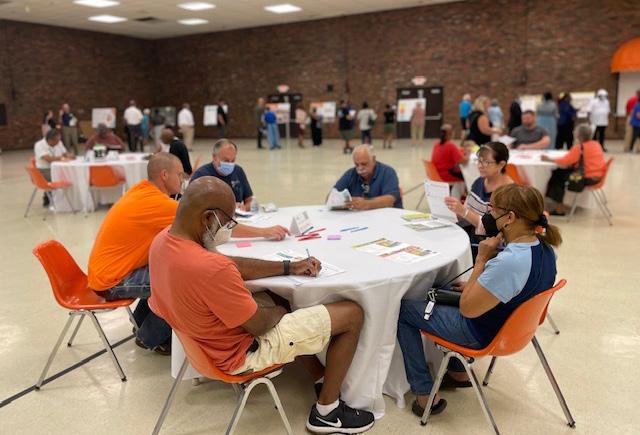
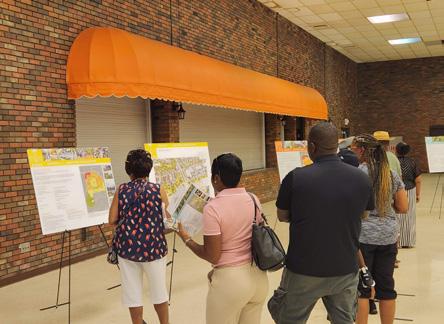
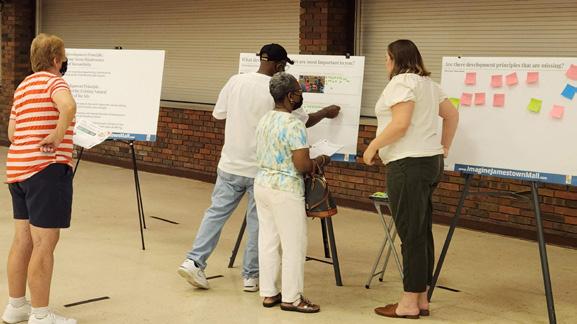
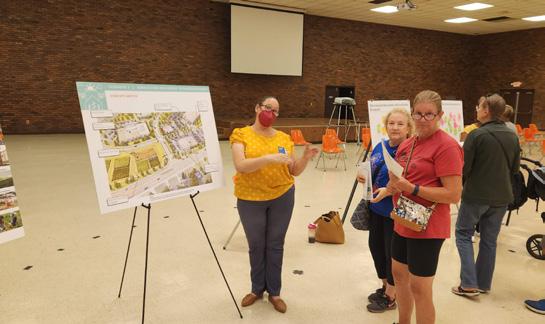
The public forum was held on Wednesday, September 21, 2022, from 4:30 - 7:30 pm at the Saint Louis Zoo WildCare Park. The meeting was an open house style format where attendees had the opportunity to talk one-onone with team members while reviewing and offering feedback on the final three land use scenarios. Attendees also had the opportunity to help prioritize development principles
There was a great turnout with over 200 attendees.
Residents had the opportunity to fill out a comment form at the meeting or an online comment from September 21 through October 12, 2022.
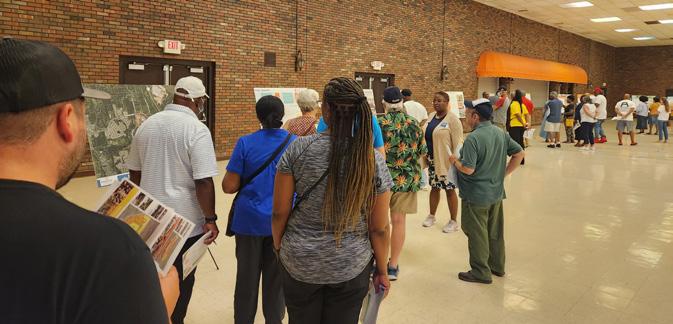
"St. Louis area needs more of this type of growth and we could be a leader for once."Comment from Forum
Attendees at the second public forum had the opportunity to sign-up for small group discussions if they were interested in talking in-depth with the planning team to ask detailed questions or provide additional comments. The small group discussions were held at the Black Jack Fire Protection District on:
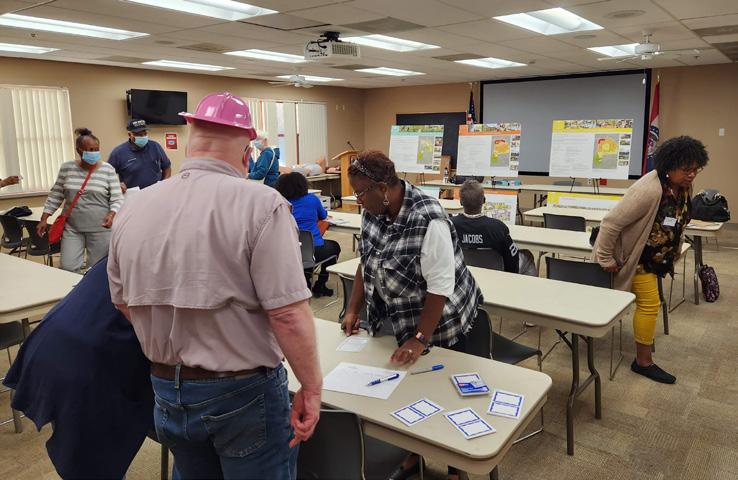
• October 3rd
• October 5th
• October 6th
Community Feedback: Final Three Scenarios
Q4. After reviewing the three land use scenarios, how do you view each scenario in terms of favorability?
1 - J am es t own Green Res ident ial m ix wit h f oc us n s pac e)
Scenario 2 Jamestown Village (Residential mix with senior village) 31% 52%
27%
Scenario 3 Agriculture and Energy Technologies Annex (Expansion space for regional ag-tech facilities) 32% 49% 59%
This page includes the results of the comment from the second public forum. Residents had the opportunity to fill out the comment form at the meeting or an online comment from September 21 through October 12, 2022.
Scenario 3 'Agriculture and Energy Technologies Annex' was the highest ranked for favorability with 40% of respondents ranking it as "Very Favorable." 59% of respondents ranked it as either "Favorable" or "Very Favorable."
All three scenarios received high rankings of favorability.
All three scenarios received substantial levels of favorability from the community. However, the stronger support for Scenario 3, 'Agriculture and Energy Technologies Annex,' especially for those residents who lived closer to the Jamestown Mall site, led to the recommendation of Scenario 3, 'Agriculture and Energy Technologies Annex,' as the preferred land use.
As an alternative land use, the planning team recommended Senior Residential (55+) with Agri-Living. This alternative land use combined aspects of scenarios 1 and 2 and took into account feedback from the community that senior housing was more acceptable than general residential. Senior housing also has the potential to better align with current housing market conditions. There is a growing senior population in north St. Louis County.
The preferred land use (Agriculture and Energy Technologies Annex) and the alternative land use (Senior Residential [55+] with Agri-Living) received strong support from the Advisory Committee at the October 25, 2022, Advisory Committee meeting.
Part 1 of this report describes the preferred land use and alternative land use in more detail. Part 1 also uses the term "Ag-Food Technology Campus" instead of "Agriculture and Energy Technologies Annex." However, both terms should be considered working titles.
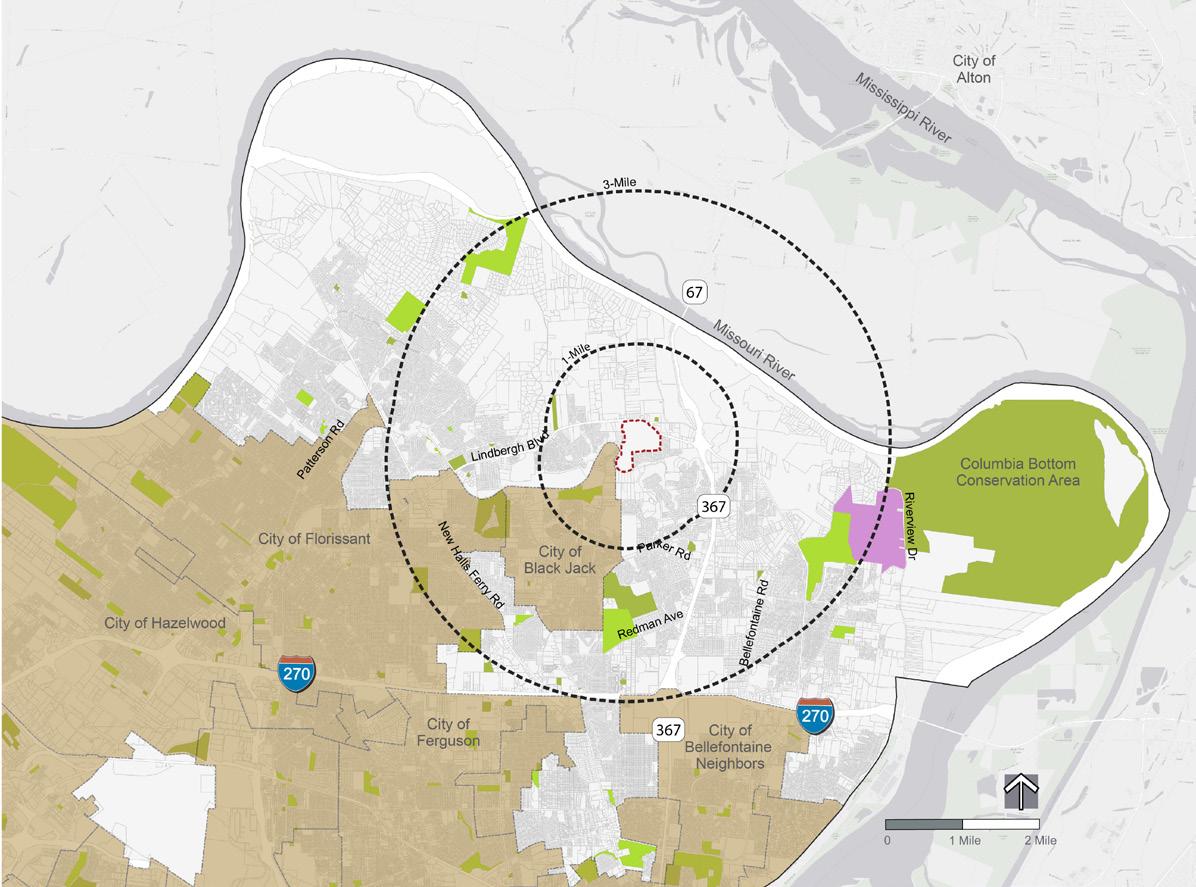
Jamestown Mall site
Saint Louis Zoo WildCare Park (Future)
Jamestown Mall is in unincorporated St. Louis County. As such, there is no direct population data for its "city." Instead, data in this report combines data for four North County zip codes which cover almost all of St. Louis County north of I-270. Wholly or partially within that area are the incorporated cities of Florissant, Hazelwood, and Black Jack and two unincorporated "census designated places" (CDPs) called Old Jamestown and Spanish Lake.
Zip Codes: 63031, 63033, 63034, & 63138
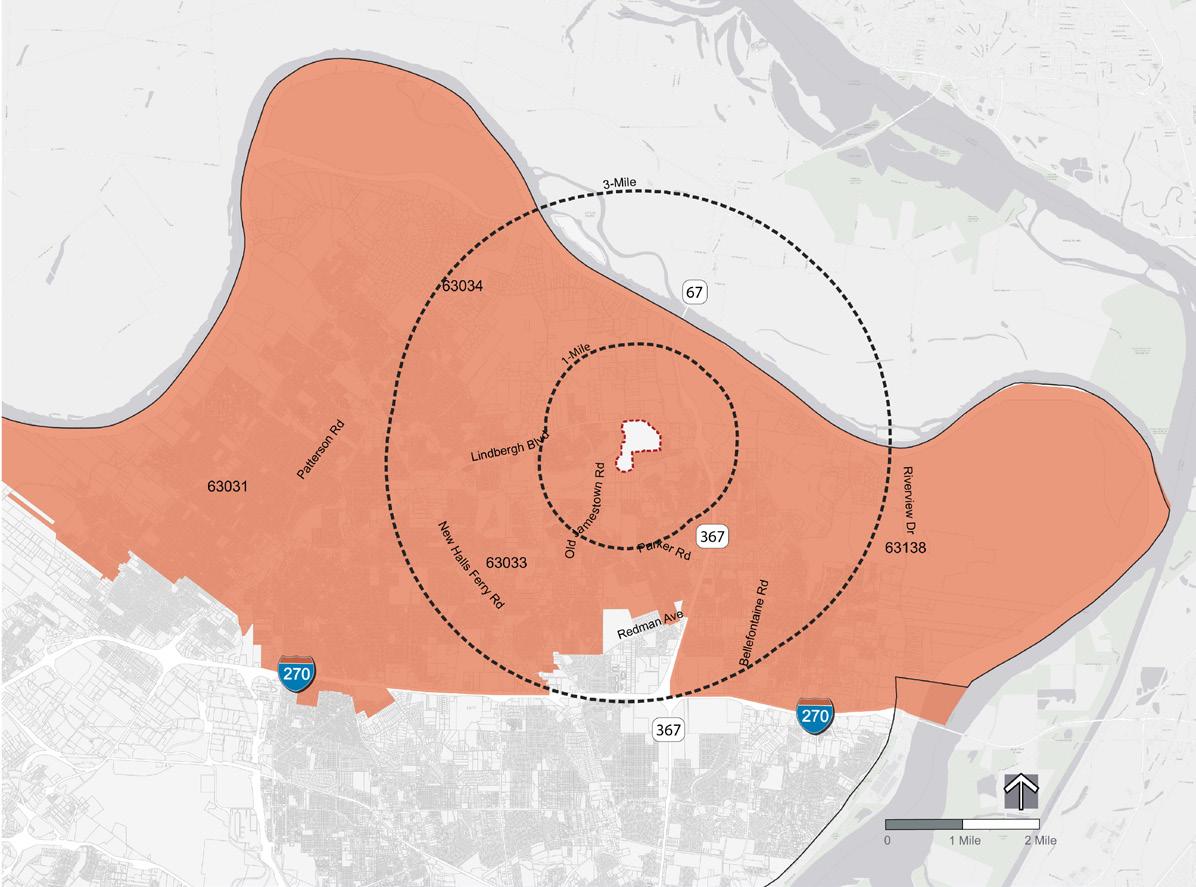
The primary land use north of I-270 is singlefamily residential. Pockets of commercial exist, especially along Lindbergh Boulevard in the City of Florissant. As discussed elsewhere in the market analysis, Lindbergh Boulevard serves as the retail and commercial hub for North St. Louis County.
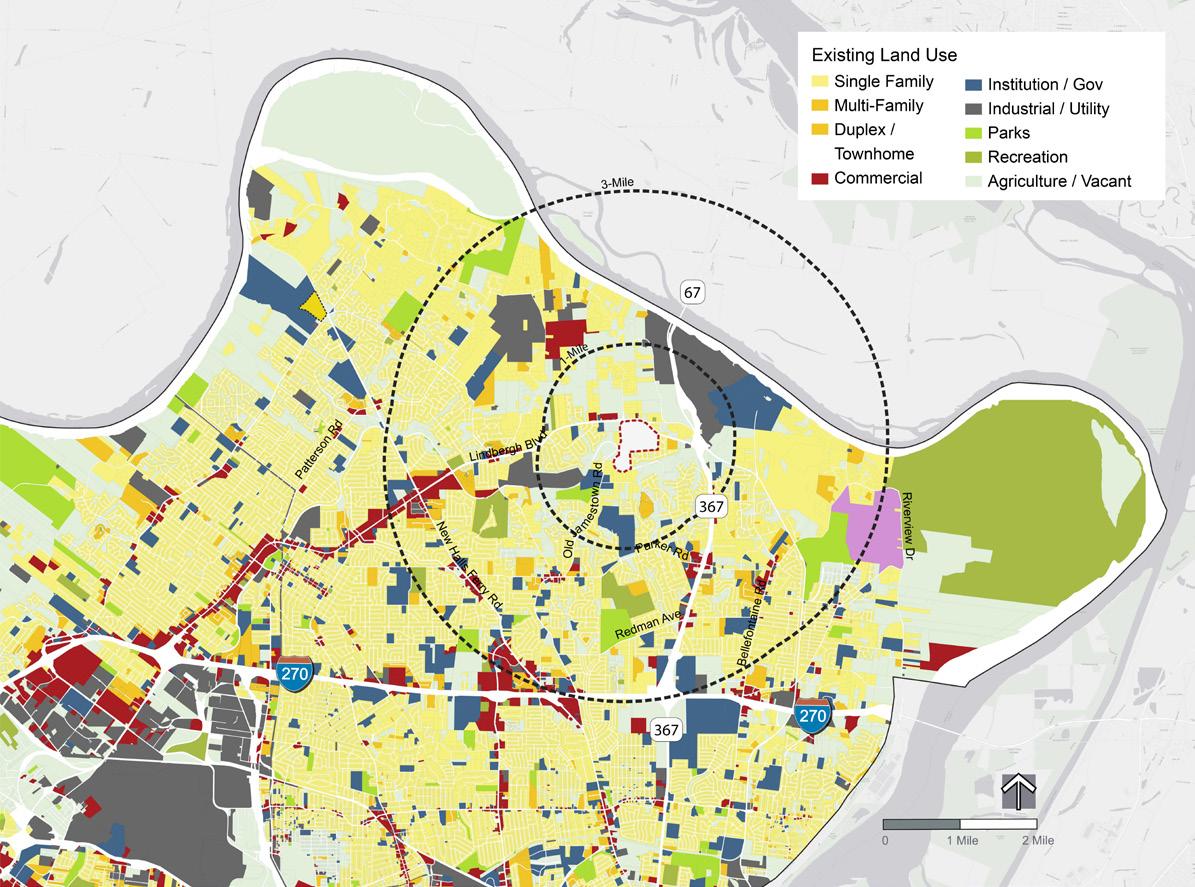
Within a one-mile radius of the Jamestown Mall site, "Agriculture/Vacant" is the predominant land use with approximately 37-percent of the land uses. "SingleFamily" residential is a close second at 34-percent.
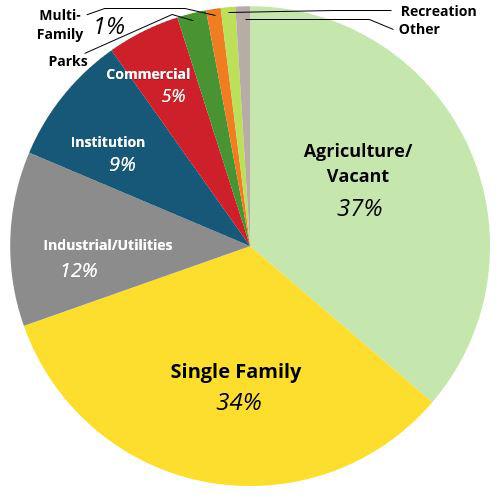
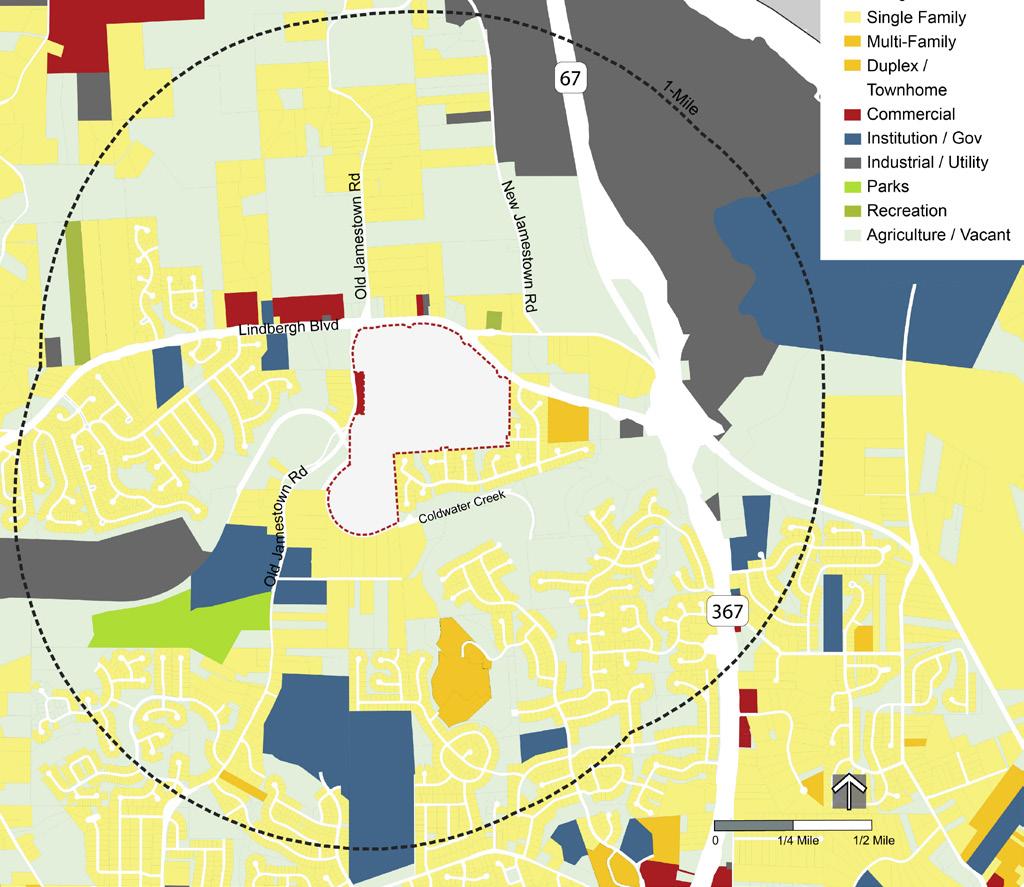
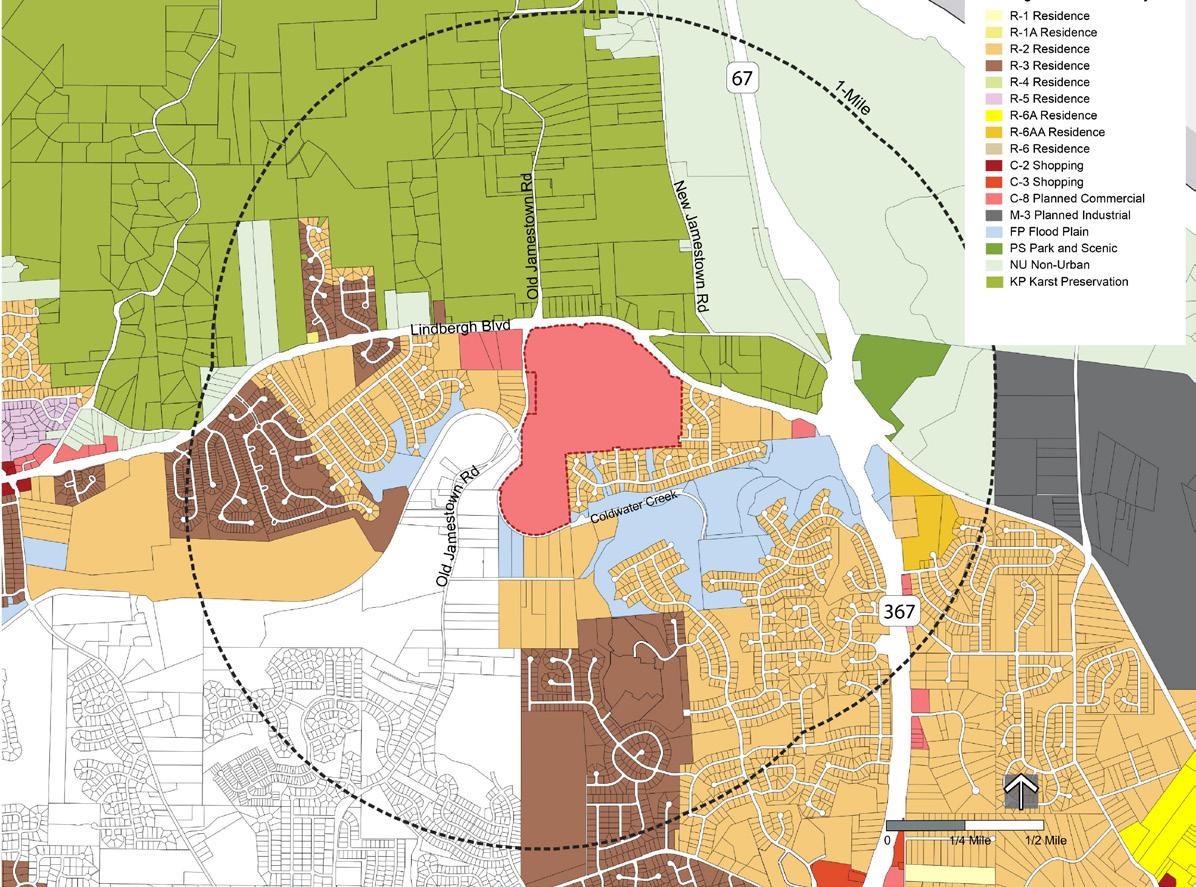
The existing Jamestown Mall site is zoned C-8 "Planned Commercial."
The south side of Lindbergh Boulevard is mostly residential zoning. On the north side of Lindbergh Boulevard is KP "Karst Preservation."
"Karst Preservation" zoning seeks to preserve the karst geology in its natural state while allowing development at an intensity that can be accommodated within the constraints of the geological features of this unique area. Thus, any new development north of Lindbergh will have significant limitations.
Harold Evangelista Park (City of BlackJack)
Fort Belle Fontaine Park
Spanish Lake Park
Sioux Passage Park Champ Park
Schaefer Bend Park
Dunegant Park (City of Florissant)
Columbia Bottoms Conservation Area
North County Recreation Complex
James J. Eagan Community Center (City of Florissant)
Saint Louis Zoo
WildCare Park (Future)
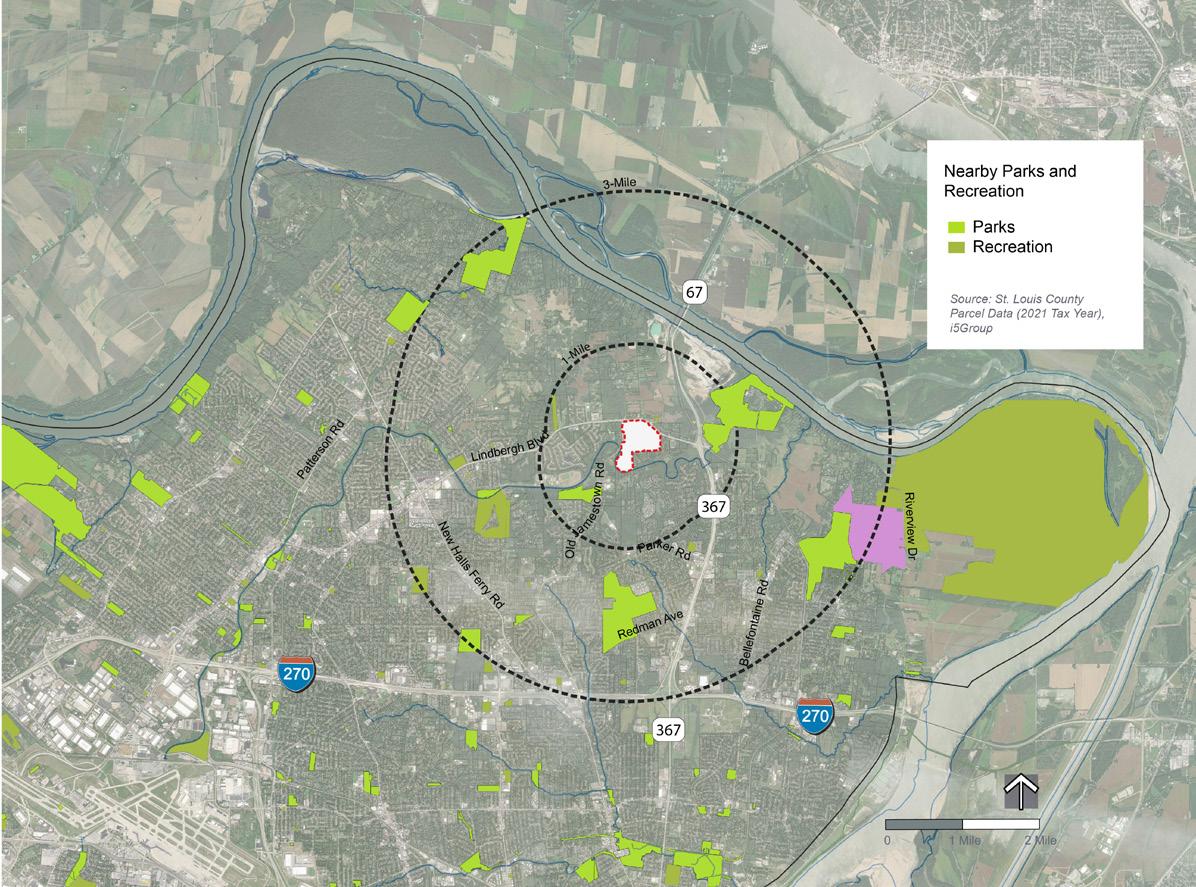
5-Min drive area (overlapping) from parks listed in legend.
Harold Evangelista Park (City of BlackJack)
Fort Belle Fontaine Park
Spanish Lake Park
Sioux Passage Park Champ Park Schaefer Bend Park
Dunegant Park (City of Florissant)
James J. Eagan Community Center (City of Florissant)
St. Louis Zoo Wildcare Park (Future)
North St. Louis County is well served with existing parks and recreation facilities. As the map on this page shows, most residents are within a five minute drive of an existing
The 2018 'St. Louis County Parks and Recreation Master Plan' did not find a need for additional parks in this part of St. Louis County. Instead, the Master Plan recommended investments and improvements of existing parks.
There have been efforts to improve walking and biking in North St. Louis County, including increased trail connections. The St. Louis County 'Action Plan for Walking and Biking' and Great Rivers Greenway's Master Plan both include trail recommendations for the area.
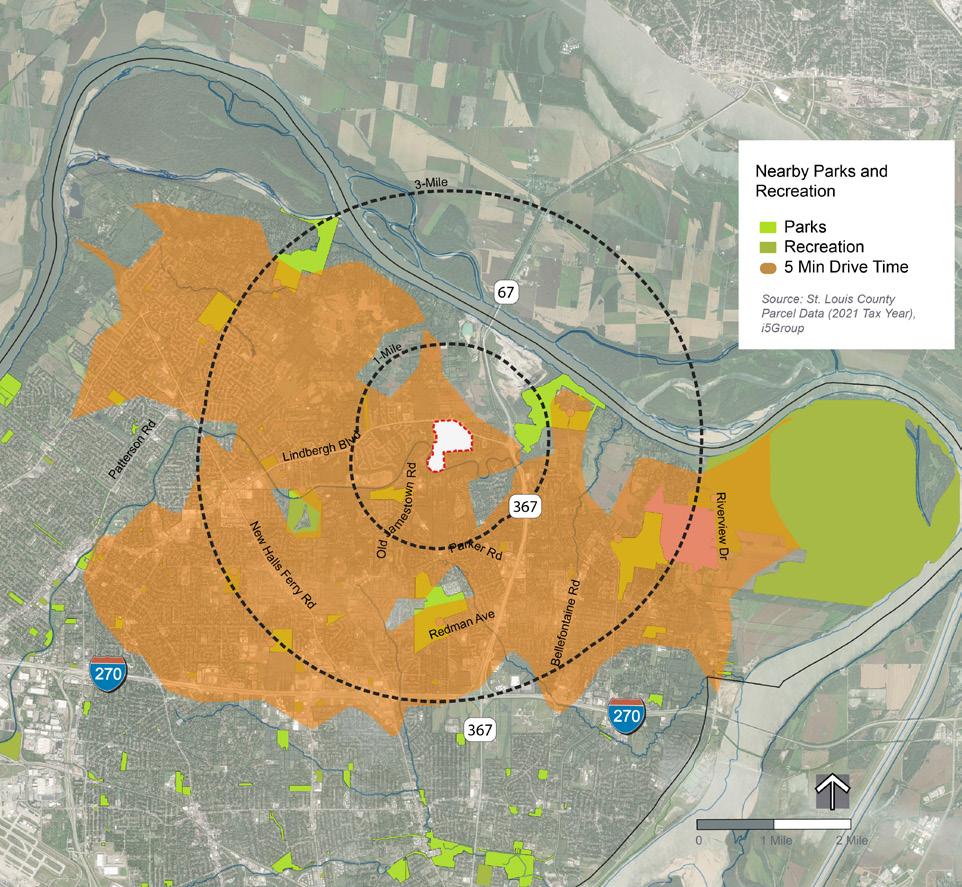
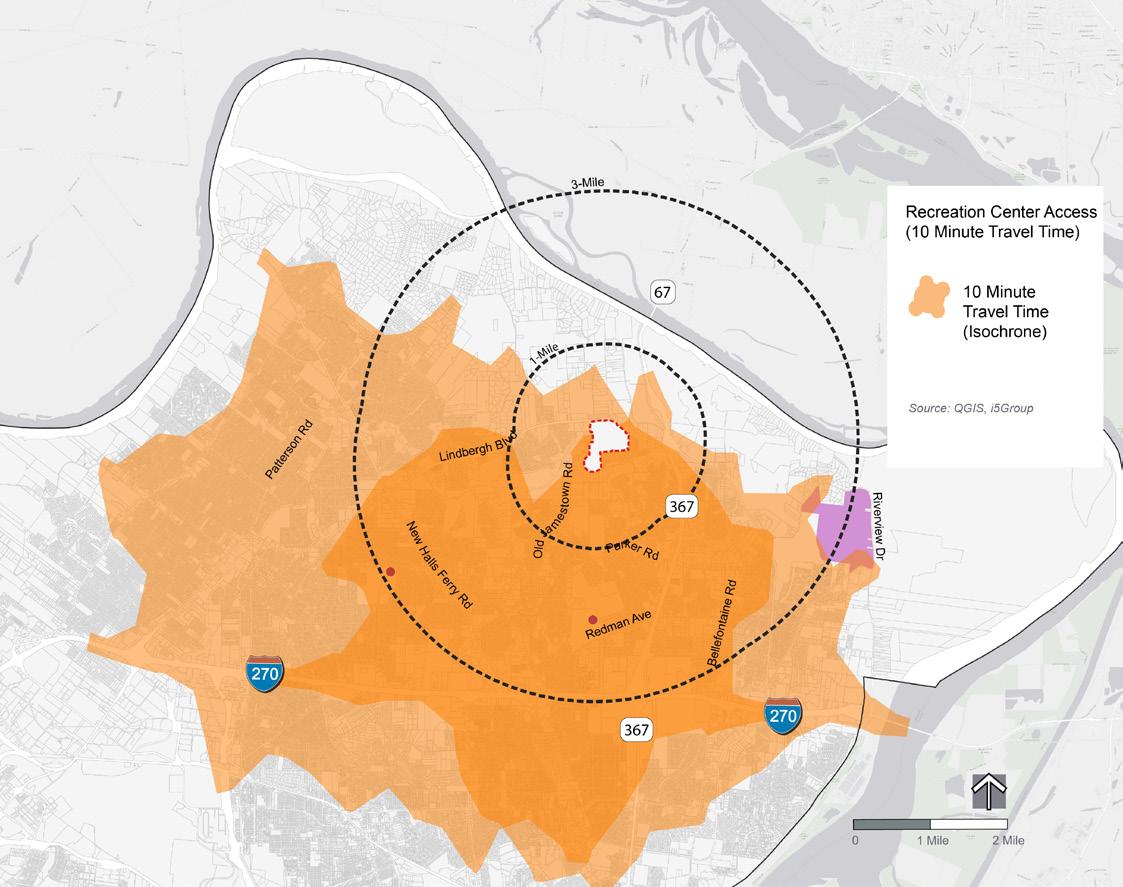
James J. Eagan Civic Center
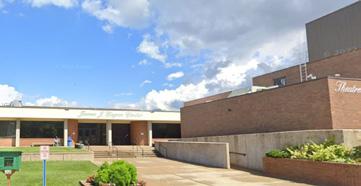
1 James J. Eagan Dr, Florissant, MO 63033
North County Rec Center
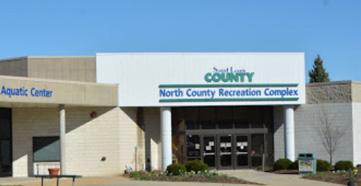
2577 Redman Ave
St. Louis, MO 63136
Future Saint Louis Zoo WildCare Park
The Jamestown Mall site is within a 10-minute drive of both the North County Recreation Complex and the Florissant civic and recreation complex (James J. Eagan Civic Center).
Coldwater Creek and Lindbergh Blvd are major barriers to accessing the site as a pedestrian (or bicyclist). Lindbergh is a four-lane, high speed road.
Fox Manor currently does not have pedestrian connections to the Jamestown Mall site, but two street ends abut the Jamestown Mall property. These streets could provide future connections.
Existing subdivisions to the south and west of the Jamestown Mall site have existing sidewalks, but lack direct connections to the site.
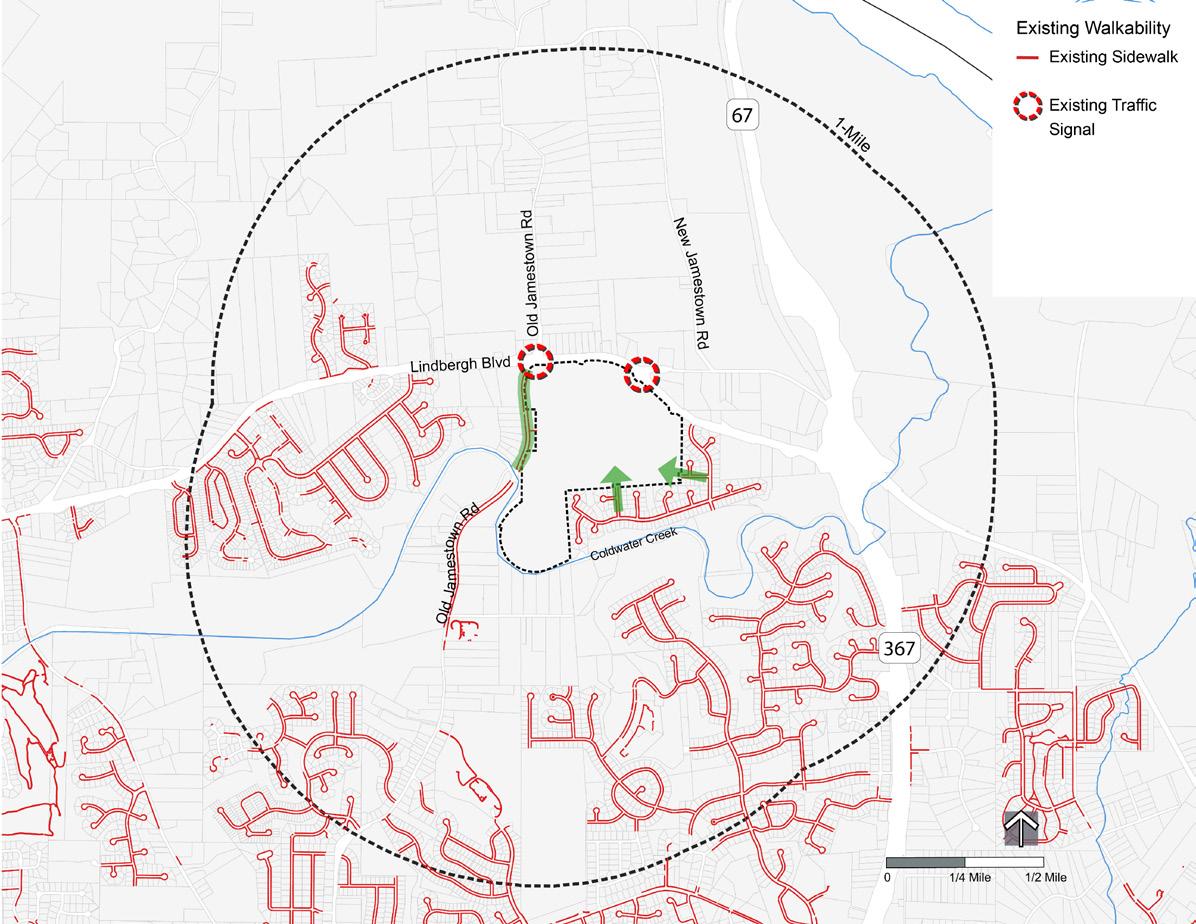
The St. Louis County Action Plan for Walking and Biking identifies future multi-use trail connections along Lindbergh Blvd and Highway 367. However, there is no schedule or time frame for implementation.
Great Rivers Greenway's Master Plan identifies a future greenway along the Missouri River. However, the time frame for implementation for this segment in unknown.
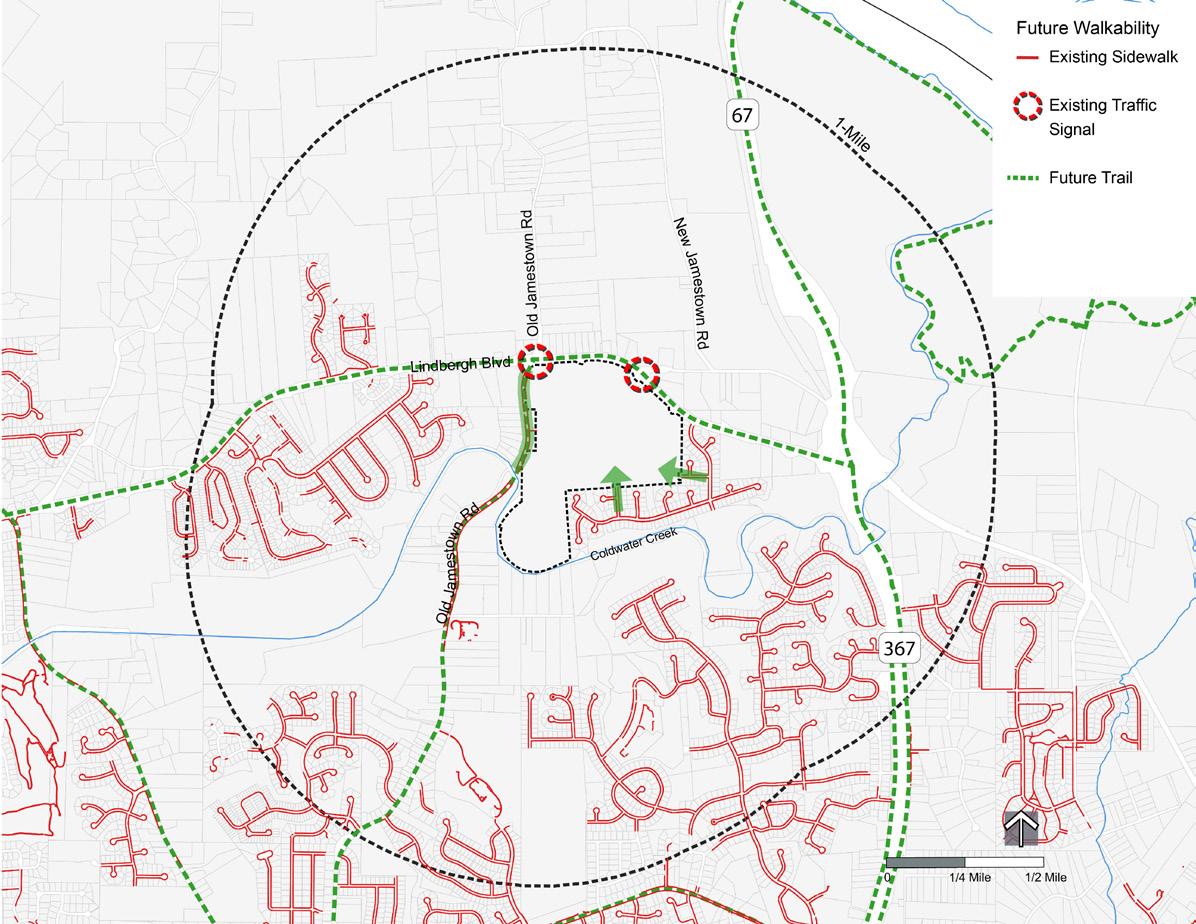
The map on this page shows existing traffic volumes on certain roads near the Jamestown Mall site.
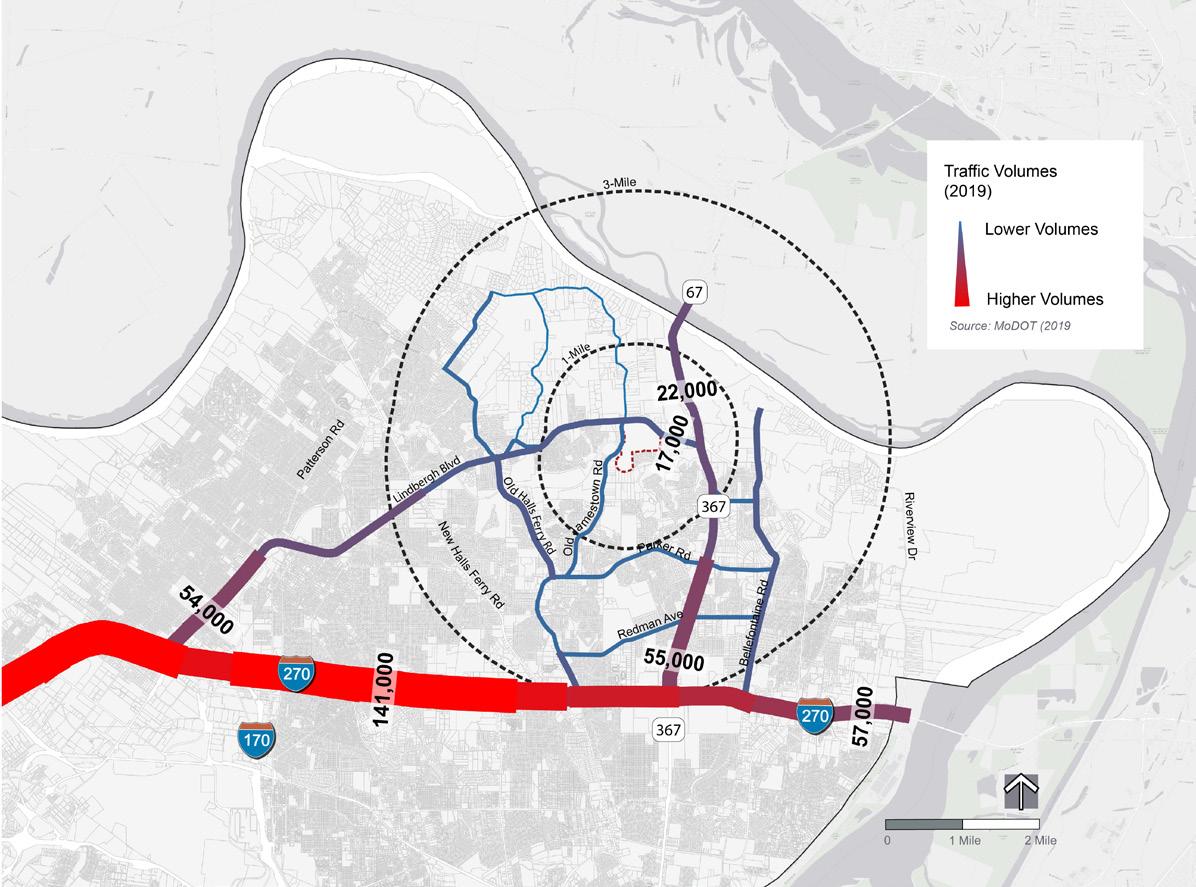
Traffic volumes decline dramatically along Lindbergh Boulevard and Highway 367 as they approach the Jamestown Mall site. Along Lindbergh, traffic volumes average over 54,000 vehicles per day near I-270. Traffic volumes along Lindbergh drop to approximately 17,000 vehicles per day near the Jamestown Mall site. Along Highway 367, traffic volumes drop from 55,000 to 22,000 vehicles per day.
Volumes shown are average annual daily traffic (AADT) based on 2019 MoDOT data.
Jamestown Mall site
The Jamestown Mall site is served by only one bus route (71 PattersonRedman). Nearby routes include the 78 Bellefontaine and 77 Village Square.
The limited number of transit options is not surprising considering the low population density in this part of St. Louis County.
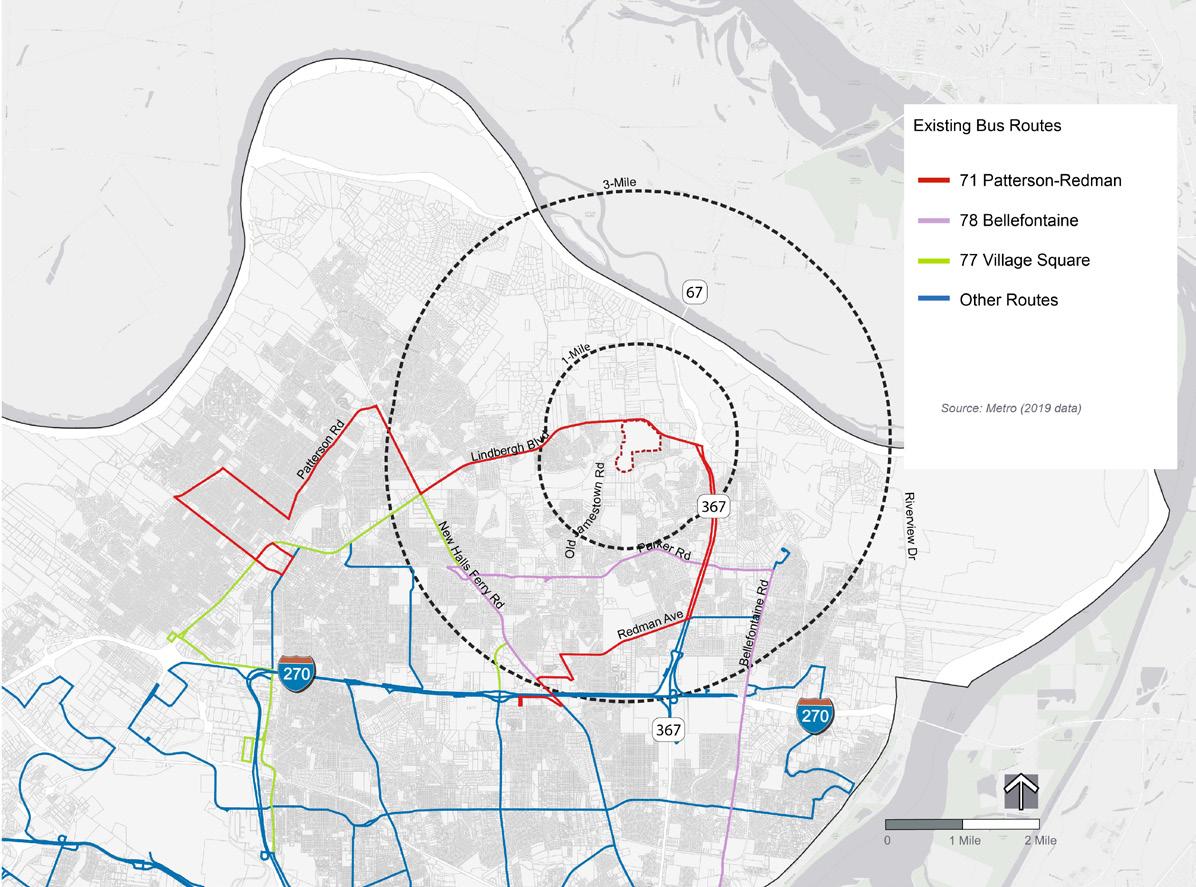
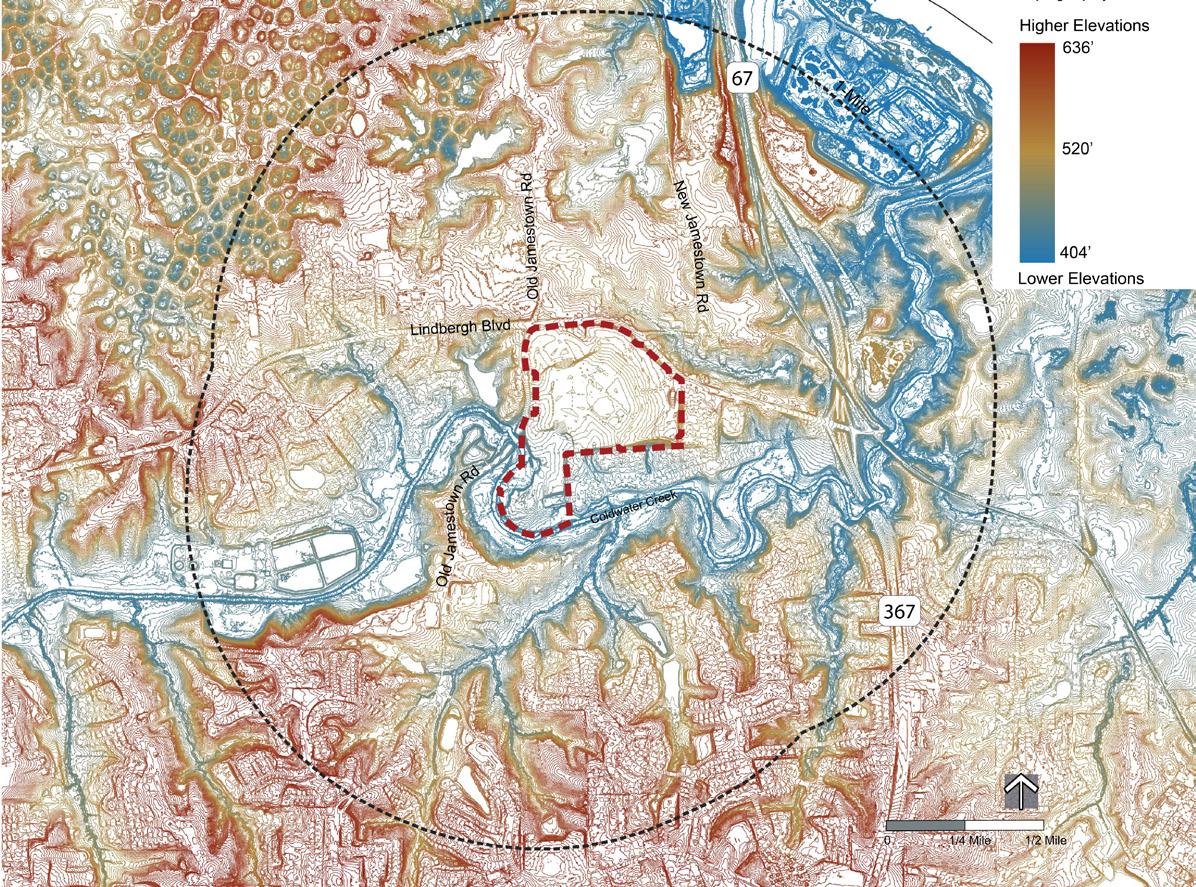
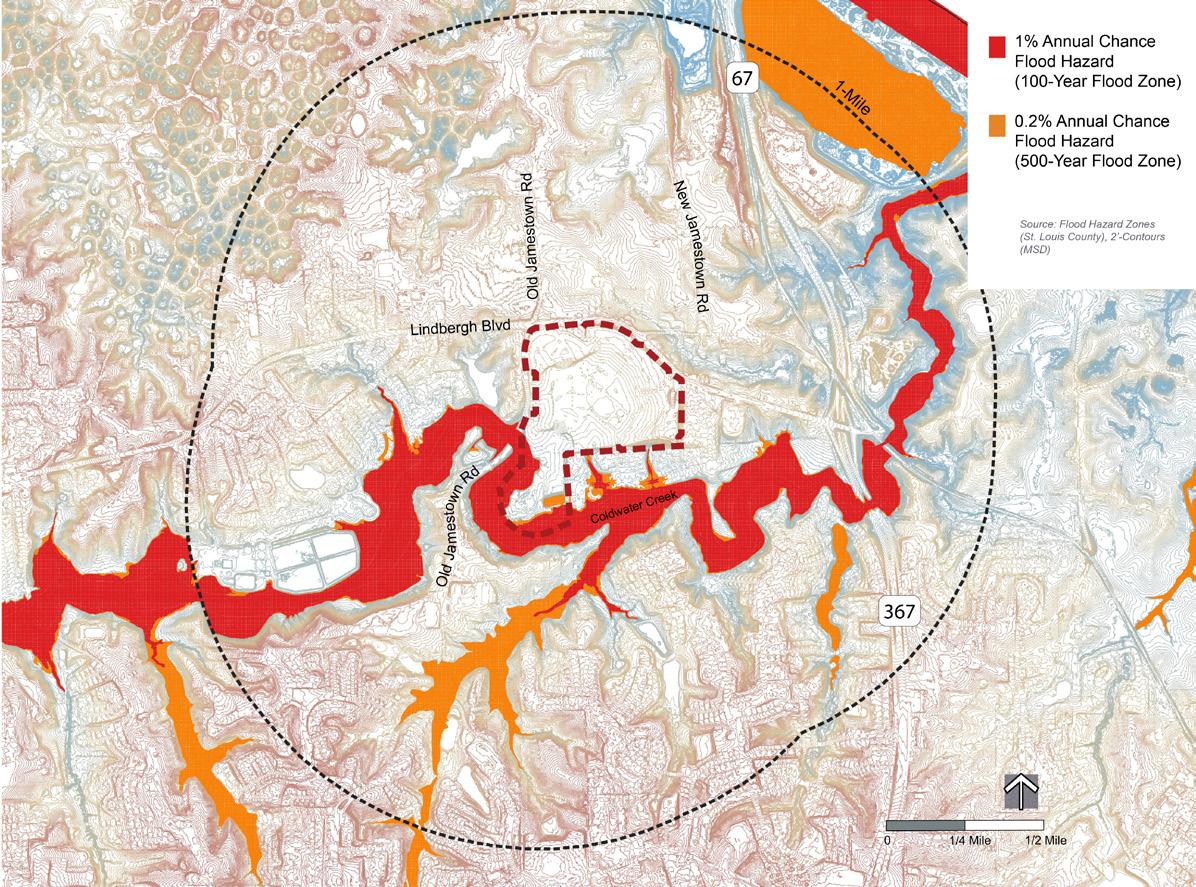
Jamestown Mall site
Coldwater Creek
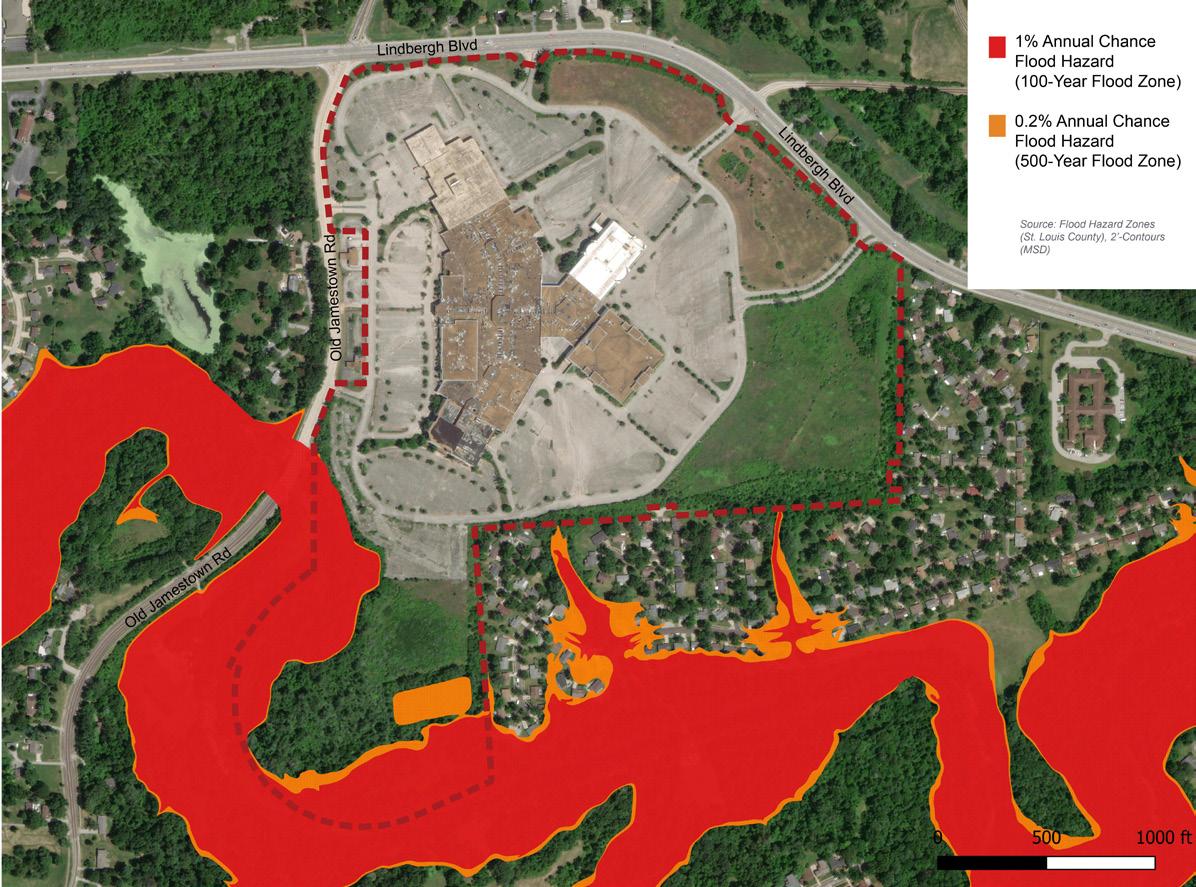
The analysis in this section centers primarily on employment trends and forces in the major economic sectors. While North County (here using postal Zip code based data for the four Zip codes found north of I 270) is not a very diverse economic development setting (it was not intended to be), St. Louis County as a whole is remarkably diverse. This suggests that, perhaps, North County can help to reinforce and sustain the County’s economic strengths by absorbing a broader range of jobs in a wider variety of economic sectors.
That said, and as shown here, a great deal of “north county” that is south of I 270 is a very diverse economic sub region of the county with a high concentration of jobs and businesses in Hazelwood, Berkeley, Maryland Heights, and Bridgeton (among others) as well as at St. Louis Lambert International Airport (see map on the following page). That is, a great deal of economic development in the county is within short commuting distances of the Jamestown Mall site. This analysis also includes data of economic sectors within a 30-minute drive of the Jamestown Mall site.
This map illustrates where employment is concentrated in the core of the metro area. The general pattern extends from Downtown St. Louis westward, then northwesterly in the I-70 and I-270 corridors. Jamestown Mall is outside of that pattern.
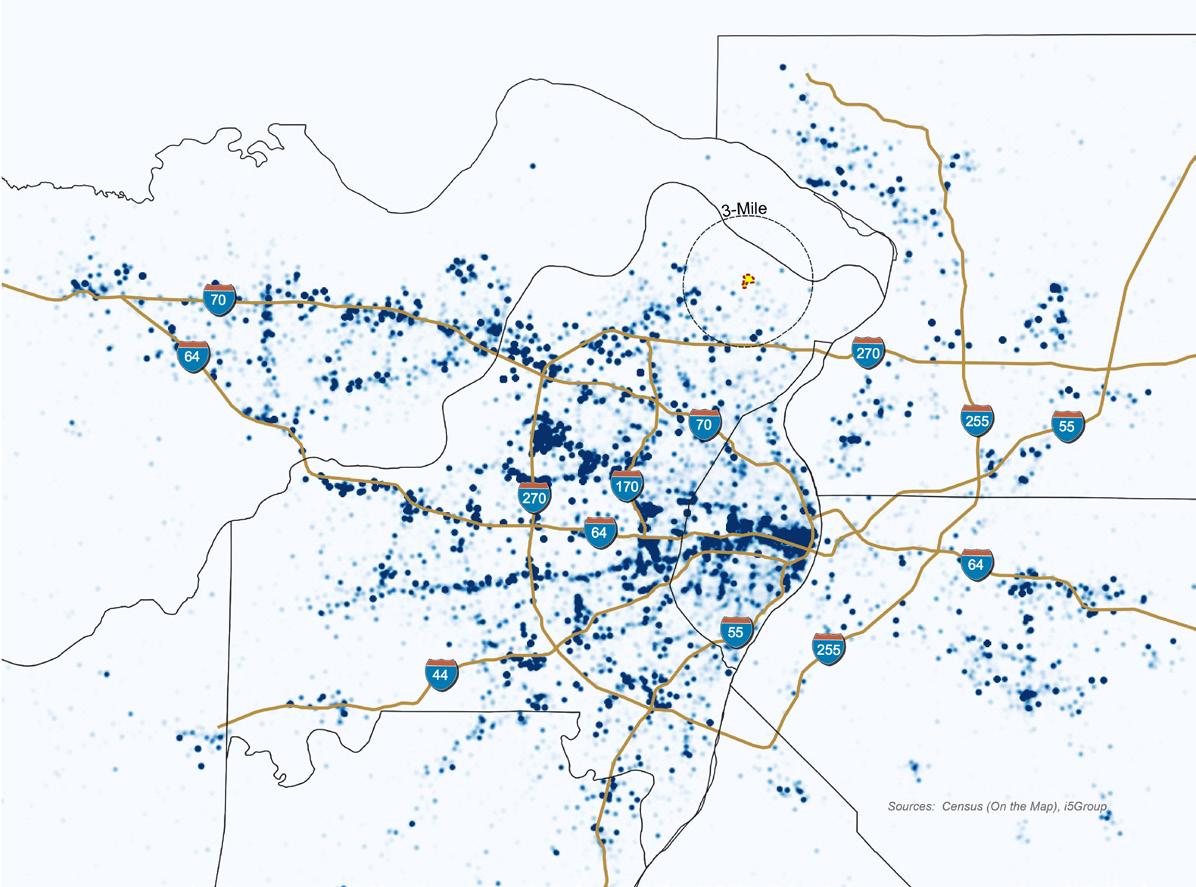
Meanwhile, jobs in St. County increased jobs in the 15metropolitan increased by 8.8%. Employment for the United States by 22.1% over period, almost times faster than area’s Map” data used here is Census Bureau. This 2002 with latest for the year 2019.
In the four Zip codes comprising almost all of St. Louis County north of I -270, there were 22,800 jobs in 2019, down from 26,500 in 2002, a net 14.0% decline.* Only 63138 (Spanish Lake) experienced a job increase of 600 jobs due to the creation of the National Personnel Records Center adjacent to Hazelwood East High School. Meanwhile, jobs in St. Louis County increased 5.5% and jobs in the 15-county metropolitan area increased by 8.8%.
INDEXED JOB GROWTH RATES, 2002-2019
Total Jobs in North-of-270 Zip Codes, 2002-2019
St. Louis County jobs increased by 33,700 (5.5%) between 2002 and 2019, but it suffered a 6.3% loss between 2002 and 2010 because of the Great Recession. The county recovered, however, by adding 12.6% more jobs by 2019.
Total Jobs in North-of-270 Zip Codes, 2002-2019, Indexed to 2002
26,500 24,400 22,800
0 5,000 10,000 15,000 20,000 25,000 30,000 2002 2010 2019
Source: U.S. Census On-the-Map 63031 Florissant 63033 Black Jack 63034 Jamestown 63138 Spanish Lake North County
The metro area lost 0.5% of its jobs due to the Great Recession but added 9.3% more jobs between 2010 and 2019.
In the four Zip codes comprising almost all of St. Louis County north of I-270, there were 22,800 jobs in 2019, down from 26,500 in 2002, a net 14.0% decline.* Only 63138 (Spanish Lake) experienced a job increase—of 600 jobs—due to the creation of the National Personnel Records Center adjacen to Hazelwood East High School. Meanwhile, jobs in St. Louis County increased 5.5% and jobs in the 15-county metropolitan area increased by 8.8%.
Meanwhile, jobs in St. Louis County increased 5.5% and jobs in the 15-county metropolitan area increased by 8.8%. Employment for the entire United States increased by 22.1% over the same period, almost three times faster than the metro area’s growth.
* The “On The Map” data used here is from the U.S. Census Bureau. This database starts in 2002 with latest available data for the year 2019.
Source: U.S. Census On-the-Map 63138
110
100
St. Louis County
90
80
70
60
To compare the job growth rates in North County to larger geographic areas, all areas were “indexed” to 100 for 2002. Their respective rates of job change are shown below. The Spanish Lake Zip Code (63138) had remarkable growth of 19.0% due to the addition of the National Personnel Records Center. The other three zip codes declined, including a 40% drop in 63034 (Jamestown), in no small way attributable to Jamestown Mall’s demise. 50
120 2002 2010 2019
To compare the job growth rates in North County to larger geographic areas, all areas were “indexed” to 100 for 2002. Their respective rates of job change are shown below. The Spanish Lake Zip Code (63138) had remarkable growth of 19.0% due to the addition of the National Personnel Records Center. The other three zip codes declined, including a 40% drop in 63034 (Jamestown), in no small way attributable to Jamestown Mall’s demise.
St. Louis Metro 63033 NORTH COUNTY 63031 63034
St. Louis County jobs increased by 33,700 (5.5%) between 2002 and 2019, but it suffered a 6.3% loss between 2002 and 2010 because of the Great Recession. The county recovered, however, by adding 12.6% more jobs by 2019.
The metro area lost 0.5% of its jobs due to the Great Recession but added 9.3% more jobs between 2010 and 2019.
SECTOR IN OUNTY, social dominated North in 2019, the data. With 6,017 just over a jobs in North (17.5%), hotels and and education had high job other sectors contributors economy.
North County Jobs by Major Economic Sector, 2019
Source: U.S. Census On-the-Map
-
IN
BY ECONOMIC SECTOR IN NORTH ST. LOUIS COUNTY, 2002 TO 2019
Change in North County Jobs by Major Economic Sector, 2002-2019
Source: U.S. Census On-the-Map
(3,000) (2,000) (1,000) - 1,000 2,000 3,000
Health care and social assistance jobs also dominated employment growth between 2002 and 2019, adding almost 1,900 more jobs. The information sector added 529 jobs because of the National Personnel Records Center in Spanish Lake, and the transportation and warehouse sector added 71 jobs.
4,000 5,000 6,000 7,000 Utilities Construction Manufacturing Wholesale Trade Retail Trade Transp & Warehsg Information Finance Real estate Prof, Scient, Profess Mgt of Enterprises Admin & Waste Mgt Educational Services Health Care-Social Asst Arts, Ent, Recreation Lodging and Dining Other Services Public Administration
All other major sectors lost jobs. Leading those losses, by far, was the retail sector due to the closing of Jamestown Mall and other changes within the retail industry.
6,017
Utilities Construction Manufacturing Wholesale Trade Retail Trade Transp & Warehsg Information Finance Real estate Prof, Scient, Profess Mgt of Enterprises Admin & Waste Mgt Educational Services Health Care-Social Asst Arts, Ent, Recreation Lodging and Dining Other Services Public Administration
The health care and social assistance sector dominated North County’s employment in 2019, the latest year for this data. With 6,017 jobs, this sector had just over a quarter (26.4%) of all jobs in North County.
The retail trade (17.5%), hotels and restaurants (14.7%), and education (14.5%) sectors also had high job counts in 2019. Most other sectors were relatively minor contributors to North County’s economy.
25 (497) (138) (434) (1,880) 71 529 (138) (250) (295) (186) (548) (650) 1,873 (186) (105) (575) (269)
Health care and social assistance jobs also dominated employment growth between 2002 and 2019, adding almost 1,900 more jobs. The information sector added 529 jobs because of the National Personnel Records Center in Spanish Lake, and the transportation and warehouse sector added 71 jobs.
All other major sectors lost jobs. Leading those losses, by far, was the retail sector due to the closing of Jamestown Mall and other changes within the retail industry.
UOTIENTS IN OUNTY VS. REA, 2019
distribution of jobs St. Louis strong location means that the County is the metro area. education, lodging/dining all 1.0, strengths. The this group, to many real Other sectors, rather weak services and (i.e.,
Utilities Construction Manufacturing Wholesale Trade Retail Trade
Transp & Warehsg Information Finance Real estate Prof, Scient, Profess Mgt of Enterprises Admin & Waste Mgt Educational Services Health Care-Social Asst Arts, Ent, Recreation Lodging and Dining Other Services Public Administration
Jobs Location Quotients North of I-270 vs. St. Louis Metro, 2019
Source: U.S. Census On-the-Map
JOB LOCATION
- 0.5 1.0 1.5 2.0 2.5
IN ALL ST. LOUIS COUNTY VS. ST. LOUIS METRO AREA, 2019
Jobs Location Quotients St. Louis County vs. St. Louis Metro, 2019
Source: U.S. Census On-the-Map
- 0.5 1.0 1.5 2.0 2.5
Comparing the distribution of jobs in all of St. Louis County to the St. Louis metro area, there is a much more balanced distribution. The sectors are all rather tightly clustered close to “1.0” which indicates a quite diverse economic structure for the county as a whole.
Utilities Construction Manufacturing Wholesale Trade Retail Trade
Transp & Warehsg Information Finance Real estate Prof, Scient, Profess Mgt of Enterprises Admin & Waste Mgt Educational Services Health Care-Social Asst Arts, Ent, Recreation Lodging and Dining Other Services Public Administration
Comparing the distribution of jobs in North County to the St. Louis metro area, the same strong sectors also emerge. A location quotient of “1.0” means that the share of jobs in North County is the same share as in the metro area. Retail, information, education, health care, and lodging/dining all have ratios well above 1.0, indicating relative strengths. The real estate sector joins this group, probably attributable to many real estate transactions. Other sectors, however, are notably rather weak except for other services and public administration (i.e., government).
Comparing the distribution of jobs in all of St. Louis County to the St. Louis metro area, there is a much more balanced distribution. The sectors are all rather tightly clustered close to “1.0” which indicates a quite diverse economic structure for the county as a whole.
picture emerges Louis County overall national dominant County is business to seven county. a relative the county’s U.S. for North attract more sectors that are County.
Jobs Location Quotients St. Louis County vs. USA, 2019
Source: U.S. Census On-the-Map
- 1.0 2.0 3.0 4.0
Utilities Construction Manufacturing Wholesale Trade Retail Trade Transp & Warehsg Information Finance Real Estate Prof, Scient, Prof Svcs Mgt of Enterprises Admin Support &… Educational Services Health Care-Social Asst Arts, Ent, Recreation Lodging & Dining Other services Public Administration
As shown on the graph, North County’s sum of absolute values has increase slightly since 2002 when compared to the metropolitan economy, from 11.9 to 12.4, though 2019 was an improvement from 2010 as the Great Recession ended.
St. Louis County has improved its score when compared to the U.S. economy, though it also was challenged by the Great Recession. Still, the County’s economy has a very low score, indicating substantial economic resilience, more so than the metro area as a whole.
Sum of Absolute Values of Employment Location Quotients, 2002-2019
Source: Saint Louis University Community Planning Lab
15
10
Location quotients are a measure of economic diversity. A local economy that has location quotients close to “1.0” is typically well -balanced, is less vulnerable to general economic declines, and better prepared for changing economic opportunities. One way to check that balance is to sum the “absolute values” of each economic sector. A lower sum means that the local economy has more sectors close to “1.0.” 11.9 7.3
13.5 12.6 7.4


10.9 12.4 6.8
* The data enabling comparisons with the North County Zip codes does not include a U.S. component, so North County was compared only with the St. Louis metro area.
A slightly different picture emerges when comparing St. Louis County as a whole to the overall national economy.* The only dominant sector in St. Louis County is management of business enterprises, attributable to seven Fortune 500 companies headquartered in the county. Wholesale trade is also a relativ strength because of the county’s central location in the U.S.
A growth opportunity for North County might be to attract more jobs in economic sectors that are already in St. Louis County.
5


10.0 0
North County St. Louis County St. Louis Metro
2002 2010 2019
Location quotients are a measure of economic diversity. A local economy that has location quotients close to “1.0” is typically well-balanced, is less vulnerable to general economic declines, and better prepared for changing economic opportunities. One way to check that balance is to sum the “absolute values” of each economic sector. A lower sum means that the local economy has more sectors close to “1.0.”
As shown on the graph, North County’s sum of absolute values has increase slightly since 2002 when compared to the metropolitan economy, from 11.9 to 12.4, though 2019 was an improvement from 2010 as the Great Recession ended.
St. Louis County has improved its score when compared to the U.S. economy, though it also was challenged by the Great Recession. Still, the County’s economy has a very low score, indicating substantial economic resilience, more so than the metro area as a whole.
THAN


USA Sectors Projected to Grow Slower Than Total Jobs, 2020-2030
Source: U.S. Bureau of Labor Statistics
USA EMPLOYMENT PROJECTIONS, 2020 TO 2030 SECTORS GROWING FASTER THAN NATIONAL AVERAGE
USA Sectors Projected to Grow Faster Than Total Jobs, 2020-2030
Source: U.S. Bureau of Labor Statistics
nationally between trade, and add jobs, national decade. growth sectors, growth if take place as administration: manufacturing. There course, for services, among
Utilities Construction Manufacturing Wholesale Trade Retail Trade Finance Real Estate Mgt of Enterprises
Federal Govt State & Local Govt
ALL JOBS
The U.S. Bureau of Labor Statistics produces ten-year employment projections for the nation on a bi -annual basis. The latest available projections are for 2020 to 2030. All jobs in the U.S. are expected to grow by 7.7% over ten years, from 153.5 million to 165.4 million (after growing 8.2% from 2010 to 2020).
The arts, entertainment, and recreation sector is projected to lead the way with 41.4% growth, followed by the social assistance. Office growth will be drive by professional (12.0%), information (10.5%), and administrative services (9.8%) while industrial growth will be led by the transportation and warehousing sector (11.4%).
The U.S. Bureau of Labor Statistics produces ten year employment projections for the nation on a bi annual basis. The latest available projections are for 2020 to 2030. All jobs in the U.S. are expected to grow by 7.7% over ten years, from 153.5 million to 165.4 million (after growing 8.2% from 2010 to 2020).
The arts, entertainment, and recreation sector is projected to lead the way with 41.4% growth, followed by the social assistance. Office growth will be drive by professional (12.0%), information (10.5%), and administrative services (9.8%) while industrial growth will be led by the transportation and warehousing sector (11.4%).
Transp & Warehsg Information Prof, Scient, Tech Svcs Admin & Support Svcs Waste Mgt Educational services Health Care Social Assistance Arts, Ent, Recreation Lodging & Dining Other Services ALL JOBS
Three major sectors are nationally projected to lose employment between 2020 and 2030: utilities, retail trade, and the federal government.
Seven sectors are projected to add jobs, but at a pace slower than the national average of 7.7% over the decade.
At least two of these slow growth sectors, however, might see faster growth if infrastructure improvements take place as hoped by the Biden administration: Construction and manufacturing. There could also be implications, of course, for finance and professional services, among others.
ROJECTIONS, TRENGTHS IN
USA OUTPUT PROJECTIONS, 2020 TO 2030
USA Sectors Projected to Grow Faster Than Total Output, 2020-2030
Source: U.S. Bureau of Labor Statistics
SECTORS GROWING FASTER THAN NATIONAL AVERAGE
Coupled with national employment projections, the Bureau of Labor Statistics also forecasts growth In “output” in each economic sector. Output is essentially each sector’s contribution to the nation’s gross domestic product (GDP).
Output is generally projected to increase about three times faster than job growth: 24.1% between 2020 and 2030 compared to 7.7% for jobs. Output grew more slowly in the prior decade at 17.3% though jobs grew more quickly at 8.2%.
Leading the next decade’s output growth rates would be the arts, entertainment, and recreation sector followed by the hotel and restaurant sector.
Despite North County’s seemingly “unbalanced” employment profile, five of the seven leading job sectors in North County are nationally projected to experience growth rates faster than the overall national average. Real estate will grow more slowly. Only the retail sector is projected to decline.
Opportunities would seem to be in order in these growth sectors for further economic development in North County.
Mining


Source: U.S. Bureau of Labor Statistics seemingly profile, five of North to than the estate will retail sector is in order further North County.
Ent, Recreation Lodging & Dining Other Services ALL JOBS
Coupled with national employment projections, the Bureau of Labor Statistics also forecasts growth In “output” in each economic sector. Output is essentially each sector’s contribution to the nation’s gross domestic product (GDP).

Output is generally projected to increase about three times faster than job growth: 24.1% between 2020 and 2030 compared to 7.7% for jobs. Output grew more slowly in the prior decade at 17.3% though jobs grew more quickly at 8.2%.
Leading the next decade’s output growth rates would be the arts, entertainment, and recreation sector followed by the hotel and restaurant sector.
USA OUTPUT PROJECTIONS, 2020 TO 2030: SECTORS WITH CURRENT STRENGTHS IN NORTH ST. LOUIS COUNTY
USA
2030:
USA Output Growth in Strong Employment Sectors of North St. Louis County, 2020-2030
ST. LOUIS COUNTY
Five of the seven economic sectors that are the employment strengths of North County are projected to have national output growth rates exceeding the overall pace of the economy. The lodging and dining sector, for instance would see output rise more than 50% from 2020 to 2030, an indication of the increasing sophistication of management in this sector coupled with growing demand.


Source: U.S. Bureau of Labor Statistics projected to by 2030. grow at a average. attributable adoption of automation performed by productivity, or even where declining.
Even retail trade will have higher productivity. But this sector is also expected to see declines in employment. Productivity (e.g., sales) per job, therefore, should increase, hopefully leading to much improved wages per job.
All U.S. economic sectors are projected to have increases in their output by 2030. But some, shown here, would grow at a pace slower than the national average.
Expanding output is typically attributable to increased employee skills, adoption of technological advances, and automation of some functions formerly performed by human beings. Thus, productivity, or output, per person can grow even where job growth is sluggish or declining.
Five of the seven economic sectors that are the employment strengths of North County are projected to have national output growth rates exceeding the overall pace of the economy. The lodging andm dining sector, for instance would see output rise more than 50% from 2020 to 2030, an indication of the increasing sophistication of management in this sector coupled with growing demand.
Even retail trade will have higher productivity. But this sector is also expected to see declines in employment. Productivity (e.g., sales) per job, therefore, should increase, hopefully leading to much improved wages per job.
2018 TO 2028:
The Missouri Economic Research and Information Center (MERIC) of the Missouri Department of Economic Development also prepares bi-annual 10-year employment projections for the state and for ten regions of the state. These projections are based, in part, on the national projections and, therefore, lag the national numbers by a year or so. Thus, the latest available job projections in Missouri are for 2018 to 2028.
The Missouri Economic Research and Information Center (MERIC) of the Missouri Department of Economic Development also prepares bi -annual 10-year employment projections for the state and for ten regions of the state. These projections are based, in part, on the national projections and, therefore, lag the national numbers by a year or so. Thus, the latest available job projections in Missouri are for 2018 to 2028.
The St. Louis Region, shown here, consists of St. Louis City plus the counties of St. Louis, St. Charles, Franklin, and Jefferson. Thus, it excludes Lincoln and Warren Counties, also in the metropolitan area, and it excludes all the Illinois counties in the metro area.
St. Louis has, by far, the largest number of jobs. In 2018, the St. Louis region had 1,177,300 jobs, almost 40% of all jobs in the state and 1.94 times the number in the Kanas City region, the second largest. Projections for St. Louis are relatively low, however. Its overall job growth rate to 2028 is expected to be 2.9% compared to 4.2% in the entire state and 4.8% in Kansas City.
MPLOYMENT


ST. LOUIS REGIONAL EMPLOYMENT
PROJECTIONS, 2018 TO 2028:
Source: Missouri Economic Research & Information Center (MERIC)
THAN region is average and 2028, led by at 16.1%, sector, care and projected to 2020 and to and 2030, about two-
GROWING SLOWER THAN REGIONAL AVERAGE
Ten sectors in St. Louis are projected to grow at a slower pace than the regional average of 2.9% between 2018 and 2028. In fact, five of those sectors would lose jobs, most prominently in the federal sector, even though state and local government
The largest location quotient in the St. Louis region is for the management of enterprises sector, but it is expected to lose jobs by 2028. Moreover, manufacturing will continue to lose a great many jobs along
While the five-county St. Louis region is projected to add a below-state-average 2.9%, more jobs between 2018 and 2028, eight sectors would grow faster, led by health care and social assistance at 16.1%, almost double the next fastest sector, waste management. Health care and social assistance jobs are projected to grow 16.8% in th eUSA between 2020 and 2030.
All jobs in the USA are projected to increase by 7.7% between 2020 and 2030, so St. Louis would grow at only about two-fifths the national rate.

St. Louis Region Sectors Projected to Grow Slower Than Total Jobs, 2018-2028
Source: Missouri Economic Research & Information Center (MERIC)
Ten sectors in St. Louis are projected to grow at a slower pace than the regional average of 2.9% between 2018 and 2028. In fact, five of those sectors would lose jobs, most prominently in the federal sector, even though state and local government would grow slightly.
The largest location quotient in the St. Louis region is for the management of enterprises sector, but it is expected to lose jobs by 2028. Moreover, manufacturing will continue to lose a great many jobs along with retail trade.
National projections, however, show strong output, or productivity gains, in these three private sectors in St. Louis.
• Manufacturing could see a 19.3% increase in output despite national job growth of only 1.2%. If St. Louis manufacturers can also achieve a similar output growth rate per employee , the decline in jobs can be largely offset in productivity gains.
• Management of companies and enterprises could see a 13.3% increase in output despite only a 1.9% gain in jobs. Again, similar output gains per employee could help offset projected St. Louis regional job losses.
• Retail trade is projected to experience a whopping 34.3% increase in productivity nationwide despite a 4.0% reduction in jobs. St. Louis is projected to lose 4.5% of its retail jobs over a decade, but strong productivity growth (i.e., sales per employee) should more than offset this impact on the regional economy.

ST. LOUIS REGIONAL EMPLOYMENT


Again, retail jobs are projected to decline in the St. Louis region by 4.5% over ten years, a factor which would sharply impact North County. Productivity gains, as projected at the national level, however, would like result in sharply increased retail sales in North County.
PROJECTIONS, 2018 TO 2028: SECTORS WITH CURRENT STRENGTHS IN NORTH ST. LOUIS COUNTY
Other strong sectors in today’s North County should see above average growth rates in the St. Louis area, other than the information sector. Information, however, is projected to see a 35.8% increase in national output as technology and automation replace many jobs.
Again, retail jobs are projected to decline in the St. Louis region by 4.5% over ten years, a factor which would sharply impact North County. Productivity gains, as projected at the national level, however, would like result in sharply increased retail sales in North County.

Other strong sectors in today’s North County should see above average growth rates in the St. Louis area, other than the information sector. Information, however, is projected to see a 35.8% increase in national output as technology and automation replace many jobs.
St. Louis Region Job Growth in Strong Sectors of North St. Louis County, 2018-2028
Source: Missouri Economic Research & Information Center (MERIC)


Industry Sector (Top Ten Sectors by Number of Jobs)
Count Share
Health Care and Social Assistance 122,346 18.6%
Manufacturing 57,273 8.7%
Administration & Support, Waste Management and Remediation 55,161 8.4%
Accommodation and Food Services 52,462 8.0%
Professional, Scientific, and Technical Services 45,398 6.9%
Retail Trade 44,233 6.7%
Educational Services 41,068 6.2%
Finance and Insurance 39,846 6.1%
Wholesale Trade 33,976 5.2%
Source: 2019 Census 'On the Map'
The above table shows the top ten industry sectors by the number of jobs within a 30-minute drive of the Jamestown Mall site. The following pages include maps of job locations of each of the industry sectors.
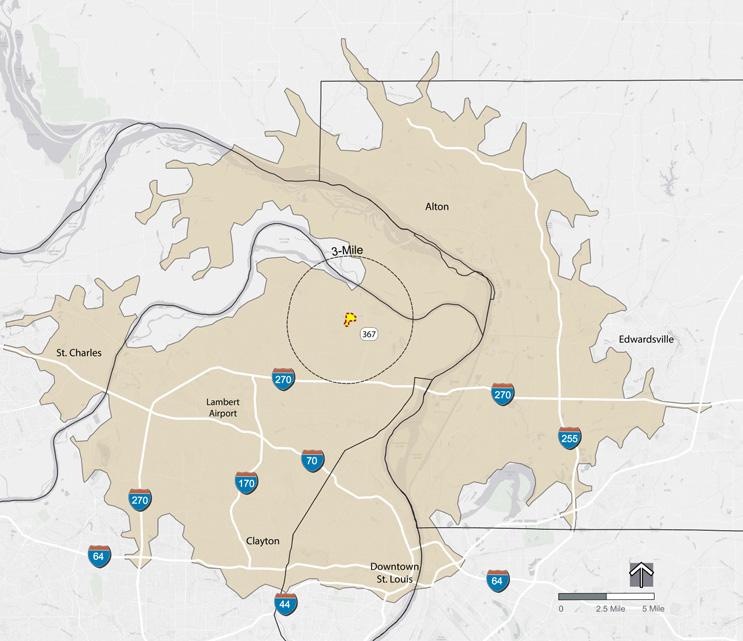
Jamestown Mall site
Base Map
30-Minute drive area from the Jamestown Mall site
Sector Stats: 18.6% of all jobs in area shown.
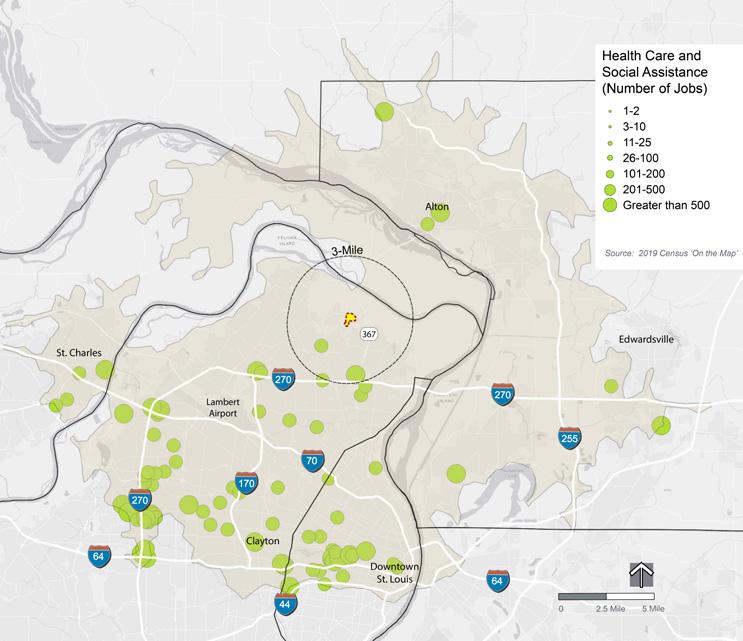
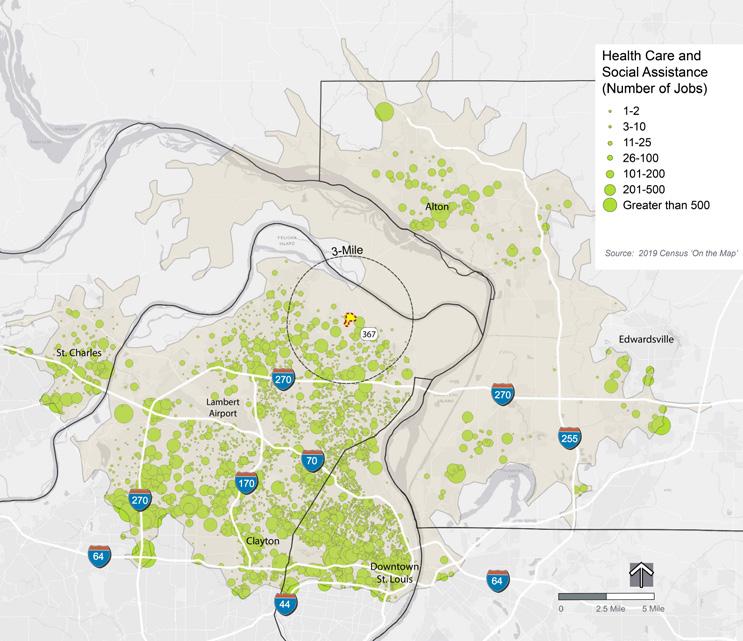
Sector Stats: 8.7% of all jobs in area shown.
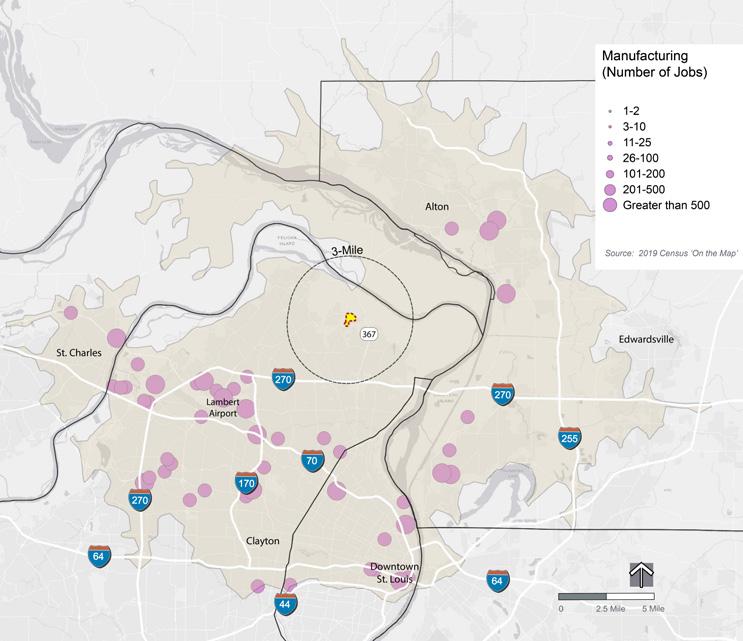
Large Job Locations (201-500 and 500+)
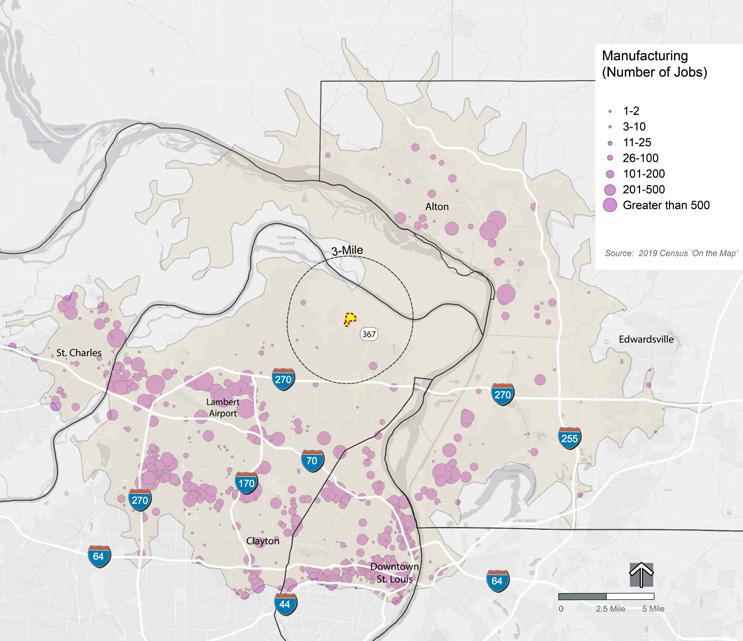
All Sector Jobs
Sector Stats: 8.4% of all jobs in area shown.
Large Job Locations (201-500 and 500+)
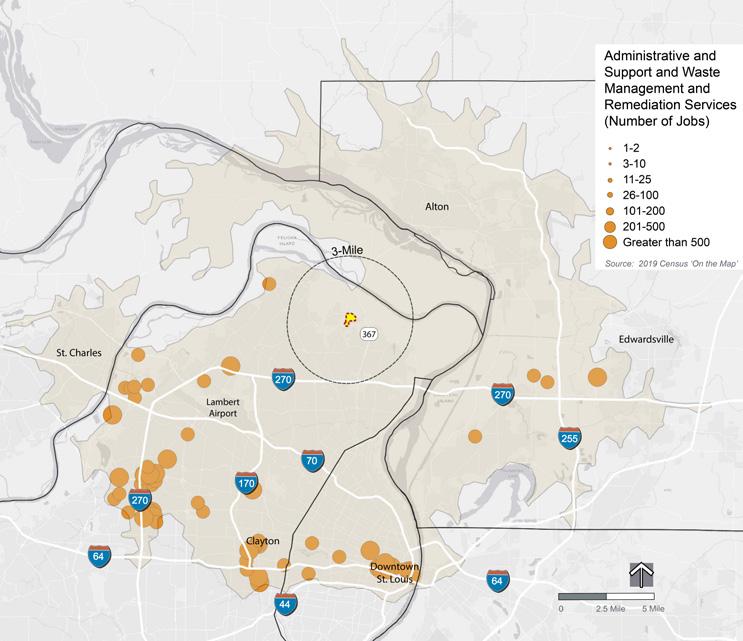
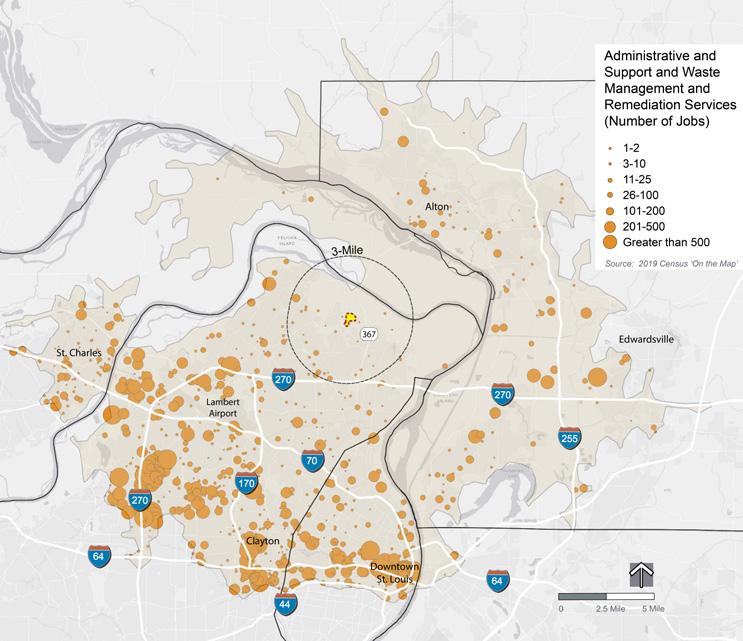
All Sector Jobs
Sector Stats: 8.0% of all jobs in area shown.
Large Job Locations (201-500 and 500+)
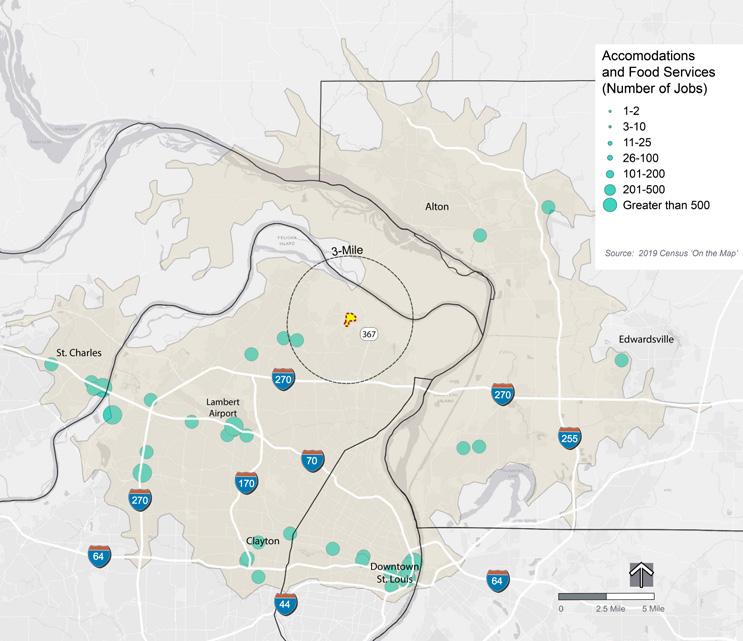
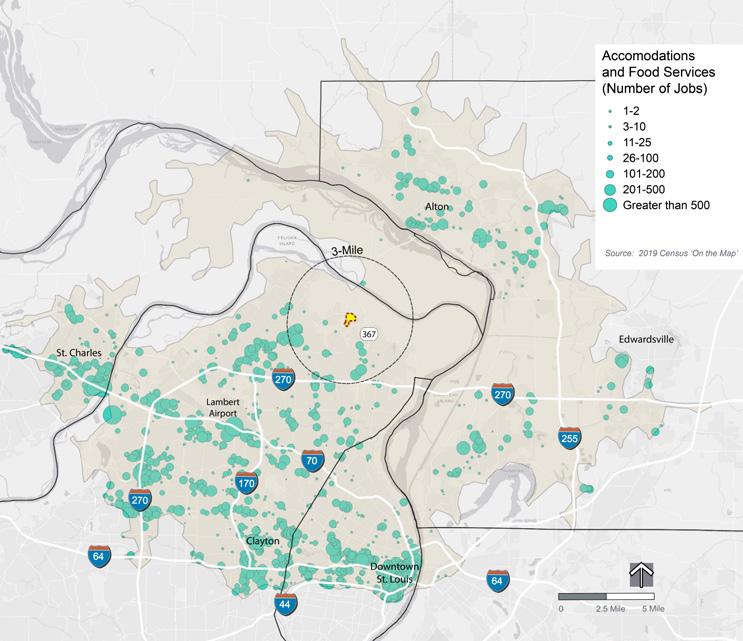
All Sector Jobs
Sector Stats: 6.9% of all jobs in area shown.
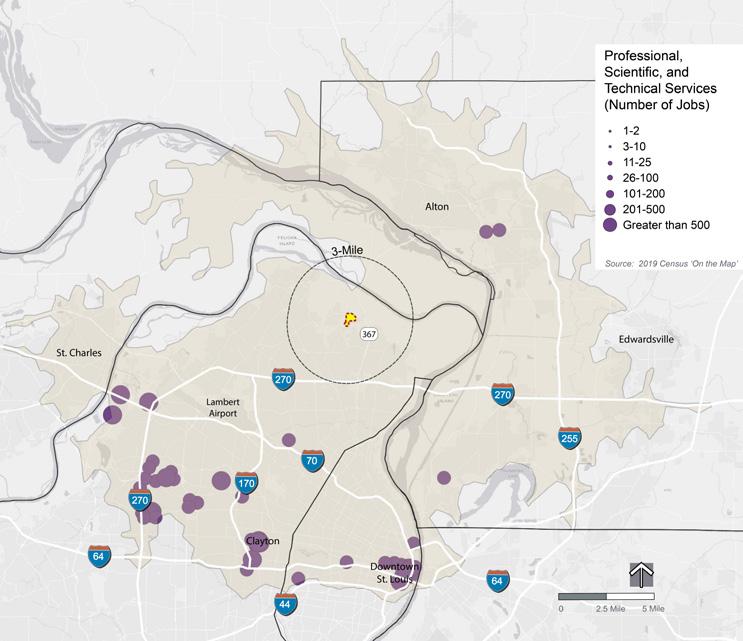
Large Job Locations (201-500 and 500+)
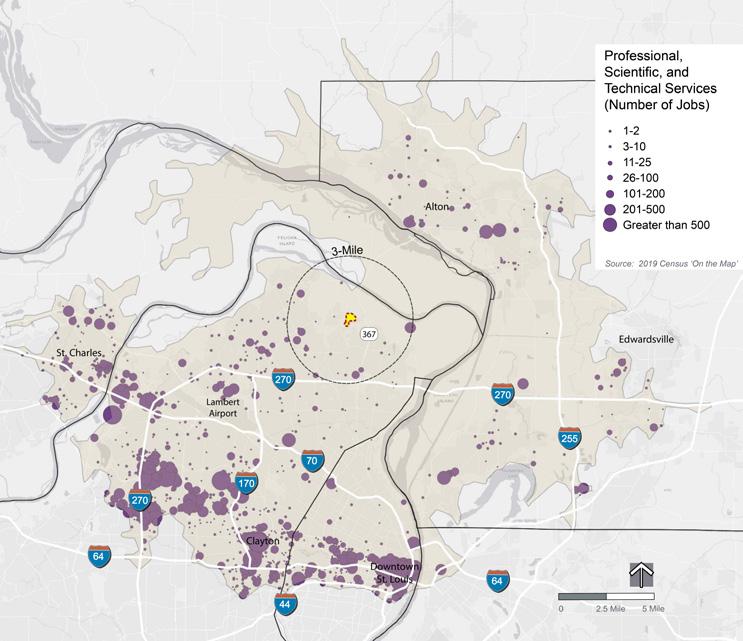
Sector Stats: 6.7% of all jobs in area shown.
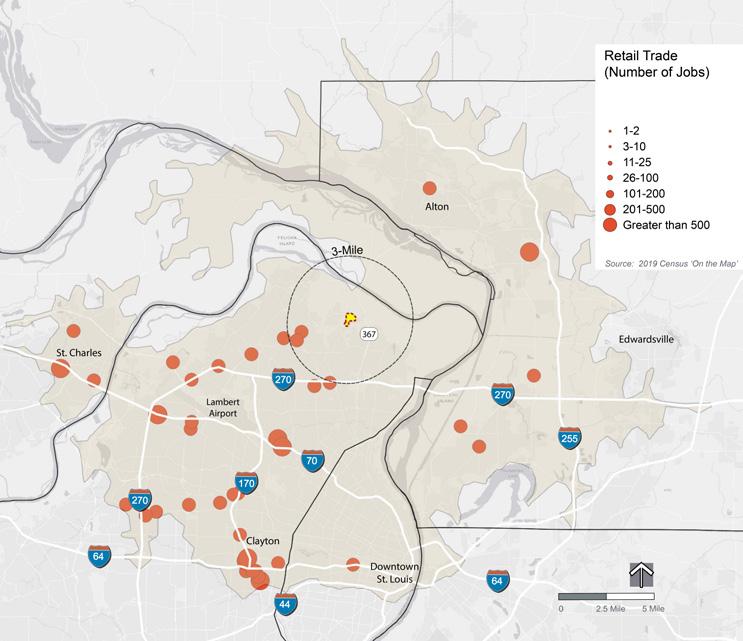
Large Job Locations (201-500 and 500+)
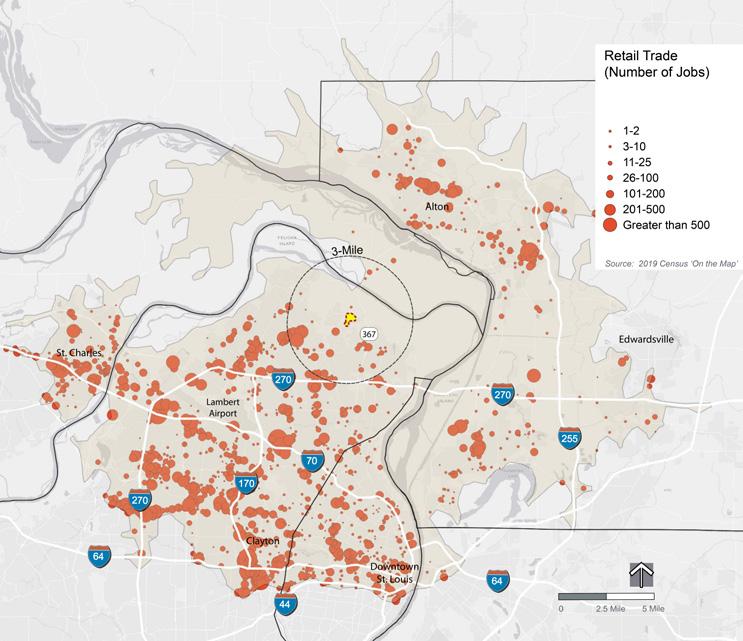
Sector Stats: 6.2% of all jobs in area shown.
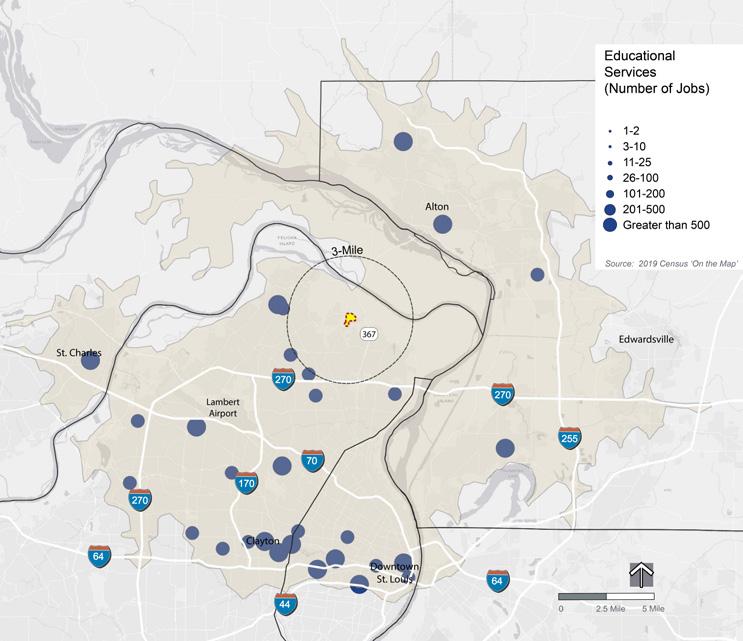
Large Job Locations (201-500 and 500+)
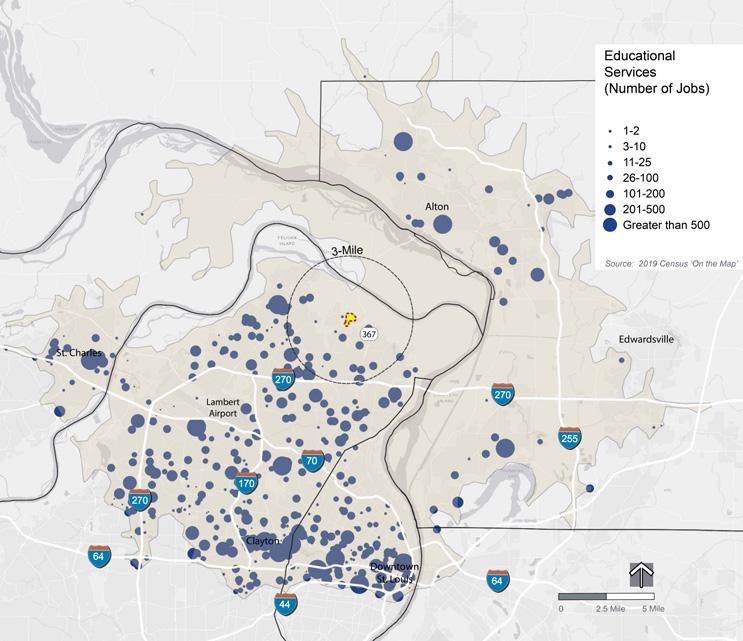
Sector Stats: 6.1% of all jobs in area shown.
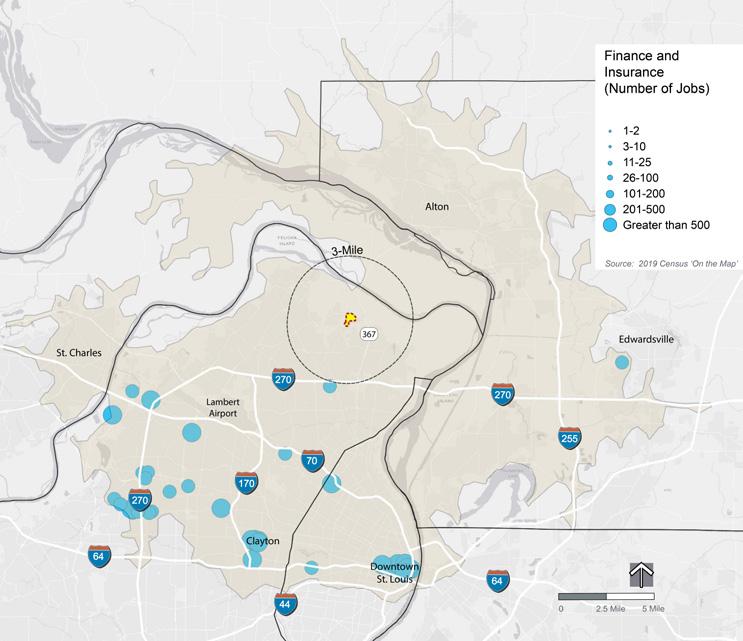
Large Job Locations (201-500 and 500+)
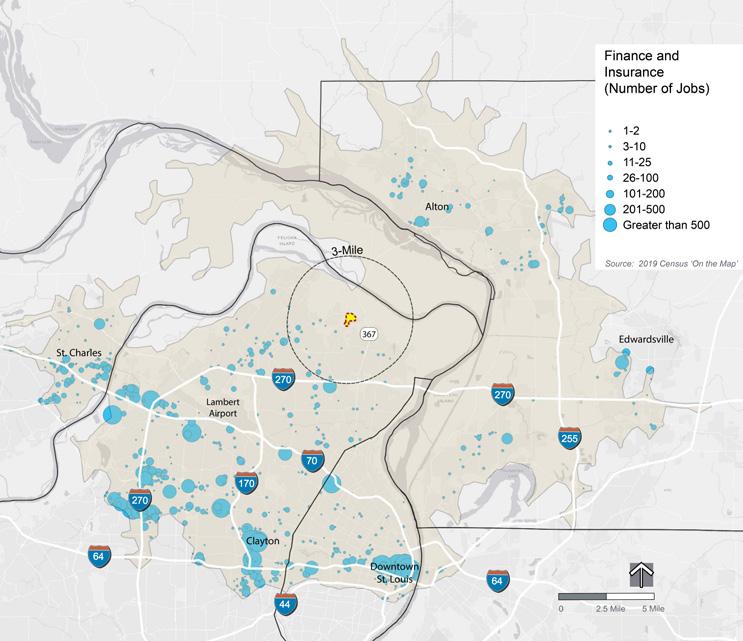
All Sector Jobs
Sector Stats: 5.2% of all jobs in area shown.
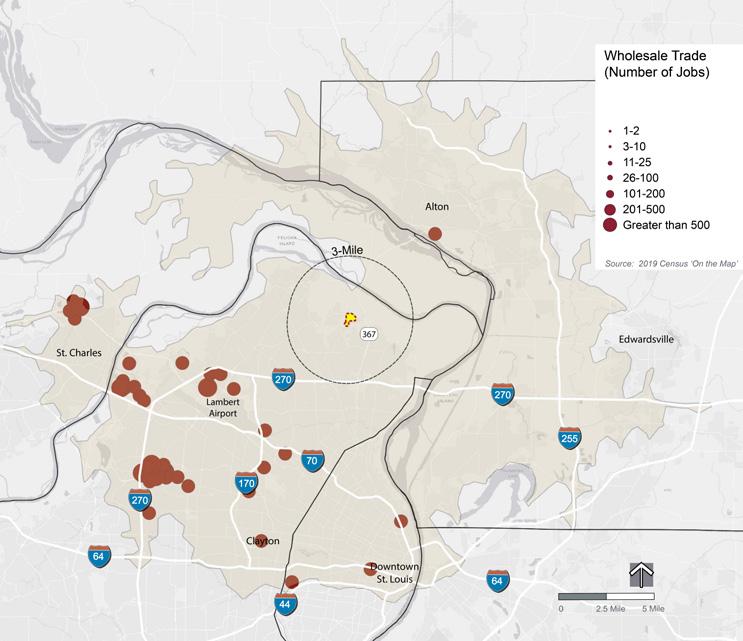
Large Job Locations (201-500 and 500+)
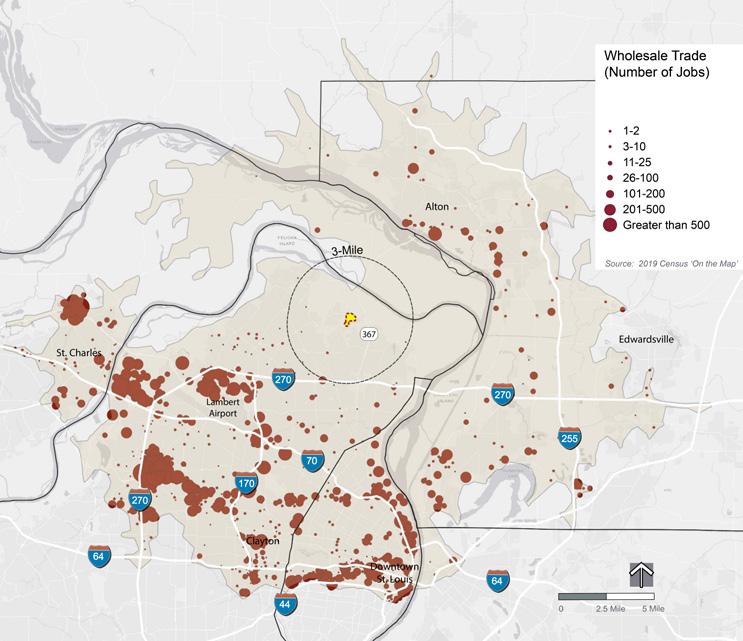
North St. Louis County, here defined as north of I-270, is well positioned to capture more of the employment and economic growth projected for the St. Louis area. It is centrally located in the region between east and west, but it suffers from a lack of centrality north to south. Thus, the strongest location for future growth is most likely along the I 270 corridor which enables fast access to all parts of the region for the movement of goods and workers.
But growth in the St. Louis area is projected to be sluggish, absent substantial economic development initiatives. This is a somewhat national challenge, too, with job growth rates slowing down over the next decade or so. But St. Louis could be slower than that. Thus, competition for added job growth in the region and in the nation will become more intense.
The Jamestown Mall site is not all that well positioned to compete strongly in this environment. It is not served directly by the interstate highway network and it has a relatively low population and workforce density nearby. Still, it is a large site in Missouri’s largest county and economic region. Targeting unique opportunities suitable to North County but also with national markets will could very well attract a substantial number of high value businesses and jobs.
Population is a valuable metric regarding market potential for redevelopment of the Jamestown Mall site. This section frequently compares socio-economic statistics of several North County cities and two unincorporated "census designated places" (CDPs), and growth areas of St. Charles County for comparison.
This section includes a deep dive into the existing housing market in North County to provide a baseline of potential new housing prices and the mix of owner-occupied verus rental housing.
Finally, this section includes analysis of the potential growth in the senior population of North County.
North County vs. Rest of St. Louis County
Those four zip codes are here defined as "North County." Between 2010 and 2020, North County lost a net of 2,000 residents, down 1.6% over the decade.
Those four zip codes are here defined as “North County. Between 2010 and 2020, North County lost a net of 2,000 residents, down 1.6% over the decade.
The rest of St. Louis County added 7,200 people, a slow growth rate of 0.8% over ten years. St. Louis County as a whole expanded by about 0.5%.
The rest of St. Louis County added 7,200 people, a slow growth rate of 0.8% over ten years. St. Louis County as a whole expanded about 0.5%.
Meanwhile, St. Charles County grew a whopping 12.4%, exceeding the metropolitan area's growth rate of just 1.1% and even the national growth rate of 7.4%.
North County comprised 12.9% of St. Louis County's residents in 2010, dropping slightly to 12.6% in 2020.
Meanwhile, St. Charles County grew a whopping 12.4%, exceeding the metropolitan area’s growth rate of just 1.1% and even the national growth rate of 7.4%.
North County comprised 12.9% of St. Louis County’s residents in 2010, dropping slightly to 12.6% in 2020.
1,000,000
800,000
600,000
400,000
200,000
Rest of StL Co. North County
Up 0.8%
128,500 126,500
870,500 877,600 0
2010 2020
Down 1.6%
North County vs. Rest of St. Louis County
O'Fallon, St. Charles, and St. Peters are also the only case study cities that grew significantly during the decade of the 2010s. Florissant experienced a decline of 2.3% of its 2010 population count, but the three St. Charles County cities grew by eight percent or more.
St. Louis County lost a slight amount of residents even as the metropolitan area grew marginally. Kirkwood also grew somewhat, but the North County cities and CDPs all lost population.
While these cities are along the busy I-70 and I-270 corridor, there continues to be a net migration westward.
Source: U.S. Census Bureau
ST. LOUIS CO. ST. CHARLES CO. ST. LOUIS METRO MISSOURI O'FALLON ST. CHARLES ST. PETERS HAZELWOOD FERGUSON BRIDGETON KIRKWOOD SPANISH LAKE OLD JAMESTOWN
-2.3% -0.5% 11.5% 0.6% 2.5% 11.8% 8.0% 10.7% -2.3% -3.2% -0.3% 1.0% - 11.0% -3.6%
O’Fallon, also significantly 2010s. of the by St. residents grew somewhat, and While 70 be
Charles County
whole, the last Neighboring 45,000 populated than as of the half the growth the
St. Louis County and St. Charles County vs. Rest of Metropolitan Area
360,500 405,300 0 200,000 400,000 600,000 800,000 1,000,000 1,200,000 1,400,000 1,600,000
COMMUNITY PLANNING LAB
999,000 1,004,100
St. Charles Co. St. Louis Co.
Up 12.4% Up 0.5%
2010 2020
The metropolitan area of St. Louis consists of seven Missouri counties (including the City of St. Louis) and eight Illinois counties. Totaling just over 2.8 million residents, the metro area grew very slightly in the last decade at 1.1%. Of the 15 counties, only St. Louis and St. Charles Counties also expanded. The other 13 counties declined collectively by 1.4% residents. St. Charles County, in fact, added more residents than the metro area as a whole. The county grew by 44,800 people while the metro area’s net gain was just 30,200.
3,000,000
2,500,000
2,000,000
1,500,000
1,000,000
500,000
Rest of Metro
St. Charles Co.
St. Louis Co. Dn 1.4%
360,500 405,300
999,000 1,004,100
1,430,600 1,410,900 0
2010 2020
St. Louis County and St. Charles County vs. Rest of Metropolitan Area St. Louis County vs. St. Charles County
JAMESTOWN MALL MARKET & FEASIBILITY STUDY
As noted, St. Louis County as a whole, expanded by some 7,200 people in the last decade, growing half a percent. Neighboring St. Charles County added almost 45,000 people, however, growing 12.4%.
JAMESTOWN MALL MARKET & FEASIBILITY STUDY SAINT LOUIS UNIVERSITY COMMUNITY PLANNING LAB
St. Charles County is more populated than the City of St. Louis, which started as of the Census of 2000. While not yet even half the population of St. Louis County, its growth rate has been among the fastest in the United States for several decades.
The metropolitan area of St. Louis consists of seven Missouri counties (including the City of St. Louis) and eight Illinois counties. Totaling just over 2.8 million residents, the metro area grew very slightly in the last decade at 1.1%. Of the 15 counties, only St. Louis and St. Charles Counties also expanded. The other 13 Counties declined collectively by 1.4% residents.
St. Charles County, in fact, added more residents than the metro area as a whole. The county grew by 44,800 people while the metro area's net gain was just 30,200.
The metropolitan area’s ten-year growth rate of just 1.1% was about oneseventh the growth rate of the entire country, which grew 7.7% .
Other than the 1970s, this was the slowest decade growth rate for the metropolitan counties since the 1940s. During the first half of the 20th Century, metro St. Louis grew at about the same rate as the USA. But that ended in the mid 1960s and growth has been, at best, sluggish for over half a century.
Up 7.4%
The metropolitan area's ten-year growth rate of just 1.1% was about one-seventh the growth rate of the entire country, which grew 7.7%.
Other than the 1970s, this was the slowest decade growth rate for the metropolitan counties since the 1940s. During the first half of the 20th Century, metro St. Louis grew at about the same rate as the USA. But that ended in the mid-1960s and growth has been, at best, sluggish for over half a century.
St. Louis Metropolitan Population Growth Rates, 1940-2020 (15 Counties)
Source: U.S. Census Bureau
Up 1.1%
St. Louis Metro United States
Up 7.4%
Up 1.1%
15%
10%
5%

0%
15.5% 18.8% 12.1% -1.4% 3.0% 4.1% 4.7% 1.1% -5%
20% 1940-50 1950-60 1960-70 1970-80 1980-90 1990-00 2000-10 2010-20

SAINT LOUIS UNIVERSITY COMMUNITY PLANNING LAB
JAMESTOWN MALL MARKET & FEASIBILITY
This map illustrates population growth and decline at the Census tract level in the last decade.
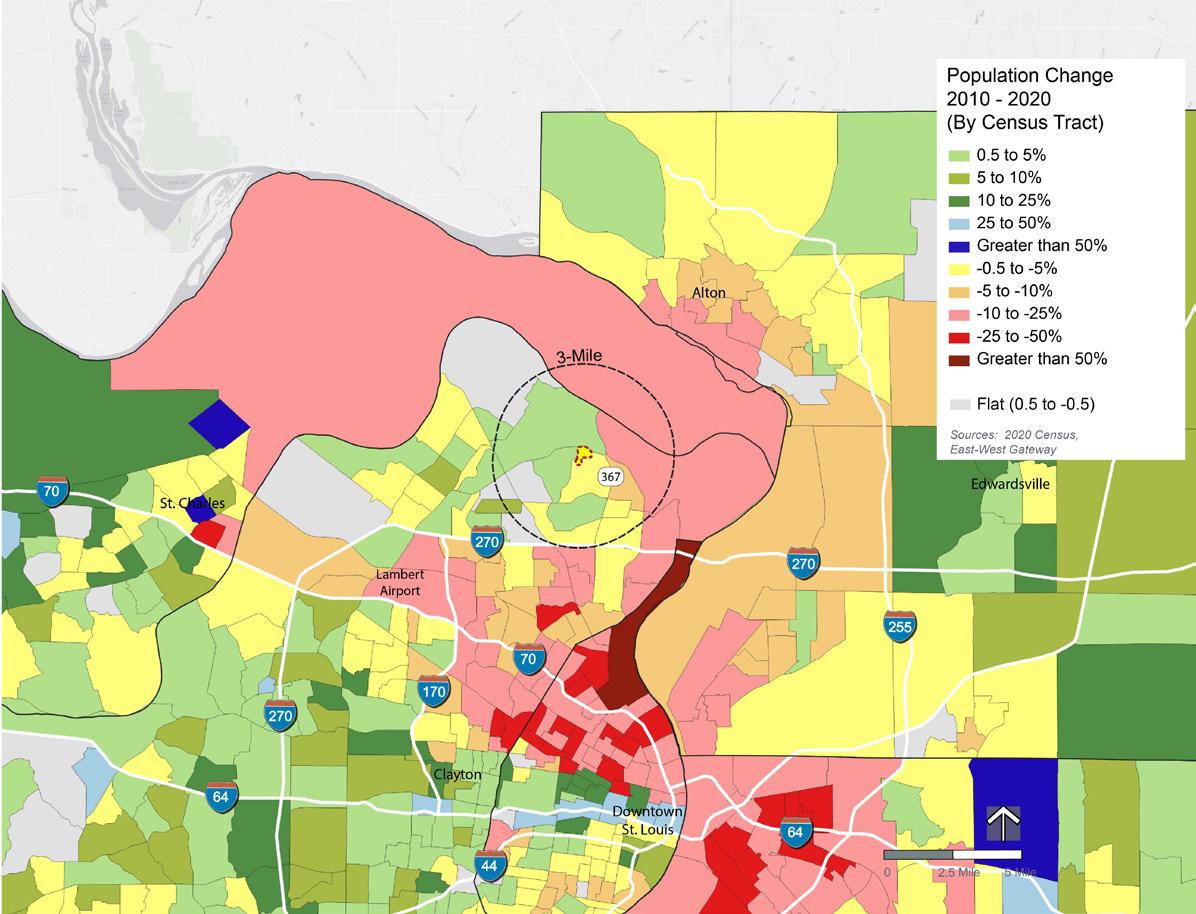
Jamestown Mall site
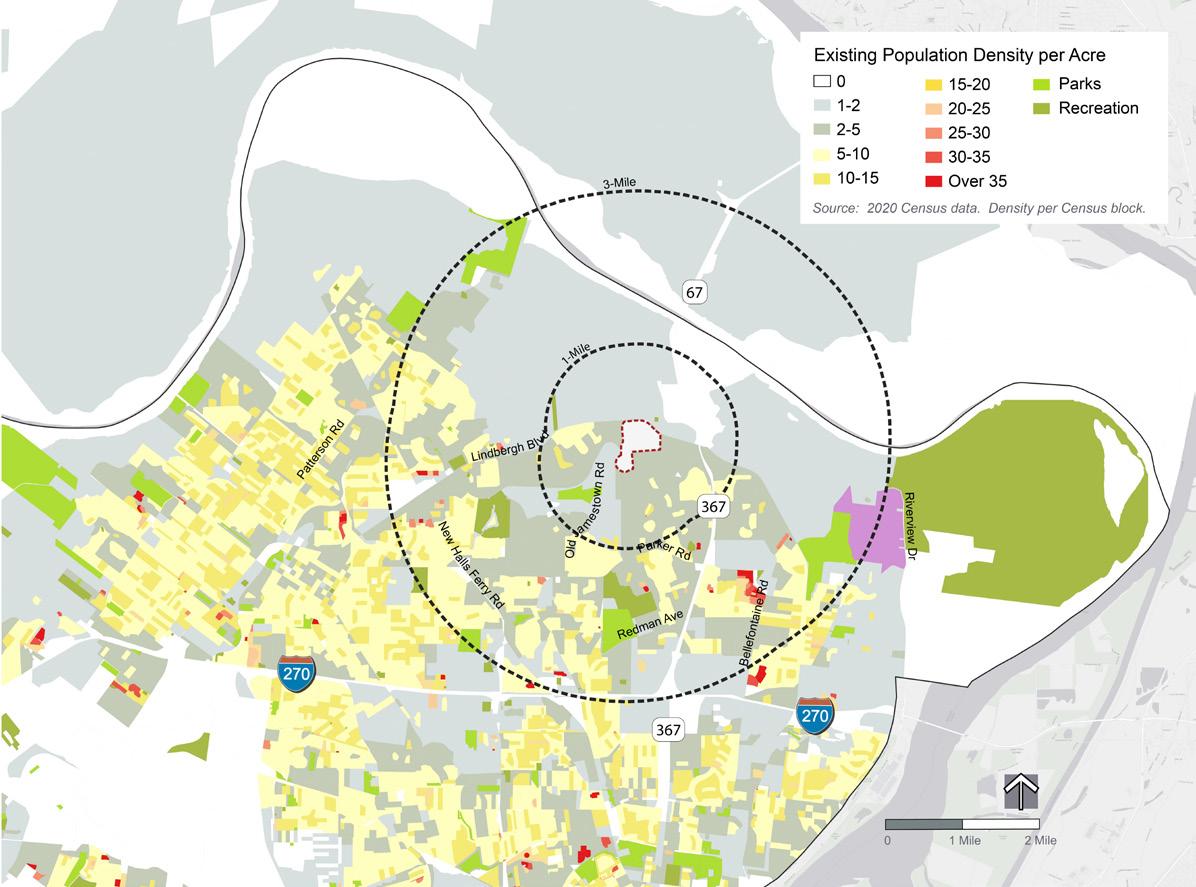

Louis is 21st
There are some 383 metropolitan areas in the United States, each defined by contiguous counties. St. Louis is presently the 21st most populated, sandwiched between Baltimore, Maryland, and Orlando, Florida. New York, covering parts of three states, has more than 20 million people, followed by Los Angeles with over 13 million and Chicago with almost ten million.

There are some 383 metropolitan areas in the United States, each defined by contiguous counties. St. Louis is presently the 21 st most populated, sandwiched between Baltimore, Maryland, and Orlando, Florida. New York, covering parts of three states, has more than 20 million people, followed by Los Angeles with over million and Chicago with almost ten million. Louis has been losing ground, however. Before the net population decline of the 1970s, the metro area ranked in the teens. While the region has added population since then, other metro areas have grown more rapidly.
St. Louis has been losing ground, however. Before the net population decline of the 1970s, the metro area ranked in the mid-teens. While the region has added population since then, other metro areas have grown more rapidly.
- 5 10 15 20 25 New York Los Angeles Chicago Dallas Ft Worth Houston Washington DC Philadelphia Miami Ft Lauderdale Atlanta Boston Phoenix San Francisco Riverside Detroit Seattle Mpls-St Paul San Diego Tampa Denver Baltimore St. Louis Orlando Charlotee San Antonio Portland
20.14 13.20 9.62 7.64 7.12 6.39 6.25 6.14 6.09 4.94 4.85 4.75 4.60 4.39 4.02 3.69 3.30 3.18 2.96 2.84 2.82 2.67 2.66 2.56 2.51
St. Louis is 21st
Looking to 2060 by the U.S. Census Bureau
Adding to St. Louis’ growth doldrums are projections of the U.S. population to the year 2060. While these projections were made before the 2020 Census, so they are subject to revisions not yet published, they continue a trend of much slower population growth.
Adding to St. Louis’ growth doldrums are projections of the U.S. population to the year 2060. While these projections were made before the 2020 Census, so they are subject to revisions not yet published, they continue a trend of much slower population growth.
The decade of the 2010s was the second slowest in the U.S., dating to the original Census of 1790 (the slowest was the 1930s Great Depression). The Census Bureau predicts even slower growth coming.
The decade of the 2010s was the second slowest in the U.S. dating to the original Census of 1790 (the slowest was the 1930s Great Depression). The Census Bureau predicts even slower growth coming.
Growth rates for the nation in five-year periods are shown here to 2060 from the year 2000. The projections were made in 2016 and show that the 2010s should have grown by about 8.5%. The actual growth was 7.7%. So these projections might be revised downward. The implication for sluggish St. Louis is that there will be fewer “new Americans” from which to attract more aggressive growth in the coming decades. And most net growth in the U.S. tends to favor the half dozen or so already-large metro areas at the top of the chart on the previous page.
U.S. Population Projected 5 -Year Change Rates 2000 to 2060


Source: U.S. Census Bureau
6.0% 4.8% 4.6% 3.9% 3.5% 3.5% 3.2% 2.7% 2.4% 2.1% 2.0% 2.0% 2.0%
2000 2005 2010 2015 2020 2025 2030 2035 2040 2045 2050 2055 2060
Growth rates for the nation in five-year periods are shown here to 2060 from the year 2000. The projections were made in 2016 and show that the 2010s should have grown by about 8.5%. The actual growth was 7.7%. So these projections might be revised downward. The implication for sluggish St. Louis is that there will be fewer “new Americans” from which to attract more aggressive growth in the coming decades. And most net growth in the U.S. tends to favor the half dozen or so already-large metro areas at the top of the chart on the previous page.
Looking to 2060 by the U.S. Census Bureau
People who identify as Black Alone (i.e., no other race or ethnicity included) made up a majority— 53.4% — of North County’s population in 2021, according to estimates by Esri based on the 2020 Census results. Those 67,380 people grew by 9.0% between 2010 and 2021.
Race and Ethnicity in North County, 2010 and 2021

Meanwhile, the White Alone population declined by 14.5% in North County even as all other races and ethnicities expanded, though their numbers are relatively small. Blacks and Whites made up about the same number of people in 2010, but this changed dramatically by 2021.
People who identify as Black Alone (i.e., no other race or ethnicity included) made up a majority— 53.4% — of North County’s population in 2021, according to estimates by Esri based on the 2020 Census results. Those 67,380 people grew by 9.0% between 2010 and 2021.
North County’s population has certainly become more diverse in racial and ethnic terms, though it was already quite diverse even in 2010.
Meanwhile, the White Alone population declined by 14.5% in North County even as all other races and ethnicities expanded, though their numbers are relatively small. Blacks and Whites made up about the same number of people in 2010, but this changed dramatically by 2021.
North County’s population has certainly become more diverse in racial and ethnic terms, though it was already quite diverse even in 2010.
Black Alone White Alone
Two or More Races
Asian Alone
Some Other Race Alone
- 20,000 40,000 60,000 80,000
Source: Esri, 2022 2010 2021
61,790 61,700 2,810 1,190 980
67,380 52,770 3,590 1,500 1,040


Up 9.0%
Down 14.5% Up 27.8%
Up 26.1%

Up 6.1%
North County
People who identify as Black Alone made up a much smaller ratio—24.6% — of St. Louis County as a whole in 2020, according to Census results. But, like North County, the Black population in the entire County increased (5.8%) while the White population declined by 9.9% (almost 70,000). Roughly half of the County’s Black population live in North County and North County accounted for 40% of the County’s Black population growth in the last decade.
Race and Ethnicity in St. Louis County, 2010 and 2020

Also like North County, the entire county became more diverse with a declining White population. All other major race and ethnicity groups increased in numbers during the 2010s throughout the County.
People who identify as Black Alone made up a much smaller ratio—24.6% — of St. Louis County as a whole in 2020, according Census results. But, like North County, the number of Blacks in the entire County increased (5.8%) while the White population declined by 9.9% (almost 70,000). Roughly half of the County’s Blacks live in North County and North County accounted for 40% of the County’s Black population growth in the last decade.
If population growth can be attracted to North County and the Jamestown Mall site, it is likely to be dominated by non-Whites, given recent trends.
Also like North County, the entire county became more diverse with a declining White population. All other major race and ethnicity groups increased in numbers during the 2010s throughout the County.
If population growth can be attracted to North County and the Jamestown Mall site, it is likely to be dominated by non-Whites, given recent trends.
Two or More Races Asian Alone
Some Other Race Alone
- 200,000 400,000 600,000 800,000 Black Alone White Alone
Source: U.S. Census Bureau Redistricting Data, 2020 2010 2020
233,030 701,950 18,600 34,600 10,770


Up 5.8%
246,640 632,280 57,580 48,780 18,850

Down 9.9% Up 41.0%
Up 209.6%
Up 75.0%


Younger age groups have recently declined in number in North County, and in shares of the population, while older groups have generally increased. Using Esri estimates based on the 2010 and 2020 Census, every age group under 25 in North County declined in number, suggesting lessened demand for schools and day care centers.
age groups have recently declined in number in County, and in shares of the population, while older have generally increased. Using Esri estimates the 2010 and 2020 Census, every age group in North County declined in number, suggesting demand for schools and day care centers.
25-to-34 year olds group increased from 12.0% to 14.0%, or just over 2,000 more residents. These are family- forming years, perhaps hinting that a baby is imminent. Those who are now 35 to 54, however, declined by well over 5,000 residents. Those are the highest earnings years in careers, perhaps a sign that increased affluence has encouraged out-migration to higher value communities.
Age groups from 55 and more have all increased in size, an indicator of the need for more elderly services and housing.
year olds group increased from 12.0% to 14.0%, over 2,000 more residents. These are familyyears, perhaps hinting that a baby is imminent. who are now 35 to 54, however, declined by well 5,000 residents. Those arethe highest earnings years careers, perhaps a sign that increased affluence has encouraged out-migration to higher value communities. groups from 55 and more have all increased in size, an of needs for more elderly services and housing.
Population


0% 5% 10% 15% 20% 0-4 5-9 10-14 15-19 20-24 25-34 35-44 45-54 55-64 65-74 75-84 85 and Over
6.1% 6.5% 7.3% 7.9% 6.1% 12.0% 12.5% 15.4% 12.4% 6.9% 4.9% 2.1%
5.4% 5.8% 6.1% 6.1% 5.9% 14.0% 12.1% 11.9% 14.1% 10.8% 5.3% 2.5%


St. Louis County as a whole also experienced decreases in people under 25. But older groups all increased except for the 35-to-55 group.
The 25-to-34 year old age group showed an increase of about 3,700 residents, much the same as North County, though this number includes North County. Also, like North County, the rest of the county experienced sharp declines in 45-to-54 year olds and increases in the older groups.
County as a whole also experienced decreases in under 25. But older groups all increased except for -55 group. -34 year old age group showed an increase of 3,700 residents, much the same as North County, this number includes North County. Also like North the rest of the county experienced sharp declines 54 year olds and increases in the older groups
Population by Age in St. Louis County, 2010 and 2021
Source: Esri, 2022 2010 2021
5.9% 6.3% 6.8% 7.1% 6.0% 12.2% 12.3% 15.6% 12.9% 7.4% 5.2% 2.4%
0% 5% 10% 15% 20% 0-4 5-9 10-14 15-19 20-24 25-34 35-44 45-54 55-64 65-74 75-84 85 and Over
5.2% 5.6% 6.2% 6.2% 5.7% 12.6% 12.3% 12.0% 14.2% 11.2% 5.9% 2.9%
St. Louis County


A result of declining young age groups and increasing older groups is an increase in the median age of the North County population. A two-year jump from 38.4 to 40.4 is rather significant as an indicator that a great deal of change is going on.


Source: Esri
A result of declining young age groups and increasing older groups is an increase in the median age of the North County population. A two-year jump from 38.4 to 40.4 is rather significant as an indicator that a great deal of change is going on.
The decline in school-age children is contributing to a decline in average household size from 2.52 persons per household in 2010 to 2.50 in 2021. Household sizes have been declining in the region for decades, so this is not a major pattern change. But it can mean that the demand for smaller housing is in order (unless that baby boom hinted at earlier turns into reality). Still, an aging population and shrinking numbers of children are indicators of a lessening in demand for larger homes.
The decline in school-age children is contributing to a decline in average household size from 2.52 persons per household in 2010 to 2.50 in 2021. Household sizes have been declining in the region for decades, so this is not a major pattern change. But it can mean that a demand for smaller housing is in order (unless that baby boom hinted earlier) turns to reality. Still, an aging population and shrinking numbers of children are indicators of a lessening in demand for larger homes.
40.4 2.50 0 5 10 15 20 25 30 35 40 45
38.4 2.52
2010 2021
The median age of all St. Louis County likewise significantly increased—1.9 years. Patterns in North County are not all that dissimilar. The rest of the county, however, shows signs of being a little bit older than North County with the 2021 median age estimate for the entire county almost a year and a half higher than in North County.

Average household size also decreased throughout the county, though not substantially, dropping from 2.42 persons per household in 2010 to 2.41 in 2021. Both of these values at the county level, however, are below North County.
So North County is somewhat younger than the entire county and has somewhat larger households.
The median age of all St. Louis County likewise significantly increased—1.9 years. Patterns in North County are not all that dissimilar. The rest of the county, however, shows signs of being a little bit older than North County with the 2021 median age estimate for the entire county almost a year and a half higher than in North County.
Average household size also decreased throughout the county, though not substantially, dropping from 2.42 persons per household in 2010 to 2.41 in 2021. Both of these values at the county level, however, are below North County.
So North County is somewhat younger than the entire county and has somewhat larger households.
41.8 2.41 0 5 10 15 20 25 30 35 40 45
39.9 2.42


Source: Esri 2010 2021

County and St. Louis County
County and St. Louis County income estimates for 2021 show that North County of households in the lowest seven income $150,000 per year) than throughout the entire substantially lower shares in the two highest income this defines North County as quite income diverse solid middle class lifestyles. But the very affluent rare.
Household income estimates for 2021 show that North County has higher shares of households in the lowest seven income categories (up to $150,000 per year) than throughout the entire county but substantially lower shares in the two highest income groups.
In many ways, this defines North County as quite income diverse, leaning toward solid middle class lifestyles. But the very affluent are relatively rare.
This difference leads to a large gap between median incomes. St. Louis County as a whole has a median income some $10,000 higher than in North County.
Household income estimates for 2021 show that North County higher shares of households in the lowest seven income categories (up to $150,000 per year) than throughout the entire but substantially lower shares in the two highest income ways, this defines North County as quite income diverse toward solid middle class lifestyles. But the very affluent relatively rare.
Households by Income Ranges, 2021 North County and St. Louis County Source: Esri, 2022 North County St. Louis County
0% 5% 10% 15% 20% 25%


Median Annual Household Income


difference leads to gap between incomes. St. County as a whole median income $10,000 higher North County.
leads to between St. whole income higher County.
$59,800 $69,900 $0 $20,000 $40,000 $60,000 $80,000
Households by Income Ranges, 2021 North County and St. Louis County $59,800 $69,900 $0 $20,000 $40,000 $60,000 $80,000
North County & St. Louis County, 2021 Source: Esri North County St. Louis County
Median Annual Household Income North County & St. Louis County, 2021 Source: Esri North County St. Louis County
<$15,000 $15,000 - $24,999 $25,000 - $34,999 $35,000 - $49,999 $50,000 - $74,999 $75,000 - $99,999 $100,000 - $149,999 $150,000 - $199,999 $200,000+
8.0% 9.3% 8.8% 13.7% 20.5% 14.2% 17.1% 5.0% 3.4%
0% 25% <$15,000 $15,000 - $24,999 $25,000 - $34,999 $35,000 - $49,999 $50,000 - $74,999 $75,000 - $99,999 $100,000 - $149,999 $150,000 - $199,999 $200,000+
7.9% 7.6% 7.7% 11.9% 17.7% 12.6% 16.1% 7.8% 10.8%
North County and St. Louis County North County and St. Louis County


JAMESTOWN MALL MARKET & FEASIBILITY STUDY SAINT LOUIS UNIVERSITY COMMUNITY PLANNING LAB
UNIVERSITY COMMUNITY PLANNING LAB
JAMESTOWN MALL MARKET & FEASIBILITY STUDY
(2020 Census had the County had helping number (89.5%) occupied totaled housing.
North
PLANNING LAB
Housing Units and Tenure in North County
Source: U.S. Census Bureau ACS 2019
53,250 47,660 32,560 15,100 5,590 0 10,000 20,000 30,000 40,000 50,000 60,000

Total Housing Units

Total Households Owner Occupied Renter Occupied Vacant
St. Louis County as a whole had a higher ratio of occupied housing than North County as of the 2019 estimates. Some 92.1% of county housing was occupied (a household is an occupied housing unit), about 2½ percent points higher than North County. Owner and renter occupancy rates, however, were generally equal between North County and the entire county—68 to 69 percent owner-occupants and 31 to 32 percent renters. But North County’s housing vacancy rate was considerably higher than the entire county, also indicating that it was even higher than the rest of the county, which had a vacancy rate of 7.6%.
100%
80%
60%


40%
20%
and St. Louis County 89.5% 68.3% 31.7% 10.5%
92.1% 68.6% 31.4% 7.9% 0%
Using 2019 (5-year) Census estimates (2020 Census figures are not yet available), North County had some 53,250 housing units, some 12.1% of the entire county’s housing stock. (North County had 12.6% of the county’s population in 2010, helping to explain North County’s higher average number of persons per household.)
St. Louis County as a whole had a higher ratio of occupied housing than North County as of the 2019 estimates. Some 92.1% of county housing was occupied (a household is an occupied housing unit), about 21⁄2 percent points higher than North County.
Of those 53,250 housing units, 47,660 (89.5%) were occupied as households. Of those households, 32,560 (68.3%) were owneroccupied and 15,100 (31.7%) were renter occupied.
Vacant housing in the 2019 estimates totaled 5,590, or 10.5% of all North County housing.
Owner and renter occupancy rates, however, were generally equal between North County and the entire county—68 to 69 percent owner-occupants and 31 to 32 percent renters. But North County’s housing vacancy rate was considerably higher than the entire county, also indicating that it was even higher than the rest of the county, which had a vacancy rate of 7.6%.
County as of over three that is, one 2,640 were contained in 160 mobile the vans, etc.
Housing Units in Housing Structures: North County
Source: U.S. Census Bureau ACS 2019
North County & St. Louis County
0 10,000 20,000 30,000 40,000 50,000 60,000


Over three quarters (76.7%) of North County’s housing units are single family homes, a notably higher percentage than the entire county at almost 72%. Very clearly, North County is a familyoriented community. The county as a whole has a lower percentage of single family attached units but generally higher shares of multi-family structures. While the graph indicates that zero percent of the county’s housing is in boats, RVs, vans, etc., in fact the share is 0.03%, which rounds to 0.0%. 90 of the 120 boats, RVs, vans, etc., in St. Louis County (three-quarters) are found in North County.
Total Housing Units 1-Detached 1-Attached 2 Units 3 or 4 5 to 9 10 to 19 20 to 49 50 or More Mobile Home Boat, RV, Van, etc.
53,250 40,840 2,640 270 1,710 2,570 2,830 700 1,450 160 90


Source: U.S. Census Bureau ACS 2019
0% 20% 40% 60% 80%
76.7%
1-Detached 1-Attached 2 Units 3 or 4 5 to 9 10 to 19 20 to 49 50 or More Mobile Home Boat, RV, Van, etc.
5.0% 0.5% 3.2% 4.8% 5.3% 1.3% 2.7% 0.3% 0.2%
SAINT LOUIS UNIVERSITY COMMUNITY PLANNING LAB
JAMESTOWN MALL MARKET & FEASIBILITY STUDY PLANNING LAB
Of the 53,250 housing units in North County as of the 2019 Census estimates, 40,840 (just over three quarters) were singlefamily homes—that is, one unit in a detached structure. Another 2,640 were in single-family attached units, such as townhouses.
The rest of the housing units are contained in multi-family structures other than the 160 mobile homes and 90 housing units classified in the Census as boats, recreational vehicles, vans, etc.
North County St. Louis County
71.9% 4.6% 1.6% 4.7% 6.1% 5.3% 2.1% 3.4% 0.3% 0.0%
North County & St. Louis County
Over three quarters (76.7%) of North County’s housing units are single-family homes, a notably higher percentage than the entire county at almost 72%. Very clearly, North County is a family- oriented community. The county as a whole has a lower percentage of single-family attached units but generally higher shares of multi-family structures.
While the graph indicates that zero percent of the county’s housing is in boats, RVs, vans, etc., in fact the share is 0.03%, which rounds to 0.0%. 90 of the 120 boats, RVs, vans, etc., in St. Louis County (three-quarters) are found in North County.

North County’s housing development boom started in the post-World War II era as suburbanization rapidly advanced in metropolitan St. Louis. By the 1960s, housing growth was strong. Almost three out of ten housing units in North County by 2019 had been built in the decade of the 1960s, which was preceded and followed by decades of other substantial housing development.
Source: U.S. Census Bureau ACS 2019
This trend lingered into the 1980s then trailed off. Since 2010, only about 350 housing units have been constructed as North County “filled up” and population growth stagnated.
North County’s housing development boom started in the post-World War II era as suburbanization rapidly advanced in metropolitan St. Louis. By the 1960s, housing growth was strong. Almost three out of ten housing units in North County by 2019 had been built in the decade of the 1960s, which was preceded and followed by decades of other substantial housing development.
This trend lingered into the 1980s then trailed off. Since 2010, only about 350 housing units have been constructed as North County “filled up” and population growth stagnated.
North County 100 250 2,580 3,860 7,030 11,450 15,300 9,840 1,630 1,220
0 5,000 10,000 15,000 20,000 2014 or later 2010 to 2013 2000 to 2009 1990 to 1999 1980 to 1989 1970 to 1979 1960 to 1969 1950 to 1959 1940 to 1949 1939 or earlier


North County & St. Louis County
While North County’s height of housing construction occurred in the 1960s, it was a little more evenly spread out in the county as a whole. The county and North County both had about 181⁄2 percent of their housing built in the 1950s, a pace that stayed consistent for two more decades in the entire county. Meanwhile, however, North County surged ahead.
Source: U.S. Census Bureau ACS 2019
While North County’s height of housing construction occurred in the 1960s, it was a little more evenly spread out in the county as a whole. The county and North County both had about 18½ percent of their housing built in the 1950s, a pace that stayed consistent for two more decades in the entire county. Meanwhile, however, North County surged ahead.
Since 1990 or so, there has been more rapid housing growth in the county than in North County, though the pace of construction markedly slowed as the 21st Century dawned. Population growth and available land both dwindled throughout the county. But a net result is that the median year built is virtually the same for both North County and the entire county—in the late 1960s.
Since 1990 or so, there has been more rapid housing growth in the county than in North County, though the pace of construction markedly slowed as the 21st Century dawned. Population growth and available land both dwindled throughout the county. But a net result is that the median year built is virtually the same for both North County and the entire county—in the late 1960s.
0.2% 0.5% 4.8% 7.2% 13.2% 21.5% 28.7% 18.5% 3.1% 2.3%
1.0% 1.1% 5.9% 9.4% 11.9% 16.9% 18.9% 18.6% 6.7% 9.7%


North County 1969 St. Louis County 1968
0% 10% 20% 30% 40% 2014 or later 2010 to 2013 2000 to 2009 1990 to 1999 1980 to 1989 1970 to 1979 1960 to 1969 1950 to 1959 1940 to 1949 1939 or earlier
North County St. Louis County


North County & St. Louis County
The similarities in housing ages and structure disappear when evaluating housing values and monthly rents. As of the 2019 American Community Survey, the median value of owneroccupied housing in North County was $113,860. But it was almost $200,000 in the entire county (75% higher), which further means that the gap is even wider between North County and the rest of St. Louis County.
similarities in housing ages and structure disappear when evaluating housing values and monthly rents. As of the 2019
American Community Survey, the median value of owneroccupied housing in North County was $113,860. But it was almost $200,000 in the entire county (75% higher), which further means that the gap is even wider between North County the rest of St. Louis County.
It is something of the opposite effect, however, with monthly rents for renter-occupied housing. At a median of $986, North County’s rents are 25% higher than in the entire county.
These wide differences seem inconsistent with earlier data on household incomes, owner-occupancy rates, and shares of singlefamily vs. multi-family homes, all of which have very similar ratios in both North County and the entire County.
something of the opposite effect, however, with monthly for renter-occupied housing. At a median of $986, North County’s rents are 25% higher than in the entire county.
These wide differences seem inconsistent with earlier data on household incomes, owner occupancy rates, and shares of single family vs. multi-family homes, all of which have very similar ratios in both North County and the entire County.
$200,000
$150,000
$100,000
$50,000


Median Home Value, 2019

North County and St. Louis County
Source: U.S. Census Bureau ACS 2019
150000%
$113,860
$198,800 $-
North County St. Louis County
Median Contract Rent per Month
North County & St. Louis County
Source: U.S. Census Bureau ACS 2019
100000%
50000%
$986 $788 0%


North County St. Louis County
North County & St. Louis County
North County & St. Louis County
The ratio of median housing value to median household income in North County is 1.90, while the ratio in the entire county is 2.84, about 50% higher. While housing data and incomes seem comparable, market and other forces seem to be dampening the ability of North County homes to achieve higher values relative to incomes.
The ratio of median housing value to median household income in North County is 1.90, while the ratio in the entire county is 2.84, about 50% higher. While housing data and incomes seem comparable, market and other forces seem to be dampening the ability of North County homes to achieve higher values relative to incomes.
The ratio of median contract rents (annualized here) to median household income in North County is 0.20, almost 50% higher than for the county as a whole—the opposite of above. Even with similar housing data, rents in North County are being driven up while housing values are being driven down.
The ratio of median contract rents (annualized here) to median household income in North County is 0.20, almost 50% higher than for the county as a whole—the opposite of above.
Even with similar housing data, rents in North County are being driven up while housing values are being driven down.
0.50 1.00 1.50 2.00 2.50 3.00
North County and St. Louis County
Source: U.S. Census Bureau ACS 2019
Median Housing Value to Median Household Income
1.90

Median Housing Rent (Annualized) to Median Household Income
0.20


2.84 0.14 -

North County St. Louis County
North County & St. Louis County
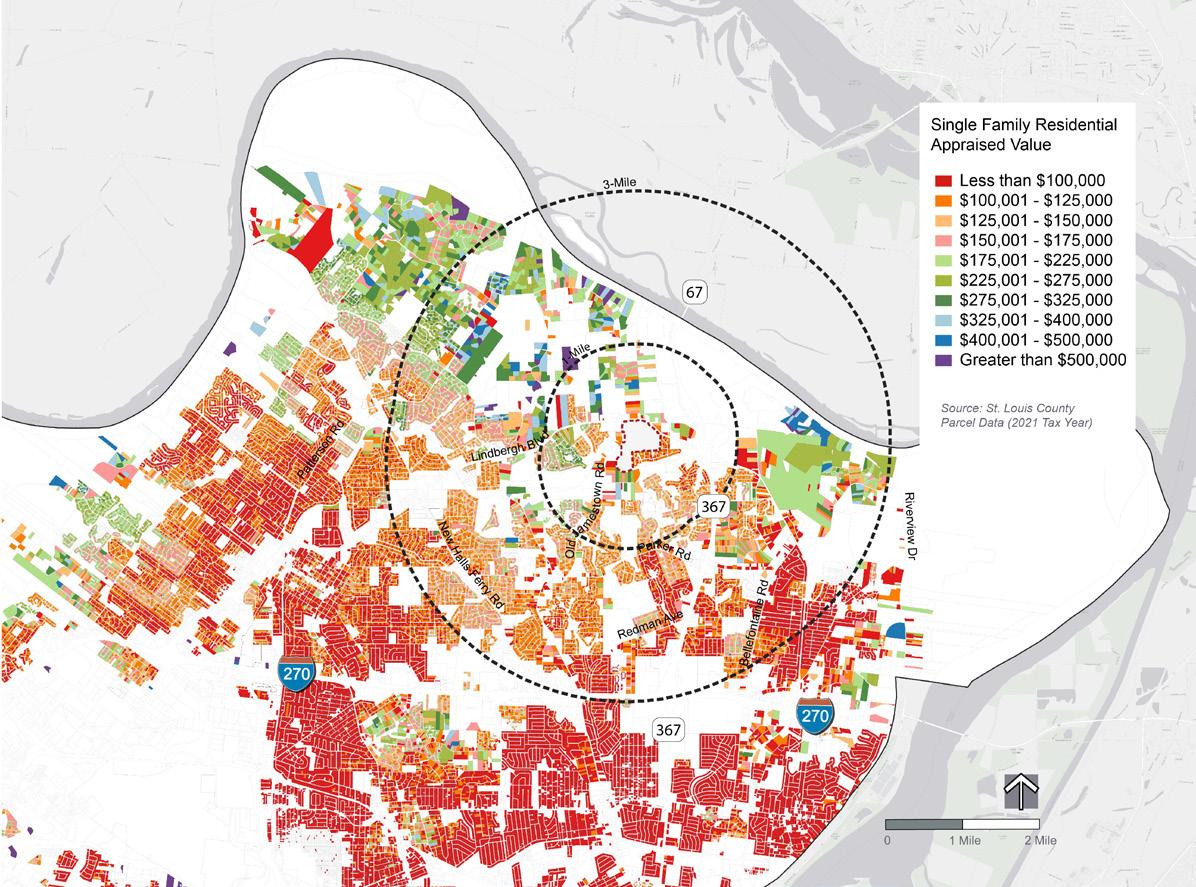
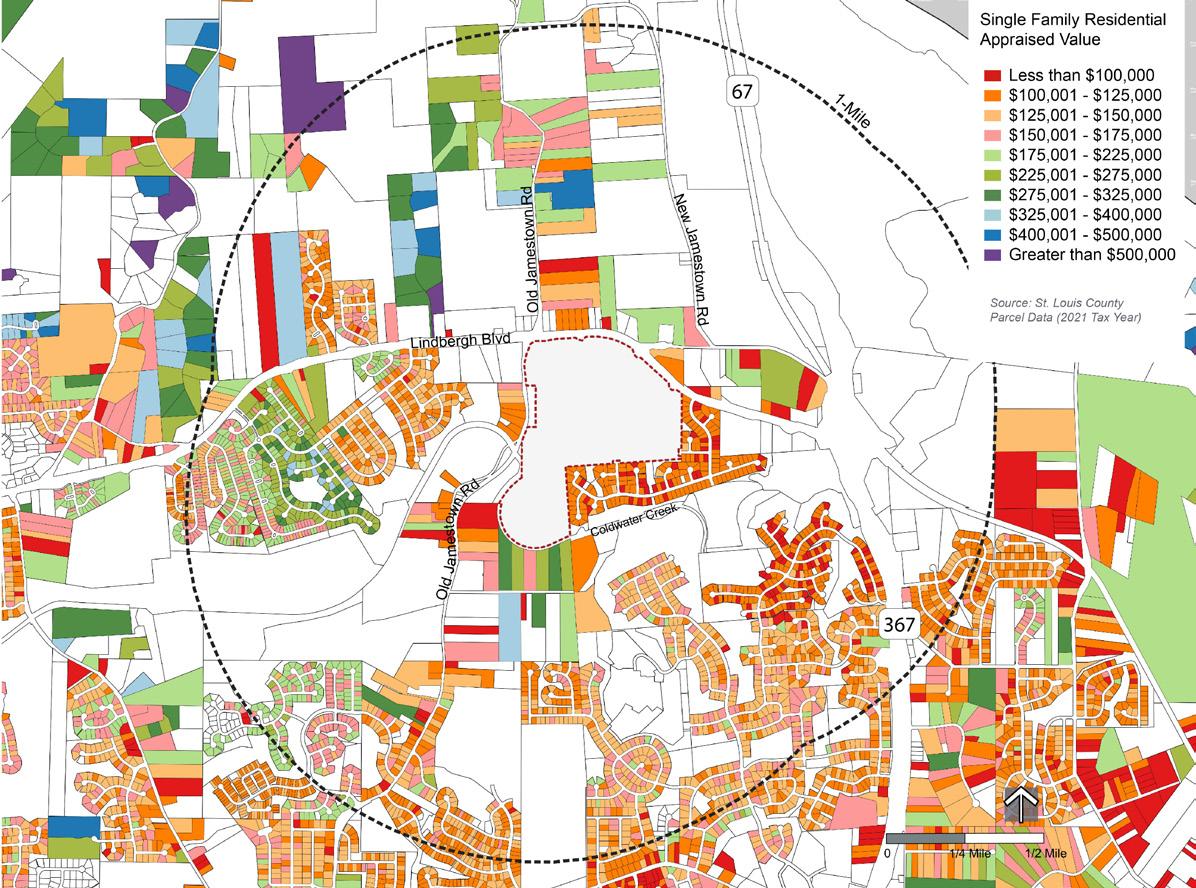
Jamestown Mall site
AGE OF SINGLE-FAMILY RESIDENTIAL (YEAR BUILT)
Homes %
2010 - Current 267 1%
1990 - 2009 4,501 11%
1970 - 1989 10,867 26%
1950 - 1969 25,382 60%
Before 1950 1,468 3%
The map on this page shows the age of single-family housing in north St. Louis County zip codes (63031, 63033, 63034, and 63138).
Almost two-thirds (63%) of singlefamily housing was built before 1970 and thus over fifty years old. Housing from this time period is concentrated in Florissant and Spanish Lake and tends to be smaller homes, frequently under 1,000 square feet.
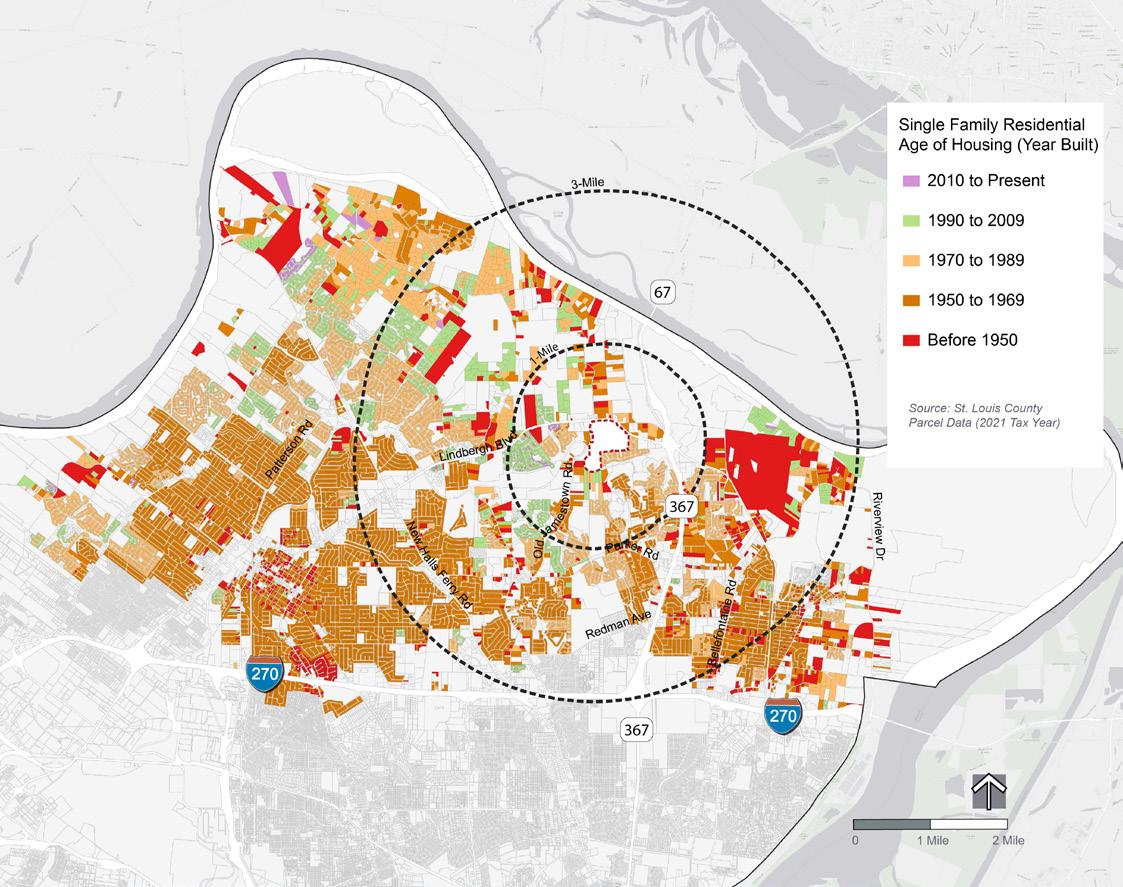
The map on this page highlights newer single-family housing (1990 to present). Newer housing is located in the northern sections of the area with several newer subdivisions within one-mile of the Jamestown Mall site.
Jamestown Mall site
Recent housing in north county has a higher valuation and larger size than the older housing. Housing built since 2010 averages over 2,400 square feet and almost $250,000 in appraised value.
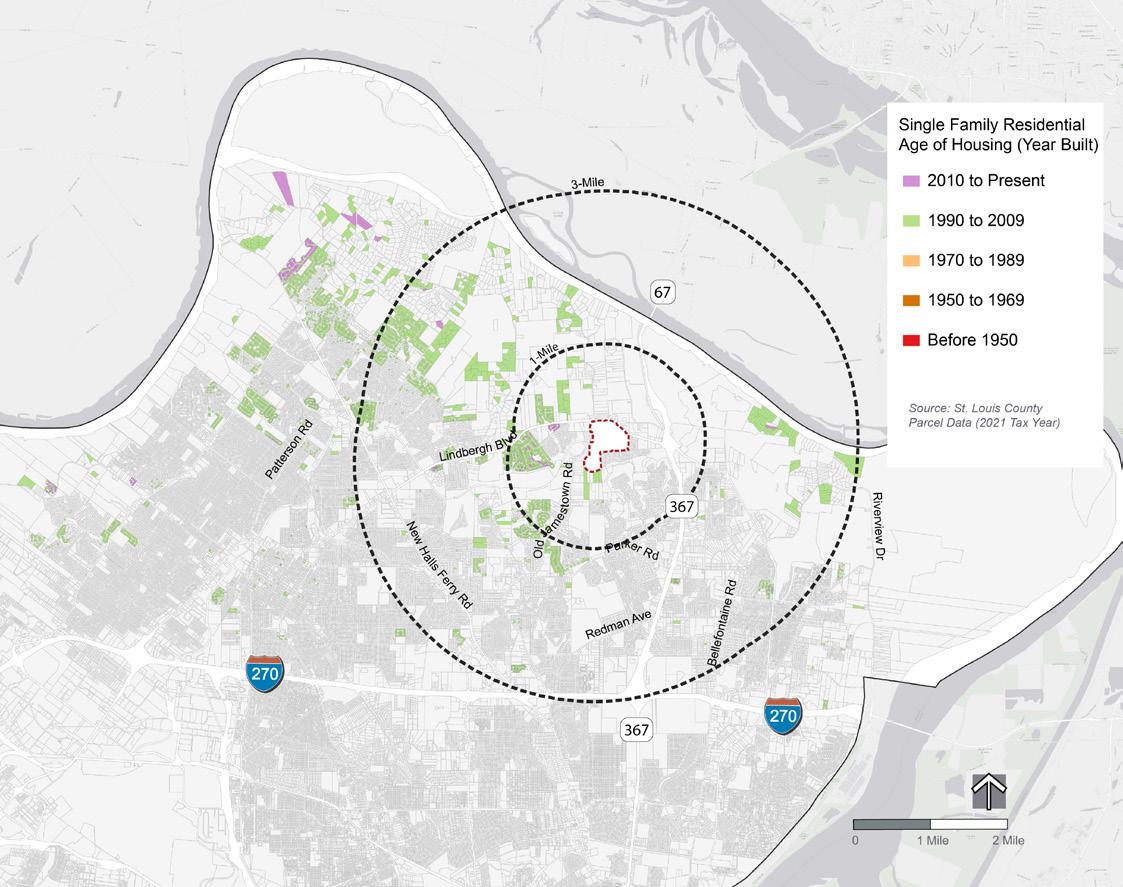
Jamestown Mall site
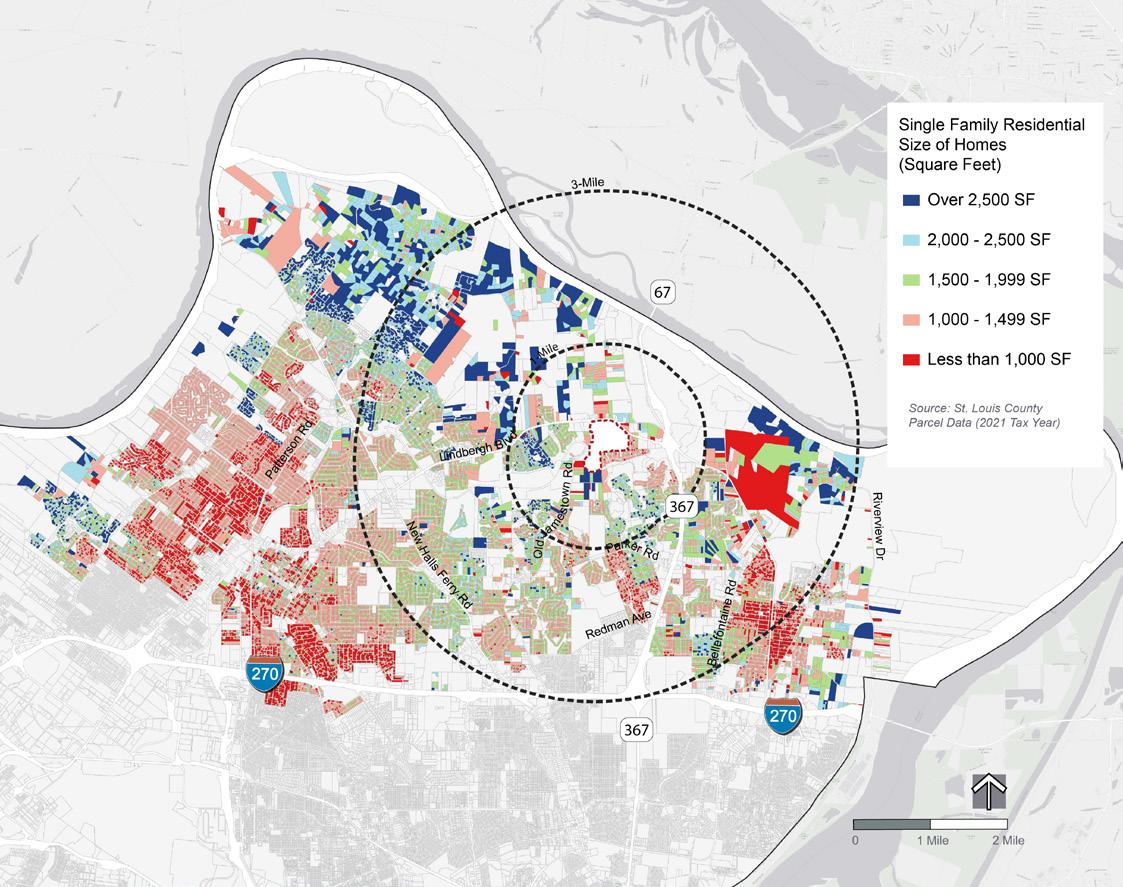
Homes %
Over 2,500 SF 2,301 5%
2,000 - 2,500 SF 3,460 8%
1,500 - 1,999 SF 9,204 22%
1,000 - 1,499 SF 20,094 47%
Less than 1,000 SF 7,277 17%
The map on this page shows the size of single-family homes in north St. Louis County zip codes (63031, 63033, 63034, and 63138).
Approximately two-thirds (64%) of single-family homes are less than 1,500 square feet. One out of every six homes is less than 1,000 square feet. These smaller homes are concentrated in Florissant and Spanish Lake and were built in the 1950s and 1960s.
Jamestown Mall site
Single-family homes within the 1-mile radius have a higher owner-occupied rate (85%) than the rest of north St. Louis County (77%).
Owner-
All North County Zip Codes 77% 23% Within 1-Mile of Jamestown Mall Site 85% 15%
(Source: 2021 St. Louis County Parcel Data)
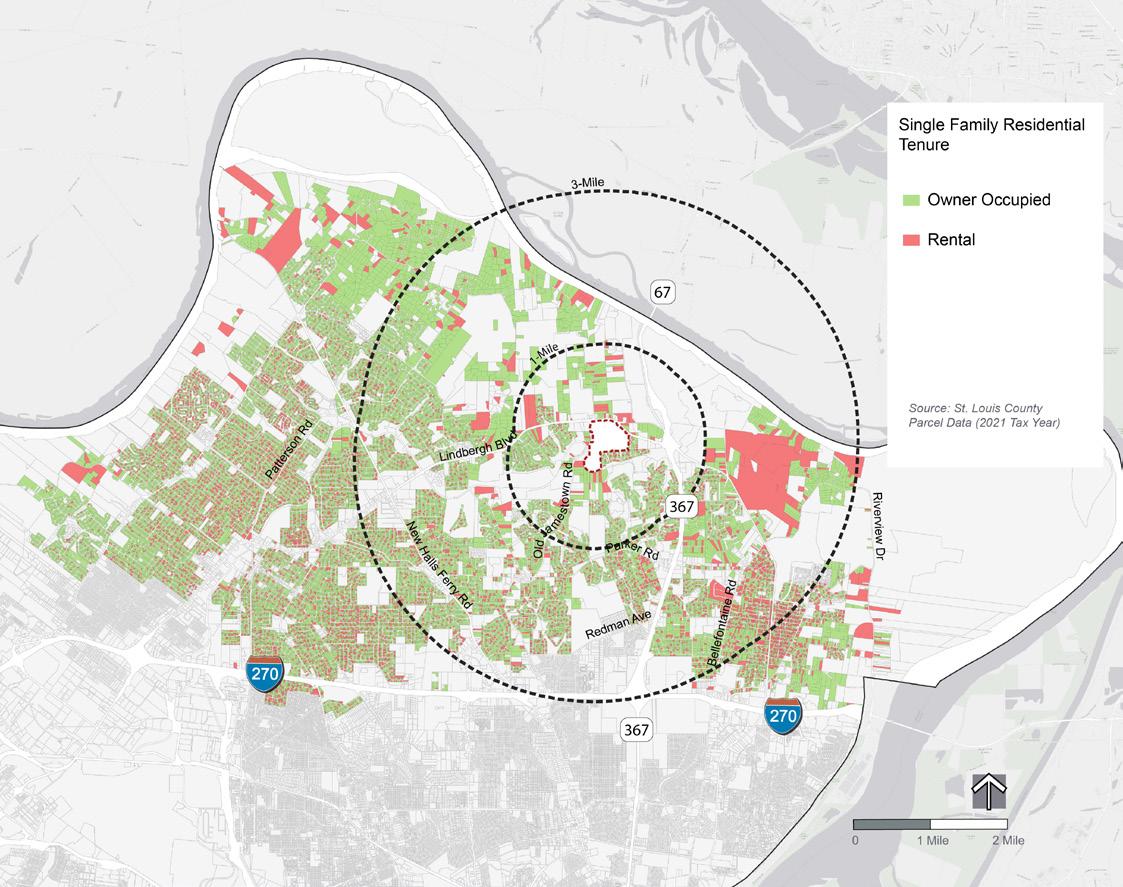
The map on this page shows the tenure of single-family housing in north St. Louis County zip codes (63031, 63033, 63034, and 63138). Tenure refers to the type of occupancy of a housing unit. All housing is “owned” by some entity. Some housing is rented to others, some is occupied by the owners.
The area closer to the Jamestown Mall site has a higher rate of home ownership than other parts of north St. Louis County.
of
(additional North County data)
OwnerOccupied Rental
Built Since 2010 89.5% 10.5%
The chart to the left shows additional tenure of single-family housing in north St. Louis County zip codes (63031, 63033, 63034, and 63138) data.
Newer and higher priced homes in north St. Louis County have a higher rate of home ownership than other singlefamily homes in north St. Louis county. Single-family homes built since 1990 have a home ownership rate of 89.7%.
Built Since 1990 89.7% 10.3%
Single-family homes appraised over $250,000 (based on 2021 tax year data) have a home ownership rate of 93.0%. The overall single-family home ownership rate in north county is 77%.
Single-family homes appraised over $250,000 93.0% 7.0%
(Source: 2021 St. Louis County Parcel Data)
Jamestown Mall site
AGE OF MULTI-FAMILY RESIDENTIAL (YEAR BUILT)
Units %
2010 - Current 210 2%
1990 - 2009 451 4% 1970 - 1989 8,176 65% 1950 - 1969 3,583 29%
Before 1950 75 1%
The map on this page shows the age of multi-family housing in north St. Louis County zip codes (63031, 63033, 63034, and 63138).
Only six percent (6%) of multifamily housing units have been built in the last thirty years. Almost two-thirds (65%) of the units were built in the 1970s and 1980s.
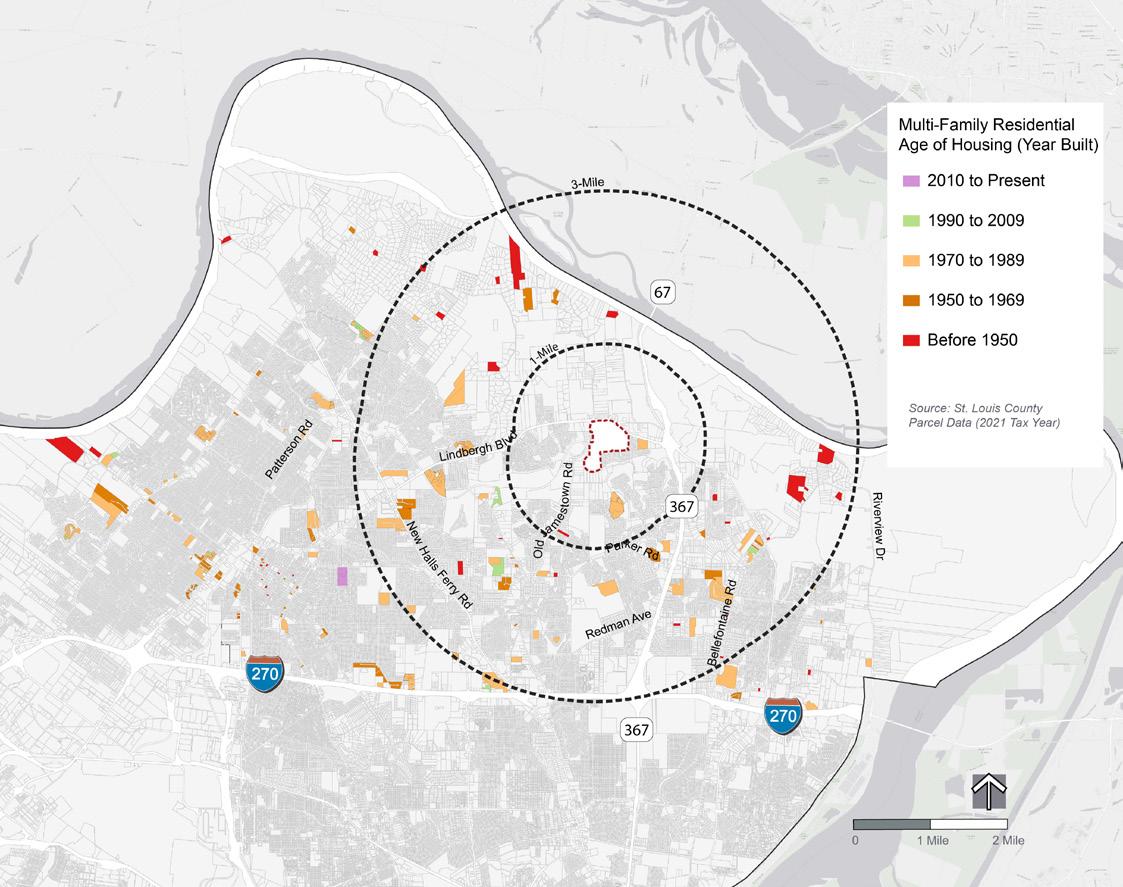
The map on this page shows the number of multi-family units per location in north St. Louis County zip codes (63031, 63033, 63034, and 63138).
Please note, locations labeled as 1-2 units may include multiple single units (condominiums, townhomes, etc.).
There are approximately 12,500 multi-family units in north St.Louis County. Almost sixty percent (58%) of units (7,252) are concentrated at 29 locations.
Two locations in Spanish Lake, Spanish Cove (787 units) and Oak Park (758 units), are two of the highest concentrations of units.
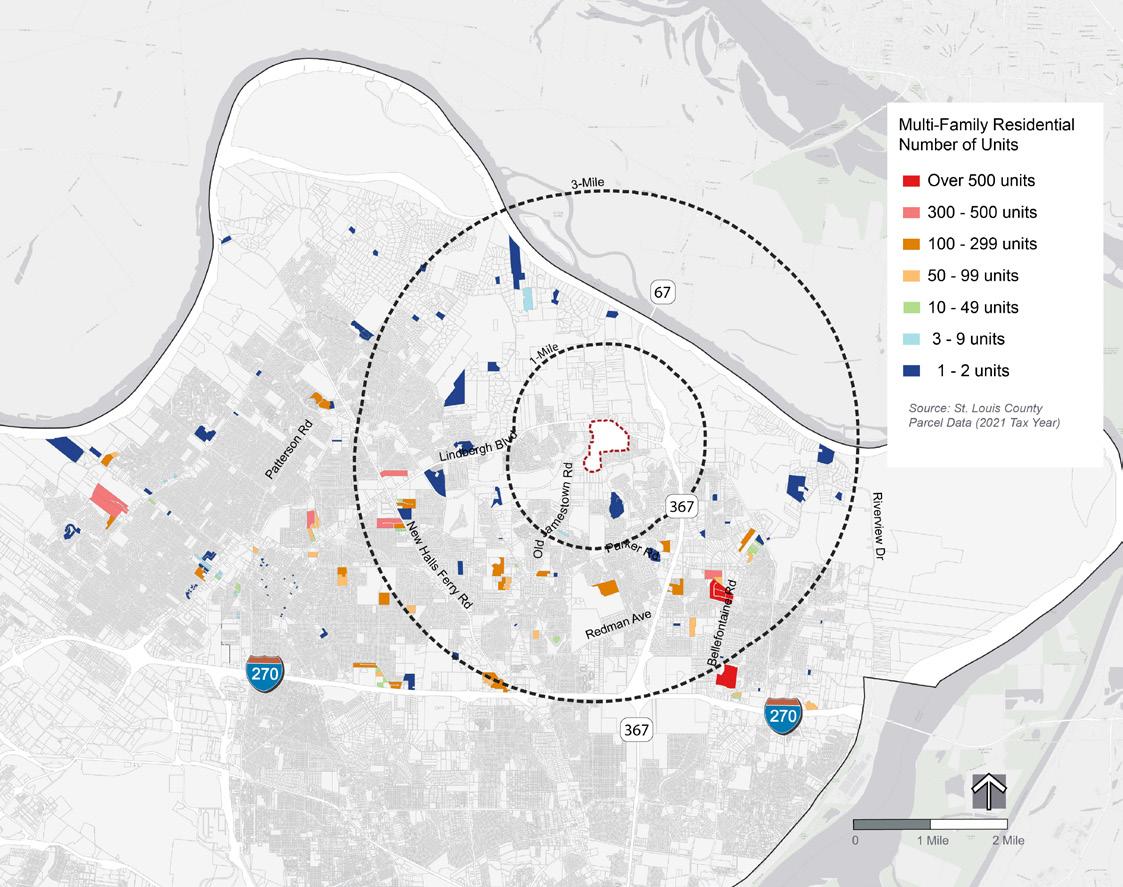
The senior population is on the rise in North County, though this growth will be concentrated in “older” seniors for the next 15 years or so. These people are part of the post-World War II Baby Boom generation. The Boomers were followed by a smaller cohort.
As time passes, Boomers who were of the “younger senior” groups (55 to 69) will be replaced by a shrinking number of younger seniors. Meanwhile, the Boomers will increase in age, boosting the number of “older seniors” (70 and above) even as younger seniors decline.
And most of these older seniors will be women.
St. Louis County as a whole also faces these important demographic changes. Facilities and services for a growing population of aging seniors will be necessary. This will include more housing options that cater to those being less mobile as well as to those becoming infirm. More leisure spaces and walking (good exercise!) trails will be in demand as the aging seniors retire from full time work.
Market-based opportunities will expand to home health care services, lower grocery demands (seniors eat less!), but higher drug store demands. Seniors are not clothing shoppers like younger generations, but they need comfortable clothes and, especially comfortable shoes. They may eat out at restaurants less often, too, but seniors also tend to eat earlier than the rest of the population for dinner. Restaurants that can accommodate early diners and later diners could enjoy more revenue. Portions would be smaller, though seniors like “doggie bags” for additional meals at home.
Along with attention to health care will be demands for attention to wellness care—staying fit to minimize chances for illness, extend life, and enhance quality of life. This should be a boon to gyms and related exercise facilities, but perhaps also for dance studios where greater socialization can accompany good exercise. Community senior centers will be necessary, as will more methods for non-driving vehicular movement, such as taxi cabs, on-demand transport, and even golf carts for short trips.
A cohort-survival method for projecting population applies an expected death rate1 to an age cohort (in this case, five-year cohorts) to estimate how many of the people in that cohort who are alive today are likely to be alive in five years.
For North County, the calculations start with the 2026 projection of population by age cohort (separately for males and females) as provided by Esri. These numbers are adjusted downward through 2036 using U.S.A. death rates by age group as of 2019 (published by Statista in 2022).
This method does not account for “move-ins” to North County, or “move-outs” by these age groups, however. For instance, if a senior housing development was built at Jamestown Mall, this might attract seniors from outside North County as well as those presently living in North County.
Such in-and-out movement might change the overall population numbers.
Esri estimates that there were 41,330 residents of North County over the age of 55 in 2021. This represented almost one-third (32.7%) of all the population in North County (126,280).
By 2026, Esri projects that the senior population will expand to 42,400, or 33.6% of the North County population. Seniors would increase by 2.6% between 2021 and 2026, while the total population would remain virtually the same (126,290).
Cohort survival projections by the Community Planning Lab indicate that North County seniors would increase by another 8.8% between 2026 and 2031, then another 7.9% between 2031 and 2036. The senior population would be about 49,790 in 2036, up from 41,330 in 2021. Separate projections of the total population to 2036 were not computed.
1) Birth rates would be applied to estimate new entrants to the population, but this analysis focuses solely on seniors, so birth rates are not applicable.
Louis County
9,000
8,000
7,000
6,000
5,000
4,000
Sources: Esri and SLU Community Planning Lab 55-59 60-64 65-69 70-74 75-79
The total senior population is projected to reach nearly 50,000 in North County by 2036, but from just over 40,000 in 2021.
3,000
2,000
Boom large in Senior will be 70 the expected number in 2036. numbers net growth surviving Baby 90 in youngest 72. 0
1,000
10,000 2010 2016 2021 2026 2031 2036
This would be a 20.5% increase in 15 years. While equivalent projections for the entire North County population are not available, U.S. Census projections indicate that America’s total population will increase at only about half that rate.
80-84 85 and Over
COMMUNITY PLANNING LAB
The aging Baby Boom generation looms large in these projections. Senior age groups that will be 70 years or older in the coming years are expected to increase in number in North County by 2036. Younger senior numbers will decline. The net effect, however, is growth in senior residents.
The oldest surviving Baby Boomers will be 90 in 2036, the youngest 72.
JAMESTOWN MALL MARKET & FEASIBILITY STUDY
The total senior population is projected to reach nearly 50,000 in North County by 2036, from just over 40,000 in 2021.
This would be a 20.5% increase in 15 years. While equivalent projections for the entire North County population are not available, U.S. Census projections indicate that America’s total population will increase at only about half that rate.
BY SEX: 2010 TO 2036 NORTH ST. LOUIS COUNTY
Populations by Sex: 2010 to 2036
County
North County outnumber the 56.8% to projected to 2036, gain a the
NORTH
North
LOUIS
Sources: Esri and SLU Community Planning Lab Females Males
While senior populations are on the rise in North County, their percentages are still lower, as a share of total population, than in the rest of St. Louis County.
In 2021, seniors made up 26.3% of the North County population, but 28.1% in the rest of the county (that is, excluding North County).
By 2026, the share of seniors in the county will generally increase, but North County will still have a slightly smaller percentage than the rest of the county.
JAMESTOWN MALL MARKET & FEASIBILITY STUDY UNIVERSITY COMMUNITY PLANNING LAB
SAINT LOUIS UNIVERSITY COMMUNITY PLANNING LAB
Senior women in North County already greatly outnumber the men by a ratio of 56.8% to 43.2% as of 2021.
This ratio is not projected to change substantially by 2036, although the men will gain a slightly larger share of the senior population.
JAMESTOWN MALL MARKET & FEASIBILITY STUDY
While senior populations are on the rise in North County, their percentages are still lower, as a share of total population, than in the rest of St. Louis County.
In 2021, seniors made up 26.3% of the North County population, but 28.1% in the rest of the county (that is, excluding North County).
By 2026, the share of seniors in the county will generally increase, but North County will still have a slightly smaller percentage than the rest of the county.
Section Sources
St. Louis Market Reports | Newmark Zimmer | Commercial Real Estate (nmrkzimmer.com)
Market Overview -Gershman Commercial Real Estate
St. Louis Office Insight | Q4 2021 | JLL Research
St. Louis Industrial Insight | Q4 2021 | JLL Research
St. Louis Retail Insight | Q4 2021 | JLL Research
This section evaluates recent non-residential development trends in several subregions of the St. Louis metropolitan area using available data from three large real estate brokerage and development companies: Newmark Zimmer (NZ), Gershman Commercial Real Estate, and Jones Lang LaSalle (JLL).
All three produce quarterly “market reports,” available publicly, on recent trends in the office and industrial real estate markets. Newmark Zimmer and Cushman also produce quarterly reports on retail real estate.
The information is based on inventories of buildings and floor areas, as well as recent construction and vacancy rates, in these three major sectors. Each company presents data for a variety of sub-regions of the “core” of the St. Louis area, though only Newmark Zimmer provides a map of those regions—and then only for the retail sector. Sub-regions also have different definitions from company to company and from sector to sector within companies.
For instance, “North County” is not necessarily the same geographic boundary in each company, nor is “North County” for the office market the same as for the industrial market. Moreover, the inventories of buildings and floor area are not consistent between companies; they each have their own databases of major properties.
The inventories, while large, are not necessarily all-inclusive. Very small buildings are often left out, as are buildings that are fully owner-occupied. Owner-occupied buildings are not “in the market” for tenants and lessees. Thus, they are often off the radar and databases of commercial real estate brokerages.
Nevertheless, the information provides insights into the scale and growth of real estate structures and space from three perspectives.
OFFICE
Zimmer and data on regional than 200 class of regionally
and data on regional 200 of regionally
Number of Office Buildings, 2021 Q4
Number of Office Buildings, 2021 Q4
- 200 400 600 800 1,000


Total St. Louis Area Class A Class B Class C North County Class A Class B Class C
661 184 346 131 46 10 19 17
Pct of All Office Buildings, 2021 Q4
- 200 400 600 800 1,000 Total St. Louis Area Class A Class B Class C North County Class A Class B Class C
884
884 217 493 174 89 20 42 27
Pct of All Office Buildings, 2021 Q4 Newmark Zimmer
0% 20% 40% 60% Class A Class B Class C North County Class A Class B Class C
Only Newmark Zimmer and Gershman provide data on the number of office buildings. NZ’s regional inventory is more than 200 more buildings than Gershman’s. And NZ’s numbers for each class of office building exceed Gershman both regionally and in what each calls North County.
0% 20% 40% 60% Class A Class B Class C North County Class A Class B Class C
27.8% 52.3% 19.8% 7.0% 21.7% 41.3% 37.0%
55.8% 52.3%
Newmark Zimmer Gershman
24.5% 55.8% 19.7% 10.1% 22.5% 47.2% 30.3%
Newmark Zimmer Gershman make up about a quarter of the regional inventory in both cases, Class B a little over half, and the North County accounts for 10.1% of NZ’s overall inventory, compared to just 7.0% for space makes up a much larger share of the North County inventory than in the regional totals, have smaller shares of North County than regionally.
Newmark Zimmer up about a quarter of the regional inventory in both cases, Class B a little over half, and the North County accounts for 10.1% of NZ’s overall inventory, compared to just 7.0% for space makes up a much larger share of the North County inventory than in the regional totals, have smaller shares of North County than regionally.
Class A buildings make up about a quarter of the regional inventory in both cases, Class B a little over half, and the rest in Class C space. North County accounts for 10.1% of NZ’s overall inventory, compared to just 7.0% for Gershman. Class C space makes up a much larger share of the North County inventory than in the regional totals, while Classes A and B have smaller shares of North County than regionally.
The average number of office building square feet in North County, according to the two sources that track this information, is quite similar to the St. Louis area average. This is true for all the classes of office space. This helps to signify North County as an important office market in terms of scale and availability of space.
It would appear that the type or quality of office space (the three classes) is not necessarily a determinant of the size of the office buildings.
0 50,000 100,000 150,000 200,000


StL AREA Class A Class B Class C

NORTH CO. Class A Class B Class C
84,600 90,100
81,500 81,000
Office vacancy rates in metro St. Louis are historically high. Generally speaking, rates above about ten percent indicate a market that will not demand more office space.
As of the end of 2021, the three real estate firms highlighted here show that office vacancies average between 13 and 16 percent regionally, but worse in North County, ranging from 14 to 27 percent.
Class A space—the most preferred and highest valued space—has particularly high vacancy rates exceeding the regional averages (ranging from 16 to 18 percent). North County, too, has higher vacancy rates for Class A space than for the entire inventory except for the JLL inventory.
Class B and Class C space in the region have relatively low vacancy rates, suggesting possible markets for more of those classes. But even this message is mixed and will not likely induce added development, particularly in North County. The Covid-19 pandemic-induced “work from home” policies have exacerbated these vacancy rates. It is still rather early in the post-pandemic period to anticipate more office occupancy. Indeed, indicators suggest the opposite for a few years.
StL AREA Class A Class B Class C NORTH CO. Class A Class B Class C

Office Vacancy Rates, 2021 Q4
0% 10% 20% 30% 40%
Office Generally a As highlighted between County, Class space regional County, for
Class B and Class C space in the region have relatively of those classes. But even this message is mixed and will North County. The Covid-19 pandemic-induced “work rates. It is still rather early in the post-pandemic period suggest the opposite for a few years.
2021 was not a good year for occupancy of office space in greater St. Louis—a phenomenon nationwide if not also internationally. Covid-19 pandemic-driven policies on work-at-home actually reduced the needfor office space, though most of it stayed under lease and had to be paid for even if not fully used on a daily basis. But there certainly wasn’t going to be a great deal of demand for more office or more occupancy of existing space.
Estimates range widely about absorption, however. NZ estimated a net negative absorption of over a million square feet for the year, most of that in Class A space, the bulk of that in Mid-County and Downtown St. Louis.
The other two real estate firms detected much less negative absorption. But there were generally negative patterns or no significant growth in space occupancy in 2021. These observations reinforce the high vacancy rates in the region. Office space demand has fallen dramatically. There are still no reliable indicators that demand will re-emerge strongly in light of fundamental changes taking place in the office industry where many workers prefer working at home or otherwise remotely.
Absorption of Office Space, 2021 Annual (square feet)
-1,200,000 -800,000 -400,000 0
StL AREA Class A Class B Class C NORTH CO.
Class A Class B Class C
Zimmer Gershman JLL
2021 greater internationally. work though even wasn’t or Estimates estimated square bulk
The negative absorption. But there were generally negative 2021. These observations reinforce the high vacancy dramatically. There are still no reliable indicators that changes taking place in the office industry where many
“Asking Rents” are the annual per-square-foot dollar amounts advertised for available office space. They not be the ultimately negotiated rents, but their relationships are important for comparing market subregions. County’s asking rents are around $1.50 to $2.00 than the regional averages. These differences are generally triggered by a number of factors including quality space, lower land values enabling lower building rents, and diminished demand. Lower rents also challenge building owners with regard to maintenance and capital improvements. Lower rents lower cash flow to support building improvements.
“Asking Rents” are the annual per-square-foot dollar amounts advertised for available office space. They may not be the ultimately negotiated rents, but their relationships are important for comparing market sub-regions.
North County’s asking rents are around $1.50 to $2.00 less than the regional averages. These differences are generally triggered by a number of factors including lesser quality space, lower land values enabling lower building rents, and diminished demand. Lower rents can also challenge building owners with regard to maintenance and capital improvements. Lower rents mean lower cash flow to support building improvements.
Only one of the three real estate companies record the number of industrial buildings in their portfolios, so that data is ignored in this industrial section.
Only one of the three real estate companies record the number of industrial buildings in their portfolios, so that data is ignored in this industrial section.
Newmark Zimmer monitors 280.2 million square feet of industrial space in the region, Gershman 314.2 million, and JLL 225.4 million. Note that these inventories are four to six times the amount of office space in the region.
Newmark Zimmer monitors 280.2 million square feet of industrial space in the region, Gershman 314.2 million, and JLL 225.4 million. Note that these inventories are four to six times the amount of office space in the region.
Almost 20 percent of NZ’s industrial inventory is in North County— some 55 million square feet. But only 3.3% of Gershman’s inventory is in North County and even less, 2.5%, of JLL’s inventory is in North County. It is rational to conclude, therefore, that the subsequent industrial space data for North County is most reliable using the Newmark Zimmer information. NZ’s “sample size” is much bigger.
Almost 20 percent of NZ’s industrial inventory is in North County—some 55 million square feet. But only 3.3% of Gershman’s inventory is in North County and even less, 2.5%, of JLL’s inventory is in North County. It is rational to conclude, therefore, that the subsequent industrial space data for North County is most reliable using the Newmark Zimmer information. NZ’s “sample size” is much bigger.
Number of Industrial Square Feet 2021 Q4 (millions)

0 100 200 300 400 St. Louis Area North County
280.2 55.1
314.2 10.5
225.4 5.5


(19.7%) (3.3%) (2.4%)
Newmark Zimmer Gershman JLL
Industrial development became a darling of real estate development after the Great Recession of 2008-10. Recent vacancy rates (end of 2021) indicate this could still be the case in metropolitan St. Louis and even North County.
A ten percent vacancy rate is often a key threshold. Below that, construction is most often financially warranted. Above ten percent, construction halts. The three inventories discussed here show vacancy rates of between three and four percent regionally, somewhat higher in North County. But even North County is still well below ten percent.
Interviews and news articles support these vacancy indicators. There is simply not enough industrial space, particularly in large buildings, in the metropolitan area given the growth of the onshore manufacturing, warehousing, and distribution sectors.
Louis Area North County


Industrial development Recent still County. A ten Below warranted. three between higher well Interviews indicators. particularly given warehousing,


Two of the three inventories tracked absorption of industrial space for the entire calendar year of 2021. Newmark Zimmer notes that just over eight million square feet was absorbed into the market in 2021 while JLL tracked almost six million square feet. In both cases, however, the added numbers were very small percentages of the year-end overall inventories. And, as noted earlier, vacancy rates stayed quite low.
North County is a little more robust. While the amount of absorbed space is lower than the region, that space represents much higher percentages of year-end inventories. This suggests that North County has been a key target of recent construction and leasing. This might also help explain why vacancy rates in North County are a little bit higher than the regional average.
Two industrial Newmark square JLL however, percentages noted North of absorbed represents inventories. key might County

“Asking Rents” are the annual per-square-foot dollar amounts advertised for available industrial space. They may not be the ultimately negotiated rents, but their relationships are important for comparing market sub-regions.
Regionally, asking rents are above $5.00 per square foot per year, historically high values. The low vacancy rates reflect this demand-supply relationship. Rents are generally lower in North County, but still well above $4.00 per square foot. JLL’s North County inventory, however, averages much higher rents than even the regional average at over $5.50. On that basis, North County is a popular market right now and could readily justify a lot more industrial construction. Newmark Zimmer and Gershman’s numbers dampen that popularity somewhat, but it nevertheless shows that North County could support more industrial buildings if there is land to accommodate them.
Industrial Space Asking Rents, 2021 Q4 (dollars per square foot)
$0.00 $1.00 $2.00 $3.00 $4.00 $5.00 $6.00
St. Louis Area
North County
Newmark Zimmer
Gershman
JLL


$5.02 $4.72
$5.09 $4.35
$5.25 $5.57
“Asking amounts may relationships regions. Regionally, per year, reflect generally $4.00 however, regional County justify Zimmer popularity North there
SAINT LOUIS UNIVERSITY COMMUNITY PLANNING LAB


Only Newmark Zimmer and Gershman provide data on the number of retail buildings. And only NZ separately tracks what it calls small shops from big box stores.
Only Newmark Zimmer and Gershman provide data on the number of retail buildings. And only NZ separately tracks what it calls small shops from big box stores.
NZ’s regional inventory is almost 12,500 retail buildings, about six percent more buildings than tracked by Gershman. Seven out of ten of NZ’s buildings are small shops while almost 30 percent are big boxes.
NZ’s regional inventory is almost 12,500 retail buildings, about six percent more buildings than tracked by Gershman. Seven out of ten of NZ’s buildings are small shops while almost 30 percent are big boxes.
The two companies track virtually the same number of retail buildings in North County, though North County makes up a larger share of Gershman’s inventory than of NZ’s inventory—13.9% vs. 13.1%.
The two companies track virtually the same number of retail buildings in North County, though North County makes up a larger share of Gershman’s inventory than of NZ’s inventory—13.9% vs. 13.1%.
Small shops and big boxes in North County make up the same shares of NZ’s overall inventory. While North County contains 13.1% of NZ’s retail buildings, small shop buildings make up 13.0% of all small shops, and North County big boxes make up 13.2% of all big box stores.
Small shops and big boxes in North County make up the same shares of NZ’s overall inventory. While North County contains 13.1% of NZ’s retail buildings, small shop buildings make up 13.0% of all small shops and North County big boxes make up 13.2% of all big box stores.
- 5,000 10,000 15,000
12,485 8,920 3,565 1,632 1,161 471
11,734 1,633
Newmark Zimmer Gershman
Newmark Zimmer tracks about four percent more retail square feet than Gershman in the St. Louis area—163.5 million to 156.5 million square feet. Even though NZ shows 2½ times more small shop buildings than big boxes, big boxes contain 3.7 times more square feet!
Newmark Zimmer tracks about four percent more retail square feet than Gershman in the St. Louis area—163.5 million to 156.5 million square feet. Even though NZ shows 2½ times more small shop buildings than big boxes, big boxes contain 3.7 times more square feet!
Gershman’s North County inventory of retail square feet is identical to NZ’s inventory at 22.5 million. Big box square feet in North County, at 18.3 million, represents 81% of the North County inventory of NZ, and is 4¼ times the amount of small shop square feet—a notably higher ratio than for the region as a whole.
Gershman’s North County inventory of retail square feet is identical to NZ’s inventory at 22.5 million. Big box square feet in North County, at 18.3 million, represents 81% of the North County inventory of NZ, and is 4¼ times the amount of small shop square feet—a notably higher ratio than for the region as a whole.
It is very clear that big box stores, as defined by both Newmark Zimmer, dominate the retail square feet market, particularly in North County, even though small shops dominate the number of individual buildings. Newmark Zimmer, however, does not provide a definition or a minimum size for a “big box” building.
It is very clear that big box stores, as defined by both Newmark Zimmer, dominate the retail square feet market, particularly in North County, even though small shops dominate the number of individual buildings. Newmark Zimmer, however, does not provide a definition or a minimum size for a “big box” building.
Newmark Zimmer Gershman
That said, the average “big box” retail building in greater St. Louis has just 36,200 square feet, or a bit more (38,800) in North County. Such stores, therefore, are not all in the 75,000 square foot or larger ranges like most of the big box stores that capture greater attention, such as Wal-Mart, Target, or Home Depot.
That said, the average “big box” retail building in greater St. Louis has just 36,200 square feet, or a bit more (38,800) in North County. Such stores, therefore, are not all in the 75,000 square foot or larger ranges like most of the big box stores that capture greater attention, such as Wal-Mart, Target, or Home Depot.
Small shops, on the other hand, average less than 4,000 square feet per building, around ten percent the size of the average big box store. That is, big boxes tend to be about ten times larger than small shops.
Small shops, on the other hand, average less than 4,000 square feet per building, around ten percent the size of the average big box store. That is, big boxes tend to be about ten times larger than small shops.
Therein possibly lies a major impediment for small shops and the creation or renovation of “walkable, experiential” retail centers. A big box store can dominate a site and come under the management of a single entity. A similar amount of small shop space requires many more buildings and individual businesses with, consequently, many more management challenges.
Therein possibly lies a major impediment for small shops and the creation or renovation of “walkable, experiential” retail centers. A big box store can dominate a site and come under the management of a single entity. A similar amount of small shop space requires many more buildings and individual businesses with, consequently, many more management challenges.
0 10,000 20,000 30,000 40,000 50,000
13,100 3,900 36,200 13,800 3,700 38,800
13,400 13,800
Retail space vacancy rates in metro St. Louis are fairly low, using the Newmark Zimmer data, but a bit higher using the Gershman data. Generally speaking, rates above about ten percent indicate a market that will not demand more retail space. The regional and some North County data indicate vacancy rates well below ten percent.
Of particular note and contrast is that NZ reports vacancies in North County at 6.6%, a fairly healthy number, while Gershman report North County vacancies at over 12%. Clearly, the two companies are working with different inventories, but NZ further notes that big box vacancies in North County are much higher than small shop vacancies. While a similar breakdown is not available from Gershman, it might be assumed that its high vacancy rate is attributable to some challenges in the big box category.
Still, vacancies seem to be falling into a range where more population and buying power growth will require more retail space.
Retail using Gershman percent space. vacancy Of particular in North Gershman Clearly, inventories, North While it might attributable Still, vacancies population retail


Only Newmark Zimmer provides information on annual absorption of retail space into the market for 2021. The numbers aren’t remarkable—just 275,500 absorbed space—other than this occurred in a year heavily influenced by the Covid-19 pandemic with struggling retailers. Almost all of this regional space, intriguingly, is recorded in small shops, suggesting that those retailers hardest hit by pandemic constraints are recovering.
It’s a different story in North County, however. While North County experienced net growth in occupied retail space in 2021, it was all in big box stores. Small shop occupancy actually declined by 11,500 square feet. Again, big boxes seem to have a very dominant position in North County.
“Asking Rents” are the annual per-square-foot dollar amounts advertised for available office space. They may not be the ultimately negotiated rents, but their relationships are important for comparing market subregions.
“Asking Rents” are the annual per-square-foot dollar amounts advertised for available office space. They may not be the ultimately negotiated rents, but their relationships are important for comparing market sub-regions.
North County’s asking rents for retail space are around $3.00 to $3.50 less than the regional averages. Such differences are typically triggered by a number of factors including lesser quality space, lower land values enabling lower building rents, and diminished demand (or consumer buying power). Lower rents can also challenge building owners with regard to maintenance and capital improvements. Lower rents mean lower cash flow to support building improvements.
Retail Space Asking Rents, 2021 Q4 (dollars per square foot)
STL AREA Small Shop Big Box
That said, small shop rents of almost $15.00 in North County and over $18.00 in the region suggest relatively strong markets generating rental income that supports substantial reinvestment capacity among building owners.
North County’s asking rents for retail space are around $3.00 to $3.50 less than the regional averages. Such differences are typically triggered by a number of factors including lesser quality space, lower land values enabling lower building rents, and diminished demand (or consumer buying power). Lower rents can also challenge building owners with regard to maintenance and capital improvements. Lower rents mean lower cash flow to support building improvements.
That said, small shop rents of almost $15.00 in North County and over $18.00 in the region suggest relatively strong markets generating rental income that supports substantial reinvestment capacity among building owners.


NORTH CO. Small Shop Big Box

Jamestown Mall was conceived in the late 1960s and opened in 1973 as a regional shopping mall of about one million square feet. It was ahead of its time while anticipating continued suburban expansion northward in St. Louis County. Ultimately, however, it failed as a regional mall. Several key factors contributed to this failure.
• A great deal of housing potential was eliminated when St. Louis County authorities prohibited further development immediately north of the mall across U.S. 67/ Lindbergh Boulevard. The earth in that area remains too unstable as Karst topography (sinkholes) influenced by the geology of the Mississippi and Missouri Rivers. Typical suburban scale densities cannot be supported. A huge potential market for shopping at Jamestown did not materialize.
• Like most of its predecessors in metro St. Louis, Jamestown Mall was located along a major arterial road Lindbergh Boulevard or U.S. Route 67. The American and St. Louis transportation landscape was changing quickly in the 1970s, however, with the expansion of the interstate highway network. Formerly successful regional shopping centers on arterial roads in St. Louis County have disappeared, such as Crestwood Plaza, Northwest Plaza, and smaller, earlier examples like Northland and River Roads. The latter three, by the way, were also in North County.
• The fewer regional malls that remain in greater St. Louis today are located at interchanges of the interstate system. Think of the Galleria (I 64 and I 170), West County Center (I 270), South County Center (I 55 and I 270), St. Clair Square (I64), and Mid Rivers Mall (I 70). Chesterfield Mall was also an early location on U.S. Route 40, not then an interstate, but it became I 64. But Chesterfield has been pre-empted by the massive shift in retailing that took place in Chesterfield Valley, an alternative to enclosed malls. The only regional mall (technically named) in the region not on an interstate highway is Alton Square, though it is a much smaller version of what it was intended to be.
It is valuable to recognize major shifts in retailing that have effectively replaced regional, especially indoor, malls. It’s not that St. Louisans or Americans don’t want large concentrations of very attractive places to shop and dine. Chesterfield Valley is perhaps the biggest example of these changes, driven in no small way by the proliferation and success of “big box stores.” Lindbergh Boulevard in Florissant is also a large concentration of retailing. While the likes of Macy’s and Dillard’s were also big boxes of their own kind and were “category killers” in their day, Walmart, Target, Home Depot, and related big boxes of today have not found it suitable to be part of indoor malls. Yet they prosper, many of them also at interstate highway locations like I 44 in Kirkwood or I 64 in Richmond Heights and Brentwood. Even I 270 in North County has its share of today’s big boxes, a force which also doomed Jamestown Mall.
A lesson here is not that the Jamestown Mall site is doomed. It is that brick and mortar, regional scale retailing has shifted dramatically. This is exacerbated somewhat by online e-commerce (Amazon and many others), though mail order and phone order retailing has been a phenomenon in America since the late 19 th Century with the likes of Sears, Roebuck and Montgomery Ward. This manner of shopping, in other words, is not entirely new, though its share of retailing has expanded in the last couple of decades now approaching 15 percent of all retail sales (see graph on next page).
An observation of this analysis, therefore, is that retailing will not likely be a major future component of the Jamestown Mall site. More population would be needed along with its buying power. A highway network directly serving Jamestown would be needed.


E-commerce in the United States is growing, though hardly dominant in retailing. The pandemic hurried the shift which has been underway for a long time. The blue line is the actual experience of e-commerce in the U.S.


POPULATION ESTIMATES: 2021 Esri is the source of the following graphs and analysis. With the 1 -3-5 mile data all from Esri, there is a consistency in the comparisons. The black line on the graph below shows the population within five miles of Jamestown Mall. Interestingly, it is higher than three others, including Chesterfield Mall. But Chesterfield, now with retail dominating in the Valley, benefits immensely from being located on the metro area’s “main street” of I-64/US40.
2021 Population 1-3-5 Miles: Jamestown Mall and Other Mall Sites

Source: Esri Business Analyst 1-Mile Radius 3-Mile Radius 5-Mile Radius

Esri is the source of the following graphs and analysis. With the 1-3-5 mile data all from Esri, there is a consistency in the comparisons. The black line on the graph below shows the population within five miles of Jamestown Mall. Interestingly, it is higher than three others, including Chesterfield Mall. But Chesterfield, now with retail dominating in the Valley, benefits immensely from being located on the metro area’s “main street” of I 64/US40.
HOUSEHOLD ESTIMATES: 2021 Households show a similar pattern. Households are occupied housing units. Retailers love to count households (or “rooftops” in the vernacular). Households tend to be a more reliable gauge of buying power than population. This could be one reason why St. Clair Square continues to thrive. Its household numbers compare better than its population numbers. Still, Jamestown is a relatively small market without the benefit of, for instance, I-64 serving Chesterfield Valley, let alone also serving the Galleria.
Households show a similar pattern. Households are occupied housing units. Retailers love to count households (or “rooftops” in the vernacular). Households tend to be a more reliable gauge of buying power than population. This could be one reason why St. Clair Square continues to thrive. Its household numbers compare better than its population numbers. Still, Jamestown is a relatively small market without the benefit of, for instance, I 64 serving Chesterfield Valley, let alone also serving the Galleria.
and Other Mall
$62,407 $77,484

Per capita income is an average, or the total amount of personal income in an area divided by the population. Unfortunately, Jamestown begins to lose some edge here. While the Chesterfield area doesn’t command as large a population or household base, it is as said before well located on the metro area’s “main street” and its individual per capita income power is right up there with the Galleria and West County Center.
$70,286 $78,193 $62,236 $33,823 $33,940 $34,634 $24,922 $30,418 $58,755 $64,606 $68,564 $36,484 $39,240 $39,113 $30,693 $27,450 $49,248 $60,980 $63,318 $37,590 $40,099 $35,919 $31,375

Per capita income is an average, or the total amount of personal income in an area divided by the population. Unfortunately, Jamestown begins to lose some edge here. While the Chesterfield area doesn’t command as large a population or household base, it is as said before well located on the metro area’s “main street” and its individual per capita income power is right up there with the Galleria and West County Center.

Multiplying per capita income by the population yields aggregate income, here displayed in millions of dollars. By definition, regional malls draw from larger geographic areas. Not surprisingly, the largest areas shown here five miles in radius display rather high total income. That is, a lot of buying power within an easy drive. Jamestown, Alton, and St. Clair do not quite reach the levels of the others. And none of the areas can rely on the one mile areas for regional support.


TRADE DEMAND AND SUPPLY GAP: 2017


Oddly, the Esri retail trade data still relies on research from 2017, even though its population and income numbers are estimated for 2021. Still, this is a consistent comparison across the several locations. In all but one instance, retail sales (from all stores, not just malls) in the areas exceed retail demand generated in those areas. They all benefit, that is, from shoppers further outside the radii. In effect, no more stores are warranted. The only (tiny) exception is the one-mile area at Jamestown.
Oddly, the Esri retail trade data still relies on research from 2017, even though its population and income numbers are estimated for 2021. Still, this is a consistent comparison across the several locations. In all but one instance, retail sales (from all stores, not just malls) in the areas exceed retail demand generated in those areas. They all benefit, that is, from shoppers further outside the radii. In effect, no more stores are warranted. The only (tiny) exception is the one mile area at Jamestown.
Keep in mind, of course, that, in Jamestown Mall’s case, retailing is quite heavily dominated by the City of Florissant, and most of that is along Lindbergh Boulevard not far west of Jamestown. This concentration of retail spreads further into Hazelwood along Lindbergh and is certainly reinforced here and there along I 270. Florissant benefits from about twice as much retail sales than its own population can support. Much of North County is dependent, therefore, on the many convenient retail offerings of Florissant and Lindbergh Boulevard, but none of those offerings are in regional malls.


Much the same is true for the food and drink markets (restaurants and bars, not food and drink at home). These areas that are centered on regional malls have no economic need for additional places to eat and drink. An important exception, though at a relatively small scale, is Jamestown Mall. All three radii could support more dining and drinking experiences. As it is, some of the demand from this area must now spend its money outside the radii.
Much the same is true for the food and drink markets (restaurants and bars, not food and drink at home). These areas that are centered on regional malls have no economic need for additional places to eat and drink. An important exception, though at a relatively small scale, is Jamestown Mall. All three radii could support more dining and drinking experiences. As it is, some of the demand from this area must now spend its money outside the radii.
OPTIONS.
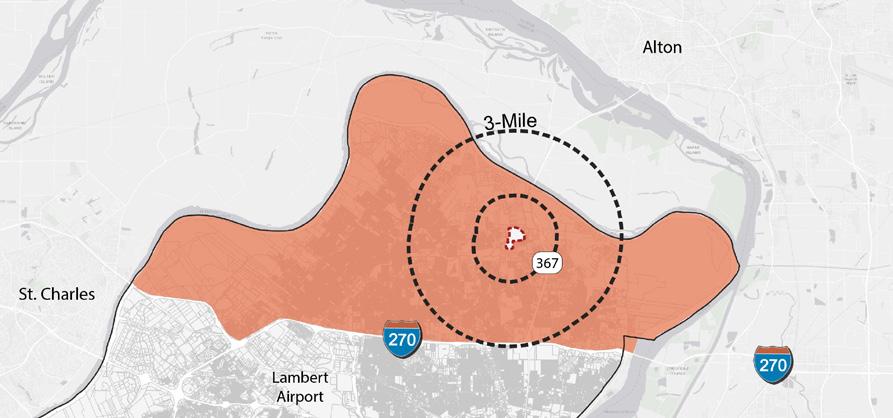
Despite no nearby “mall,” North County (shown here north of I -270) has no shortage of retail stores, but there is room for more eating and drinking places. Again using 2017 data, retail sales in North County exceeded household demand from North County residents by some $450 million, enough to support almost 100 retailers at average sales-per-store. That is, the equivalent of 100 average stores are supported by non-North County shoppers.
Annual Retail Buying Power & Sales, North St. Louis County
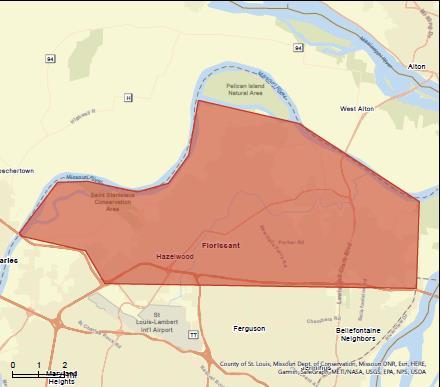
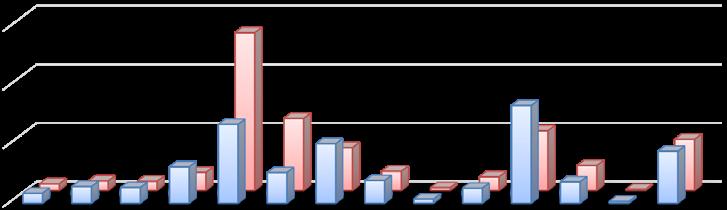
Source: Esri
$600,000,000
$400,000,000
$200,000,000
$0


Buying Power Merchant Sales
Demand exceeds sales, however, for eating and drinking places by the equivalent of about ten additional establishments.
Despite no nearby “mall,” North County (shown here north of I-270) has no shortage of retail stores, but there is room for more eating and drinking places. Again using 2017 data, retail sales in North County exceeded household demand from North County residents by some $450 million, enough to support almost 100 retailers at average sales-per-store. That is, the equivalent of 100 average stores are supported by non-North County shoppers.
Demand exceeds sales, however, for eating and drinking places by the equivalent of about ten additional establishments.
Jamestown Mall site
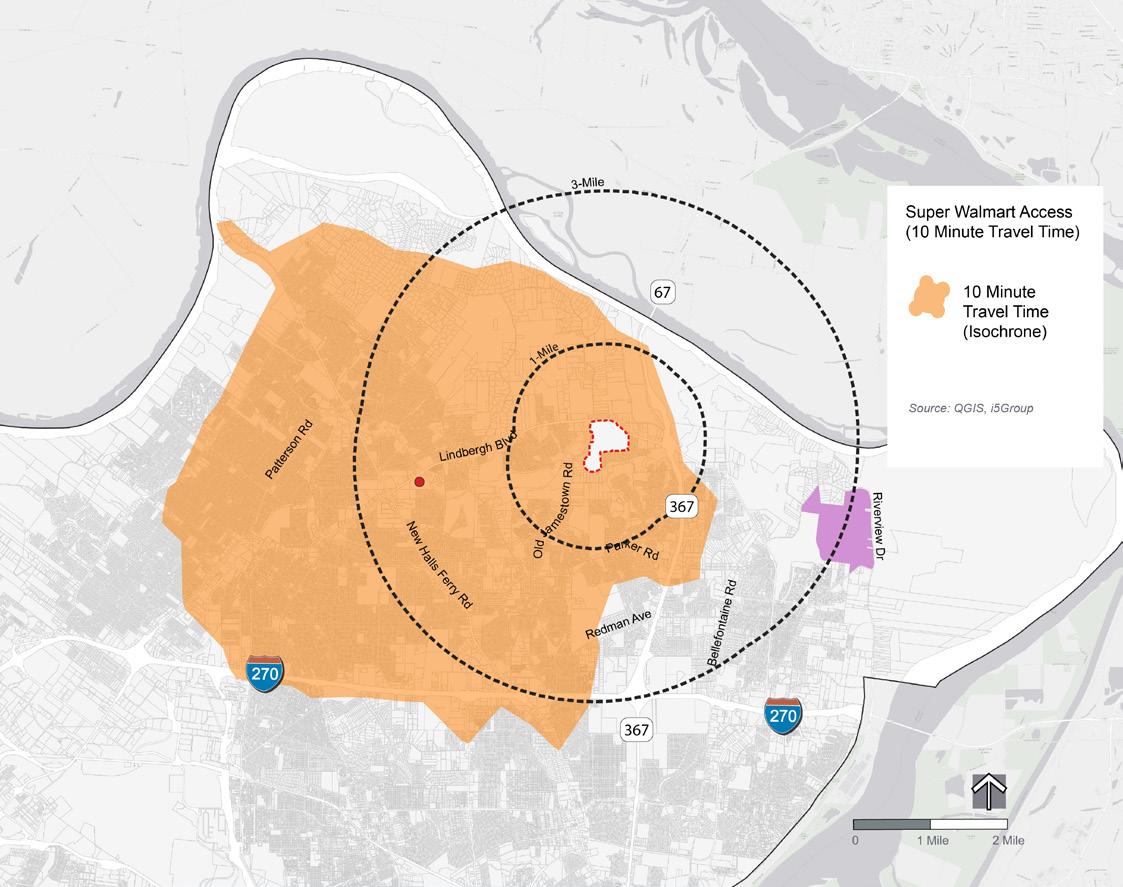
Walmart Supercenter 3390 N Hwy 67 Florissant, MO 63033
Future Saint Louis Zoo WildCare Park
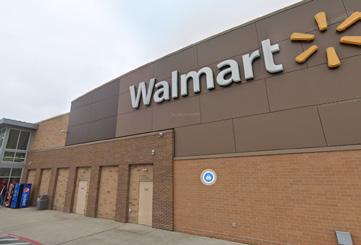
Florissant has a high concentration of grocery stores
The map on this page shows major grocery stores north of I-270 and the 10-minute drive area to each store.
While Florissant has a high concentration of grocery stores, there are no major grocery stores north of New Halls Ferry Road and Redman Avenue. These areas are mostly within a 10-minute drive of a store, but have more limited options than compared to other parts of north county. In addition, walkable or transit options are especially limited.
This map only includes traditional stand alone grocery stores. It does not include other retail outlets (such as the Walmart Supercenter and Target in Florissant) that carry groceries.
This map illustrates population growth and decline at the Census tract level in the last decade. Declines in the “region” that Jamestown Mall should support are all too apparent, but there are exceptions. This has implications for many other issues facing metro St. Louis and St. Louis County, but it certainly indicates further challenges facing retailing in North County.
This map of population density also disfavors much retail interest in North County and particularly in the Jamestown Mall area. Population per square mile is highest in south St. Louis, but quite low in most of North County. Retailing loves households but also density of population and the buying power that the population represents. With the inability to add significantly more population north of Jamestown Mall because of geological conditions, let alone to the east in Columbia bottoms, major retailing is not likely to occur on the mall site.


This map is also from East-West Gateway Council of Governments. It shows personal income density in the form of dollars per acre. Darker colors indicate more income concentrations. Note that the highest value housing areas of St. Louis County (e.g., Ladue, Town & Country), have relatively low densities of income because of the large housing lots (fewer dollars per acre). The greater Jamestown area lacks income density, too, which is more focused in the Florissant area, let alone in south St. Louis and west/southwest County.
This map is from East-West Gateway Council of Governments. It shows personal income density in the form of dollars per acre. Darker colors indicate more income concentrations. Note that the highest value housing areas of St. Louis County (e.g., Ladue, Town & Country), have relatively low densities of income because of the large housing lots (fewer dollars per acre). The greater Jamestown area lacks income density, too, which is more focused in the Florissant area, let alone in south St. Louis and west/southwest County.
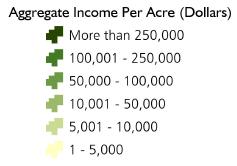
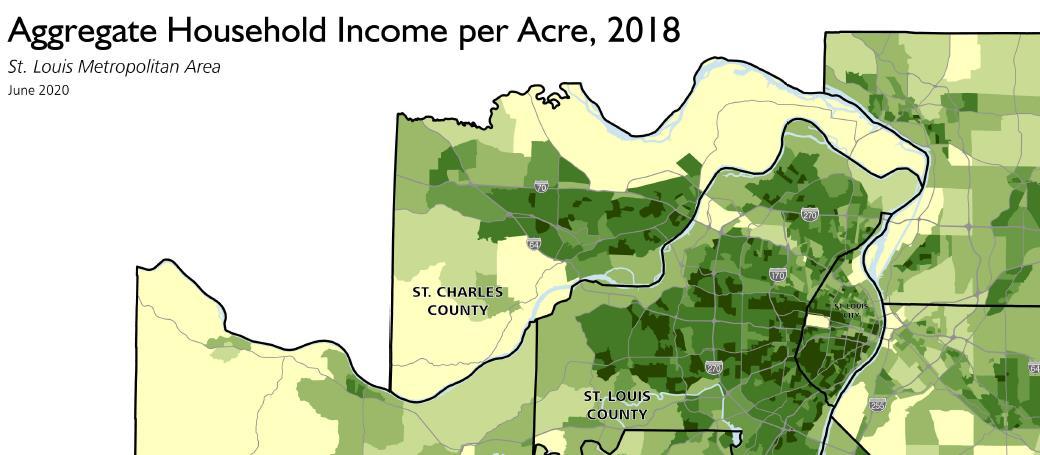
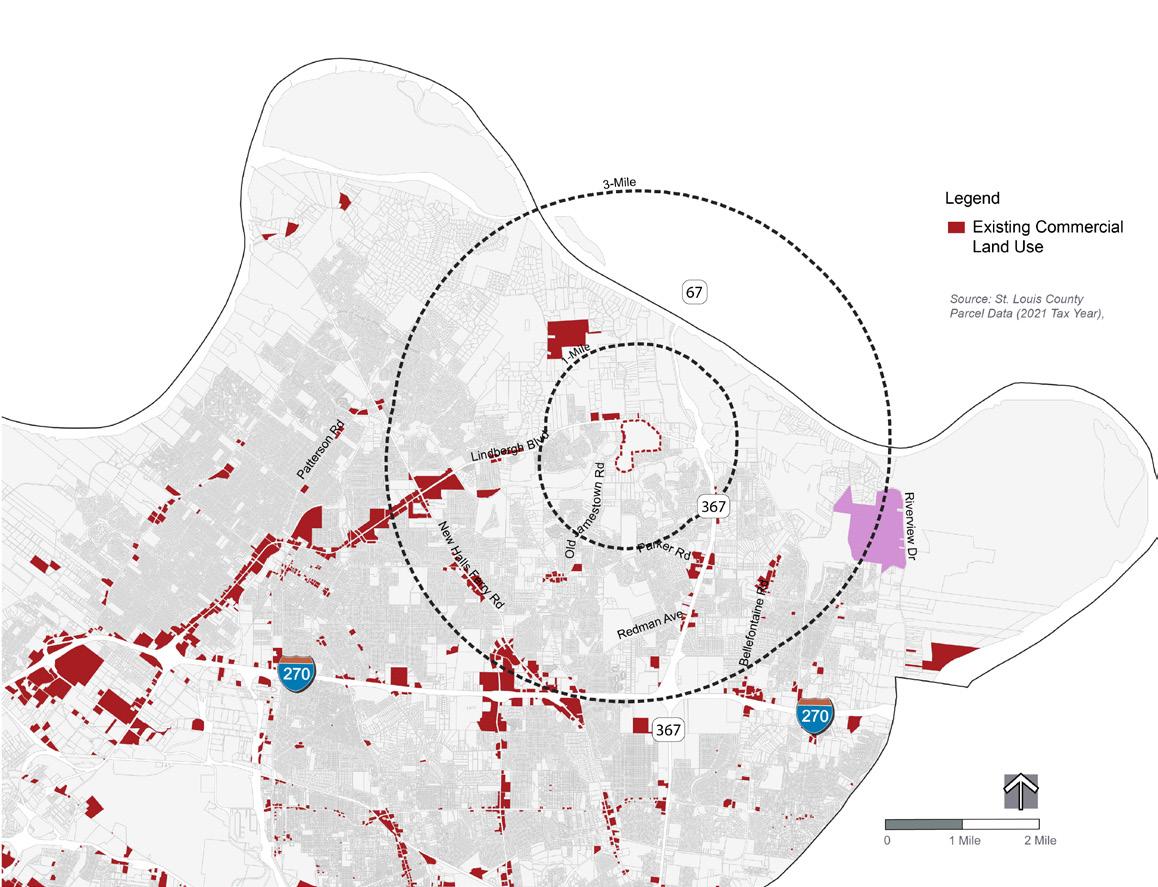
Hwy 367 & Parker Rd
Hwy 367 & Redman Rd
Lindbergh Blvd & Old Halls Ferry Rd
Parker Rd & Old Jamestown Rd D
Lindbergh Blvd & New Halls Ferry Rd E
Jamestown Mall site
Future Saint Louis Zoo WildCare Park
The Jamestown Mall site is not the only opportunity area for retail and commercial development. There are many existing commercial nodes in north St. Louis County.
The following pages examine five of the closest commercial nodes to the Jamestown Mall site for opportunities for new development. The categories of opportunities include:
• Available Building Space
• Site Ready
• Greenfields
• Demolition or Rehabilitation
The two existing commercial nodes along Highway 367 include over 25 acres of potential development opportunity.
Available vacant building space.
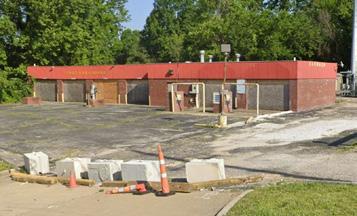
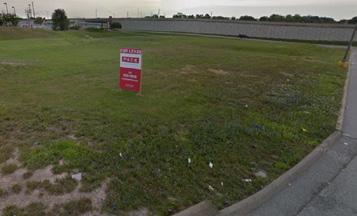
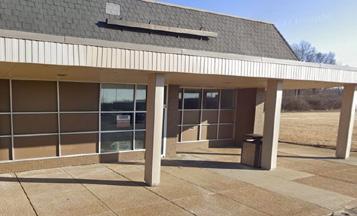
Out parcel or other vacant parcel within or near an existing development. Current grading (topography) for development and assumed to be site ready.
Nearby greenfields (vacant) likely suitable for development based on existing aerial photographs and topography. Utilities, ownership, and other factors are unknown.
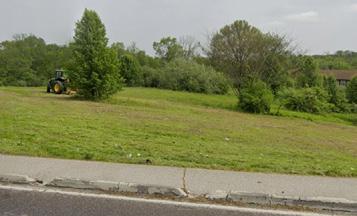
Existing buildings or remains of past development will require demolition or extensive rehabilitation.
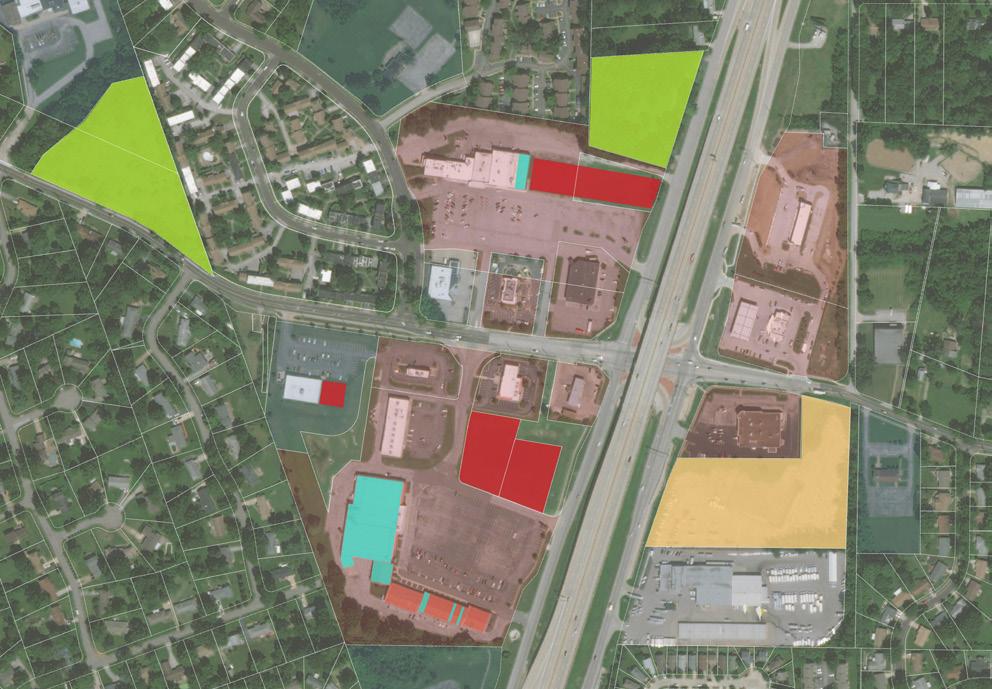
Accounting,
Elayne's
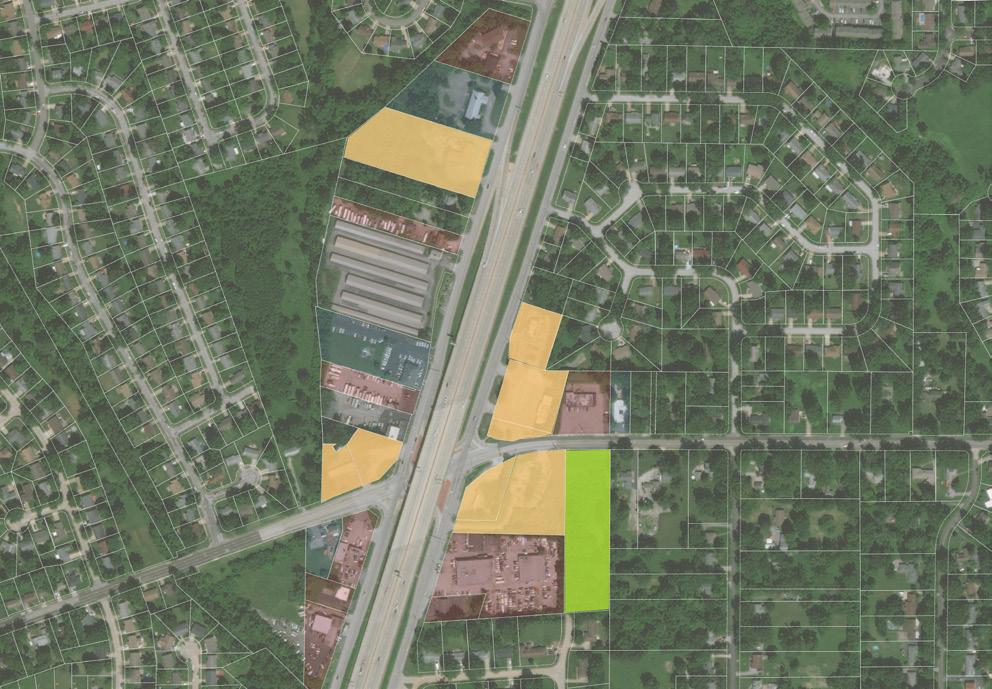
G1: 2.5 acre
Auto Auto Sales 1 Auto Maintenance 1 Auto Maintenance 2
D1: 2.7 acre
D2: 0.7 acre
D3: 0.6 acre
D4: 0.9 acre
D5: 1.6 acre
D6: 0.7 acre
Total Acreage: 11.6 acres
D7: 1.9 acre
Beauty Nail Salon Daycare Daycare 1 Daycare 2 Office Office 1 Office 2
Misc Retail Bait and Tackle
Storage/Moving Storage Units RV Storage Other St. Louis County Police
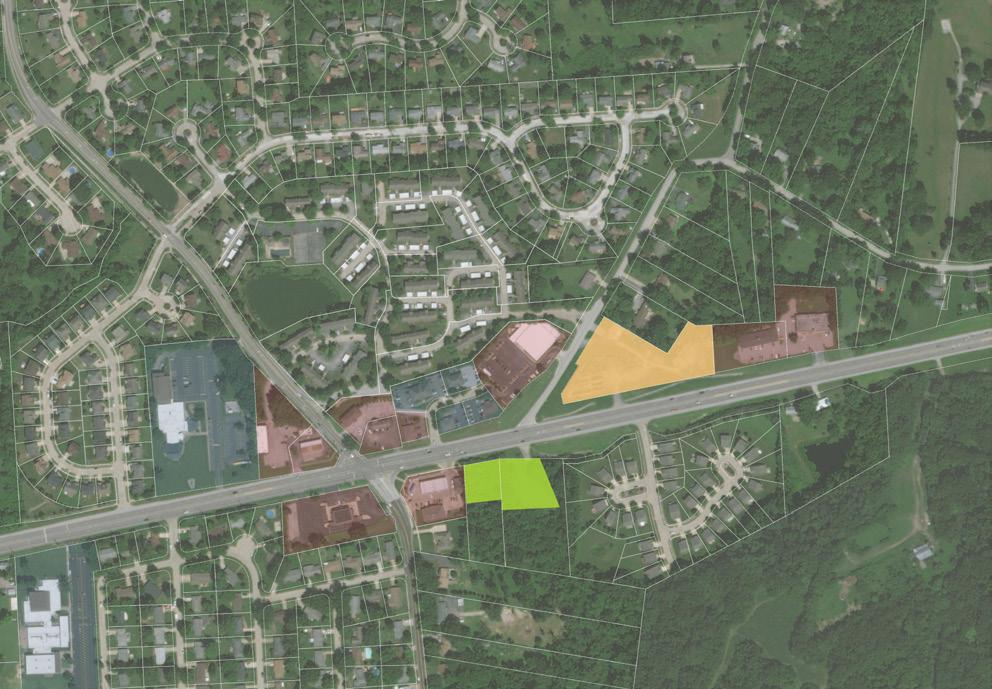
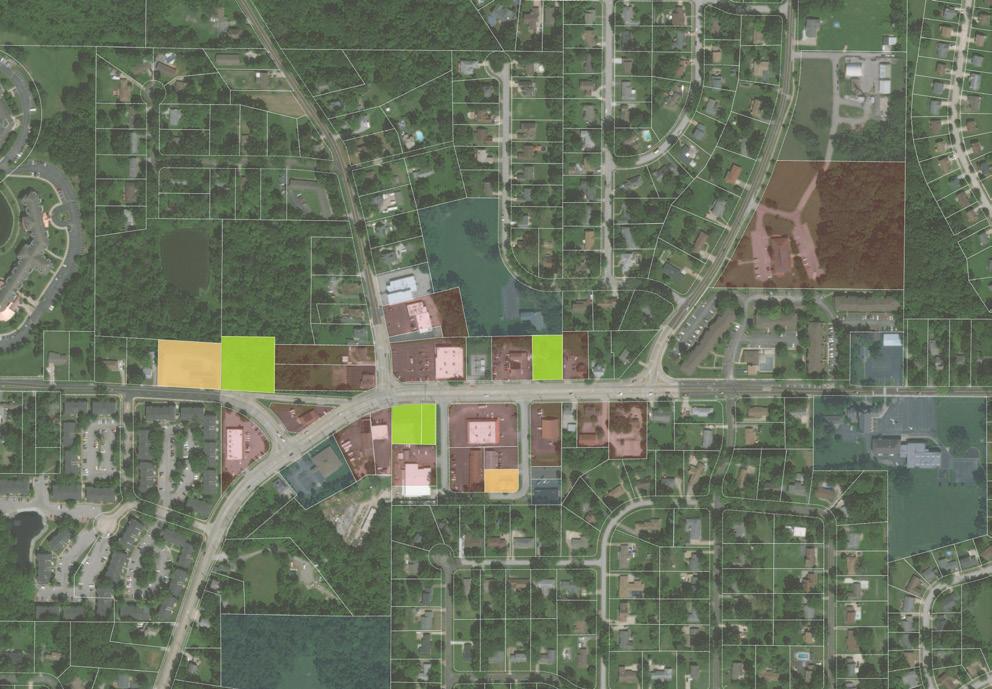
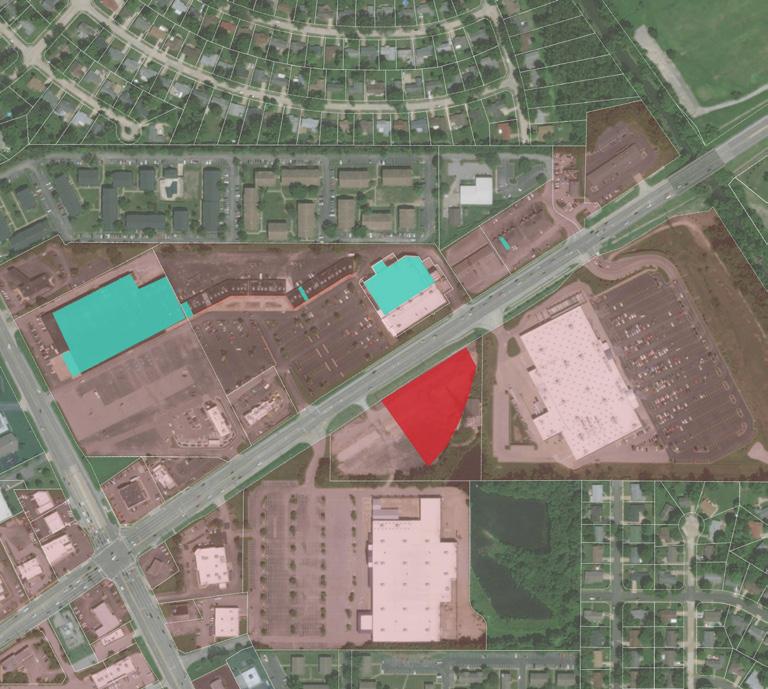
This section aims to assess the opportunity to support independent retailers and restaurants in each of the Jamestown Mall six (6) redevelopment scenarios. The section outlines the retail market analysis findings to define the entrepreneurial opportunities, further considering the implications of sales potential and the ability to access ecosystem supports.
Currently, the mall site is vacant and surrounded by primarily single-family and institutional uses. The density in this segment of the community, in both St. Charles and St. Louis County, is much lower than neighborhoods further west. North St. Louis County (North County) has experienced slight population loss (-1.8%) over ten years (2010-2020), yet surrounding areas have increased population.
Most categories of retail offerings serve North County. Notably, the amount of sales exceeds what is generated by North County residents, detailing the ability of retail tenants to attract customers from surrounding geographies. However, there is a local demand for retail trade within 1-mile and food and drink (restaurants and bars, not food and drink at home) within a 1-, 3-, and 5-mile radius from the mall site. However, there is a more significant number of retail uses to the west might limit the ability to capture many additional expenditures on-site, especially if both sites develop a similar retail mix
The retail real estate market for smaller shops is competitive due to regionally low vacancy rates in North County. This condition seems to inform the higher asking rental rates. There is a resulting opportunity to develop additional small shop space to serve
entrepreneurial and more established brand needs. However, the high rent rate could also cause an affordability concern for emerging brands.
The meet the opportunity detailed in the market conditions above, the following analysis vets the six scenarios' ability to develop small shops as desired sites for entrepreneurial growth.
Abbreviated Description: Large scale subdivision with village-scale retail shops and restaurants
• The on-site residential population provides for an immediate customer to collocated retailers and can help to guarantee a portion of the revenue required for operations.
• Retail should have accessibility and visibility from Old Jamestown Rd and N Hwy 67
• Consider developing neighborhood amenities (e.g., parks, public space, community centers) adjacent to storefronts and ensuring they are open to the larger community to ensure local businesses can be exposed to incidental customers.
• Identify a ladder of vending opportunities to provide more retail space at a lower cost and align programming (e.g., farmers' market and food trucks for special event days, brickand-mortar, kitchen incubator, etc.)
• Pair development with programming to bring people onsite. Consider aligning development with the specific brand of business opportunities (e.g., health and wellness, food manufacturing, etc.)
Abbreviated Description: Corporate campus with office buildings, parking, and amenities (including retail and small business space)
• Limit retail square footage to sundries and food and drink businesses aligned with quick-bite, lunch options.
• Limited ability to extend business hours past the general workday to provide increased dinner opportunities due to the lack of an adjacent customer.
• Opportunity to offer emerging businesses partnership opportunities with corporate office tenants for catering.
“C”:
Abbreviated Description: Advanced high-tech manufacturing and/ or data center
• Not a large employer to support retail on-site unless developing a portion of the Jamestown Mall site as another use.
“D”:
Abbreviated Description: Warehousing and distribution center
• Although a substantial employment population, off-campus dining is often limited due to lower wages; sundries, fast food restaurants, and cafes are prevalent in or nearby similar districts.
• Maintaining visibility from the primary roads (Old Jamestown Road and N Highway 67) will provide for additional sales opportunities.
“E”:
Abbreviated Description: Research park
• Moderate employment with higher wages could serve to support independent businesses.
• Aligning entrepreneurial opportunities is an asset –entrepreneurs supporting entrepreneurial retailers; can be paired with incubators/accelerator programs.
• Modern research parks are mixed-use environments that provide much more opportunity for retailers.
Scenario “F”: Green Acres AG and Energy Center
Abbreviated Description: Intensive outdoor and indoor farming
• Not a large employer to support retail on-site unless develop a portion of the Jamestown Mall site as another use.
Small business ecosystem strategy is an emerging practice in economic development, primarily spurred by high-growth, technology-enabled firms. Over time, academics and practitioners identified a series of core features, presented below as the 5 C’s of an Entrepreneurial ecosystem (Source: Gaines, Dell. 2019. The Importance of Inclusive Entrepreneurship Ecosystems.).
• Capital: Financial Resources
• Culture: The local communities’ perception and support of entrepreneurship
• Connection: Resource and relationship network
• Capability: Entrepreneur and owner skillset
• Climate: Regulatory, economic development and policy environment
In ecosystems tailored for neighborhood retail, the entrepreneurial ecosystem comprises all the same elements but includes a geographic factor or real estate, design services, and emerging purveyors, all variables in attracting sales. For this memorandum, &Access analyzed the following categories and subcategories:
• Stage of Entrepreneur Supported (Business Planning, Startup, Growth, Decline/Pivot)
• Programmatic Offerings
• Community Building (Networking, Mentorship)
• Design Services (Architecture, Graphic Design, Branding)
• Education (Financial Literacy, Sales and Marketing, Workforce Development, Management, and Operations)
• Financial Support (Grants, Loans, Lines of Credit, Venture Capital)
• Real Estate (Pop Up, Traditional Leases, Other)
• Technical Assistance (Accounting and Tax, Business Planning, Legal, Feasibility Studies, Licensing Support, Business & Nonprofit Consulting, Prototype/Product/ Production Development)
In Winter 2020, Next Street and Common Future completed the metro St. Louis’s Small Business Ecosystem Assessment. This assessment revealed that most capital and service provisions for entrepreneurs are focused on high-growth businesses in select sectors, overlooking Main Street businesses owned by people of color (POC). The study discusses the fragmented, network-driven ecosystem that makes business owner navigation and ecosystem organization execution difficult. The study yielded Emerging Solutions that highlighted the need for increased coordination, collaboration, and capital.
In the following assessment of the retail business support organizations, we find that most of the support provided is in the community building and education categories, great cornerstones of initial success. However, there are several gaps in offering that hope to ensure businesses succeed long-term. See the gap analysis tables for programmatic offerings by organization. Note that the programmatic offerings are based upon a review of each organization’s website. Details regarding the timeline, number of businesses supported, and ability to take on new businesses were not obtained during this study, and &Access recommends exploring each during the project’s implementation.
Several organizations that support St. Louis County offered technical assistance programs to existing independent retailers. Many organizations offer business planning and educational opportunities, which can drive startup operations. But supplemental technical assistance such as accounting/tax, feasibility studies, and licensing support is lacking.
Finally, there is a breadth of coworking and other incubators/accelerators in real estate across the region, primarily in the City or nearby communities with greater density. These organizations are key in identifying tenants that can occupy space in the future. Additionally, as entrepreneurs emerge from the community, these spaces can support startup operations while businesses identify adequate brick-and-mortar facilities in the redevelopment or elsewhere.
TABLE (Programmatic offerings by organizations)
Organization
Heartland St. Louis Black Chamber of Commerce STL Partnership St Louis County Library Small Business Resources Legal Services of Eastern Missouri Microenterprise Program Missouri SBDC
Mid-States Minority Supplier Development Council Missouri Business Development Program VetBiz Arch Grants St Louis Small Business Empowerment Center
BRAND of St. Louis (Business Resource Association for Networking & Development) St. Louis Equity in Entrepreneurship Collective Grind + Growth Justine Petersen St Louis Mosaic Vision St Louis Diverse Business Accelerator Asian American Chamber of Commerce St Louis Bosnian Chamber of Commerce St Louis LGBTQ Chamber of Commerce St Louis SCORE (at Fontbonne University)
Skandalaris Center at WashU Bunker Labs St Louis Missouri Venture Forum Next Missouri St. Louis Makes Eagle Private Capital AAIM Employers' Association Network for Strong Communities St Louis Job Corps
Nationwide, access to capital is a common need among all entrepreneurial categories. With few organizations providing the breadth of resources, it remains a challenge for retailers in St. Louis to meet needs. Handfuls of organizations offer grant and loan programs. Grants are often small (not providing enough equity to successfully launch a brick-and-mortar retail establishment). Non-traditional loan providers, such as community development financial institutions (CDFIs), provide capital to entrepreneurs looking to open brick-and-mortar retail establishments in the absence of traditional banks that view retail (especially startup retail) as too risky an investment. Alternative products (lines of credit and venture capital) are rare.
Access to customers and services is a gap/need in the ecosystem, according to the 2020 assessment. Many organizations offer sales and marketing educational services, but few support the design elements (architecture, graphic design, and brand) needed to thrive. Businesses often overlook these design services, as many startup businesses consider them unnecessary or too costly. The design proves to help a new retail concept enter a market by acquiring and retaining a customer base who seek refined concepts, a feature common among national brands.
Finally, there is a breadth of coworking and other incubators/ accelerators in real estate across the region, primarily in the City or nearby communities with greater density. These organizations are key in identifying tenants that can occupy space in the future. Additionally, as entrepreneurs emerge from the community, these spaces can support startup operations while businesses identify adequate brick-and-mortar facilities in the redevelopment or elsewhere.
This section explores a local and small business development and tenanting strategies and provides additional detail for a development strategy targeting small and local businesses. Case studies provide additional context for how the strategy could manifest in similar neighborhood conditions.
Considering the market opportunity to support additional food and beverage (F&B) retailers and the racial makeup of North County, Blackowned restaurants are likely the most opportune category to meet unmet demand in the community. However, restaurants are one of the most capital-intensive and risky businesses in the retail industry.
Potentially a destination dining strategy can align entrepreneurial endeavors with the ability to capture a geographically expansive audience. Particularly because there remains a challenge in attracting customers from dense neighborhoods further west. But to ensure sales potential, the scenario selected should provide a breadth of customers on-site to overcome the lack of residential density nearby.
The physical design of retail development matters, as independent businesses without an established customer base must win over new customers. Siting the retail space adjacent to essential community amenities (such as playgrounds, amphitheaters, and dog parks) can promote additional market opportunities. Identify a ladder of vending opportunities can provide more retail space at a lower cost for the entrepreneur and aligned programming could support revenue generation for all businesses on-site and a desirable neighborhood for the residential and office population. (e.g., farmers' market and food trucks for special event days, brick-and-mortar, kitchen incubator, etc.)
Analysis conducted by the larger consulting revealed that smaller spaces were largely occupied across North County. Building upon this finding and the food and beverage strategy outlined in the previous memorandum, the &Access team analyzed national and local food and beverage tenants’ average occupancy across the region.
The chart to the right demonstrates that leases executed by national and local businesses were comparable in average size. Single location food and beverage businesses across the region occupied approximately 500 square feet more space than national brands (3,217 and 2,702, respectively). This finding further illustrates the demand for smaller spaces. Our team assumes national brands are likely able to demonstrate space efficiencies through honed prototypical designs while single location businesses occupy spaces available.
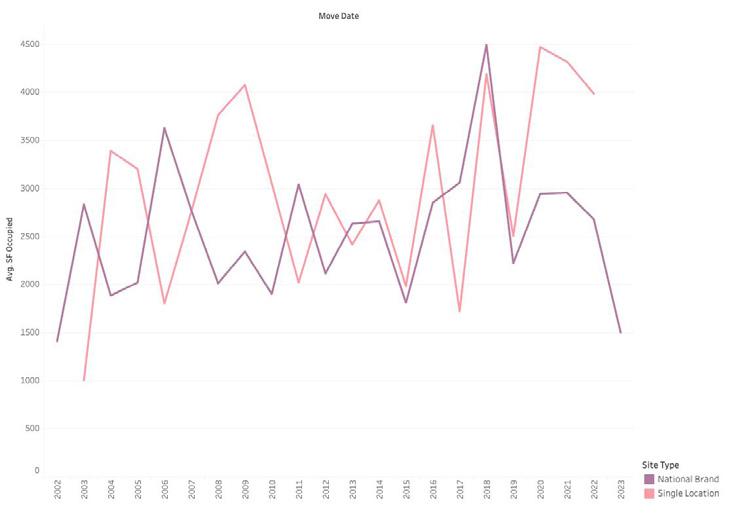
It remains undetermined if tenants would readily occupy micro spaces (less than 1,000 square feet), if more were available. Data demonstrates that businesses (both national brands and single location businesses) occupy spaces smaller than 1,000 square feet (see chart below). As such, it will be a sound investment for a development team to explore a range of small retail space square footages that are attractive to both national and local businesses.
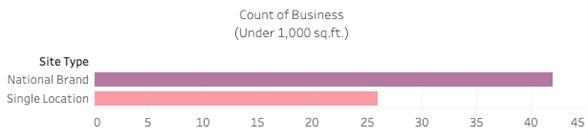

The on-site residential population provides for an immediate customer to collocated retailers and can help to guarantee a portion of the revenue required for operations.
Pair development with programming to bring people on-site. Consider aligning development with the specific brand of the development – a focus on solar energy and/or agriculture. Focus on agriculture will have more opportunities for tenant alignment, for example:
• Full-service restaurant with an on-site small-scale farm to source produced for menu items
• Alcoholic beverage manufacturer such as a brewery or distillery
• Seasonal farmers market
• Small scale grocer with locally sourced goods
• Open space for recreation
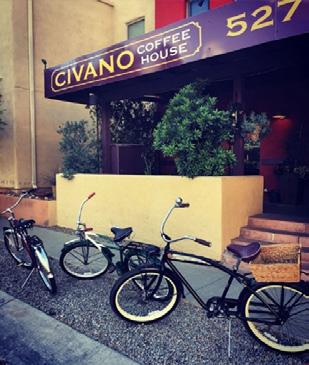
This 270-acre New Urbanist neighborhood with adjacent 55-acre “town center” is co-located in Tucson, AZ. The Town Center includes an activity center/meeting hall, live/work residences, light industrial manufacturing buildings, medical office, complex, and a gas station. Retail on-site includes:
There are 650 high-efficiency homes, many with carriage homes. Thirtyfive percent (35%) of the space is open with a mix of natural desert, landscaped parks, sport fields, community gardens, and paths and trails.
The tenant mix showcases the limited ability to support retail in edge conditions like Jamestown Mall.
• Food & Beverage: Our Sweet Lil' Cakery
• Shopping: The Drizzy Lizard Gift Shop
• Salons: Painless Permanent Makeup & Prayer, Path to Wellness Massage, Bella Body
• Professional Office: Al Nichols Engineering Incs, Civano Eyecare, Bridge Group
More at: https://www.terrain.org/2019/ unsprawl/civano/
Ensure retailers offer goods and services aligned with the 15-hour user base:
• Coffee, sundries, etc. for morning
• Quick bite food and drink businesses for lunch and dinner meal periods
• A full-service restaurants for dinner service
• Limited shopping and fitness
Consider developing neighborhood amenities (e.g., parks, public space, community centers) adjacent to storefronts and ensuring they are open to the larger community to ensure local businesses can be exposed to incidental customers.
Identify a ladder of vending opportunities to provide more retail space at a lower cost and align programming (e.g., farmers' market and food trucks for special event days, brick-and-mortar, kitchen incubator, etc.).
Explore the opportunity to offer emerging businesses partnership opportunities with corporate office tenants for catering.
Located in Fulton County, GA (in Metro Atlanta), Serenbe is a community that’s intended to connect people to nature and to each other. Each of Serenbe’s hamlets have complementary commercial centers focused on the elements of a well-lived life: arts for inspiration, agriculture for nourishment, health for wellbeing, play for a joy-filled life, and education for awareness.
Fresh food is another of Serenbe’s natural assets, with a 25-acre organic farm, seasonal Saturday Farmer’s Market, thriving CSA program and edible landscaping, including blueberry bushes along paths and sidewalks.
Year-round cultural events include outdoor performances from Terminus Modern Ballet, regional theatre, film series, culinary workshops and festivals, music events, and lectures, boutique shopping, art galleries, wellness services and trail riding, plus visiting artists in residence with classes, dinners and talks.
Serenbe offers a more robust tenant mix that aligns with a greater density on-site in comparison to Civano. The diversity of users at Serenby and its brand as a destination contribute to a range of revenue producing opportunities for its businesses. The businesses align with the brand of the development project, creating a unique opportunity that attracts customers time and time again. Note, this mix is more than what is recommended on-site, as Serenbe offers a hotel, educational facilities, and other attractions.
Source: Serenbe’s website (https://www.serenbe.com/)
Serenbe Tenant mix:
• Arts: Art Farm, Chatt Hills Gallery, Paint Space
• Education: Acton at Serenby, Biophilic Institute. Camp Serenbe
• Food & Beverage: Bamboo Juices, Blue Eyed Daisy Bakeshop, The Farmhouse, Halsa, The Hill

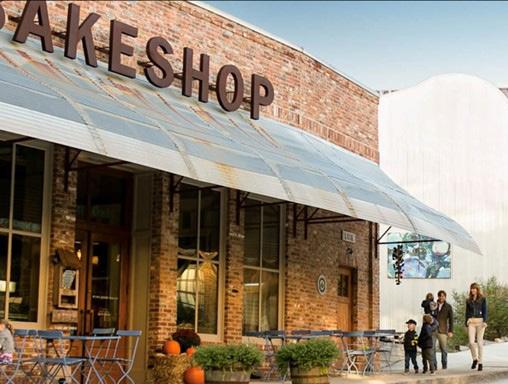
• Grocery + Sundries: General Store, The Wine Shop at Serenbe, Serenbe Farms (CSA Program + Small Scale Farm)
• Lodging: The Inn at Serenbe, Portal
• Shopping: The Ballog, Forage & Flower Botanical Design Studio, Pro Bike Repair, Resource, Hamlin, Hills & Hamlets Bookshop, Honeycomb Consignment, SustainAble Home Goods, Typo Market
• Salons: Chai Vegan Spa & Salon, Creek Retreat, Proper Hair Salon, Spa at Serenbe
• Gym/Fitness: Egoscue of Atlanta, Gym & Indoor Cycling Studio, The Stables at Serenbe, Studio 13 Pilates, Serenbe Swim Club, Serenbe Trail Riding, Serenbe Yoga + Bodyworks
• Professional Office: Serenbe Real Estate, Center for Positive Change, Chiropractic at Serenbe, Collier Animal Hospital, Dental Wellness at Serenbe, Essential Wellness 360, Flourish Pediatrics, Land Plus Associates, Nygren Placemaking, Planning & Design, Precision Performance & Physical Therapy, Serenbe Development
Pair annex development with programming to bring people onsite. Consider aligning development with the specific brand of the development – a focus on solar energy and/or agriculture. Focus on agriculture will have more opportunities for tenant alignment, for example:
• Alcoholic beverage manufacturer (e.g., brewery/distillery)
• Farmers’ market
• Farm-to-table full-service restaurant
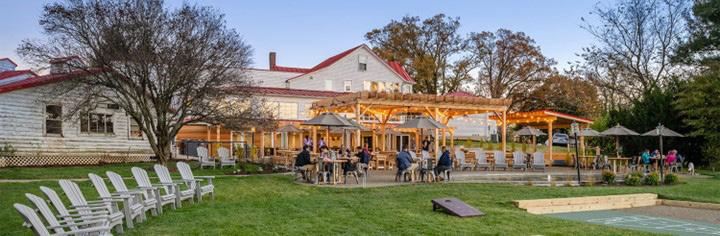
Offering unequaled panoramic views, sweeping landscapes and historic charm, the Inn is located on 5.26 stunning acres at the base of Sugarloaf Mountain in Montgomery County, Maryland. With sprawling park-like grounds, The Comus Inn provides ample exploration and play opportunities for adults and children alike.
Promising accessible farm-to-table cuisine, The Comus Inn has welcomed Chef Sammy D as its Culinary Director. Featuring a worldclass chef led restaurant, a craft beer garden, and a unique marketplace, all of our food & beverage offerings are created with a focus on a local approach. While our hope is that you always enjoy your time with us, our true goal is that you also leave The Comus Inn with fun memories of spending time with family & friends.
Although the density surrounding Comus Inn site is less than what is planned as the Agricultural and Energy Technology Annex, we recommend a similar tenant mix to contribute to serve neighborhood and on-site users food and beverage needs. Pairing a restaurant and alcoholic beverage manufacturing facility with a stellar public space will encourage visitors to return routinely.
Tenant Mix:
• Full-service restaurant
• Craft beer garden
• Unique marketplace
Source: https://www.thecomusinn.com/
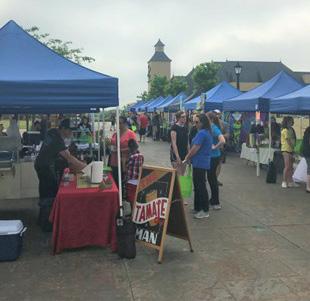
According to desk research conducted by the &Access team, there is a gap in farmers’ markets offered north of I-70 in North County (see map this page – Jamestown Mall site identified by a red star icon). A farmers’ market can complement the range of grocery stores located in nearby neighborhoods and our team recommends a farmers’ market with both fresh produce purveyors and artisans to provide sales opportunities for small businesses interested in the local North County market. (Source: &Access; St. Louis Magazine, St. Louis Sprout’s Farmers’ Market Guide)
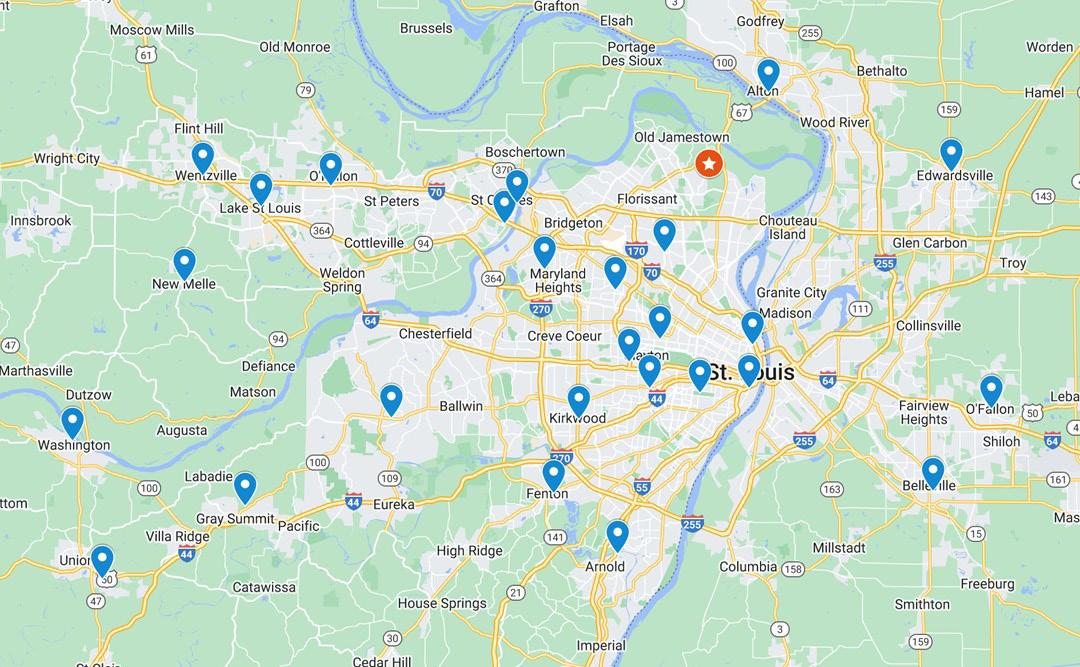
To facilitate this opportunity, consider both a permanent structure to provide shade and limit the need for the vendors to provide tents (left image below) or use uniform tenants to allow for vendors table merchandising strategy to speak for their brands and products (right image below).
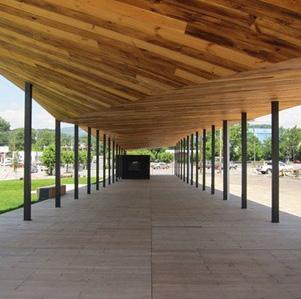
Small businesses, especially those in the food and beverage category, can serve a unique value add to the Jamestown Mall redevelopment regardless of typology. Food unifies communities across the globe and could do so for the North County residents. &Access holds its recommendation to provide a range of opportunities for local businesses through vendor, mobile, and brick-and-mortar retailing.
Notably, there is a unique opportunity to produce and sale food and/ or beverages on-site, a branding opportunity to attract customers from across the region. However, there are zoning implications of commercial sales of food produced on site and strategies for municipalities to take to facilitate this activity from temporary farm stands and community gardens to farm stands. Ensuring by-right establishment of these type of opportunities will help developers create projects as vibrant as Serenbe, Comus Inn, and Civano.
Regardless of the scenario pursued, our team recommends aligning retail along Lindbergh Blvd and, secondarily, Old Jamestown Road to capture the most sales opportunities. This recommendation conflicts with a couple of the above case studies’ site, as retail is internal to the properties – a new urbanist approach to development.
The planning team reached out to the various utilities and agencies that impact the Jamestown Mall site for initial responses for the six potential land use scenarios.
257 Chesterfield Business Parkway, St. Louis, MO 63005 636.530.9100 – Main | 636.530.9130 – Fax www.stockassoc.com

1. THE METROPOLITAN ST. LOUIS SEWER DISTRICT
Email Response From Mr. Eugene Johnson, P.E. (5/4/2022) States:
“Sanitary and Storm sewers’ are available within the Jamestown mall property. The site drains into the Coldwater Pump Station (06F4-059S). During the plan review and permitting process, the additional sanitary flows will be calculated, and the pump station will have to be analyzed with the additional flow to determine if the pumps will have to be upgraded and/or the 24-hour emergency storage increased. If pump station improvements are necessary, they will be considered part of the development and paid for by the developer.”
Email Response from Mr. Matthew Lueders (6/2/2022) States:
“The former Jamestown Mall property is bordered by a 20-inch main along Lindbergh at Old Jamestown Road on the northwest corner of the property. The typical service pressure is between 95-psi and 110-psi. The mains in the surrounding area are distribution mains targeting residential services and residential fire flow rates. There is a 6-inch and 8-inch main to the west of Jamestown mall and a 12-inch main to the east at the termination of our distribution network.
Regarding capacity, we can provide adequate flow for each of the proposed development types from the 20-inch main which is well connected to our North WTP. Once more is known about the potential development, we can discuss specifics for layout, typical demands, and available fire flow rates.”
Email Response from Mr. Nick Eggert (5/9/2022) States:
“Following the demo of the mall and the abandonment of our facilities within the area, we’ll have 8” Intermediate Pressure mains along both Old Jamestown Rd and Lindbergh Blvd that should have sufficient capacity for the potential developments Mike Langan would oversee small commercial developments, Pat Bloomfield would oversee large commercial developments, and CG Covey would oversee any residential.”
257 Chesterfield Business Parkway, St. Louis, MO 63005
636.530.9100 – Main | 636.530.9130 – Fax www.stockassoc.com
Email Response from Mr. Zak Kaller, Career Engineer, Gateway Division (5/10/2022) States:
“Any of the new developments listed would require the relocation of Ameren facilities on the north side of the Jamestown Mall property. Ameren underground facilities are in easement and the relocation costs would be reimbursable.
In addition, All line extensions will be made according to the rules in effect and approved by the Missouri Public Service Commission per Ameren Missouri’s rate filing at the time of the service extension. Cost estimates for providing the requested service which may include an amount the developer must pay prior to construction, will be determined upon confirmation of the specific project requirements.”
Email Response from Ms. Tonya Wells (5/10/2022) States:
“AT&T has copper cables that currently feed Jamestown Mall. There are no fiber optic lines in the old mall property. there are fiber optic cables along Lindbergh that can be brought into the Jamestown area based on what development option is decided. There are some manholes along the perimeter of the old mall. Our infrastructure will need to be reinforced and upgraded with fiber after demolition. I can issue a project to remove the old copper cable from the existing building if that is needed soon.”
Email Response from Mr. Kerin Miller, MBA, MA (5/16/2022) States:
“We are in good shape to serve almost anything in this area. While we don’t have any service on the grounds right now, but we serve the surrounding homes and are able to service this site’s future development.”
257 Chesterfield Business Parkway, St. Louis, MO 63005 636.530.9100 – Main | 636.530.9130 – Fax www.stockassoc.com

1. MODOT
Email Response from Mr. Van Gluzman – Area Traffic Engineer, (5/5/2022) States:
“Currently there are two operating signals in front of the property: Old Jamestown and Robins Mill. The other two entrances, currently unsignalized, used to be signalized as late as 10 years ago. current roadway infrastructure could be adequate. The existing signal at Robbins Mill dates to 1994 and the one at Old Jamestown Is not that much newer and would likely need replacement.”
2. ST. LOUIS COUNTY DEPARTMENT OF TRANSPORTATION:
Email Response from Mr. Glenn Henninger, Assistant Division Manager, Planning & Programming, Division of Project Development (6/2/2022) States:
“Existing road network supported the Mall in its hay-day. We do not anticipate the need for major roadway network upgrades. However, when uses are pinned down more, a traffic study will determine locations of possible needed spot improvements.
The immediate area has also grown in residential use. Multi-modal improvements to the area roadway network should be considered, but major widening such as addition of thru driving lanes is not anticipated.”
3. BLACK-JACK FIRE DISTRICT:
Email Response from Ms. Demetria Peebles (6/1/2022) indicates that Fire Chief Corbin is on Vacation and will Respond upon his return the week of 6/6/2022.