January 2021
The Danish Property Federation’s Market Statistics – Vacancy •
Corona still does not affect the vacancy
•
Unchanged residential and office vacancy
•
Small increase in the retail vacancy.
•
Decrease in industrial vacancy
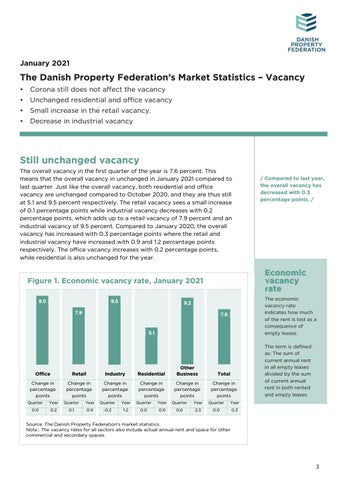
Still unchanged vacancy The overall vacancy in the first quarter of the year is 7.6 percent. This means that the overall vacancy in unchanged in January 2021 compared to last quarter. Just like the overall vacancy, both residential and office vacancy are unchanged compared to October 2020, and they are thus still at 5.1 and 9.5 percent respectively. The retail vacancy sees a small increase of 0.1 percentage points while industrial vacancy decreases with 0.2 percentage points, which adds up to a retail vacancy of 7.9 percent and an industrial vacancy of 9.5 percent. Compared to January 2020, the overall vacancy has increased with 0.3 percentage points where the retail and industrial vacancy have increased with 0.9 and 1.2 percentage points respectively. The office vacancy increases with 0.2 percentage points, while residential is also unchanged for the year.
Economic vacancy rate
Figure 1. Economic vacancy rate, January 2021 9.5
9.5
/ Compared to last year, the overall vacancy has decreased with 0.3 percentage points. /
The economic vacancy rate indicates how much of the rent is lost as a consequence of empty leases.
9.2
7.9
7.6
5.1
Office
Retail
Industry
Residential
Other Business
Total
Change in percentage points
Change in percentage points
Change in percentage points
Change in percentage points
Change in percentage points
Change in percentage points
Quarter
Year
Quarter
Year
Quarter
Year
Quarter
Year
Quarter
Year
Quarter
Year
0.0
0.2
0.1
0.9
-0.2
1.2
0.0
0.0
0.6
2.3
0.0
0.3
The term is defined as: The sum of current annual rent in all empty leases divided by the sum of current annual rent in both rented and empty leases.
Source: The Danish Property Federation’s market statistics. Note.: The vacancy rates for all sectors also include actual annual rent and space for other commercial and secondary spaces.
3
The Danish Property Federation’s Market Statistics - Vacancy, January 2021
The corona crisis has thus not yet had any massive impact on the vacancy. The property business’ arrears and extensions are supporting the tenants and therefore also the vacancy, but of course, it cannot continue if both the owners and tenants only have expenses. There is a small increase in the retail vacancy. And there is a small decrease in industrial vacancy, which may suggest continuously increasing on-line trade which requires more storage space and thus leads to a decrease in industrial vacancy. / The retail vacancy in the cities is not affected by corona – on the contrary. /
Decreasing retail vacancy in the cities On a national level, there has been a smaller quarterly increase in retail vacancy of 0.1 percentage points. As a consequence of corona, shops were closed, so it could have been feared that the increase in vacancy were higher. However, it is interesting that the retail vacancy in Aarhus, Aalborg, Copenhagen and Odense have all decreased since last quarter. Except from the North Denmark Region, the decreases in vacancy in the cities have not had a large importance to what the regional change is. In the remaining four regions, there are increases in retail vacancy compared to last quarter.
Figure 2. Development in economic vacancy rate Percent 25,0
20,0
15,0
10,0
5,0
Jan. Apr. Jul. Okt. Jan. Apr. Jul. Okt. Jan. Apr. Jul. Okt. Jan. Apr. Jul. Okt. Jan. Apr. Jul. Okt. Jan. Apr. Jul. Okt. Jan. Apr. Jul. Okt. Jan. Apr. Jul. Okt. Jan. Apr. Jul. Okt. Jan. Apr. Jul. Okt. Jan. Apr. Jul. Okt. Jan. Apr. Jul. Okt. Jan. Apr. Jul. Okt. Jan. Apr. Jul. Okt. Jan. Apr. Jul. Okt. Jan. Apr. Jul. Okt. Jan. Apr. Jul. Okt. Jan. Apr. Jul. Okt. Jan. Apr. Jul. Okt. Jan. Apr. Jul. Okt. Jan. Apr. Jul. Okt. Jan.
0,0
2000
2001
2002
2003
2004
2005
2006
Kontor
2007
2008
Butik
2009
2010
2011
Industri
2012
2013
Bolig
2014
2015
2016
2017
2018
2019
2020 2021
I alt
Source: The Danish Property Federation Market Statistics and own calculations based on data from IPD Danish Property Index and Ejendomstorvets Market Index. Note.: Data from January 2014 and onwards is from the Danish Property Federation’s market statistics. From 2001 to 2013, numbers from IPD Danish Property Index are processed based on differences in level in 2014. In 2000, office data from Ejendomstorvets Market Index is included. The calculation methods are not similar which is why there is a gap in data between October 2013 and January 2014. From January 2014, the calculation is quarterly, while it is annual before 2014. From 2014, the data used is more detailed.
2
The Danish Property Federation’s Market Statistics - Vacancy, January 2021
Office - Unchanged office vacancy In January 2021, the office vacancy is 9.5 percent. It means that the office vacancy is unchanged compared to last quarter. However, the industrial vacancy has increased with 0.2 percentage points compared to the same time last year. Office vacancy is thus 1.0 percentage points higher than the average from 2000-2021. If we look at the regions, there is a slight change in the Capital Region with 0.1 percentage points compared to last quarter, while the office vacancy in the Region of Southern Denmark increases with 0.5 percentage points. Furthermore, the office vacancy in Region Zealand increases more significantly with 2.0 percentage points. At the other end, the office vacancy decreases with 0.5 percentage points in both the Central Denmark Region and North Denmark. The Central Denmark Region thus has the lowest office vacancy among the regions with 7.5 percent. Region Zealand has the highest office vacancy with 14.2 percent. Previously, the Region of Southern Denmark had the highest office vacancy but Region Zealand's quarterly change has changed this.
/ The Central Denmark Region with the lowest office vacancy among the regions. /
/ Aarhus contributing to low office vacancy in Central Denmark. /
In the cities, Aarhus and Odense see a decrease of 0.6 and 0.9 percentage points respectively, while the office vacancy increases in Aalborg and Central Copenhagen with 0.2 and 0.3 percentage points respectively. The decrease in Aarhus emphasises the large demand for office leases in the city as it is the city with the lowest office vacancy of 6.6 percentage points, and it is obviously contributing to the large office vacancy in the Central Denmark Region. Compared to January 2020, the region's retail vacancy has decreased with 0.4 percentage points.
3
The Danish Property Federation’s Market Statistics - Vacancy, January 2021
Economic vacancy rate January 2021 (percent)
Quarterly change (percentage points)
Annual change (percentage points)
9.3
0.1
0.4
Central Copenhagen
8.3
0.3
3.1
Other City of Copenhagen
9.1
0.1
1.2
Northern Zealand
8.7
-1.9
-4.9
Other Capital Region
10.3
0.2
-1.6
14.2
2.0
0.1
Eastern Zealand
17.2
4.4
2.1
Western and Southern Zealand
11.9
0.1
-1.5
The Region of Southern Denmark
13.4
0.5
-0.3
Odense
9.3
-0.9
0.5
Triangle Area
15.1
2.4
-2.9
Other Southern Denmark
16.4
0.6
1.1
Table 1. Office
Capital Region
Region Zealand
Central Denmark Region
7.5
-0.5
-0.1
Aarhus
6.6
-0.6
-0.4
Other Central Denmark
10.8
-0.3
1.4
North Denmark Region
8.9
-0.5
-1.9
Aalborg
8.0
0.2
-1.2
Other North Denmark
15.6
-4.3
-8.7
9.5
0.0
0.2
Total
4
The Danish Property Federation’s Market Statistics - Vacancy, January 2021
Retail - Slight increase in vacancy In January 2021, retail vacancy is at 7.9 percent which is an increase of 0.1 percentage points compared to October 2020, but an increase of 0.9 percentage points compared to January 2020. Therefore, the retail vacancy is still below the average for the period 2000-2021, which is 6.8 percent. In the regions, there are increases in the Capital, Zealand and Southern Denmark of 0.1, 0.2 and 0.5 percentage points respectively while the retail vacancy decreases with 0.1 and 1.0 percentage points in Central Denmark and North Denmark respectively. These changes now mean that the North Denmark Region now has the lowest retail vacancy among the regions. Previously, the retail vacancy in the Central Denmark Region was lowest, but despite a quarterly decrease, the retail vacancy is 0.2 percentage points higher than in North Denmark. The decreases in the Central Denmark Region and the North Denmark Region are especially driven by decreases in Aarhus and Aalborg. In Aalborg, there is a relatively significant quarterly decrease of 1.8 percentage points, while there has been a decrease of 2.0 percentage points compared to January 2020. The decrease is not quite as large in Aarhus, it is still at 0.8 percentage points. If we look at the other cities, there are also decreases. Here, the retail vacancy decreases with 0.3 percentage points in both Copenhagen and Odense. Despite these decreases, there are still increases in the Capital Region and the Region of Southern Denmark, which is due to increases in the regions’ outer towns.
/ The North Denmark Region now has the lowest retail vacancy among the regions. /
/ The cities experience decrease in retail vacancy. /
5
The Danish Property Federation’s Market Statistics - Vacancy, January 2021
Economic vacancy rate January 2021 (percent)
Quarterly change (percentage points)
Annual change (percentage points)
7.7
0.1
1.0
Central Copenhagen
8.4
-0.3
1.7
Other City of Copenhagen
6.4
0.8
0.7
Northern Zealand
8.5
-0.3
0.5
Other Capital Region
7.9
0.1
0.8
8.7
0.2
1.1
Eastern Zealand
8.5
0.1
1.7
Western and Southern Zealand
8.9
0.2
0.6
10.4
0.5
1.3
Table 2. Retail
Capital Region
Region Zealand
The Region of Southern Denmark Odense
9.1
-0.3
3.5
Triangle Area
10.2
0.5
0.9
Other Southern Denmark
11.6
1.0
-0.1
6.8
-0.1
0.2
Aarhus
6.2
-0.8
-0.3
Other Central Denmark
7.8
0.9
1.0
6.6
-1.0
0.3
Aalborg
4.1
-1.8
-2.0
Other North Denmark
13.2
1.0
6.2
7.9
0.1
0.9
Central Denmark Region
North Denmark Region
Total
6
The Danish Property Federation’s Market Statistics - Vacancy, January 2021
Industry - Decrease in industrial vacancy In January 2021, the industrial vacancy is 9.5 percent. That is a decrease of 0.2 percentage points compared to last quarter and an increase of 1.2 percentage points compared to January 2020. The industrial vacancy is still below the average for the period 2000-2021, which is 11.5 percent. The national quarterly decrease is especially driven by decreases in the Capital Region and the Central Denmark Region. Here, the industrial vacancy decreases with 0.6 percentage points in both regions, while it decreases with 0.1 percentage points in the Region of Southern Denmark. Contrary, the industrial vacancy increases with 1.6 percentage points in Region Zealand and with 1.2 percentage points in North Denmark. Southern Denmark is thus the region with the lowest industrial vacancy in January 2021. Furthermore, it can also be seen that there has been an annual decrease of 0.6 percentage points in South Denmark.
/ The Region of Southern Denmark has the lowest industrial vacancy among the regions. /
At the other end, the Capital Region has an industrial vacancy of 11.1 percent. Despite a quarterly decrease, the industrial vacancy is higher in this region than in any of the other regions. All the areas of the region has an industrial vacancy of at least 9.9 percent, but all its areas, apart from North Zealand, have also seen a decrease in industrial vacancy compared to last quarter.
Economic vacancy rate January 2021 (percent)
Quarterly change (percentage points)
Annual change (percentage points)
11.1
-0.6
1.4
Central Copenhagen
13.4
-0.6
1.6
Other City of Copenhagen
11.2
-1.4
0.3
24.9
0.1
4.0
9.9
-0.4
1.2
10.2
1.6
3.8
Western and Southern Zealand
22.5
-0.4
4.8
The Region of Southern Denmark
6.0
-0.1
-0.6
8.9
-0.1
-0.6
6.5
-0.6
1.3
Aarhus
8.5
-1.4
-0.6
Other Central Denmark
5.1
0.1
2.2
6.4
1.2
-5.7
9.6
2.1
-2.5
9.5
-0.2
1.2
Table 3. Industry
Capital Region
Northern Zealand Other Capital Region Region Zealand
Triangle Area Central Denmark Region
North Denmark Region Aalborg Total
7
The Danish Property Federation’s Market Statistics - Vacancy, January 2021
Residential - unchanged residential vacancy In the residential sector, there is a complete standstill, both quarterly and annually. The residential vacancy is therefore still at 5.1 percent. Residential vacancy in January is therefore 1.6 percentage points higher than the average from the period 2000-2021. / Region Zealand with the lowest residential vacancy among the regions. /
/ Aarhus with the lowest residential vacancy. /
8
In the regions, there are both decreases and increases in residential vacancy. The Capital Region, Zealand and North Denmark all see decreases of 0.3, 0.6 and 0.2 percentage points compared to last quarter. Furthermore, there are also annual decreases in the three regions. Contrary, the residential vacancy increases in both the Region of Southern Denmark and Central Denmark with 0.5 and 1.0 percentage points respectively. The Region of Southern Denmark has been the region with the lowest residential vacancy for a long time, but due to the latest quarterly changes, it is now Region Zealand that can boast this. It means that the residential vacancy in the Region of Southern Denmark is 4.6 percent while it is 4.3 percent in Zealand. If we look closer at the Region of Southern Denmark, it can also be seen that there is an increase in all of its areas. In Odense, the decrease is 0.8 percentage points compared to last quarter and there is an increase of 1.5 percentage points compared to January 2020. This brings the residential vacancy to 5.4 percent in Odense. Historically, the residential vacancy in Odense has been the lowest among the cities, but it appears to change. Therefore, Aarhus is - just - the city with the lowest residential vacancy in Denmark with 5.3 percent. This is despite the fact that the residential vacancy in Aarhus has increased with 0.6 percentage points since last quarter and with 0.2 percentage points compared to January 2020. In Aalborg and Central Copenhagen, the residential vacancy is somewhat higher with 6.8 and 7.3 percent respectively. However, there has been a quarterly decrease in both cities.
The Danish Property Federation’s Market Statistics - Vacancy, January 2021
Economic vacancy rate
Table 4. Residential
January 2021 (percent)
Quarterly change (percentage points)
Annual change (percentage points)
4.8
-0.3
-0.1
Central Copenhagen
7.3
-0.6
0.2
Other City of Copenhagen
4.8
-0.1
-0.5
Northern Zealand
3.6
-1.2
0.2
Other Capital Region
4.8
-0.4
0.7
4.3
-0.6
-0.5
Eastern Zealand
3.4
-0.8
0.5
Western and Southern Zealand
4.7
-0.4
-1.0
The Region of Southern Denmark
4.6
0.5
0.7
Odense
5.4
0.8
1.5
Triangle Area
4.0
0.3
0.1
Other Southern Denmark
3.8
0.2
-0.4
Capital Region
Region Zealand
Central Denmark Region
5.9
1.0
0.4
Aarhus
5.3
0.6
0.2
Other Central Denmark
7.3
1.9
0.3
North Denmark Region
7.1
-0.2
-1.0
Aalborg
6.8
-0.1
-1.3
Other North Denmark
9.9
-1.0
2.7
5.1
0.0
0.0
Total
9
The Danish Property Federation’s Market Statistics - Vacancy, January 2021
10
The Danish Property Federation’s Market Statistics - Vacancy, January 2021
About the survey This web report is published on 2 March 2021. Next planned publication is May 2021 The portfolios have approx. 220,000 leases corresponding to an annual rental-bearing value of DKK 38.2bn and 35.4m m2. In comparison, the statistical base in January 2020 was 190,000 leases with an annual rental-bearing value of DKK 33,5 billion and 30,9 million m2. Today, 16,400 properties* are included in the market statistics. It is the current annual rent that is included in the calculation of the economic vacancy rate. The economic vacancy rate is defined as: The sum of current annual rent in all empty leases divided by the sum of current annual rent in both rented and empty leases. The Market Statistics is based on quarterly processed property data for rentals and vacancies within the period in question. Compared to previous publications, the balance date has been changed from the last day of the last quarter to the first day of this quarter. This web report has thus been closed as of 01 January 2021 and is called January 2021. The quarterly change is from January 2021 (settled as of 01 January 2021) compared to October 2020 (settled as of 01 October 2020). The annual change is from January 2021 (settled as of 01 January 2021) compared to January 2020 (settled as of 31 December 2019). The published market data is updated and valid on the day of publication. As the market statistics are continuously updated with e.g. new historical data, there may be updates of historical data. It has been chosen not to publish data in the statistics where the basis has been evaluated not to provide valid and representative data or in combinations where only one or a few portfolios are represented. * The number of properties include properties and parent properties. A property can include one or more buildings and one or more residences or office units. A parent property includes a property, in which there are apartments, which are registered as independent properties. For these units it is the parent properties that are counted and not each freehold apartment.
Further information If you want to know more about this publication, you can contact Director at the Danish Property
Morten Marott Larsen
The statistics are prepared based This report is based on data from 2 + 3 Ejendomme, Aberdeen Asset Management, Advice, Advodan, Akelius, Alm. Brand, Allan Kragh, ALN Holding, Andersen Partners Ejendomsadministration, Anker Bay Petersen, AP Pension, Arbejdernes Landsbank, Arkitekternes Pensionskasse, Arup & Hvidt, ATP Ejendomme, Azets A/S, Bagenkop Ejendomme A/S, Balder Ejendomme, Ballegaard Gruppen, Bangs Gård A/S, Bank Lauridsen, Barfoed Group, Bellevue 16 ApS, Bendtsen ApS, Bernstorrfhus, Bevica Fonden, Birch Ejendomme, BladhuseneApS, Blue Vision, Bodil og Co. I/S, Bolig Data Administration, Bolig og erhvervsudlejning I/S, Boligexperten Adm. A/S, Boliggruppen, Boligstandard ApS, BoStad A/S, Bregentved Gruppen, Brdr. Christiansens Boligudlejning, Broen Shopping, Bruno Dall, By & Havn, Calum A/S, Carlsbergfondet, CBRE, CEJ Ejendomsadministration, Cieslak Ejendomme, CK Holding Odense I/S, Claus Sørensen, CMNRE II FV181 PropCo ApS, CMNRE II Goose PropCo II A/S, Cobblestone, Coller Capital, Compaz Ejendomme A/S, Cosmo Ejendomme ApS, Connla Administration, CS Pensionsfond, CW Obel Ejendomme, DADES, Danica, Dansk Administrationscenter, Danagraf A/S, Dansk Sygeplejeråd, Danske Bank, Danske Shoppingcentre, DATEA, DEAS, DEAS Invest 1, De Københavnske Ejendomsselskaber, Demant Advokater, Difko, DIKEV, DIP, DK Ejendomme, DNP Ejendomme, Domhusgaarden Ejendomsadministration, Domis Ejendomme, Drachmann Ejendomsadministration, Dreist-Storgaard, DSB Ejendomme, Egen Vinding & Datter ApS, Ejd. Selskabet Dronning Olgas Vej 15 ApS, Ejendommen Hauchsvej 16 I/S, EjendomDanmark, Ejendomskontoret, Ejendomsselskaberne, Ejendomsselskabet af 15. maj 1895, Ejendomsselskabet Aunbøll A/S, Ejendomsselskabet Midtjylland ApS, Ejendomsselskabet NEMP, Ejendomsselskabet Thy, Ejendomsselskabet Østervold, Elverhøj Investment Group ApS, Estate Invest, Erhverv Aalborg, EV bolig, Fast Ejendom Danmark, Flemming Jeppsson, Flemming Olsen, Flemming Sørensen, Fokus Asset Management, Forskningsfondens Ejendomsselskab A/S, Frederiksberg Fonden, Freja Ejendomsadministration, Friheden Ejendomme A/S, Færchfonden, Goldschmidt Ejendomme A/S, Grosserer Schiellerup og Hustrus Fonde, Gudbjørg og Ejnar Honorés Fond, Grønløkkevej 10, Grønnegaarden Ejendomsselskab, Hans Nielsen, HEA Ejendomme, Hegela Erhvervsudlejning, Heimstaden, Helle Duun, Herbo-Administration A/S, Hestia, Hjørnet, Home Holbæk, Hovedstadens Ejendomsadministration, Hosta Ejendomme, Humlebogruppen, Højgaard Ejendomme, Højsager Plads ejendomme ApS, Håndværkerforeningen København, Industriens Pension, Investorgruppen, Jammerbugt Kommune, Jens Garfalk, Jeudan, JH Administration, JJ Ejendomsadministration, Jorcks Ejendomsselskab, JØP, Kaj Pedersen, Kalkværksgrundene, Kalvebod Ejendomme, Karberghus, Kayhan Development, KEBLOH ApS, Kereby A/S, KFI Erhvervsdrivende Fond, KIRKBI, KHK’s Legat, KGV Aarhus ApS, KLP Ejendomme, Koncenton, Kongeegen A/S, Kramers Legat, K/S Ingolf Nielsens Vej Sønderborg, K/S Roskilde Retail Park II, Københavns Kommune, Køge Kommune, Laros, Lars Wissing, LB Forsikring, Levring & Levring,Lindhart Ejendomsadministration, Lyngby Kommune, Lægernes Pensionskasse, Lærernes Pension, M7 Real Estate ApS, Michael WesthJensen, Midtbyens Ejendomme, Minova, Mogens Westh-Jensen, Moltzen Administration, Mogens Nielsen, Morten Norberg,MP Pension, MOWE Holding ApS, NEMO Ejendomsadministration, Nemp Ejendomsadministration, Niam, Niels Møller, Nielsen & Nielsen Ejendomme A/S, Nordea Ejendomme, Nordea Liv og Pension, North Property Asset Management, NREP, Odense Bolig ApS, Ole Hartvig, Palæ Ejendomsadministration A/S, PBU, Pears, PenSam, PensionDanmark, Pensionskassen for Farmakonomer, PFA, Pfeiffer Ejendomme ApS, PIA, Rasch-Andersen Ejendomme ApS, Rathleff Ejendomme, International, Pitzner Ejendomme, PKA, PN Ejendomme, Postbudenes Byggeforening, Probus, ProDomus, Qvortrup Administation A/S, Realdania, Revisorteamet, Roskilde Fællesbageri ApS, Rødovre Centrum A/S, Sampension, SEB, Samrådets Boligselskab / Dronning Louises Stiftelse, Siersbo ApS, Skovly Ejendomme, Sofus Administration ApS, SparNord Ejendomme Aalborg, Storck Holding, Svanholt Ejendomme, SPG Omsorg DK1, Steen & Strøm, Syddan A/S, Taurus Ejendomsadministration, TDC Pensionskasse, Thisted Kommune, Thylander Gruppen Sixpack, TLK Ejendomme, TLP ApS, Tom Jensen, Topdanmark, Totalbyg, Tox Development, Tryg, T.T. Invest ApS, UBSBOLIG A/S, Unico Finans ApS, Vagner P, Valby Maskinfabrik 1ApS, Valad, Valhal Estate A/S, VEA ApS, Vestjysk Ejendomsadministration ApS, Vestsjællandske Ejendomme ApS, Volantis A/S, VOPA Ejendomsadministration ApS, V.M. Brockhuus Ejendomme, Wagner Ejendomme, West Star Property Holding ApS, Wihlborg, Wind Administration, Øens Ejendomsadministration, Aalborg Boligadministration, Aage Larsens Boligudlejning and Aarhus Kommune.
mml@ejd.dk Phone 28 45 56 51
11
The Danish Property Federation’s Market Statistics - Vacancy, January 2021
Appendix Figure 3. Spatial vacancy rate, January 2021 10.7 9.4
9.0
7.9 6.6 4.9
Office
Retail
Industry
Residential
Other Business
Total
Change in percentage points
Change in percentage points
Change in percentage points
Change in percentage points
Change in percentage points
Change in percentage points
Quarter
Year
Quarter
Year
Quarter
Year
Quarter
Year
Quarter
Year
Quarter
Year
0.2
-0.4
0.0
0.6
-0.4
0.7
0.1
0.2
-0.8
-0.7
-0.1
-0.3
Source: The Danish Property Federation’s market statistics. Note.: The vacancy rates for all sectors also include actual annual rent and space for other commercial and secondary spaces.
12
The Danish Property Federation’s Market Statistics - Vacancy, January 2021
Spatial vacancy rate January 2021 (percent)
Quarterly change (percentage points)
Annual change (percentage points)
10.6
0.3
-0.1
Central Copenhagen
8.6
0.4
3.1
Other City of Copenhagen
8.2
-0.2
0.5
Northern Zealand
10.2
-2.2
-7.0
Other Capital Region
13.7
1.3
-1.0
13.5
0.9
-1.3
Eastern Zealand
16.4
3.1
2.1
Western and Southern Zealand
11.8
-0.3
-3.2
The Region of Southern Denmark
14.1
0.3
-1.3
Odense
9.6
-0.6
0.7
Triangle Area
16.5
2.2
-5.3
Other Southern Denmark
17.5
-0.2
-0.5
Table 5. Office
Capital Region
Region Zealand
Central Denmark Region
8.2
-0.7
-0.6
Aarhus
6.9
-0.7
-0.6
Other Central Denmark
11.6
-0.7
0.3
North Denmark Region
10.9
-0.6
-2.9
Aalborg
10.0
-0.2
-1.7
Other North Denmark
15.2
-1.8
-11.5
10.7
0.2
-0.4
Total
13
The Danish Property Federation’s Market Statistics - Vacancy, January 2021
Spatial vacancy rate
January 2021 (percent)
Quarterly change (percentage points)
Annual change (percentage points)
7.2
0.0
0.5
Central Copenhagen
7.8
0.0
1.0
Other City of Copenhagen
5.7
0.6
0.2
Northern Zealand
8.5
-0.9
-0.8
Other Capital Region
7.8
-0.2
1.0
8.3
0.3
0.4
Eastern Zealand
6.2
0.4
0.5
Western and Southern Zealand
10.0
0.3
0.3
The Region of Southern Denmark
10.6
0.3
1.5
Odense
9.6
-0.3
3.6
Triangle Area
10.6
0.0
-1.2
Other Southern Denmark
11.4
0.9
2.0
7.0
-0.4
-1.1
Aarhus
6.1
-0.5
-2.1
Other Central Denmark
8.2
-0.3
0.2
9.5
-0.7
3.5
Aalborg
4.0
-1.9
-2.3
Other North Denmark
17.3
1.1
11.9
7.9
0.0
0.6
Table 6. Retail
Capital Region
Region Zealand
Central Denmark Region
North Denmark Region
Total
14
The Danish Property Federation’s Market Statistics - Vacancy, January 2021
Spatial vacancy rate January 2021 (percent)
Quarterly change (percentage points)
Annual change (percentage points)
11.3
-0.6
1.4
Central Copenhagen
18.3
-0.7
1.3
Other City of Copenhagen
13.2
0.1
2.3
Northern Zealand
22.8
-0.2
3.3
Other Capital Region
9.7
-0.7
0.9
Table 7. Industry
Capital Region
Region Zealand
14.1
-0.8
5.3
Western and Southern Zealand
28.8
-2.5
7.7
The Region of Southern Denmark
5.2
0.0
-2.4
8.0
-0.6
-0.7
6.8
-0.4
0.5
Aarhus
10.3
-1.9
-2.2
Other Central Denmark
4.8
0.5
1.8
5.6
0.5
-6.8
8.8
1.0
-4.2
9.4
-0.4
0.7
Triangle Area Central Denmark Region
North Denmark Region Aalborg Total
15
The Danish Property Federation’s Market Statistics - Vacancy, January 2021
Spatial vacancy rate
Table 8. Residential
January 2021 (percent)
Quarterly change (percentage points)
Annual change (percentage points)
4.4
-0.2
0.1
Central Copenhagen
6.0
-0.5
0.1
Other City of Copenhagen
4.3
0.0
-0.3
Northern Zealand
3.7
-1.1
0.3
Other Capital Region
4.3
-0.2
0.7
Capital Region
Region Zealand
4.9
-0.5
-0.5
Eastern Zealand
3.1
-0.8
0.9
Western and Southern Zealand
5.5
-0.4
-1.0
The Region of Southern Denmark
4.5
0.5
0.9
Odense
5.1
0.7
1.5
Triangle Area
4.1
0.3
0.3
Other Southern Denmark
3.9
0.2
0.2
Central Denmark Region
6.0
1.1
0.5
Aarhus
5.2
0.7
0.4
Other Central Denmark
7.3
1.7
0.1
7.1
-0.4
-0.9
Aalborg
6.6
-0.2
-1.3
Other North Denmark
10.8
-1.5
2.3
4.9
0.1
0.2
North Denmark Region
Total
16