January 2019
The Danish Property Federation Market Statistics – vacancy • The trend of decreasing vacancy is continuing • The positive tendencies are widely founded with a decrease in vacancy in all sectors of up to two percent over the last year. • The higher rental rates over the last year gives increased annual earnings for the business of DKK 1.9bn. • The decrease in residential vacancy is led by increased rental rates in Copenhagen and Aarhus • Increased rental in shopping centres pulls the retail vacancy down
Increased rental in all sectors ensures the business increased earnings of DKK 1.9bn The property business follows the strong development in Danish economy. The vacancy in the fourth quarter of 2018 decreased overall with 0.4 percentage points to 6.2 percent in January 2019. The positive development applies to all sectors and if we look at the development over the last year, the vacancy has decreased with up to two percentage points in all sectors. Overall, we are looking at an annual decrease in vacancy of 1.7 percentage points. This corresponds to increased annual earnings for the business of DKK 1.9bn. If you go further back to 2013, when the vacancy was at its peak, the decrease in vacancy corresponds to increased earnings for landlords of DKK 4.6bn.
Decreasing vacancy in all sectors increases the business’ earnings by DKK 1.9bn in a year.
Compared to the structural vacancy level of an average of 3.9 percent, the vacancy of all sectors is still 2.3 percentage points higher. It means that there is still a rental potential of DKK 2.3bn. This especially applies to the rental of residential in North Jutland, office in the Region of Southern Denmark and retail facilities in Region Zealand. On the other hand, some areas of
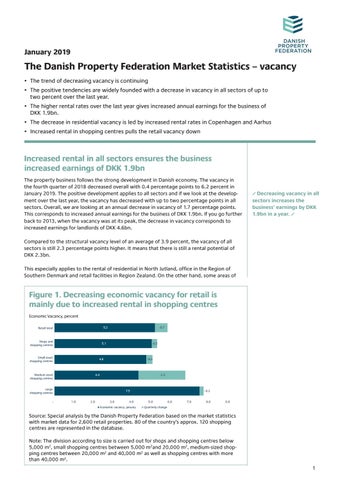
Figure 1. Decreasing economic vacancy for retail is mainly due to increased rental in shopping centres Economic Vacancy, percent - 0.7
5.2
Retail total
Shops and shopping centres
- 0.3
5.1
Small sized shopping centres
- 0.3
4.8
Medium sized shopping centres
- 2.4
4.4
Large shopping centres -
7.5 1.0
2.0
3.0
4.0
Economic vacancy, january
- 0.2
5.0
6.0
7.0
8.0
9.0
Quarterly change
Source: Special analysis by the Danish Property Federation based on the market statistics with market data for 2,600 retail properties. 80 of the country’s approx. 120 shopping centres are represented in the database. Note: The division according to size is carried out for shops and shopping centres below 5,000 m2, small shopping centres between 5,000 m2and 20,000 m2, medium-sized shopping centres between 20,000 m2 and 40,000 m2 as well as shopping centres with more than 40,000 m2.
1