April 2021
The Danish Property Federation’s Market Statistics – Consensus Forecast • Decreasing total return • Record market rent in industrial properties. • Retail rent has decreased the last seven years • Uncertainty about capital values in 2023
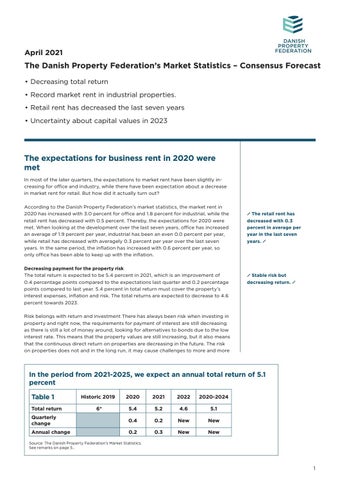
The expectations for business rent in 2020 were met In most of the later quarters, the expectations to market rent have been slightly increasing for office and industry, while there have been expectation about a decrease in market rent for retail. But how did it actually turn out? According to the Danish Property Federation’s market statistics, the market rent in 2020 has increased with 3.0 percent for office and 1.8 percent for industrial, while the retail rent has decreased with 0.5 percent. Thereby, the expectations for 2020 were met. When looking at the development over the last seven years, office has increased an average of 1.9 percent per year, industrial has been an even 0.0 percent per year, while retail has decreased with averagely 0.3 percent per year over the last seven years. In the same period, the inflation has increased with 0.6 percent per year, so only office has been able to keep up with the inflation. Decreasing payment for the property risk The total return is expected to be 5.4 percent in 2021, which is an improvement of 0.4 percentage points compared to the expectations last quarter and 0.2 percentage points compared to last year. 5.4 percent in total return must cover the property’s interest expenses, inflation and risk. The total returns are expected to decrease to 4.6 percent towards 2023.
The retail rent has decreased with 0.3 percent in average per year in the last seven years.
Stable risk but decreasing return.
Risk belongs with return and investment There has always been risk when investing in property and right now, the requirements for payment of interest are still decreasing as there is still a lot of money around, looking for alternatives to bonds due to the low interest rate. This means that the property values are still increasing, but it also means that the continuous direct return on properties are decreasing in the future. The risk on properties does not and in the long run, it may cause challenges to more and more
In the period from 2021-2025, we expect an annual total return of 5.1 percent Table 1 Total return
Historic 2019
2020
2021
2022
2020-2024
6*
5.4
5.2
4.6
5.1
Quarterly change
0.4
0.2
New
New
Annual change
0.2
0.3
New
New
Source: The Danish Property Federation’s Market Statistics. See remarks on page 5..
1
The Danish Property Federation’s Market Statistics - Consensus Forecast, April 2021
properties as the economy in the properties may become under pressure e.g. towards increase in interest rates. There is uncertainty about 2023, when 34 percent of the participants expect a total return of below 5 percent and 36 percent expect that the total return decreases from 2021 to 2023. This third of the participants are nervous that the continuously increasing requirements to payment of interest do not last as well as the introduction of a new inventory tax that affects the investment properties. The effect of the inventory tax ought to be included in the market prices by now. However, it is not unlikely that when the inventory tax is introduced in 2023, it may cause the capital value to decrease and then, the total return will also decrease.
/ 36 percent of the participants believe in a decrease in total return from 2021 to 2023. / / Inventory tax on properties causes uncertainty. /
Industrial best on all parameters Industrial properties obtain the best measuring for capital value, occupied space and market rent. The expectations to industrial are the best in the 10 years of measuring expectations. Residential is second in the measuring with an expectation of an increase in capital value while occupied space and market rent are almost neutral. It means that there may be expectations of continued decreases in the requirement to payment of interest for residential.
Figure 1. The participants’ expectations To 2023
6%
34 %
Expect a total return of 7 percent or more.
Development in total yield from 2021 to 2023
23 %
11 %
expect a total return of 5 percent or less.
Expect a total return of 7 percent or more.
7 eller derover
Mellem 7 og 6
36 %
40 %
expect a decrease in total yield.
49 %
Mellem 6 og 5
expect an increase in total yield.
under 5
expect an unchanged total yield. Stigende
expect a total yield between 6 and 5 percent.
Uændret
Faldende
The expectations to the market rent for retail is historically low (The indicator values between -100 and 100) Table 2
Capital value
Occupied space
April 2021
Quarterly change
Annual change
Office
16.0
0.0
Retail
-39.4
0.6
Industry
27.7
15.7
2.1
Residential
23.4
7.4
30.1
Market rent
April 2021
Quarterly change
Annual change
April 2021
Quarterly change
-11.8
-14.9
-10.9
-13.8
-33.0
4.0
12.8 3.2
Annual change
23.8
7.4
4.4
-11.4
-7.4
-40.4
5.6
-14.9
2.8
-1.7
26.6
17.6
9.9
4.2
9.9
6.4
1.4
17.5
Source: The Danish Property Federation’s Market Statistics. The participants have answered: ”Much lower”, ”lower”, ”unchanged”, ”higher” and ”much higher” on the question: ”What are your expectations to the development of [sector] buildings with prime location in a year compared to today?” The answers are given a value in order to achieve an indicator between -100 and 100. An indicator of 100 means that everybody has answered “much higher”, and -100 means that everybody has answered “much lower”. Indicator zero states expectations to unchanged conditions. An indicator of 16.0 may for example be obtained by 16.0 percent of the participants corresponding ”much higher” and the remaining corresponding ”unchanged”.
2
The Danish Property Federation’s Market Statistics - Consensus Forecast, April 2021
For office, there is an expectation that the capital value and the market rent may stay at the same level, but a slight increase in vacancy is expected - likely due to the Corona crisis. The Corona crisis can especially be seen for retail properties. A small reopening may help the money flow right now, but the participants are still expecting a decrease in capital value, occupied space and market rent. Compared to last quarter, there is a small improvement for retail.
Record market rent in industrial properties.
Highest expectations to Copenhagen A total of 87 % of the participants are expecting that the capital values will develop the most in Copenhagen and compared to last quarter, the support has become slightly bigger. After Copenhagen, the support is biggest for Aarhus, the Triangle Area, Odense, Aalborg and the rest of the country.
Figure 2. The total return is expected to drop in the next few years 20% 18% 16% 14% 12% 10% 8% 6% 4% 2% 0% 2000 2001 2002 2003 2004 2005 2006 2007 2008 2009 2010 2011
2012 2013 2014 2015 2016 2017 2018 2019 2020 2021 2022 2023
Source: The Danish Property Federation’s Market Statistics. Total return of investment properties. From 2011 to 2020, the total yield from the Danish Property Federation’s market statistics is shown, while 2000 to 2010 is own calculations based on data from the IPD Danish Property Index. 2021 to 2023 shows the average of the answers in the Danish Property Federation’s market statistics - expectations. 50 percent of the answers are within the blue lines.
3
The Danish Property Federation’s Market Statistics - Consensus Forecast, April 2021
Figure 3. Capital values are expected to develop the most in Copenhagen Regional Regional indicator indikator Least regional growth Mindst regional vækst
growth Medium regionalvækst Middel regional Anholt Anholt
Largest regionalvækst growth Størst regional
Rømø Rømø
Source: The Danish Property Federation’s Market Statistics.
4
The map shows the areas in Denmark where the capital value of investment properties are expected to increase the most compared to the other areas. We have asked about the Triangle area, Copenhagen, Aarhus, Aalborg, Odense and the rest of Denmark. The answers have formed an indicator. If an area is light blue, at least 70% of the respondents have agreed that this area is doing better than the others.
The Danish Property Federation’s Market Statistics - Consensus Forecast, April 2021
About the survey These are the expectations for April 2021 from the Danish Property Federation’s Market Statistics. The aim is to create information for a more transparent property market. The survey is published every quarter and is completely and utterly dependent on the participating companies being willing to report data every quarter. Without these companies, the survey would never become a reality.
50 market players have participated in this survey. 48 percent of the participants are property owners. In addition, 12 percent are property administrators, 20 percent are commercial brokers, 6 percent are banks/mortgage providers and 14 percent are other players.
The following companies have contributed Aberdeen Asset Management, Agat ejendomme, ATP Ejendomme, BBN Consult, Bertélco Ejendomme A/S, Carlsberg Byen, CBRE, Chr. Hjorth Erhvervsejendomme, Colliers, Copenhagen Capital, Cura Management, DADES, Danbolig erhverv Johnny Hallas, Danica Ejendomme, DEAS, EDC Erhverv Poul Erik Bech, EK-Ejendomsadministration A/S, Elf Development, EY, Fokus Asset Management, Heimdal Nordic, Heimstaden, Hosta Ejendomme, Jeudan, Jyske Bank, Karberghus, Keystone, KFI Erhvervsdrivende Fond, KLP ejendomme, Lintrup & Norgart, Lokalebasen.dk A/S, Lundsgaard Erhverv, Lægernes Pensionskasse, M7 Real Estate, M. Goldschmidt Ejendomme, Minova, NCC Construction Danmark A/S, Newsec Advisory, Newsec Property Asset Management Denmark, Niam, Nordea, Nordicals, Nykredit, P+, Patrizia, PBU – Pædagogernes Pension, Pensam, PensionDanmark, PFA Ejendomme, PKA, Probus Ejendom og Investering, Prodomus, PwC, Qvortrup Administration, Realdania, Realkredit Danmark, Sampension, Sinding Gruppen, STAD Erhverv, Taurus Ejendomsadministration, Thor Stevnss Real Estate, Thylander Gruppen, TLK, Topdanmark Ejendom, Wiborg & Partnere, Øens Advokatfirma og Ejendomsadministration.
Further information If you wish to know more about this publication please contact Director in the Danish Property Federation
Morten Marott Larsen mml@ejd.dk Phone +45 28 45 56 51
Remarks for table 1 The table indicates the average total return based on the replies for the years 2020-2024. The total return is in percent and measures the return investment properties in relation to the size of the investment in a given period. The total return includes two types of return: Direct return and return on value. The direct return is the period’s ongoing net operating results divided by the investment size in the beginning of the period. Return on value is the value increment in the given period divided by the size of the investment at the beginning of the period. The total return is before any financial costs and inflation. The historic total yield may change slightly in the future when new data is added to the market statistics.
5