THE DANISH PROPERTY FEDERATION CONSENSUS FORECAST COVERING THE PROFESSIONAL INVESTMENT PROPERTY MARKET IN DENMARK JULY 2012
From decrease to a small increase in expectations for total return
WEB REPORT
The negative development diminishes 2012 Total return (%)
5.3
2013
2014
5.7
2012-2016
6.0
6.0
Quarterly change
0.2
0.1
-0.1
0.1
Annual change
-1.0
-1.1
new
new
Source: The Danish Property Federation.
Û
In this quarter’s consensus forecast there are positive signs although small. Compared to last quarter the participants now expect a higher total return for Danish investment properties in 2012 and 2013. The expectations for the coming years have been decreasing the last three quarters. When comparing this quarter’s forecast with last year’s July forecast, there is a decrease in the expectations for the return of 1.0 percentage points for 2012 and 1.1 percentage points for 2013. The total return in 2012 is expected to be 5.3 percent. This is an increase of 0.2 percentage points compared to last quarter. This is the first time in three quarters that return expectations are increasing The expected total return is still at a moderate 5.7 percent for 2013. The expectations for total return in 2014 decrease with 0.1 percentage points to 6.0. In a five years period ending in 2016 the participants believe in an average annual total return of 6.0. In January 2011 the participants expected a total return of 6.3 per cent in 2012. Now they expect a total return of 5.2 per cent. The property market is expecting an increase compared to the 4.7 per cent in 2011, however economic growth has been slower than expected.
The average total return based on the replies is presented in the table. Quarterly and annual changes are in percentage points.
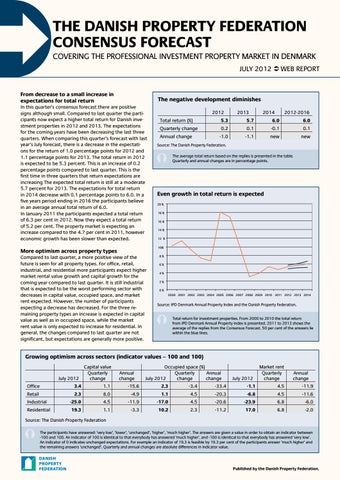
Even growth in total return is expected 20 % 18 % 16 % 14 % 12 % 10%
More optimism across property types
8% 6% 4% 2% 0%
Source: The Danish Property Federation.
2000 2001 2002 2003 2004 2005 2006 2007 2008 2009 2010 2011 2012 2013 2014
Source: IPD Denmark Annual Property Index and the Danish Property Federation.
Û
Compared to last quarter, a more positive view of the future is seen for all property types. For office, retail, industrial, and residential more participants expect higher market rental value growth and capital growth for the coming year compared to last quarter. It is still industrial that is expected to be the worst performing sector with decreases in capital value, occupied space, and market rent expected. However, the number of participants expecting a decrease has decreased. For the three remaining property types an increase is expected in capital value as well as in occupied space, while the market rent value is only expected to increase for residential. In general, the changes compared to last quarter are not significant, but expectations are generally more positive.
Total return for investment properties. From 2000 to 2010 the total return from IPD Denmark Annual Property Index is presented. 2011 to 2013 shows the average of the replies from the Consensus Forecast. 50 per cent of the answers lie within the blue lines.
Growing optimism across sectors (indicator values – 100 and 100)
July 2012
Capital value Quarterly change
Annual change
Occupied space (%) Quarterly Annual July 2012 change change
July 2012
Market rent Quarterly change
Annual change
Office
3.4
1.1
-15.6
2.3
-3.4
-33.4
-1.1
4.5
-11.9
Retail
2.3
8.0
-4.9
1.1
4.5
-20.3
-6.8
4.5
-11.6
Industrial
-25.0
4.5
-11.9
-17.0
4.5
-20.6
-23.9
6.8
-6.0
Residential
19.3
1.1
-3.3
10.2
2.3
-11.2
17.0
6.8
-2.0
Source: The Danish Property Federation
Û
The participants have answered: ‘very low’, ‘lower’, ‘unchanged’, ‘higher’, ‘much higher’. The answers are given a value in order to obtain an indicator between -100 and 100. An indicator of 100 is identical to that everybody has answered ‘much higher’, and -100 is identical to that everybody has answered ‘very low’. An indicator of 0 indicates unchanged expectations. For example an indicator of 19.3 is feasible by 19.3 per cent of the participants answer ‘much higher’ and the remaining answers ‘unchanged’. Quarterly and annual changes are absolute differences in indicator value.
Published by the Danish Property Federation.