“The Last-Mile Oddyssey”: An
Exploratory Approach for Spaces of Transitions
A Thesis submitted to Rizvi College of Architecture Affiliated to University of Mumbai.
By Hussain. Mansur. Lakdawala
In Partial Fulfilment of the Requirements for the Degree of Bachelor of Architecture
Academic Year 2023-24
This is to certify that the following report titled “The
Last-Mile Oddyssey”: An
Exploratory
Approach
for Spaces of Transitions is the bonafide work of Hussain Mansur Lakdawala
Roll No: 1914
Exam Seat No: MU1914
Submitted to the faculty of Rizvi College of Architecture For Design Dissertation
Semester IX, B.Arch Of
University of Mumbai During the academic year 2023-2024
Prof. Meera Malegaonkar
I.C principal
Rizvi college of Architecture
College stamp
Prof. Probuddha Mukherjee Thesis Guide
Rizvi college of Architecture
I Hussain Lakdawala I Sem IX - X I Design Dissertation I Rizvi 2
Certificate
I hereby declare that the report entitled “The Last-Mile Oddyssey”: An Exploratory Approach for Spaces of Transitions submitted by me, for the fulfilment of the Bachelors in Architecture at ‘Rizvi College of Architecture’, Mumbai is a record of the Design Dissertation carried out by me under the super vision of Prof. Probuddha Mukherjee. I further declare that this written submission represents my ideas in my own words and where other’s ideas or words have been included, I have adequately cited and referenced the original sources.
I affirm that I have adhered to all principles of academic honesty and integrity and have not misrepresented or falsified any idea / data / fact / source to the best of my knowledge.
I understand that any violation of the above will cause for disciplinary action by the Institute and can also evoke penal action from the sources which have not been cited properly.
Place: Mumbai
Date: 22nd October, 2023.
Name: Hussain Mansur Lakdawala Rizvi college of Architecture
Student’s signature
I Hussain Lakdawala I Sem IX - X I Design Dissertation I Rizvi 3 Declaration
Acknowledgment
As I proceed towards the end of my Bachelor in Architecture, I would like to take this opportunity to express my deep gratitude and appreciation to all those who have helped me achieve this.
Most importantly, I would like to thank my Family (Mom, Dad, and my Sister) for their unwavering support, encouragement, and love throughout this journey. Your belief in me and your sacrifices have been a constant source of motivation.
I am profoundly grateful to my Thesis Guide, Prof. Probuddha Mukherjee, for his guidance, and patience throughout this research. His invaluable insights, dedication, and mentorship have been instrumental in shaping this work.
To all my friends, Batul, Swaroop, Zahra, Anas, Salman, Soheb, Sami, Mehek and Khalid, and my classmates (Batch of 2019) who have been constants throughout this journey with whom I have shared both the challenges and triumphs of this expedition. Thank you!!
Lastly, I am deeply indebted to Rizvi College of Architecture for providing the necessary resources, facilities, and a conducive academic environment that allowed me to pursue this research.
I Hussain Lakdawala I Sem IX - X I Design Dissertation I Rizvi 4
1. Abstract
Background
3. Why Mumbai?
4. Introduction
4.1. Aim
4.2. Objective
4.3. Research questions
4.4. Problem statement
4.5. Hypothesis
4.6. Scope
4.7. Limitations
5. Methodology
6. Review of Literature
6.1. Sustainable urban transport in India
6.2. Mumbai Metropolitan Region - Guided development
6.3. Last-Mile connectivity in the Indian scenario - A Literary review
6.4. A Proposed roadmap to enhance Last-Mile connectivity in India’s Metro rail transit systems
6.5. Transit Oriented Development and its impact on Level of service of Roads and Metro: A Case study of Mumbai Metro line- 1
I Hussain Lakdawala I Sem IX - X I Design Dissertation I Rizvi 6 Contents Content
2.
Pg.no 12-15 16-19 20-25 26-35 29 30-31 32 33 34 35 35 36-37 38-53 39-41 42-44 45-47 48-50 51-52
7. Study of cases
7.1. Virar suburban railway station
7.2. Bandra suburban railway station
7.3. Andheri suburban railway station
7.4. Andheri Metro railway station
7.5. Thane Bus station
7.6. Ghatkopar Train and Metro station
8. Conceptual Framework
9. Design Program
9.1. Secondary case studies
9.2. Design Program
9.3. Operational Framework
10. Potenial sites
10.1. Andheri Train and Metro station
10.2. Bandra Railway station
10.3. Virar Railway station
10.4. Ghatkopar Train and Metro station
10.5. Conclusion
11. Appendix
11.1. Questionnaire
12. Bibliography
12.1. Refrences
12.2. Bibliography
I Hussain Lakdawala I Sem IX - X I Design Dissertation I Rizvi 7 Content
Pg.no 54-73 56-58 59-61 62-64 65-67 68-69 70-73 74-75 76-85 77-81 82-83 84-85 82-105 86-91 92-95 96-99 100-103 104-105 106-107 107 108-111 109 110-111
List of figures
Fig 1.1. Flow chart explaining advantages of Last-Mile Connectivity (Author)
Fig 2.1. Diagram explaining the concept of Last-Mile connectivity (Author)
Fig 3.1. Statistics showing modal shift in Mumbai (Will Geary,2021)
Fig 3.2. Statistics showing Population growth in Metro cities of India (Will Geary,2021)
Fig 3.3. Statistics showing registered cars in Metro cities of India (Will Geary,2021)
Fig 3.4. Statistics showing modal shift in Mumbai (Will Geary,2021)
Fig 3.5. Statistics showing the Average road-length of Metro cities in India (Will Geary,2021)
Fig 3.6. Statistics showing the Population density of Metro cities in India (Madhvi Pai ,2005)
Fig 3.7. Statistics showing Population Growth of Metro cities in India (Madhvi Pai ,2005)
Fig 3.8. Statistics showing Average trip lengths of Metro cities in India (Madhvi Pai ,2005)
Fig 3.9. Statistics showing Modal shares in Mumbai (Rao,2016)
Fig 3.10. Diagram showing the use of private transport over public transport (Madhvi Pai ,2005)
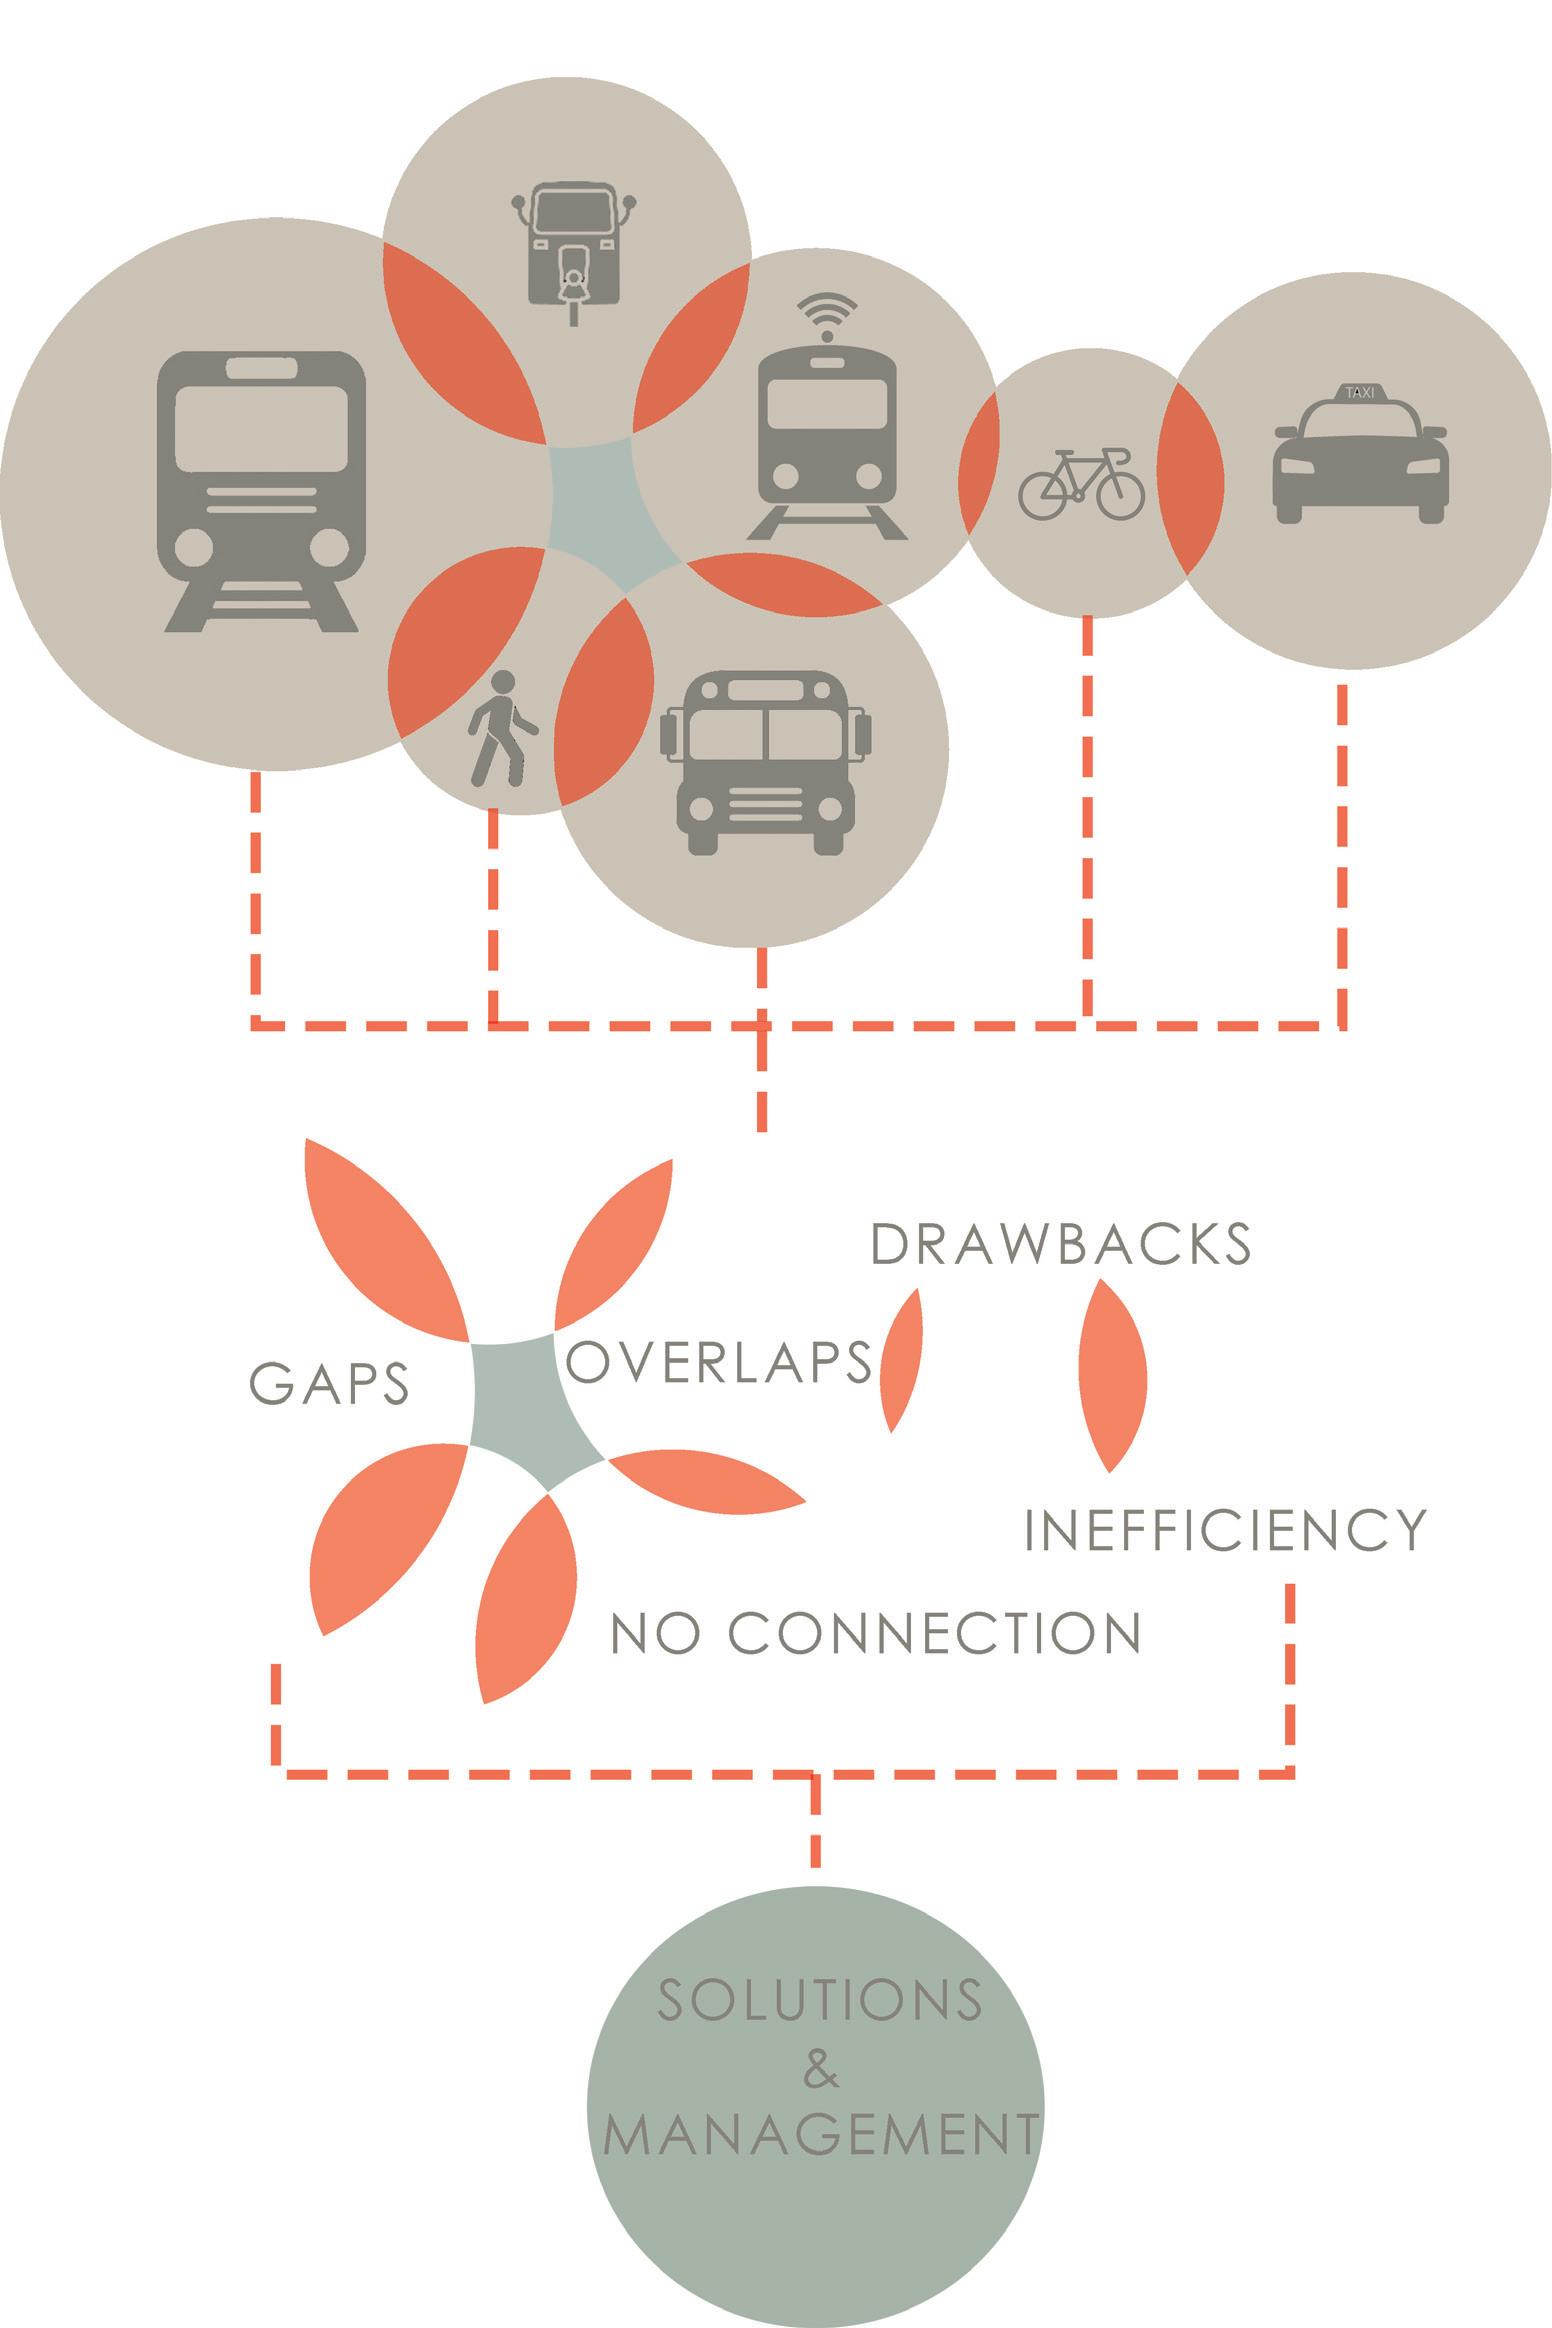
Fig 4.1.1. Gaps and overlaps in different modes of transport facilities (Author)
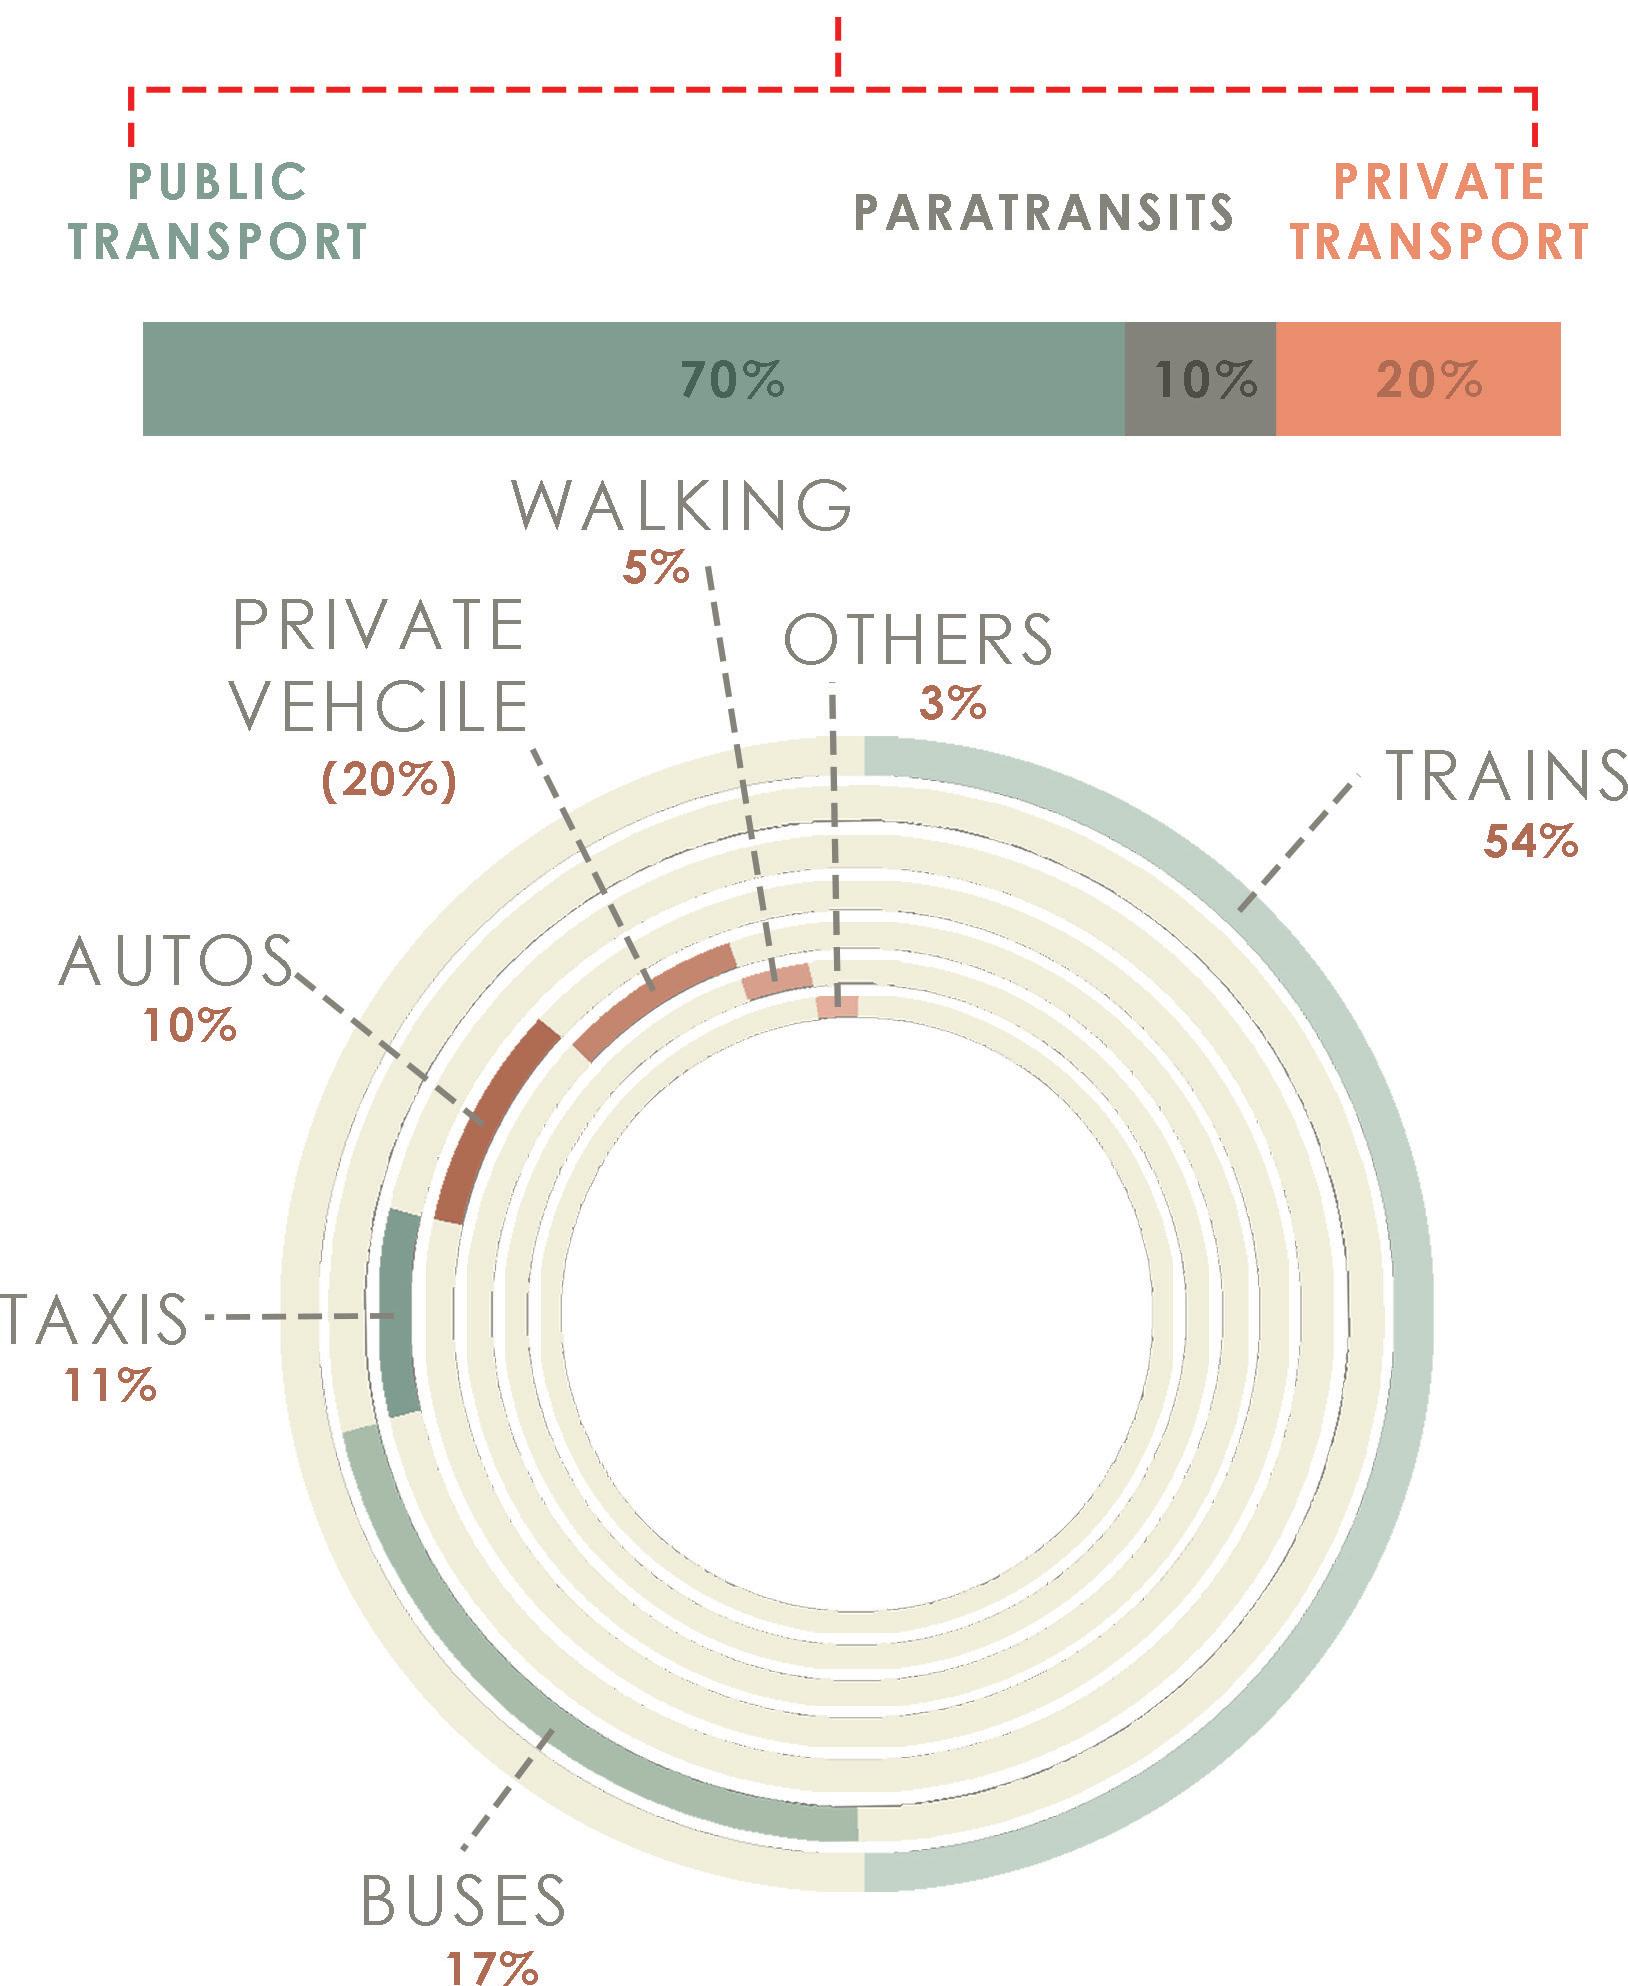
Fig 4.2.1. Transports used in MMR region (Author)
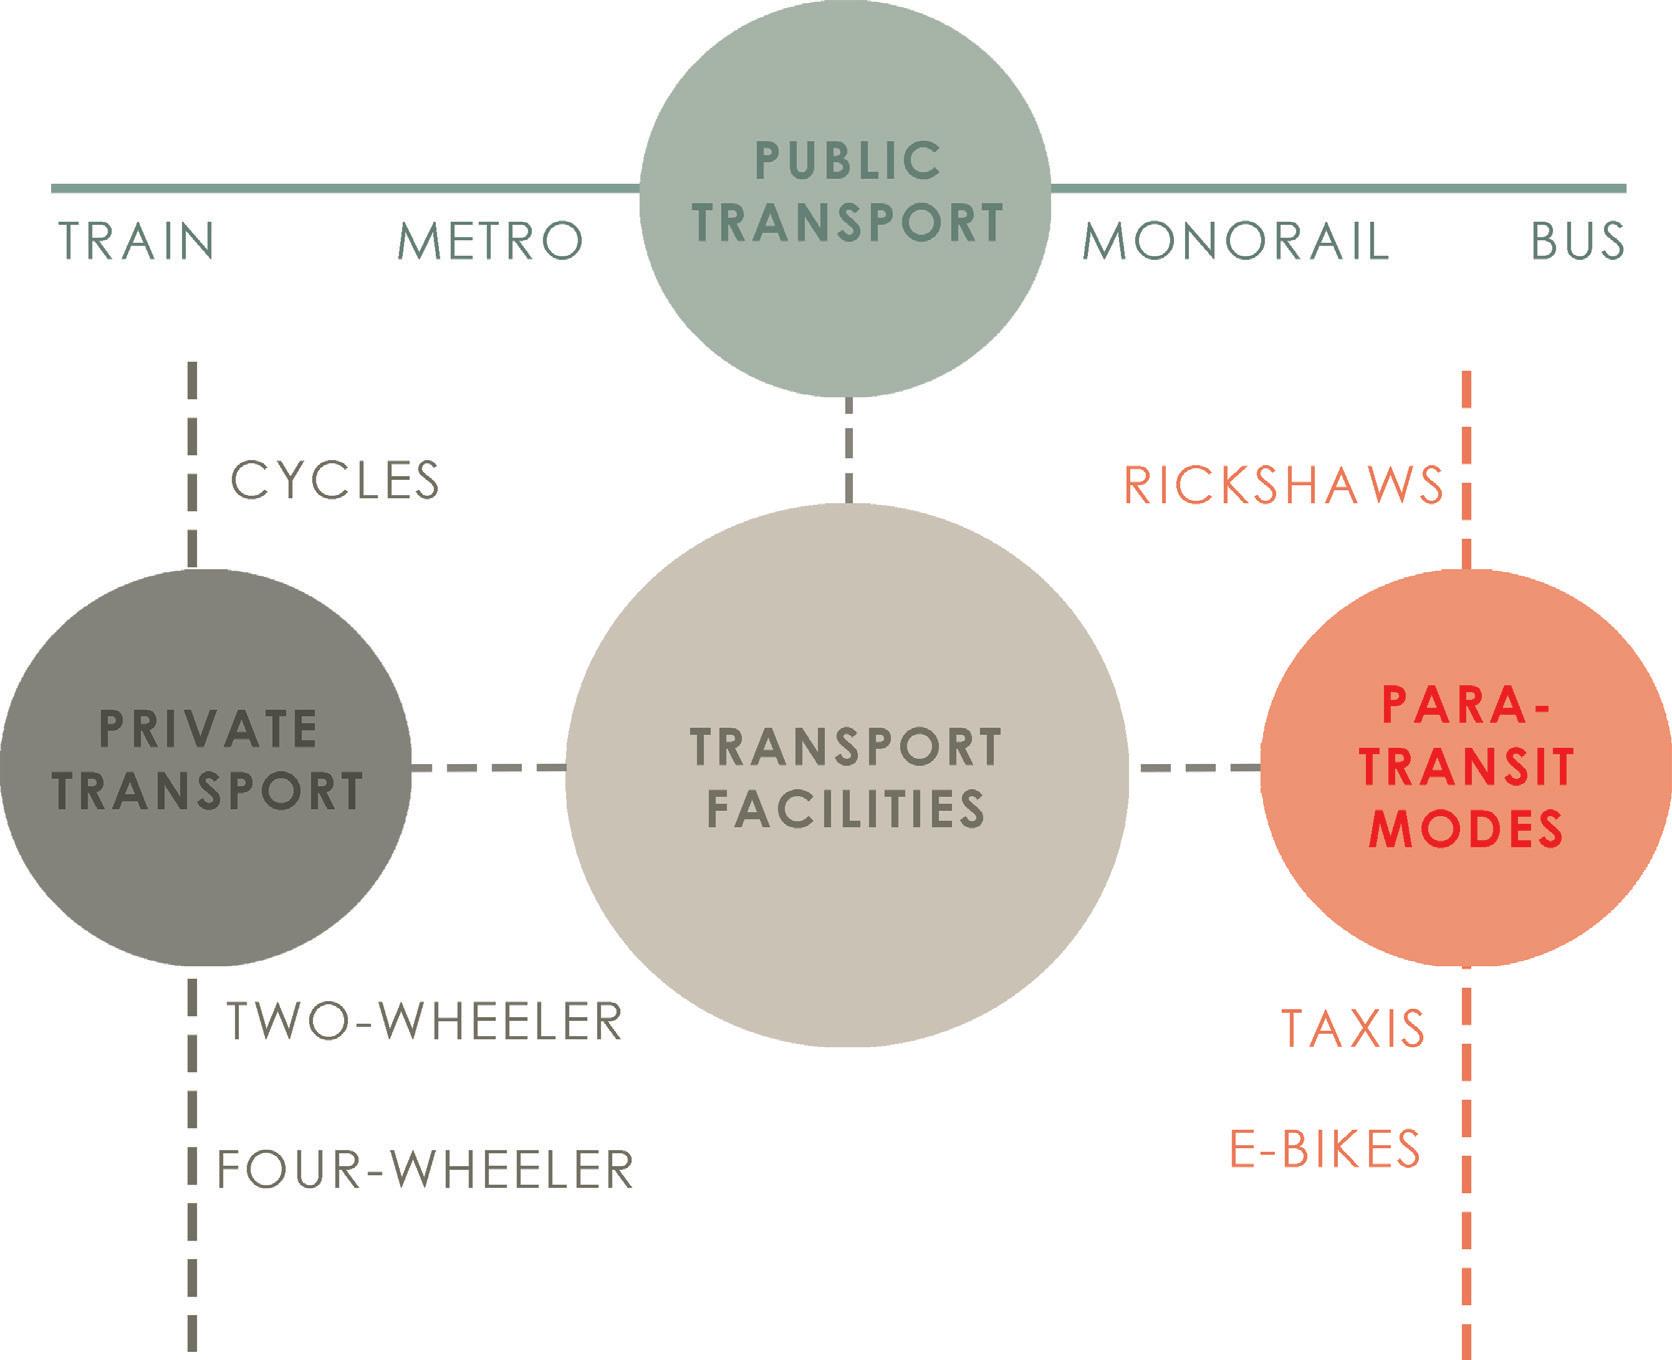
Fig 4.2.2. Different modes of transport available in MMR region (Author)
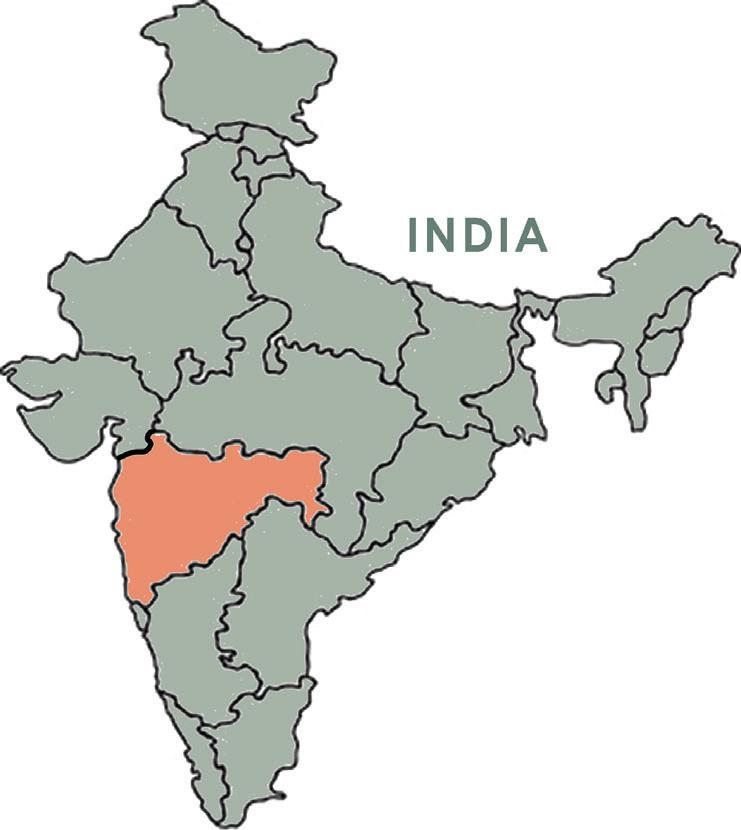
Fig 4.4.1. Map of India (Author)
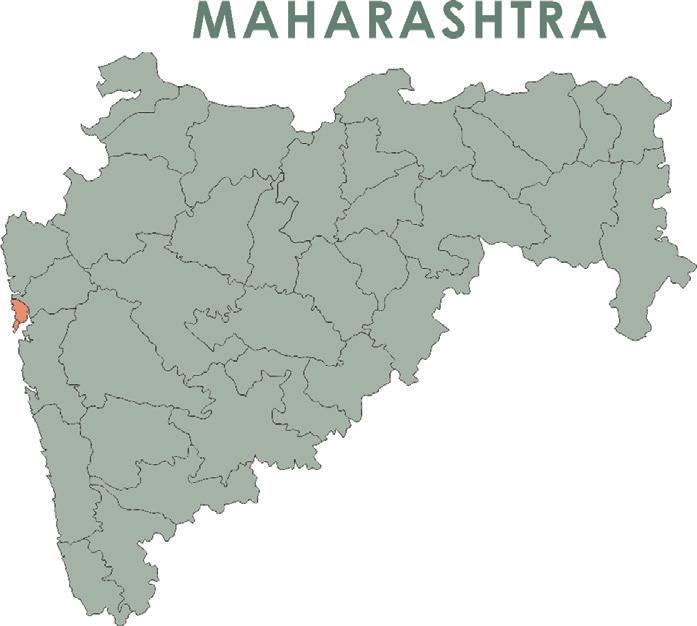
Fig 4.4.2. Map of Maharashtra (Author)
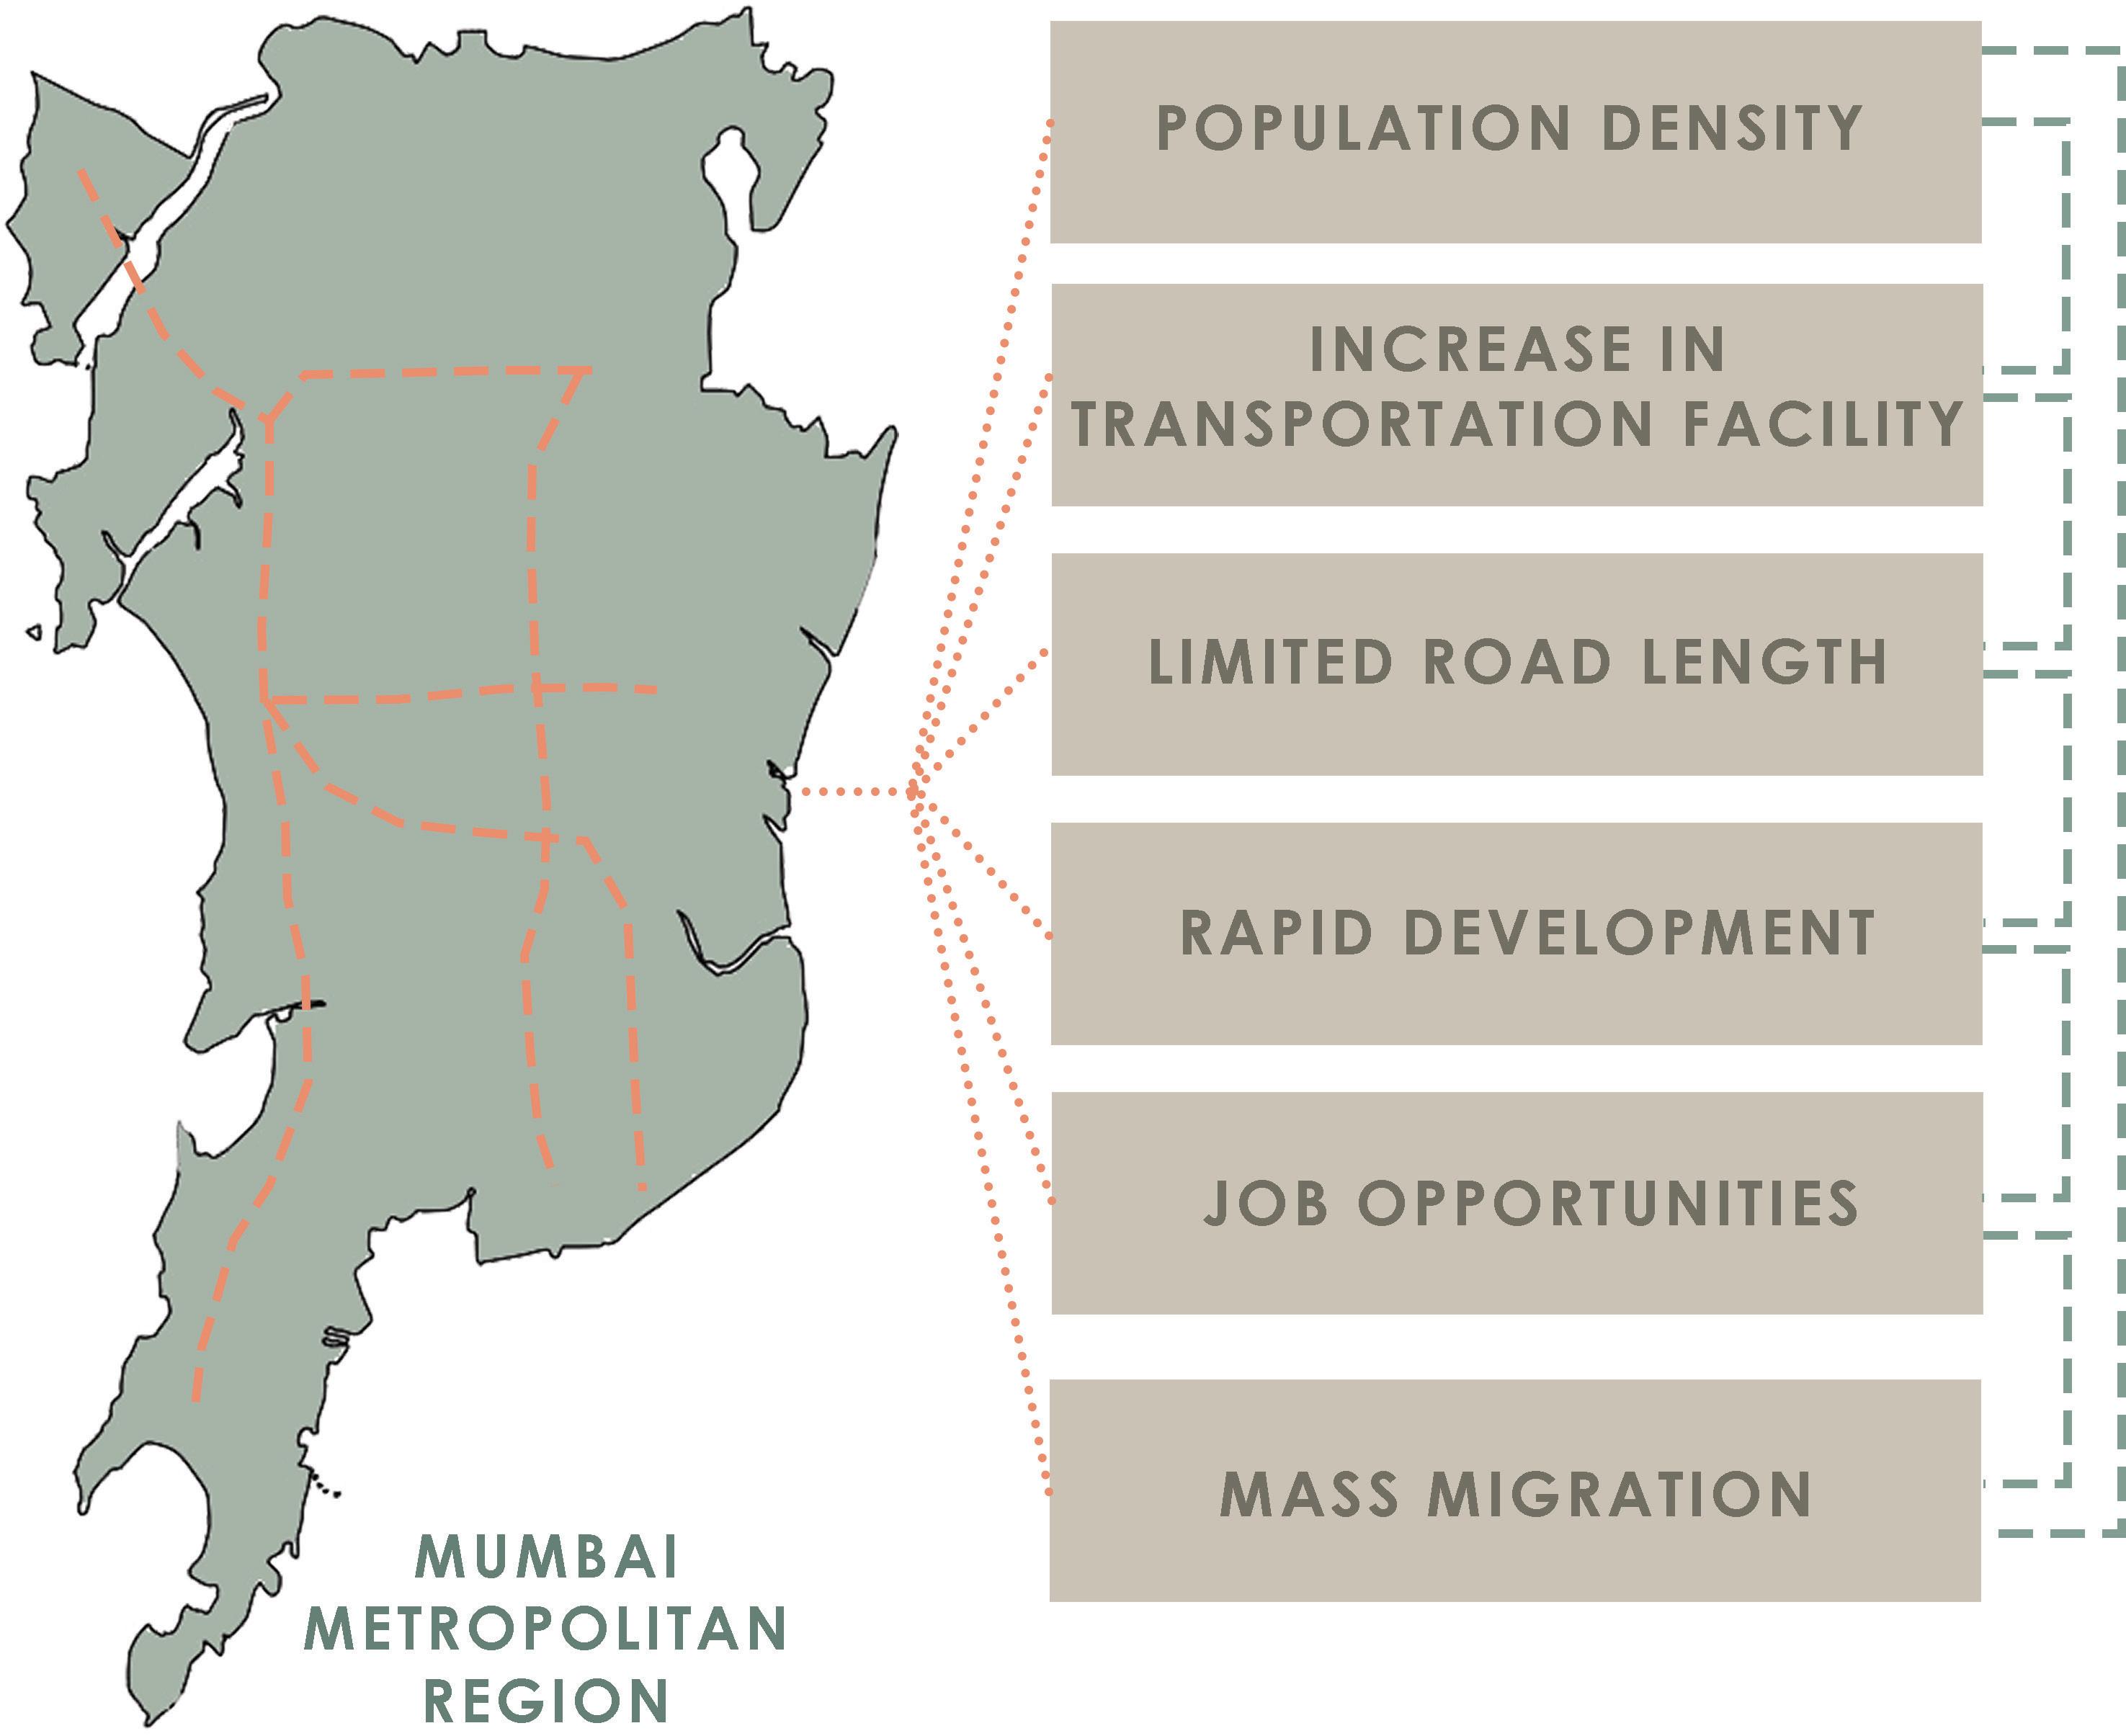
Fig 4.4.3. Map of MMR region (Author)
Fig 4.5.1. Graphic explaining Hypothesis (Author)
Fig 5.1. Chart explaining the Methodology of Research (Author)
Fig 6.1.1. Role of Autorickshaws in Urban Transport (Author)
Fig 6.1.2. Advantages and Disadvantages of Autorickshaw as IPT (Author)
Fig 6.1.3. ASI Framework (Author)
Fig 6.1.4. Benefits of ASI Framework (Author)
Fig 6.1.5. Types of IPT services (Author)
Fig 6.2.1. Map of MMR showing Population distribution (Author)
Fig 6.2.2. Mumbai’s mono-centric to poly-centric approach (Author)
Fig 6.2.3. Mumbai’s Different Modes of Transport (Author)
Fig 6.2.4. Flow chart of Rail-oriented development (Author)
Fig 6.3.1. Impacts of LMC (Author)
Fig 6.3.2. Issues of Urban Transport (Author)
Fig 6.3.3. Impact of TOD on India (Author)
Fig 6.3.4. Drawbacks of Public Transport (Author)
Fig 6.4.1. Pie charts showing usage of public transport in cities (Author)
Fig 6.4.2. Comparison with the size of the city and average population (Author)
Fig 6.4.3. Factors affecting LMC (Author)
Fig 6.4.4. Approach to achieve Sustainable Transport system (Author)
Fig 6.5.1. The influence of 3D’S on T.O.D (Author)
Fig 6.5.2. Sustainability of T.O.D’S (Author)
Fig 6.5.3. Benefits of T.O.D’S (Author)
Fig 7.1.1. Map of MMR showing places travelled by users from Virar (Author)
Fig 7.1.2. Vendors stalls near the exit of station (Author)
Fig 7.1.3. Improper flow of traffic (Author)
Fig 7.1.4. Narrow walking lanes (Author)
I Hussain Lakdawala I Sem IX - X I Design Dissertation I Rizvi 8
Fig 7.1.5. Encroachment of stalls (Author)
Fig 7.1.6. Defunct skywalk due to lack of maintenance (Author)
Fig 7.1.7. Informal set-ups on skywalks and bridges (Author)
Fig 7.1.9. Informal encroachment on skywalks (Author)
Fig 7.2.1. Map of MMR showing places travelled by users from Bandra (Author)
Fig 7.2.2. Excess of Rickshaws congesting traffic (Author)
Fig 7.2.3. No proper flow of vehicles (Author)
Fig 7.2.4. Small bus stops unable to cater for footfall (Author)
Fig 7.2.5. Different modes of PTA available (Author)
Fig 7.2.6. Hawkers encroaching the Rickshaw lanes (Author)
Fig 7.2.7. Electric charging points provided at the station (Author)
Fig 7.2.8. No proper parking spaces provided (Author)
Fig 7.2.9. Defunct skywalk due to poor maintenance (Author)
Fig 7.2.10. The flow of traffic and pedestrians (Author)
Fig 7.3.1. Map of MMR showing places travelled by users from Andheri (Author)
Fig 7.3.2. Lift services for specially-abled(Author)
Fig 7.3.3. Congested Bus stops (Author)
Fig 7.3.4. Facilities at the bridge (Author)
Fig 7.3.5. Large open road without proper management of traffic (Author)
Fig 7.3.6. Wide bridges for an easy commute of the passengers (Author)
Fig 7.3.7. Dedicated Rickshaw lane at the exit (Author)
Fig 7.3.8. Unauthorised parking near exits (Author)
Fig 7.3.9. Separate route for B.E.S.T Buses (Author)
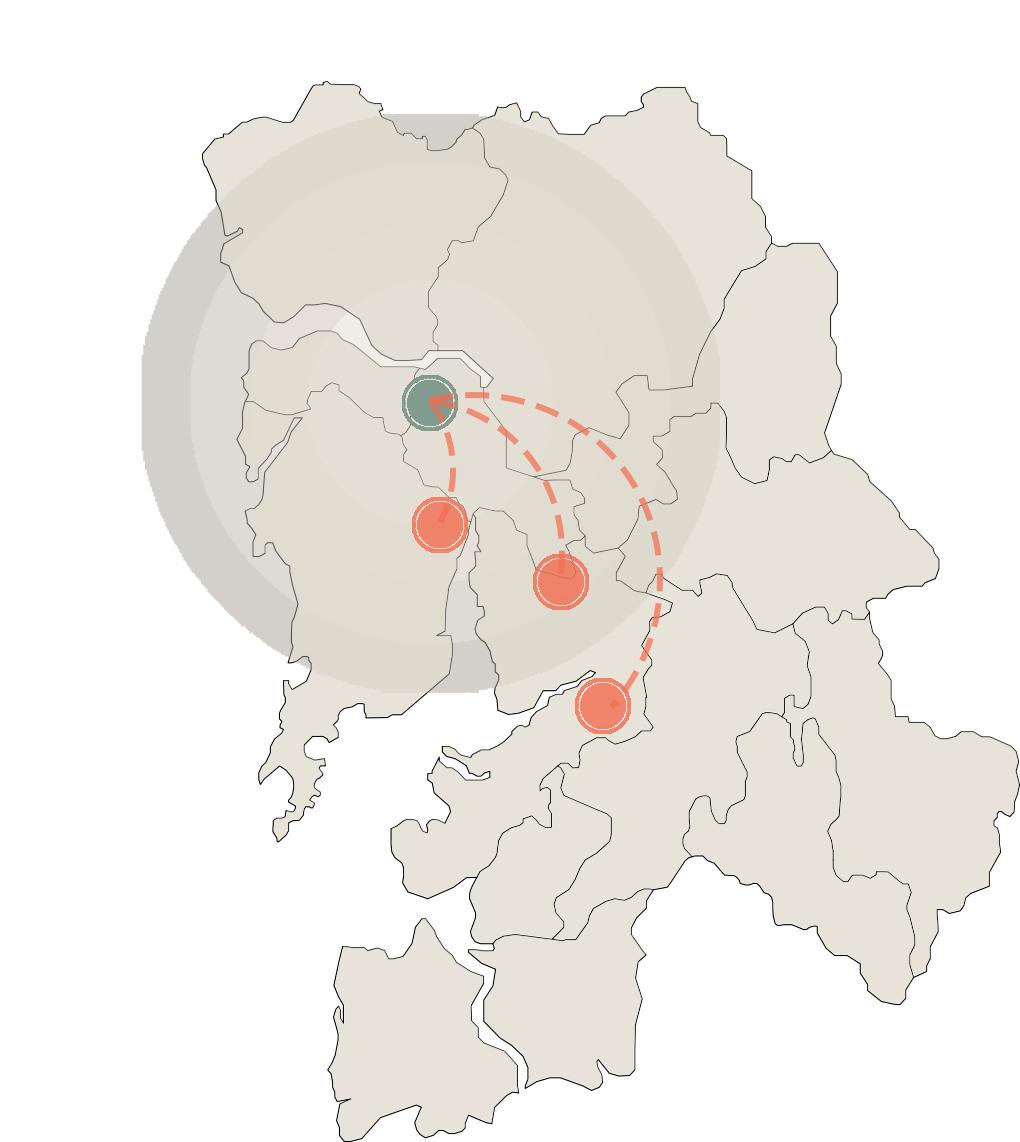
Fig 7.4.1. Map of MMR showing places travelled by users from Andheri metro (Author)
Fig 7.4.2. Only staircase access in some areas (Author)
Fig 7.4.3. Levels of platform and train are same for easy access (Author)
Fig 7.4.4. Connecting bridge between Railway and Metro line (Author)
Fig 7.4.5. Narrow spaces between checkpoints (Author)
Fig 7.4.6. Elevators and lifts are provided in central areas of the stations (Author)
Fig 7.4.7. Facilities provided on the station (Author)
Fig 7.5.1. Map of MMR showing places travelled by users from Thane (Author)
Fig 7.5.2. Dedicated lanes for PTA transport (Author)
Fig 7.5.3. Elevated road dedicated for the buses (Author)
Fig 7.5.4. Skywalks connecting different regions (Author)
Fig 7.5.5. Dedicated slots for the regional and city buses (Author)
Fig 7.5.6. Skywalks connecting different regions (Author)
Fig 7.5.7. Boarding areas not universally designed (Author)
Fig 7.5.9. Provision of lifts and elevators to access the depot (Author)
Fig 7.6.1. Map of MMR showing places travelled by users from Ghatkopar Railway and Metro (Author)
Fig 7.6.2. Wide bridges connecting Metro and Railway (Author)
Fig 7.6.3. No proper drop-off points near entry (Author)
Fig 7.6.4. Skywalks (Author)
Fig 7.6.5. Staircase access (Author)
Fig 7.6.6. Unauthorised parking (Author)
Fig 7.6.7. Bus stops at exits (Author)
Fig 7.6.8. Ramps and lifts access (Author)
I Hussain Lakdawala I Sem IX - X I Design Dissertation I Rizvi 9
Fig 7.6.9. Excess of Rickshaws (Author)
Fig 7.6.10. Station bridge extending to other parts of the region (Author)
Fig 9.1.1: Aerial view of the transit hub (https://www.smwllc.com/projects/transbay-transit-center/)
Fig 9.1.2: View of the Lower ground floor ( https://mtc.ca.gov/operations/programs-projects/ transit-hubs/salesforce-transbay-transit-center)
Fig 9.1.3: Section through the structure ( https://www.wired.com/2010/01/san-francisco-transbay-transit-center/)
Fig 9.1.4: Aerial view of the transportation Intermodal Center (https://www.re-thinkingthefuture.com/wp-content/uploads/2021/01/A2977-Multi-modal-transit-hubsImage-38_ARTIC-Aerial-View_%C2%A9HOK.jpg)
Fig 9.1.5: Side view of the Intermodal Center (https://www.archdaily.com/615466/anaheim-regional-transportation-intermodal-center-hok/551cb77de58ecef247000099-cf005563-2-jpg)
Fig 9.1.6: Master plan of ARTIC Center (https://www.anaheim.net/DocumentCenter/View/986/Capital-Program-Update-Presentation--August-2013-PDF?bidId=)
Fig 9.1.7: Section of ARTIC Center (https://www.anaheim.net/DocumentCenter/View/986/Capital-Program-Update-Presentation--August-2013-PDF?bidId=)
Fig 10.1.1: Map of Andheri station precinct (Author)
Fig 10.1.2 : Map of Mumbai Metropolitan region (Author)
Fig 10.1.3: Map showing transport network of Andheri station precinct (Author)
Fig 10.1.4: Land use of Andheri station precinct (Author)
Fig 10.1.5: Footfall map of Andheri station precinct (Author)
Fig 10.2.1: Map of Bandra station precinct (Author)
Fig 10.2.2 : Map of Mumbai Metropolitan region (Author)
Fig 10.2.3: Map showing transport networks of Bandra station precinct (Author)
Fig 10.2.4: Landuse map of Bandra station precinct (Author)
Fig 10.2.5: Footfall map of Bandra station precinct (Author)
Fig 10.3.1: Map of Virar station precinct (Author)
Fig 10.3.2 : Map of Mumbai Metropolitan region (Author)
Fig 10.3.3: Map showing transport networks of Virar station precinct (Author)
Fig 10.3.4: Land use map of Virar station precinct (Author)
Fig 10.3.5: Footfall map of Virar station precinct (Author)
Fig 10.4.1: Map of Ghatkopar station precinct (Author)
Fig 10.4.2 : Map of Mumbai Metropolitan region (Author)
Fig 10.4.3: Map showing transport networks of Ghatkopar station precinct (Author)
Fig 10.4.4: Land use of Ghatkopar station precinct (Author)
Fig 10.4.5: Footfall of Ghatkopar station precinct (Author)
I Hussain Lakdawala I Sem IX - X I Design Dissertation I Rizvi 10
1) LMC: Last-Mile connectivity.
2) MCGM: Municipal Corporation of Greater Mumbai.
3) MMRDA: Mumbai Metropolitan Region Development Authority.
4) MMRCL: Maharashtra Metro Rail Corporation Limited.
5) B.E.S.T: Brihanmumbai Electric Supply & Transport.
6) ASI: Avoid Shift Innovate.
7) NIUA: National Institute of Urban Affairs.
8) MMR: Mumbai Metropolitan Region.
9) CBD’s: Central Business Districts.
10) T.O.D: Transit-Oriented Development.
11) MOHuA: Ministry of Housing and Urban Affairs.
12) PTM: Para-Transit mode.
13) CMP: Comprehensive Mobility Plan.
I Hussain Lakdawala I Sem IX - X I Design Dissertation I Rizvi 11
Acronyms
List of
1. Abstract
I Hussain Lakdawala I Sem IX - X I Design Dissertation I Rizvi 12
Transportation has emerged as a basic and inevitable need of humans along with Food, Shelter, and Clothing. To transport large quantities of goods or numbers of people over long distances at high speeds in comfort and safety has been an index of civilization and particularly of technological progress. Amidst rapid urbanization, the need for public transport has increased gradually in recent times.
During the colonial era, Mumbai was identified as a natural harbor for trade resulting in mass migration. This eventually gave birth to the suburban regions of the city. Better quality of life and affordable real estate in the suburbs attracted people towards it. Thus, Public transport acts as a bridge between the suburbs and the main city center 80% of total travel in the city is done via public transport. Local trains are the most significant contributor, followed by city buses, autos, and taxis cater to local travel within the city and regional limits. Last-mile connectivity has been a major concern in such developing cities. These transportation facilities might be competent individually but collectively they fail to deliver their purpose.
In response to this, the planning authorities and regional administrations have proposed various facilities and infrastructure like the monorail, metro, national highways, and railway expansion schemes which try to suffice the requirements but the need for the facility has always been a step ahead.
The main objective of this research is to study and analyse the problems faced by daily commuters using multiple modes of transport to reach their workspaces. To identify the patterns, overlaps, and gaps of such a system. And thus, creating a space which allows easy access to all types of transportation facilities that will encourage people to use public transport.
KEYWORDS: Last-Mile Connectivity, Urbanization, Public transport, Administrations.
I Hussain Lakdawala I Sem IX - X I Design Dissertation I Rizvi 13 1- Abstract
I Hussain Lakdawala I Sem IX - X I Design Dissertation I Rizvi 14
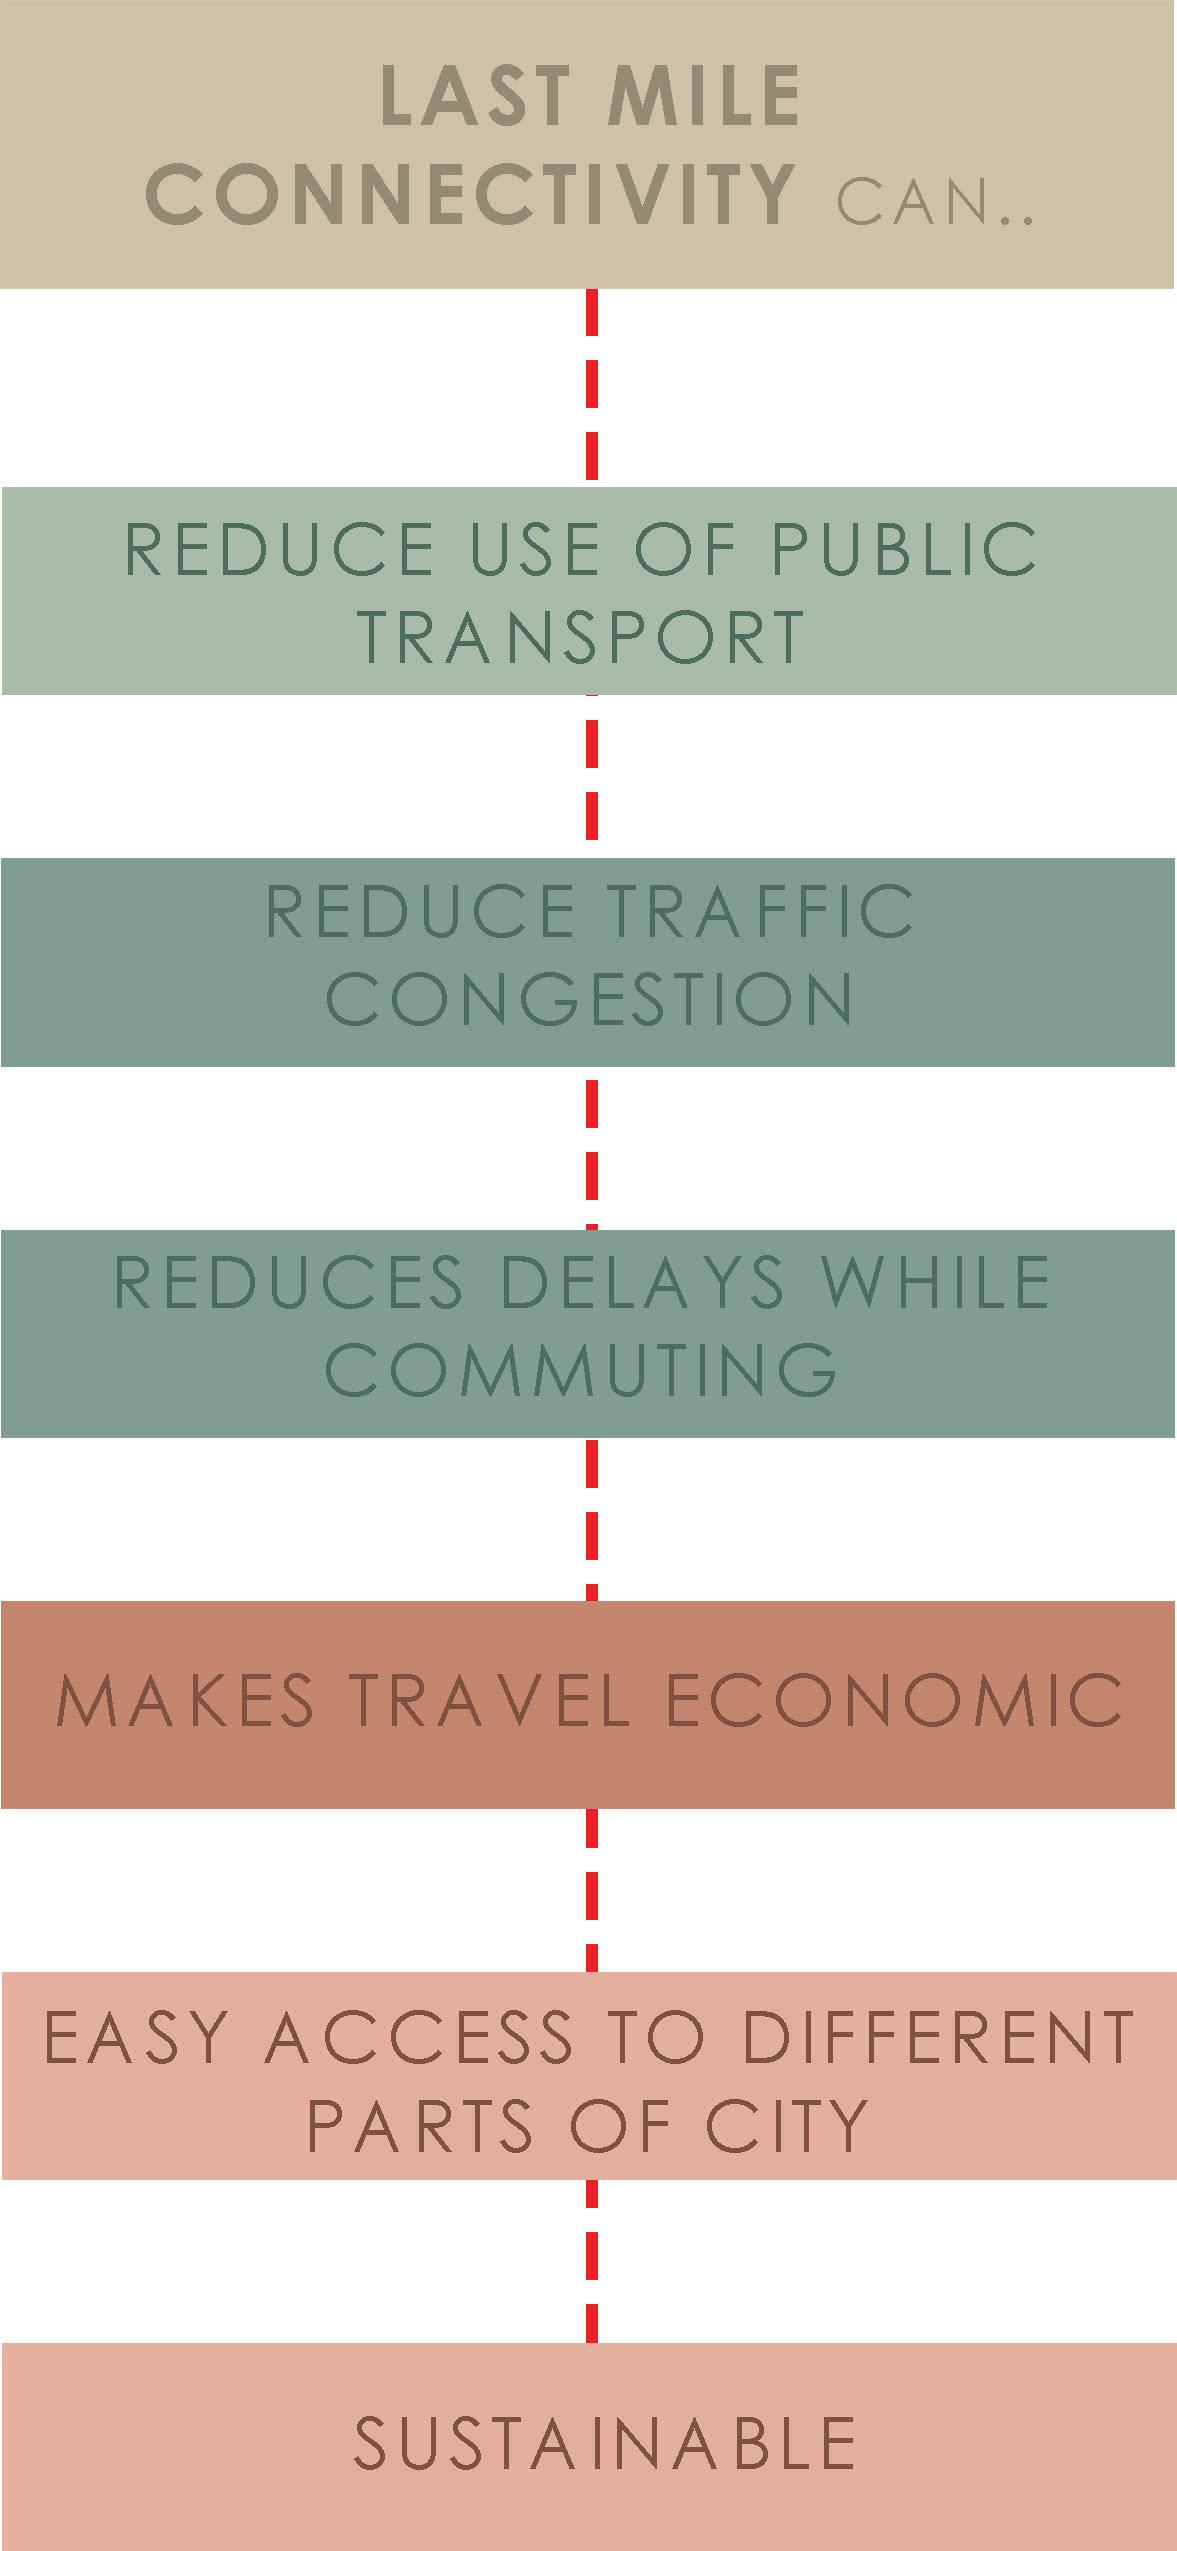
Fig 1.1. Flow chart explaining advantages of Last-Mile Connectivity (Author)
I Hussain Lakdawala I Sem IX - X I Design Dissertation I Rizvi 15 Notes / Remarks
2. Background
I Hussain Lakdawala I Sem IX - X I Design Dissertation I Rizvi 16
2- Background
A cohesive transportation network can potentially amplify the economy of a city. Mumbai is one such city where the increasing commerce and baffling population growth has established an eminent transport system. Referred to as the “CITY OF DREAMS”, Mumbai is India’s financial and entertainment capital, known for its bustling streets, iconic skyline, and vibrant culture. At the heart of this metropolis lies a complex web of transportation facilities that keep the city pulsating with life.
Mumbai’s transportation facilities have a rich history, mirroring the city’s evolution. The Mumbai Suburban Railway, introduced in the mid-19th century, was among the first railway systems in India and remains integral to the daily life of the citizens. These trains have generated a bona fide trajectory of the diligent commuters of the city. These facilities provide an inclusive platform for travellers belonging to different strata of society.
The railways continue to dominate the transport system as the most efficient networks in terms of connecting a diversified areas of the city. Although well organised, the journey does not end there. This network does not ensure an unobstructed route to the respective destination. Infact , with the end of the rail routes, begins the end of ones uninterrupted quest for connecting the LAST MILE.
I Hussain Lakdawala I Sem IX - X I Design Dissertation I Rizvi 17
I Hussain Lakdawala I Sem IX - X I Design Dissertation I Rizvi 18
I Hussain Lakdawala I Sem IX - X I Design Dissertation I Rizvi 19
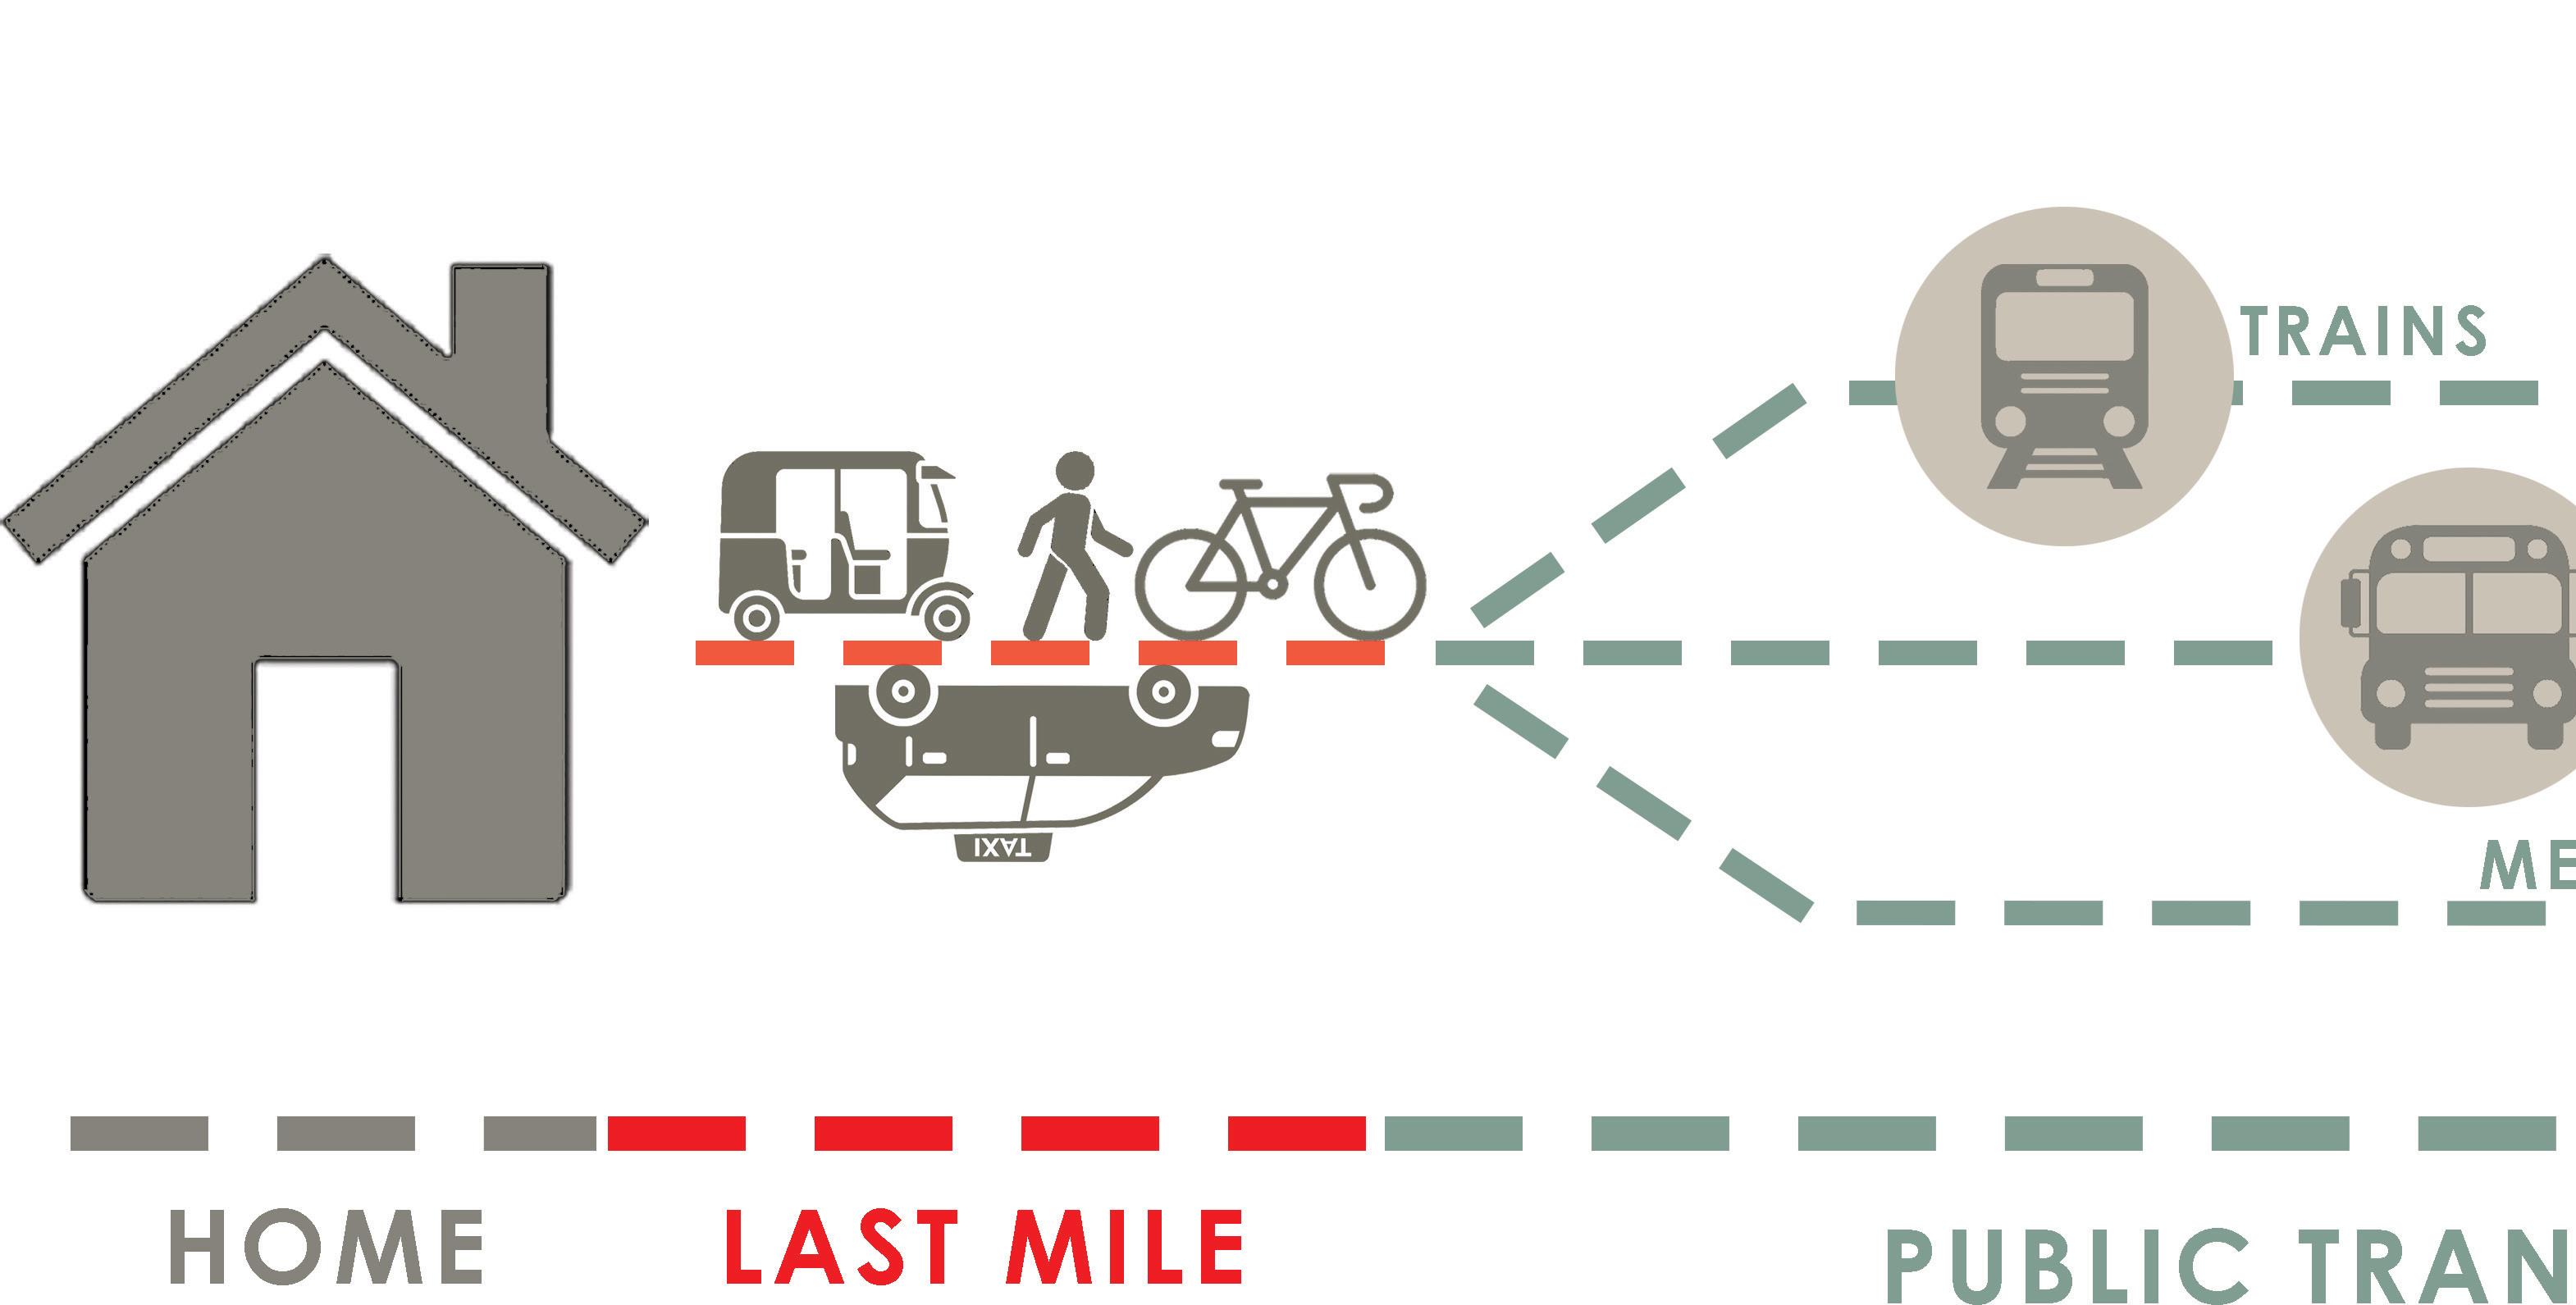
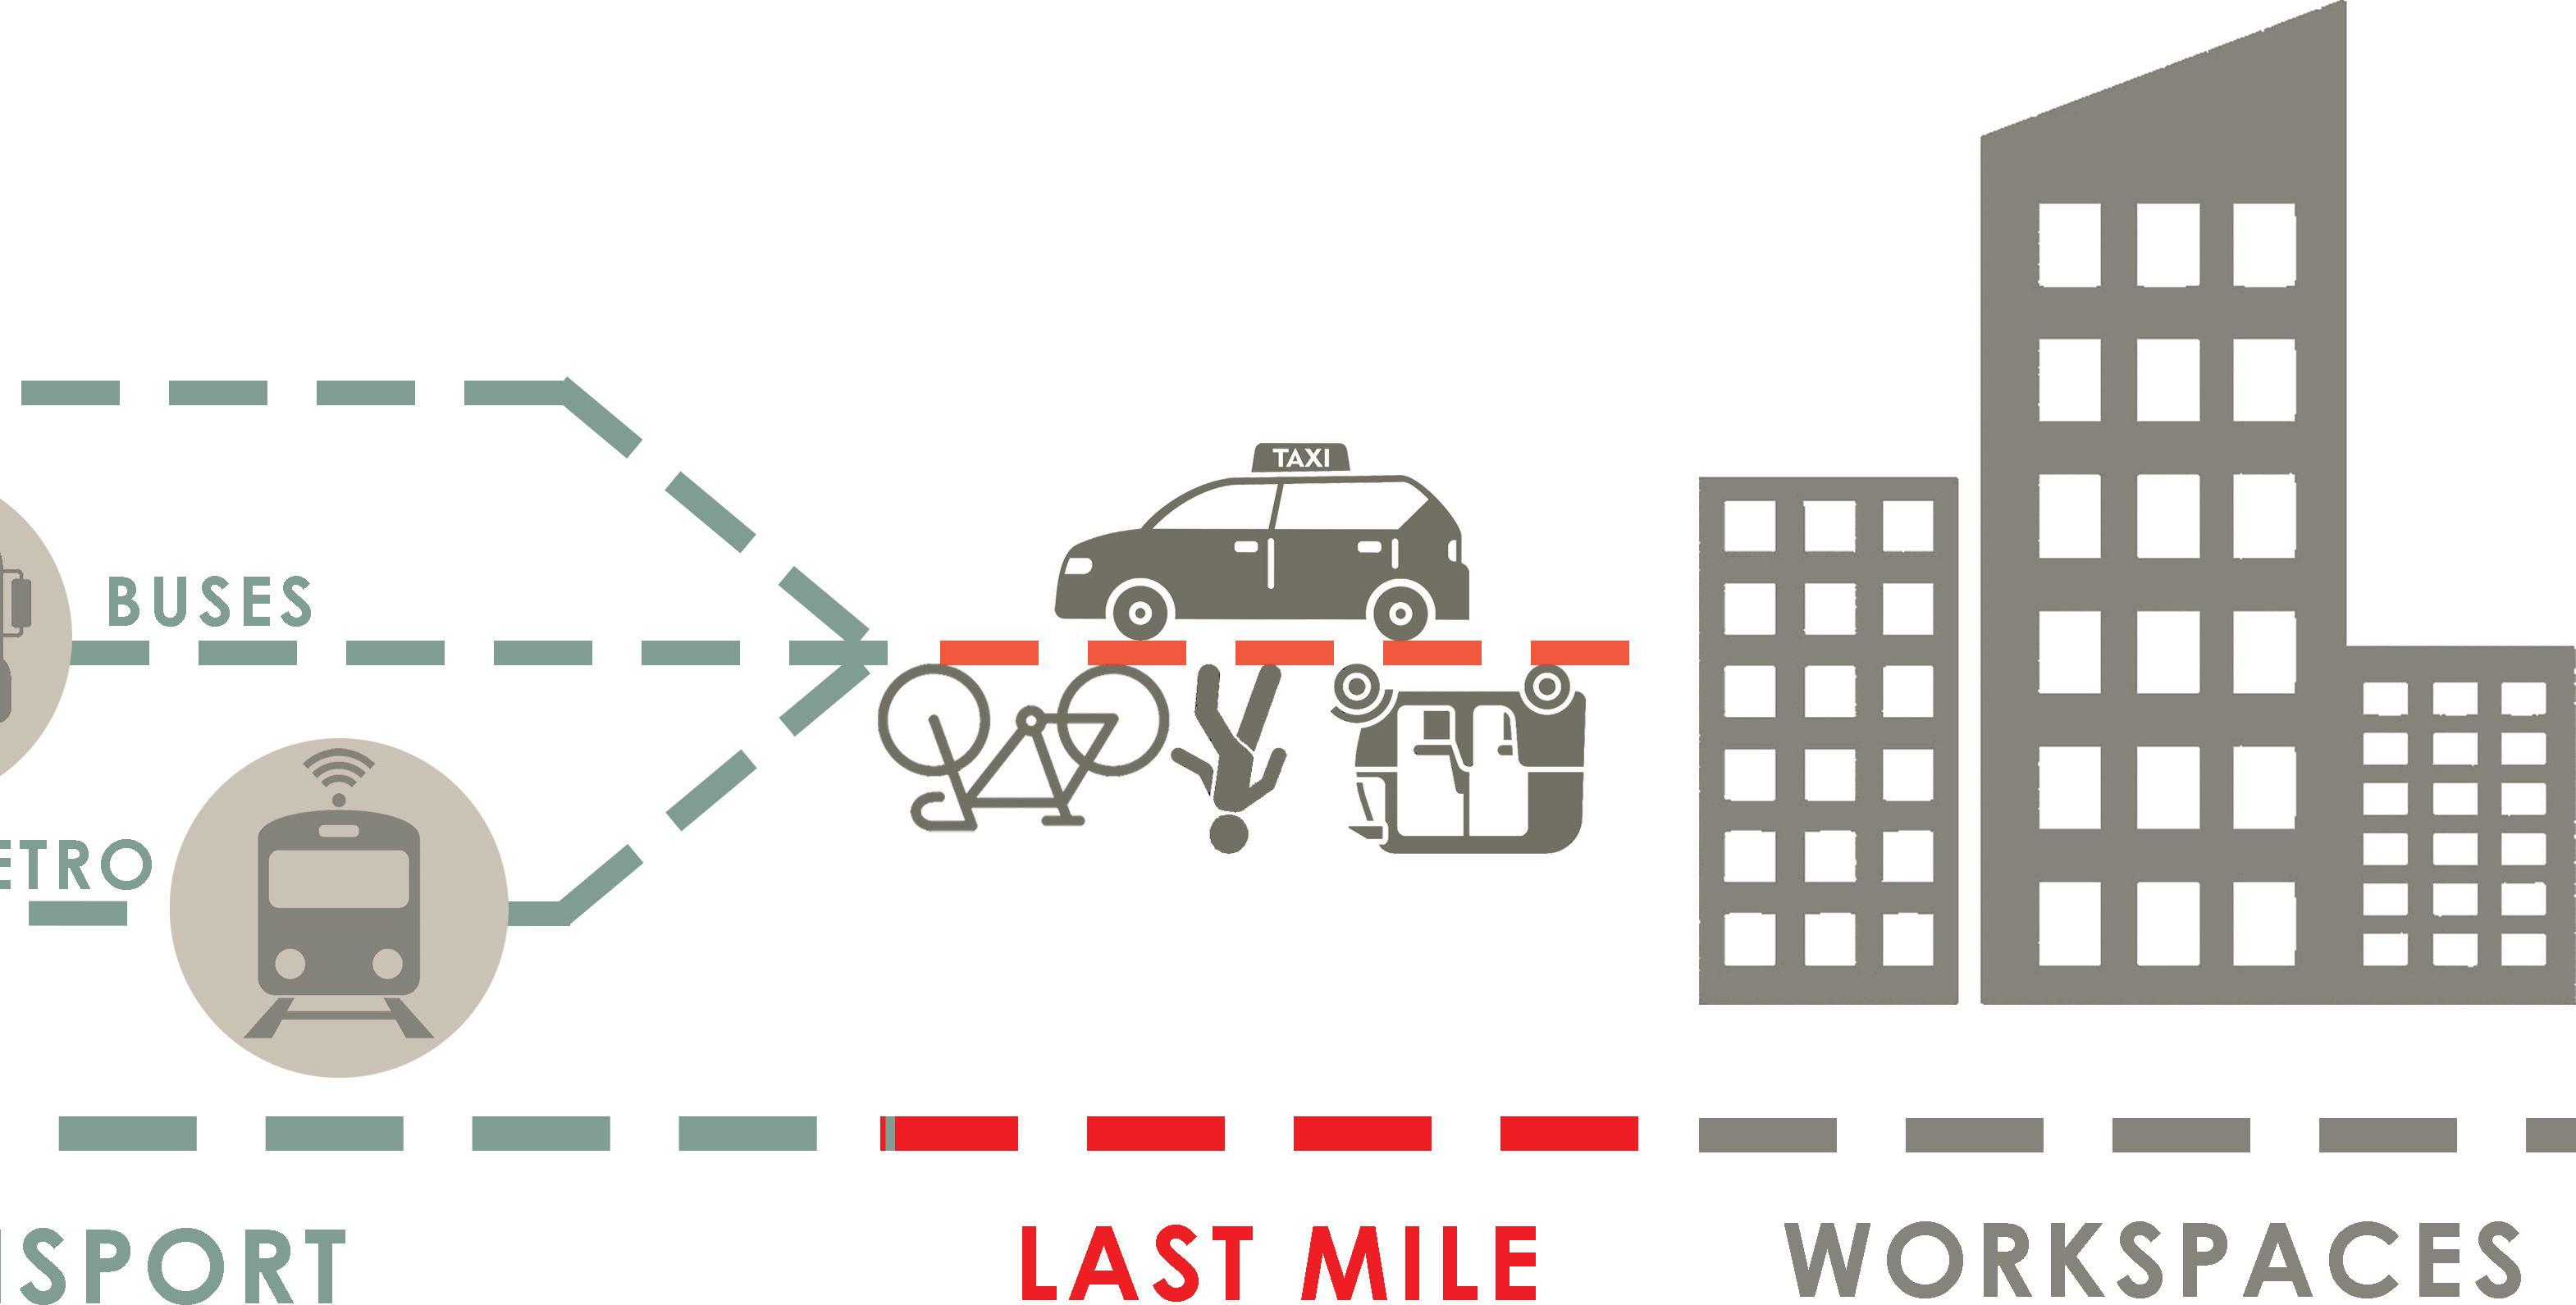
Fig 2.1.Diagram explaining the concept of Last-Mile connectivity (Author)
3. Why Mumbai ?
I Hussain Lakdawala I Sem IX - X I Design Dissertation I Rizvi 20
Mumbai, the ‘Land of Dreams’ for many people, provides food and shelter to every individual who migrates to settle in the city. Since the 1850s, the city’s Transportation services have been catering to the commute of citizens The first Train service started in 1857 under the Colonial era. Since then, the development and growth of the transportation service as well as the city has expanded widelyw.
Mumbai is a transit- and pedestrian-oriented city with an extensive, albeit intense and overcrowded, public transport system.
Buses: as of 2015 BEST runs 3600 buses carrying 4.8 million passengers across 365 routes.
Trains: The Mumbai Suburban Railway connects Mumbai metropolitan region and its suburbs
Spreads over 465 kilometres in length.
Carries 7.5 million commuters daily. (2.64 billion annually). (Will Geary, 2021).
Traffic and transportation woes are sapping citizen’s energy to no end, adversely affecting the quality of life of one and all.
To bring about improvement, the Government of Maharashtra (GoM) initiated the construction of the Flyovers, Bandra Worli Sealink (BWSL), Mumbai Urban Transport Projects (MUTP) and the Mumbai Urban Infrastructure Projects (MUIP), the Mumbai Metro Master Plan (MMMP), more flyovers, the extension to BWSL on the west coast and the Mumbai Trans Harbour Link. (Badami, n.d.).
Such inefficient facilities result in 12 railway-related fatalities and 7 road-related fatalities daily. (Badami, n.d.). this leads to 4000 railway fatalities and 2500 road fatalities every year. (Badami, n.d.).
57% of citizens live within a radius of 3km of their workspace.
69% of citizens live within a radius of 5km of their workspace.
81% of citizens live within a radius of 10km of their workspace.
89% of citizens live within a radius of 15km of their workspace.
11% of citizens travel more than 11% for their workspace. (Badami, n.d.).
Average travel distance for metropolitan cities (one of which is Mumbai) is 8 to 10 kms, compared to rest of India with an average of 6 km or less. (pai, 2005)
I Hussain Lakdawala I Sem IX - X I Design Dissertation I Rizvi 21
3-
?
Why Mumbai
Modal Split for Middle Class workers in Mumbai
Job in Mumbai city
Job in Exurbs
It shows the modal split or different modes of transport used by Middle class commuters in Mumbai main city and Middle class commuters working in the Exurbs of the city
Rickshaw 02%
In terms of Population of the Metro cities of India, Mumbai comes second to Delhi with population of 18.4 million population as of 2016
No.of regsitered Motor vehicles in metro cities
Population of Metro cities as of 2016
In terms of Registered vehicles, Mumbai ranks 4th with 2.6 million registered vehicles
I Hussain Lakdawala I Sem IX - X I Design Dissertation I Rizvi 22
Fig 3.3. Statistics shwoing registered cars in Metro cities of India (Will Geary,2021)
Fig 3.1. Statistics showing modal-shift in Mumbai (Will Geary,2021)
Fig 3.2. Statistics shwoing Population growth in Metro cities of India (Will Geary,2021)
Bus 13%
Car 03% Bike 15%
Train 56% Walking 38% Train 24%
Rickshaw 07%
Walking 17% Bus 15% Bike 06% Car 03%
Delhi 18.6 m Mumbai 18.4 m Kolkata 15.1 m Bengaluru 10.8 m Chennai 10.4 m Hyderbad 9.5 m
2004 2005 2006 2007 2008 2009 2010 2011 2012 2013 2014 2015 Kolkata 1.4 m Hyderbad 2.4 m Chennai 4.9m Bangalore 5.6m Delhi 8.9m Mumbai 2.6 m
Total Road Length for every Metro cities (by Kilometer) No.of
The road length of Mumbai (2000 km) is lesser than most of the other city in India which results in traffic congestion.
Population Density of Indian cities (people per Hectare)
Mumbai has least density of cars per 1000 people among Indian cities.
Mumbai (MCGM) is the most densely populated city among other cities of India due to its limited access to land, which makes it even more important to develop public transport for easy access.
I Hussain Lakdawala I Sem IX - X I Design Dissertation I Rizvi 23
Fig 3.4. Statistics showing modal-shift in Mumbai (Will Geary,2021)
Fig 3.5. Statistics showing Average road-length of Metro cities in India (Will Geary,2021)
Fig 3.6. Statistics showing Population density of Metro cities in India (Madhvi Pai ,2005)
50 100 150 200 250 300 0 Chennai Mumbai (MCGM) Bangalore (BMP) Bhopal Mysore Delhi Ahmdebad Pune (PMR) Indore Rajkot Mumbai (MMR) Bangalore (BBMP) Pune (PMC) Jaipur Surat Metro cities Millenium cities Now exploding cities Delhi 20,508 Bangalore 10,200 Hyderbad 4,702 Chennai 2,847 Mumbai 2,000 Kolkata 1,400 2004 2005 2006 2007 2008 2009 2010 2011 2012 2013 2014 2015 Mumbai 139.7 Kolkata 311.8 Hyderbad 338.8 Bangalore 658.5 Delhi 802.1 Chennai 1061.8
Registered vehicles per 1000 people
Population growth in Mumbai will be 60% from 2001 to 2021.
Average Trip Length (in kilometers)
Among all the Metro cities , Mumbai has the most longest trip length travel by commuters daily (12 km)
Mumbai has the most usage of public transport but it is not sufficient for the population of the city. The difference between the usage of public transport and IPT shows the concerns of last mile connectivity.
I Hussain Lakdawala I Sem IX - X I Design Dissertation I Rizvi 24
Fig 3.7. Statistics showing Population Growth of Metro cities in India (Madhvi Pai ,2005)
Fig 3.8. Statistics showing Average trip-lengths of Metro cities in India (Madhvi Pai ,2005)
50 100 150 200 0 Chennai Ahmdebad Bhopal Mysore Delhi Bangalore Indore Rajkot Mumbai Pune Jaipur Surat Metro cities Millenium cities Now exploding cities 2 4 6 8 10 12 0 Chennai Ahmdebad Bhopal Mysore Delhi Bangalore Indore Rajkot Mumbai Pune Jaipur Surat Metro cities Millenium cities Now exploding cities Population growth (2001-2010)
Fig 3.9. Statistics showing Modal shares in Mumbai (Rao,2016)
Walk Bicycle Public transport IPT and others Private vehicles Pune Surat Ahmdebad Chennai Kolkata Mumbai Bangalore Nagpur 0 10 20 30 40 50 60 70 80 90 100
Cars becomes even more attractive
Rise in Income
Reduced bus freqency
Increase in fair
Increase in Car Ownership
Reduced demand for buses
Increase in bus operating cost
More congestion and delay
Less milage per bus
public
The diagram shows the endless cycle of use of private transport and its impact on the public transport.
I Hussain Lakdawala I Sem IX - X I Design Dissertation I Rizvi 25
Fig 3.10. Diagram showing use of private transport over
transport (Madhvi Pai ,2005)
INDIAN
by K V Krishna Rao.
TOWARDS BETTER ACCESSIBILITY AND MOBILITY IN
CITIES-
4.1 - Aim
4.2- Objective
4.3- Research Questions
4.4- Problem statement
Introduction
4.5- Hypothesis
4.6- Scope
4.7- Limitation
I Hussain Lakdawala I Sem IX - X I Design Dissertation I Rizvi 26 4.
Mumbai, the Financial capital is one of the most significant cities of the country. It is one of the most populated and bustling cities of India. Mass migration is one of the major concerns of the city in recent times and due to this, the city faces significant challenges in ensuring that the residents and visitors have convenient and efficient transportation services for their commute. Last-mile connectivity is a crucial aspect of the city’s transportation infrastructure. Last-mile connectivity refers to the means of transportation that bridges the gap between major transportation hubs, such as railway stations, bus terminals, and metro stations, to people’s ultimate destinations, be it their homes, workplaces, or other points of interest.
The city’s unique urban and geographical context results in complicating the solution of the connections and makes it a multifaceted challenge. The city is characterized by a vast network of local trains, buses, and metro systems, which cater to millions of daily commuters. Mumbai, often referred to as the “Maximum City,” is renowned for its extensive local train network, known as the Mumbai Suburban Railway, which plays a central role in the daily commute of millions of people. The city suburbs are well connected to the island city or the heart of the city via this mode of transport. For the people, Mumbai railway is their lifeline as it provides opportunities for them. However, the major concern lies in efficiently transporting people to and from these railway stations or other transit hubs to their final destinations, which can involve navigating through congested streets, crowded markets, and narrow alleys.
Modes like autorickshaws, taxis, buses, bicycles, walking, or any other emerging technologies like app-based ride-sharing services, electric autos, and electric buses primarily play a role in catering to the last-mile connectivity in Mumbai. It is crucial to understand the diverse needs of Mumbai’s residents and visitors, ranging from office-goers and students to tourists and daily commuters, and provide a variety of transportation options to cater to these different groups.
I Hussain Lakdawala I Sem IX - X I Design Dissertation I Rizvi 27
4- Introduction
There are several proposals and projects proposed by the governing authorities to improve the LMC in Mumbai Dedicated bicycle lanes, pedestrian-oriented design, integrated mobility platforms, and electric vehicles are some of the interventions to address such challenges of congestion and pollution while providing convenient and sustainable transportation options.
In conclusion, the last-mile connectivity in Mumbai is a dynamic and essential aspect of the city’s transportation network. Ensuring efficient, sustainable, and accessible options for the final leg of one’s journey is crucial for the city’s residents and its ever-growing population. Addressing this problem involves a combination of infrastructure development, technological innovation, improved public transportation systems, and promoting sustainable modes of travel. As Mumbai continues to evolve, addressing last-mile connectivity challenges will be crucial to enhance the overall transportation experience and reducing the city’s traffic congestion and environmental impact.
I Hussain Lakdawala I Sem IX - X I Design Dissertation I Rizvi 28
To study and analyze the architecture surrounding/facilitating different modes of para-transit systems and the efficiency of such systems in Mumbai that bridge the gap between public transport and their destinations by connecting that last mile.
I Hussain Lakdawala I Sem IX - X I Design Dissertation I Rizvi 29
4.1- Aim
Fig 4.1.1. Gaps and overlaps in different modes of transport facilties (Author)
4.2- Objectives
* To identify the different modes of transit systems used by commuters across the city to reach their workspace/homes.
Transport used in MMR Region
* To observe the functionality of different public transportation systems of Mumbai throughout the day.
* To observe and evaluate the existing conditions of the infrastructure and transportation systems and their effects on the efficiency of different para-transit systems. Case studies: different transit systems of Mumbai.
* To observe and understand the challenges faced by commuters while using different transit systems.
I Hussain Lakdawala I Sem IX - X I Design Dissertation I Rizvi 30
Fig 4.2.1. Transports used in MMR region (Author)
* To observe and study the architectural and spatial influence on the functioning of a transit system.
* To define various parameters to study the qualitative and quantitative aspects of different types of transportation facilities in Mumbai.
I Hussain Lakdawala I Sem IX - X I Design Dissertation I Rizvi 31
Fig 4.2.2. Different modes of transport available in MMR region (Author)
4.3- Research Questions
1) How does the efficiency of last-mile connectivity influence the use of the public transport system?
2) What are the circumstances that drive people to choose private facilities over public transport?
3) How does the infrastructure of such multi-modal transport junctions/stations affect the linking of various transit systems?
4) What are the qualitative and quantitative parameters of the infrastructure of transportation facilities help in determining the gaps in the systems?
I Hussain Lakdawala I Sem IX - X I Design Dissertation I Rizvi 32
4.4- Problem statement
In an Urban cityscape like the Mumbai metropolitan region, last-mile connectivity is a crucial dead point where policies or the proposed ideas and projects do not seem to work due to its complexity and over-usage which leads to its inefficiency.
I Hussain Lakdawala I Sem IX - X I Design Dissertation I Rizvi 33
Fig 4.4.1. Map of India (Author)
Fig 4.4.2. Map of Maharashtra (Author)
Fig 4.4.3. Map of MMR region (Author)
4.5- Hypothesis
Enhancing the efficiency of the transportation systems that cater to the last-mile connectivity of the city by enhancing the built context and creating a space that helps in the proper functioning of the facilities when used as a unified system.

I Hussain Lakdawala I Sem IX - X I Design Dissertation I Rizvi 34
Fig 4.5.1. Graphic explaining Hypothesis (Author)
4.6- Scope
This thesis looks at the functioning and overlaps of multiple transportation facilities in the Mumbai metropolitan region.
This thesis only looks at the architectural aspect affecting the functionality of such overlapping transportation facilities and not their policy-making schemes and network chains.
4.7- Limitations
The thesis does not venture into the legal aspects of any kind of transportation facilities.
Transport planning is not a specialization hence our focus is only on the design of transit in terms of quality of spaces.
I Hussain Lakdawala I Sem IX - X I Design Dissertation I Rizvi 35
5.Methodology
I Hussain Lakdawala I Sem IX - X I Design Dissertation I Rizvi 36
The public transportation facilities of the Mumbai metropolitan region are the principal force that drives the city towards its development. Facilities like suburban railway, BEST buses, metro rail, monorail, autorickshaws, taxis, cycles, E-bikes, etc. are used by commuters on a daily basis in order to reach their workspaces and destinations. This research involves understanding the overlaying functioning of different modes of transportation systems in the Mumbai metropolitan region (MMR), with the help of certain parameters that evaluate the qualitative and quantitative efficiency of such facilities.
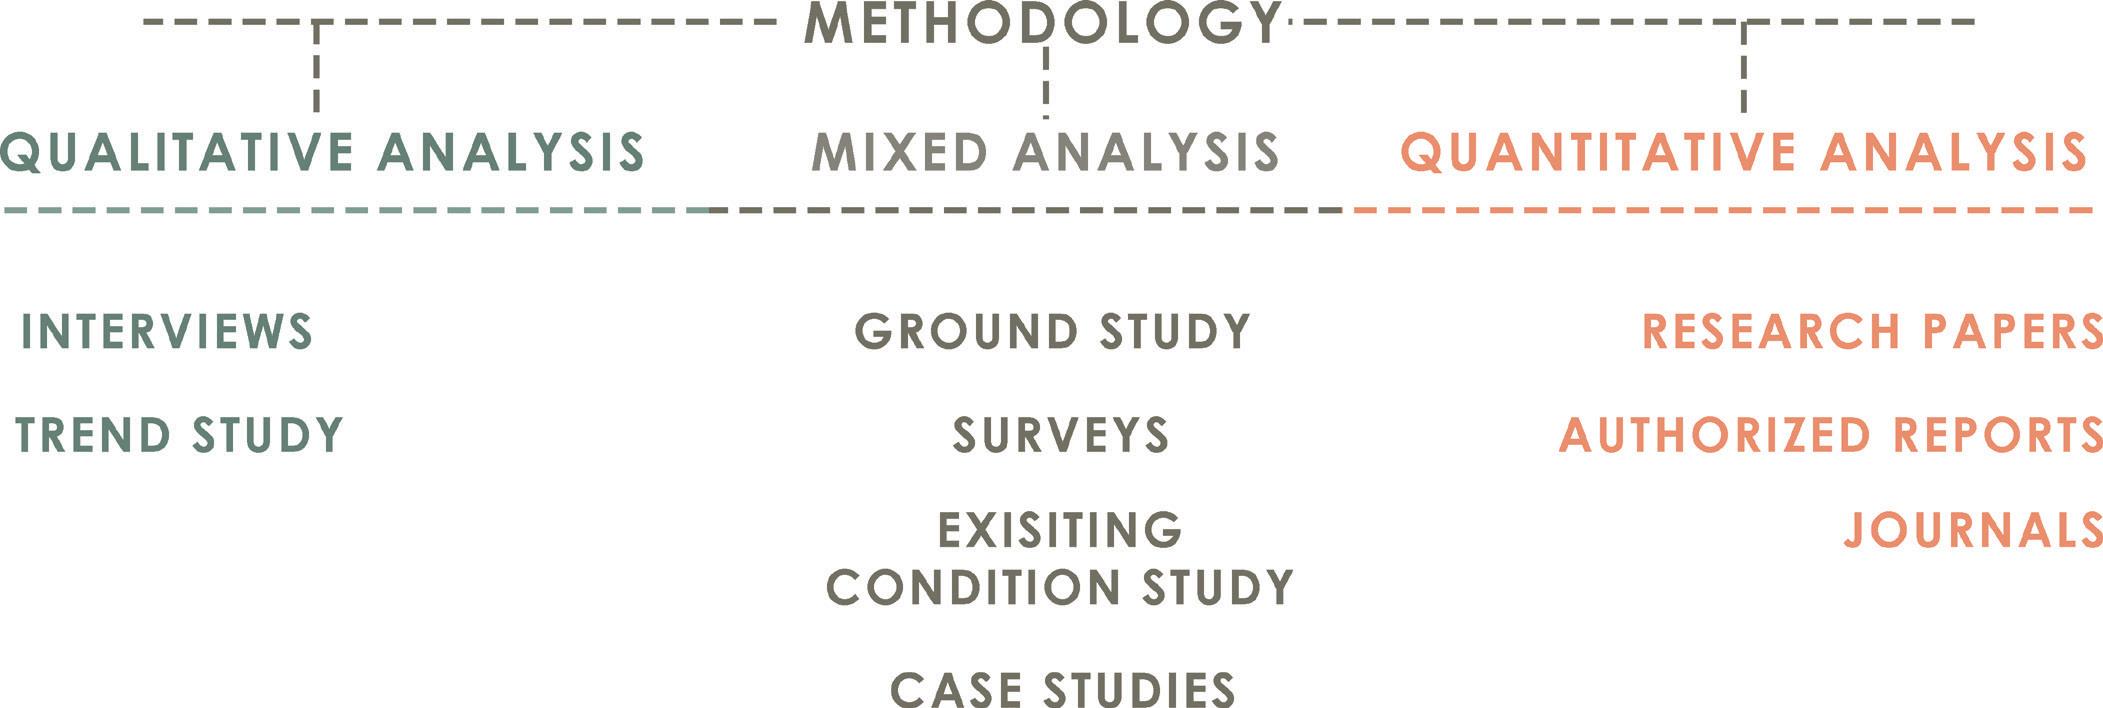
Primarily the quantitative analysis and research will be done with the help of research papers, authorized reports produced by MMRDA, MCGM (Comprehensive Mobility Plan (CMP), 2016) and other planning authorities, journals, and case studies (Embarq, 2005) to evaluate the current conditions and how they work as one system. Conducting ground studies of various types of facilities that are either planned or organically transformed into a transportation hub, using a similar set of parameters (which will define the quality and quantity of any system) and interviewing commuters using one or more transport systems to commute will be part of qualitative analysis.
The inference of the quantitative analysis (reports, research papers, articles) and the conclusions of the qualitative analysis (interviews, live case studies) will help determine various trends and gaps in different transport systems when they overlap to work as a system. The conclusions of all this research will help in understanding how spatial arrangement and architecture affect the functioning of these facilities and hence find gaps and develop a design program in order to fill those gaps resulting in improved efficiency of the systems.
I Hussain Lakdawala I Sem IX - X I Design Dissertation I Rizvi 37
5- Methodology
Fig 5.1. Chart explaining the Methodology of Research (Author)
6. Rreview of Literature
6.1- Sustainable Urban Transport in India
6.2- Mumbai Metropolitan Region: Railway-guided development
6.3- Last Mile Connectivity in the Indian Scenario: A literary review
6.4- A Proposed Roadmap to Enhance Last-Mile Connectivity in India’s Metro Rail Transit Systems
6.5- Transit Oriented Development and Its Impact on Level of Service of Roads & Metro: A Case Study of Mumbai Metro Line-I”
I Hussain Lakdawala I Sem IX - X I Design Dissertation I Rizvi 38
6.1- Sustainable Urban Transport in India
Report by: Akshay Mani (Project Manager Urban Transport EMBARQ India), Madhav Pai (Director EMBARQ India), Rishi Agarwal (Associate Institutional Relations EMBARQ India).
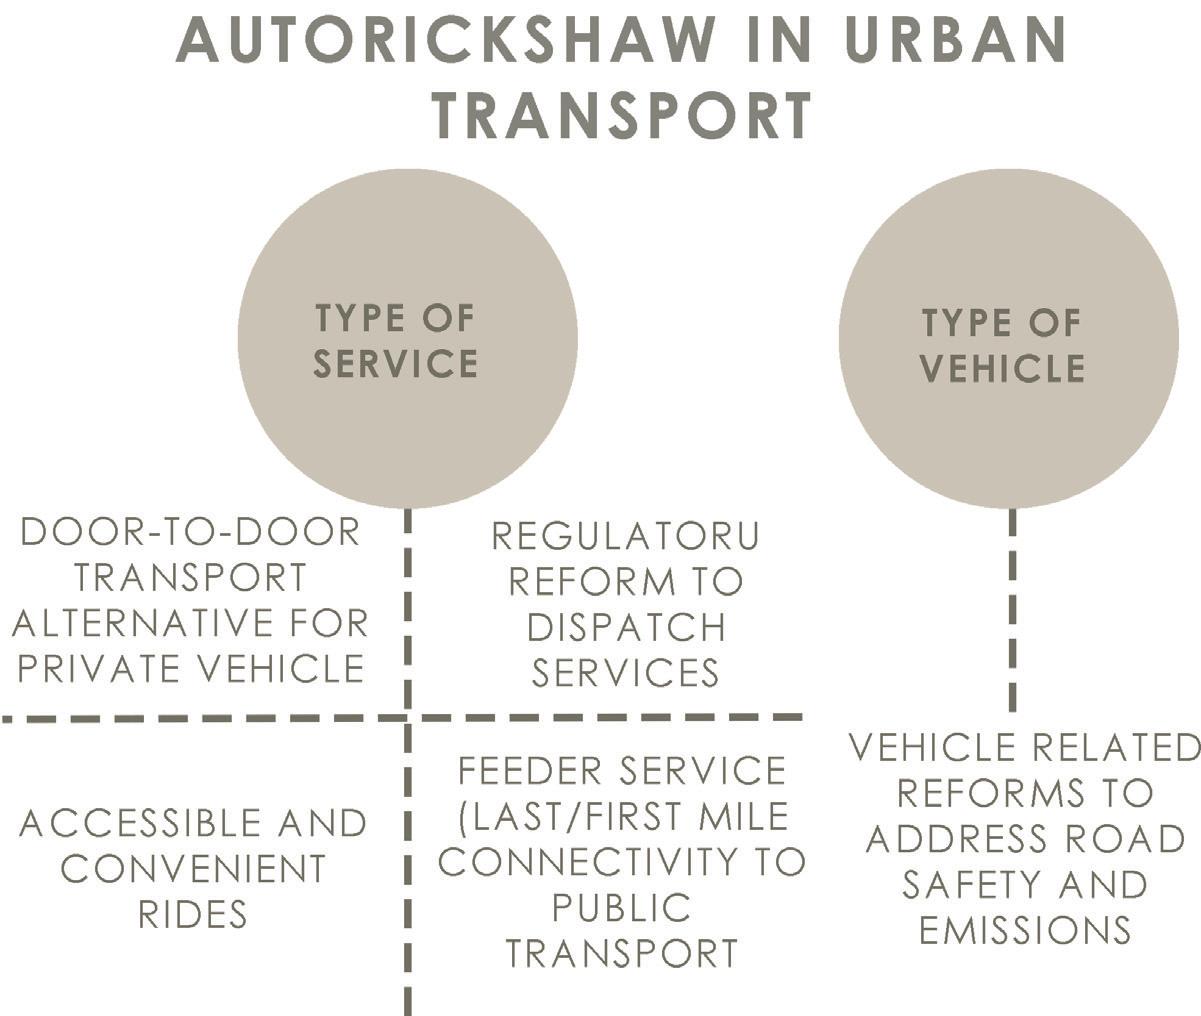
The report focuses on the Role of autorickshaws (three-wheeled motorized vehicles) in Urban transportation systems. It shows how these three-wheeled motorized vehicles have been an essential facet of urban mobility for millions of commuters since its introduction in the 1950s. The study also analyses how this urban mobility sector has been neglected by government and planning authorities for ages. (Akshay Mani, 2012). Today, with increasing urban populations, there is a growth in demand for urban transport, growth in private motorization and a decline in public transport share. The real question is whether these three-wheeled vehicles can play an essential role in efficient urban mobility for their operators as well as their passengers. And how can the use of autorickshaws contribute to urban transport sustainability? (Akshay Mani, 2012)
The study suggests that the production of such three-wheeled vehicles has doubled between 2003 and 2012, as the need for urban public transport has increased in India. The autorickshaw sector has never been considered under any policy or scheme related to urban development despite being one of the most influential production sectors. This study examines the role of autorickshaws in increasing
I Hussain Lakdawala I Sem IX - X I Design Dissertation I Rizvi 39
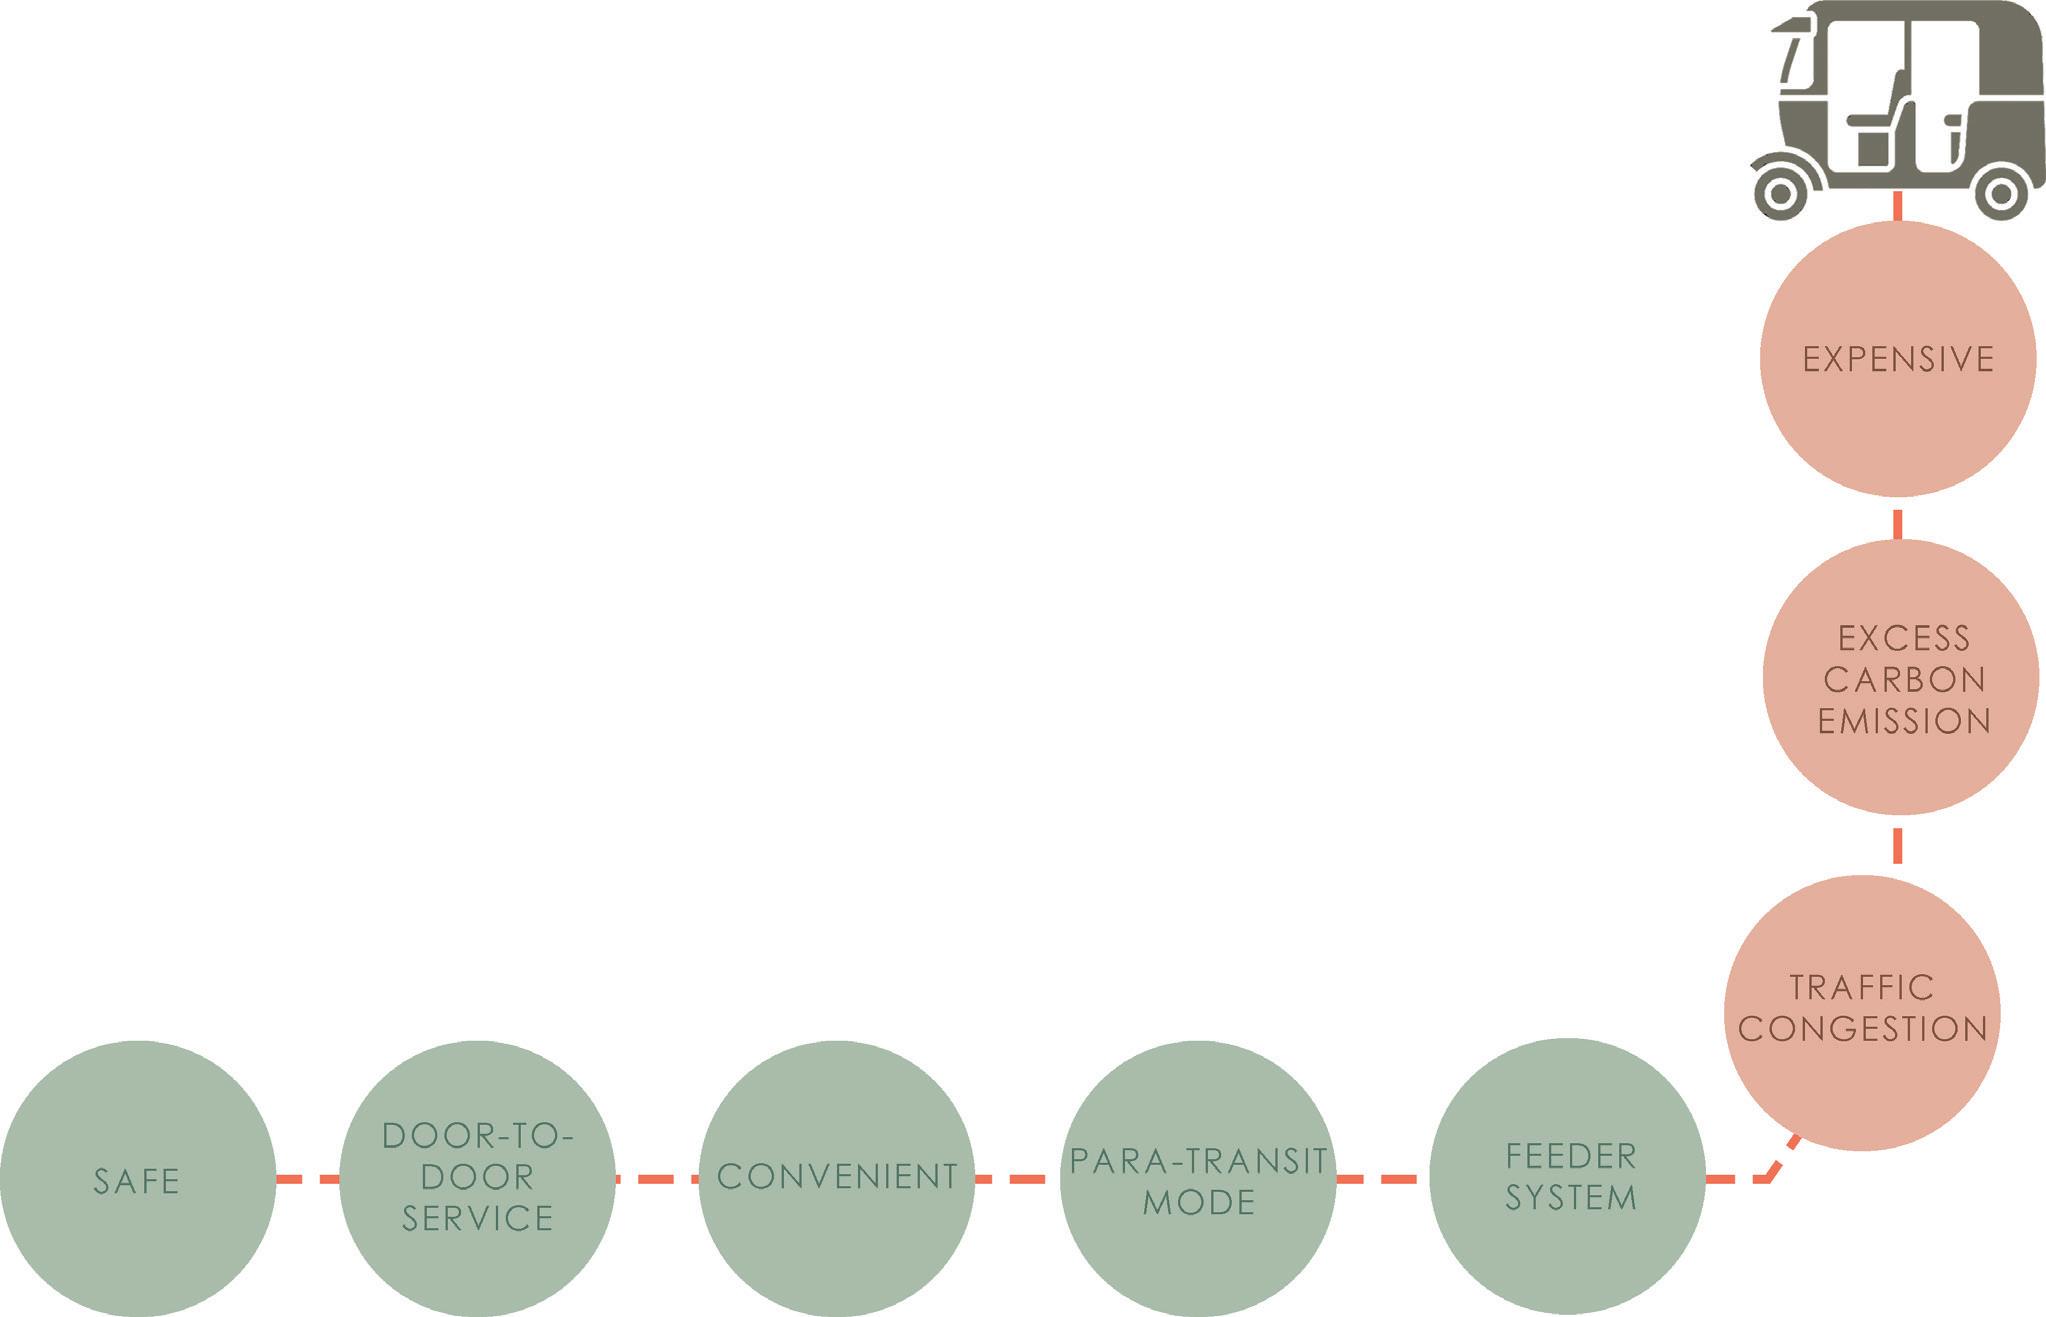
Fig 6.1.1. Role of Autorickshaw in Urban Transport (Author)
Fig 6.1.2. Advantages and Disadvantages of Autorickshaw as IPT (Author)
sustainability of the urban transport and also prepares a policy vision for this sector and presents recommendations on reforms to address sustainability challenges.
The report further highlights the Avoid-Shift-Improve (ASI) framework as one key approach to improving the sustainability of urban transport systems. (Akshay Mani, 2012) Several sustainable conditions or acts such as cutting down greenhouse gas emissions, improving energy efficiency, cutting traffic congestion, and protecting public health and pedestal safety by encouraging alternatives to private transport are taken into consideration under the ASI framework.
The ASI framework is based on three key strategies: avoid unnecessary trips, shift to more sustainable transport modes, and improve performance in all modes. (Dalkmann and Brannigan 2007). In the ASI framework, apart from the avoid strategy which completely depends on the the commuter’s choice, proper urban planning, and land-use policies the other two strategies can help evaluate the use of autorickshaws in sustaining urban transport.


The objectives of the shift strategy from the ASI framework can be clearly fulfilled by the autorickshaw services in urban transport. The following are the aspects that can help promote public transport and reduce private motorization:
1) First and last-mile connectivity to public transport: Auto-rickshaw services, integrated as a feeder mode providing such connectivity, can complement public transport systems by ensuring that all parts of the city have easy access to public transport stations. (Akshay Mani, 2012)
I Hussain Lakdawala I Sem IX - X I Design Dissertation I Rizvi 40
Fig 6.1.3. ASI Framework (Author)
Fig 6.1.4. Benefits of ASI Framework (Author)
2) Door-to-door transport alternative to private motor vehicles: The door-to-door on-demand service provided by auto-rickshaws will ensure that transport needs requiring door-to-door connectivity, such as occasional trips to the airport or emergency trips for health care, can be met in cities without having to rely on private motor vehicles. (Akshay Mani, 2012)
Therefore, in conclusion of this report it shows how the role of autorickshaws in sustaining the urban transport system is crucial. And how it plays an important role in strategies of the Avoid-Shift-Improve (ASI) framework.
I Hussain Lakdawala I Sem IX - X I Design Dissertation I Rizvi 41
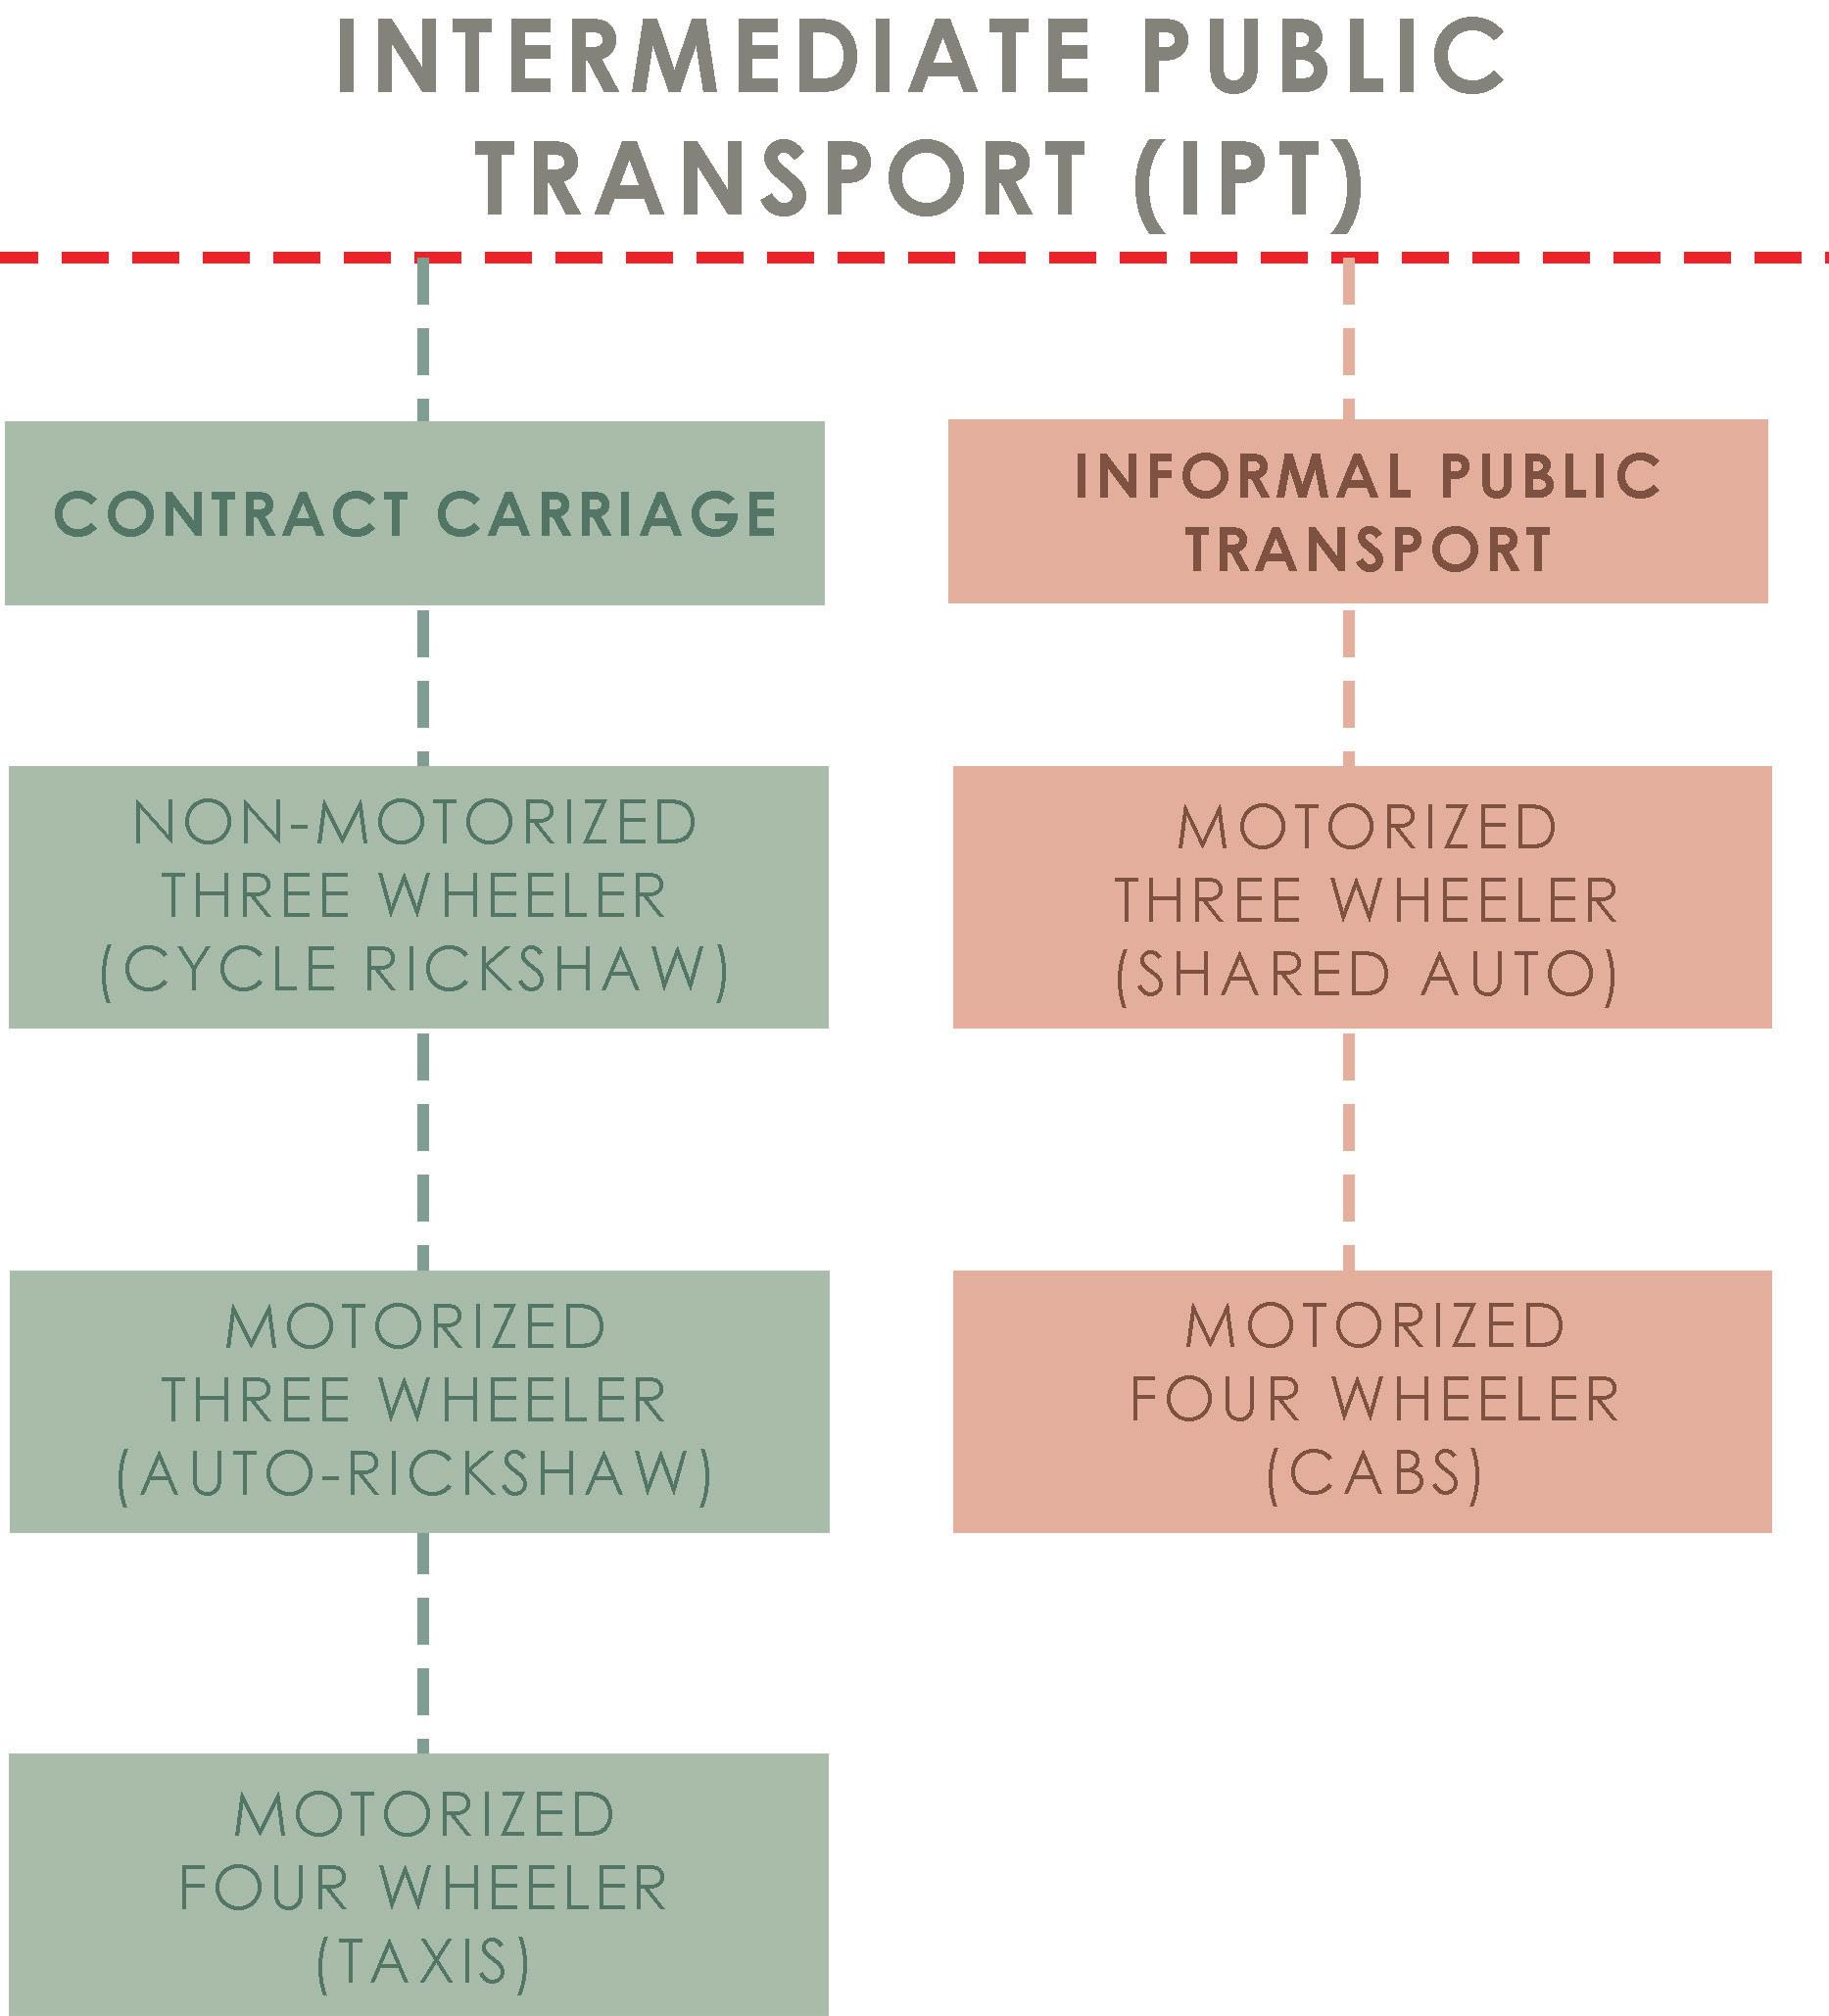
Fig 6.1.5. Types of IPT services (Author)
6.2- Last Mile Connectivity in the Indian Scenario:A
Research by: National Institute of Urban Affairs (NIUA), New Delhi.
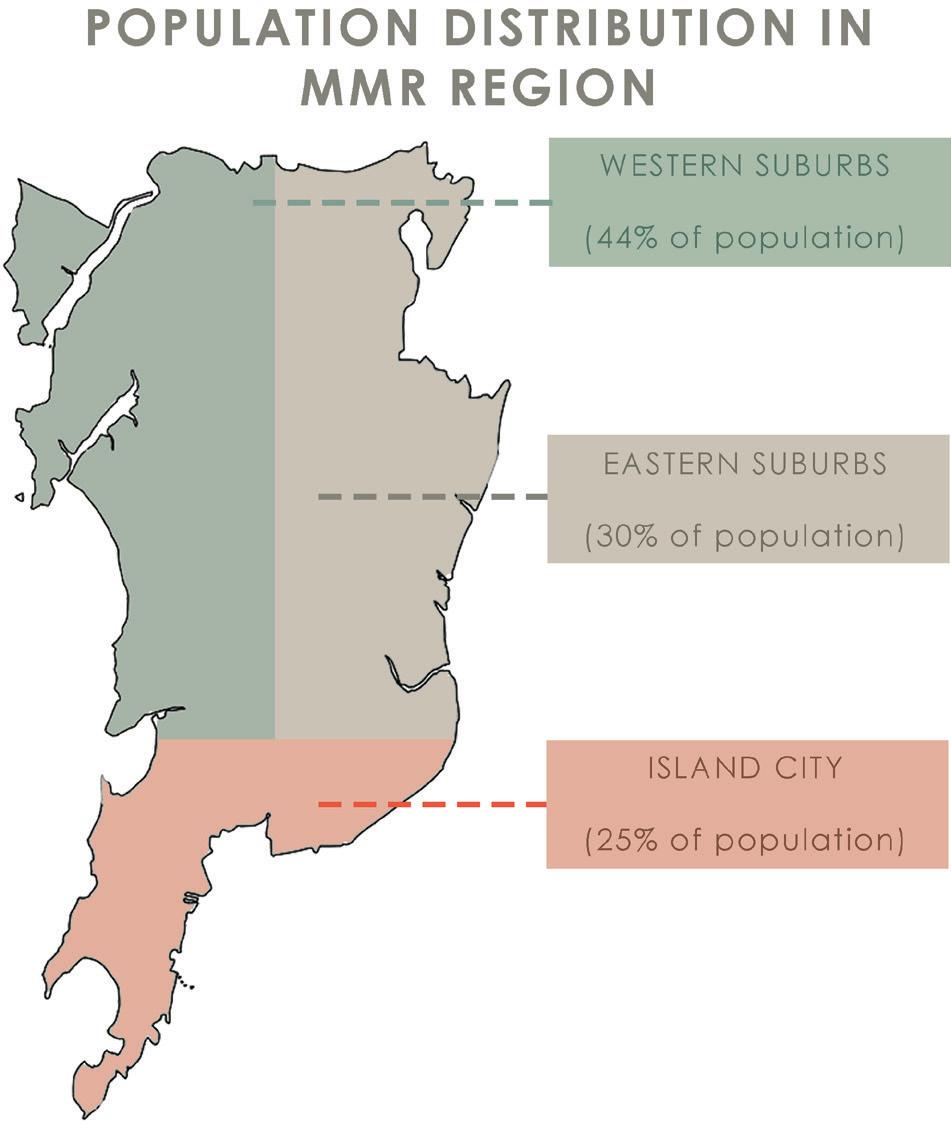
The research highlights the evolution of the Mumbai metropolitan region and how it gave rise to the railway networks of the city. Mumbai was originally a cluster of 7 different islands which were transformed into a single land parcel via various reclamation projects. The city of greater Mumbai has 7 different municipal corporations and 15 smaller municipal units. The city is divided into 3 major parts 1) the island city (comprising 25% of the total population), 2) the easter suburbs (comprising 30% of the total population), and 3) the western suburbs (comprising 44% of the total population). (National Institute of Urban Affairs (NIUA), New Delhi., 2015). The transportation infrastructure connects these to the satellite towns with a complex interplay of Suburban rail, Metro, Monorail, Public buses, Auto-rickshaws, and significant Pedestrian modes. (National Institute of Urban Affairs (NIUA), New Delhi., 2015).
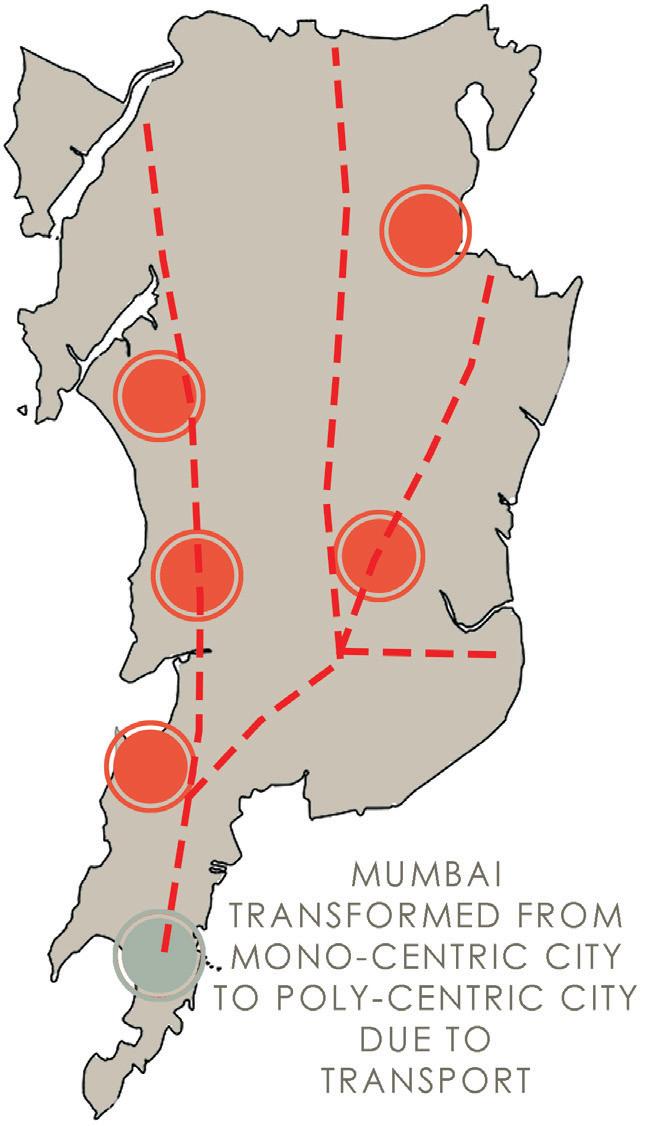
The rail network plays the primary role in transportation catering to 7.5 million passengers daily. The distribution of the population into the suburbs shows that the city of Mumbai has evolved from being a monocentric city into a poly-centric city.
I Hussain Lakdawala I Sem IX - X I Design Dissertation I Rizvi 42
literary review
Fig 6.2.1. Map of MMR showing Population distribution (Author)
Fig 6.2.2. Mumbai’s mono-centric to poly-centric approach (Author)
The research suggests that since the start of the first passenger train in Mumbai back in 1853, the railway network has evolved exponentially to spread over 465 kilometers across the city and divided into five different corridors covering western, eastern, and harbor areas. With the support of a strong network of railways, the city that was confined to the island with partial expansion to the suburbs and a population of about 6 million in the 1970s, grew into a metropolitan region with a population of about 14 million in the 1990s and 22 million in 2012. (NIUA, New Delhi., 2015). It has a population of over 20.7 million and is one of the most populous metropolitan areas in the world (PIB, 2015). The two big cities of this metropolitan of Mumbai and Navi Mumbai support the densest suburban railway network in this region. (National Institute of Urban Affairs (NIUA), New Delhi., 2015).
A total of 88% of total travel done in the city by commuters are done via rail and road which makes it important to develop an effective and efficient public transport system. Efficient public transport systems are a critical part of creating a sustainable transport system. Railways have guided the growth of Mumbai in many different ways as it constitutes 52% of the total travel of the city.
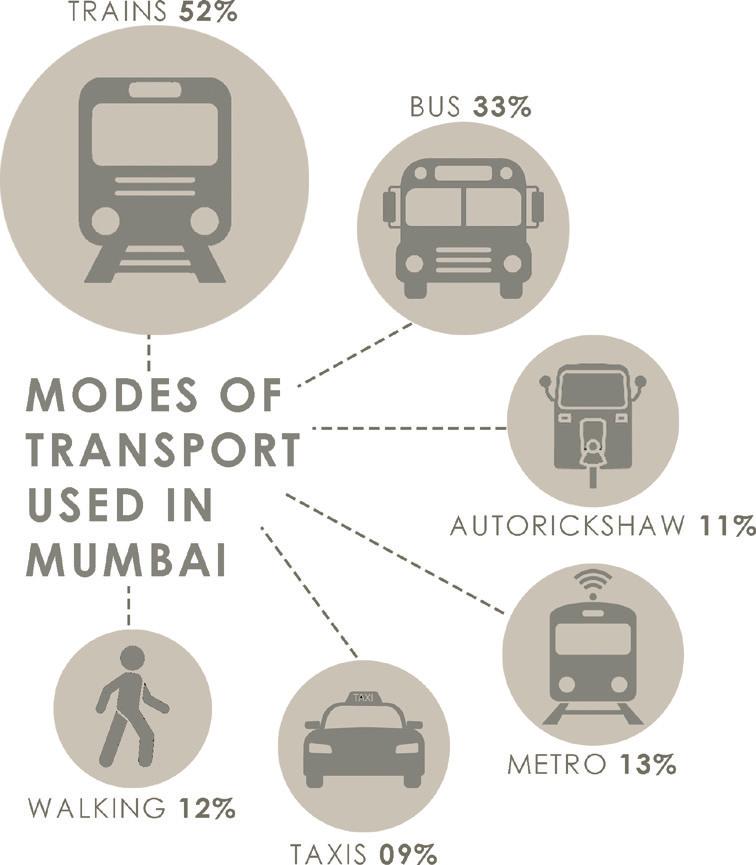

1) City’s form: The geographical location of Mumbai has forced the city as well as its rail network develop linearly resulting in concentric developments around stations.
2) Affordable housing: The high cost of living in the island city has forced the middle class and the lower middle class to settle in the suburban region which is catered by the rail network and also the lower middle class who can not afford formal housing into the city has developed informal settlements (slums) around the derelict land along the railway lines.
I Hussain Lakdawala I Sem IX - X I Design Dissertation I Rizvi 43
Fig 6.2.3. Mumbai’s different Modes of Transport (Author)
Fig 6.2.4. Flow chart of Rail-oriented development (Author)
3) Affordable transport: the average monthly cost of traveling on suburban trains is barely 400 rupees.
4) Multiple CBDS: Since the city has turned into a poly-centric center the unidirectional tidal flow of commuters from north to south daily has been distributed into various regions like Bandra-kurla complex, Lower Parel, Andheri-kurla, etc.
5) Station and station area planning: Just like any other Indian railway station the suburban railway station is also occupied by street vendors, autorickshaws, drop-off points, parking, bus stops, etc. This is due to poor planning and maintenance of the vicinity of the station. Navi Mumbai railway stations are one of the newly planned and designed stations with skywalks, foot-over bridges, and separate parking areas for auto-rickshaws and taxis. The stations are designed pedestrian-oriented and provide other essential services that help in the hassle-free movement of pedestrians.
The transit systems of Mumbai and Navi Mumbai have been developing ever since the formation of the respective cities. However, the capacity augmentation of the systems has been slower than the growth rate of the population. Apart from upgrading the public transportation systems of the city, there is also a need to plan and design such transit hubs into more pedestrian-friendly areas. More than 50% of trips to work in Mumbai are done via walking. (National Institute of Urban Affairs (NIUA), New Delhi., 2015).
I Hussain Lakdawala I Sem IX - X I Design Dissertation I Rizvi 44
Authors: Abhinanda Chatterjee (PhD Scholar, Indian Institute of Engineering Science and Technology), Subrata Kr. Paul (Associate Professor, Indian Institute of Engineering Science and Technology).
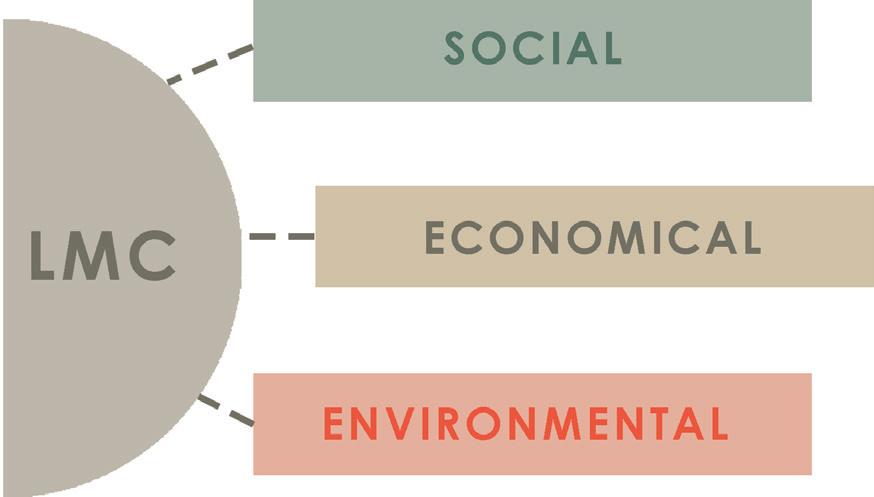
The paper talks about global transportation systems and how there is a need to transform the transportation system into a sustainable and well-integrated system. Last-mile connectivity is looked at as a sustainable measure in urban transportation and it helps discourse several common issues based on environmental, social, and economic aspects of transit systems. The authors of this paper have attempted to review several research papers, articles, and literature documents that help in understanding the concept of LMC on a national and international level.
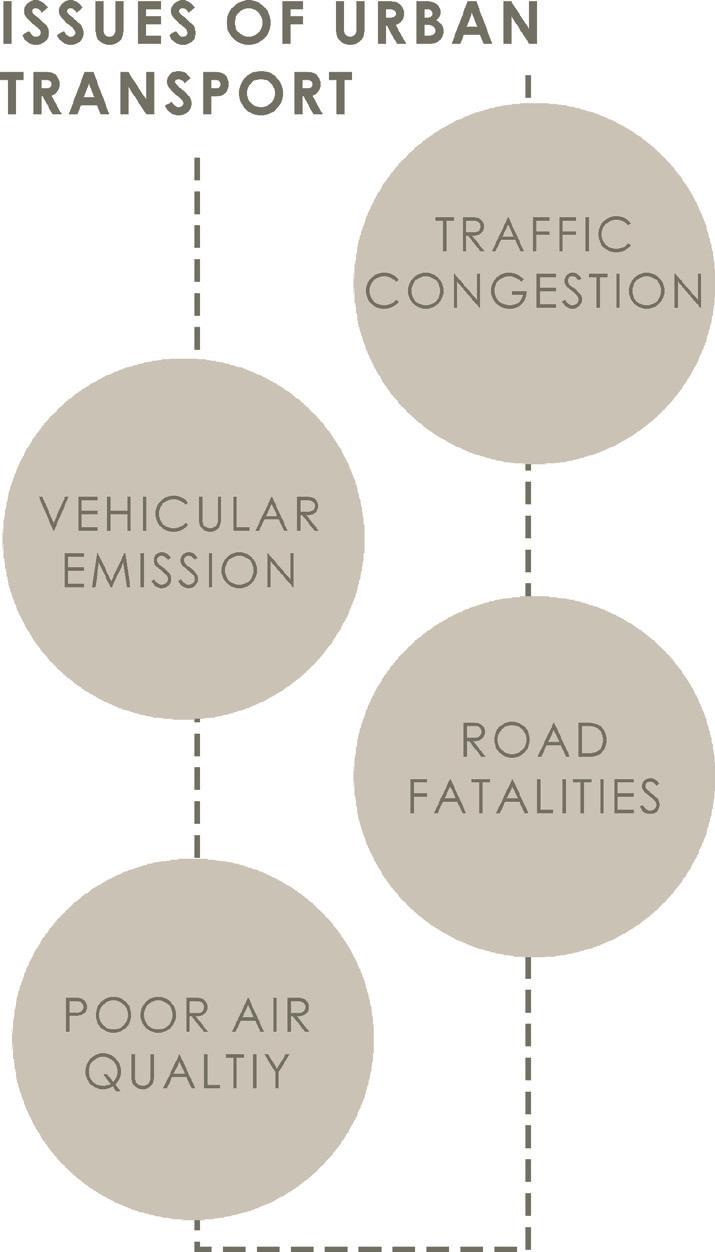
Cities play an essential role in the overall economic growth of a developing country. (A Chatterjee, 2023) . Since the beginning of the Industrial Revolution in India, the rise in the need for transportation facilities has been seen. Similarly, the need for urban transport has been increasing to cater to the expanding Indian economy. Urban transport in India faces several challenges in the form of traffic congestion, vehicular emissions, road fatalities, poor air quality, etc. The paper attempts to study the role of LMC in the Indian context by studying the cases of existing LMC services in different cities of the country. 6.3- Last Mile
I Hussain Lakdawala I Sem IX - X I Design Dissertation I Rizvi 45
Connectivity in the Indian Scenario: A literary review
Fig 6.3.1. Impacts of LMC (Author)
Fig 6.3.2. Issues of Urban Transport (Author)
The literature review of the paper is divided into 4 different sections:
1) Understanding the concept of LMC: This section explains the definitions of last-mile connectivity quoted by several prominent planners and researchers. It discusses several environmentally friendly transportation systems. Pedestrian-oriented and cycle-oriented planning can help make the concept of LMC more sustainable. (A Chatterjee, 2023).
2) How LMC is perceived globally: LMC is considered to be a sustainable solution to the issues of urban transport facilities. Implementation of LMC can help resolve problems like excess pollution levels, extra travel time, and waiting time, and more importantly, it is economically feasible. The key driver of Transportation is the access and mobility factors, not the travel mode (Hanson, 2015). Hence the focus should be on enhancing easy access and mobility rather than the type of transportation. (A Chatterjee, 2023)
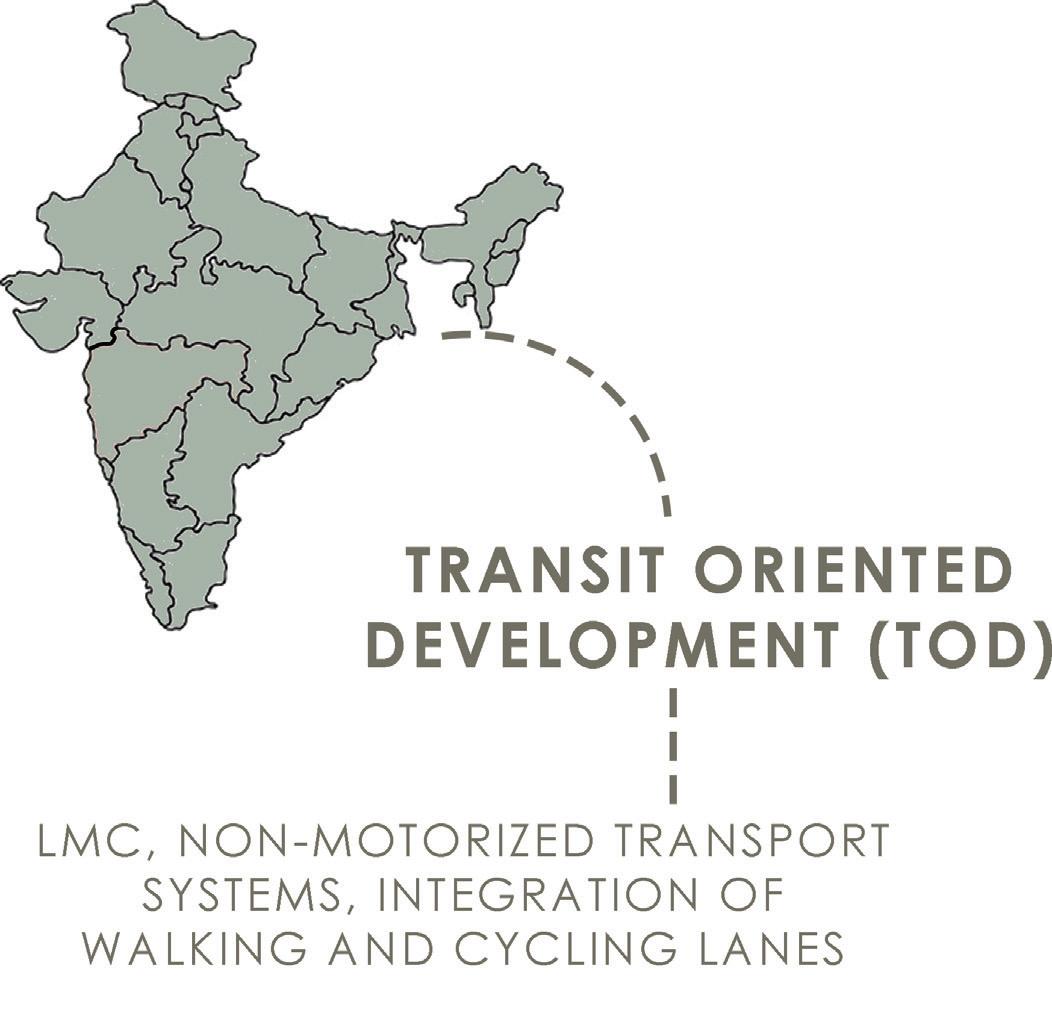
3) How LMC is perceived in Indian urban transportation policy frameworks: Indian metropolitan cities like Mumbai, Chennai, Delhi, and Kolkata are some of the most densely populated cities in the world. The transportation taking place in these cities is via road, rail, water, and air. Roadways are the major form of transportation in the country comprising 87% of passenger traffic and 60% of freight traffic. (MoRTH, 2022). Several planning authorities and the government of India are looking for policies for transit-oriented development (TOD), last-mile connectivity, non-motorized transportation systems, and the integration of walking and cycling methods in the neighborhoods. (A Chatterjee, 2023).
I Hussain Lakdawala I Sem IX - X I Design Dissertation I Rizvi 46
Fig 6.3.3. Impact of TOD on India (Author)
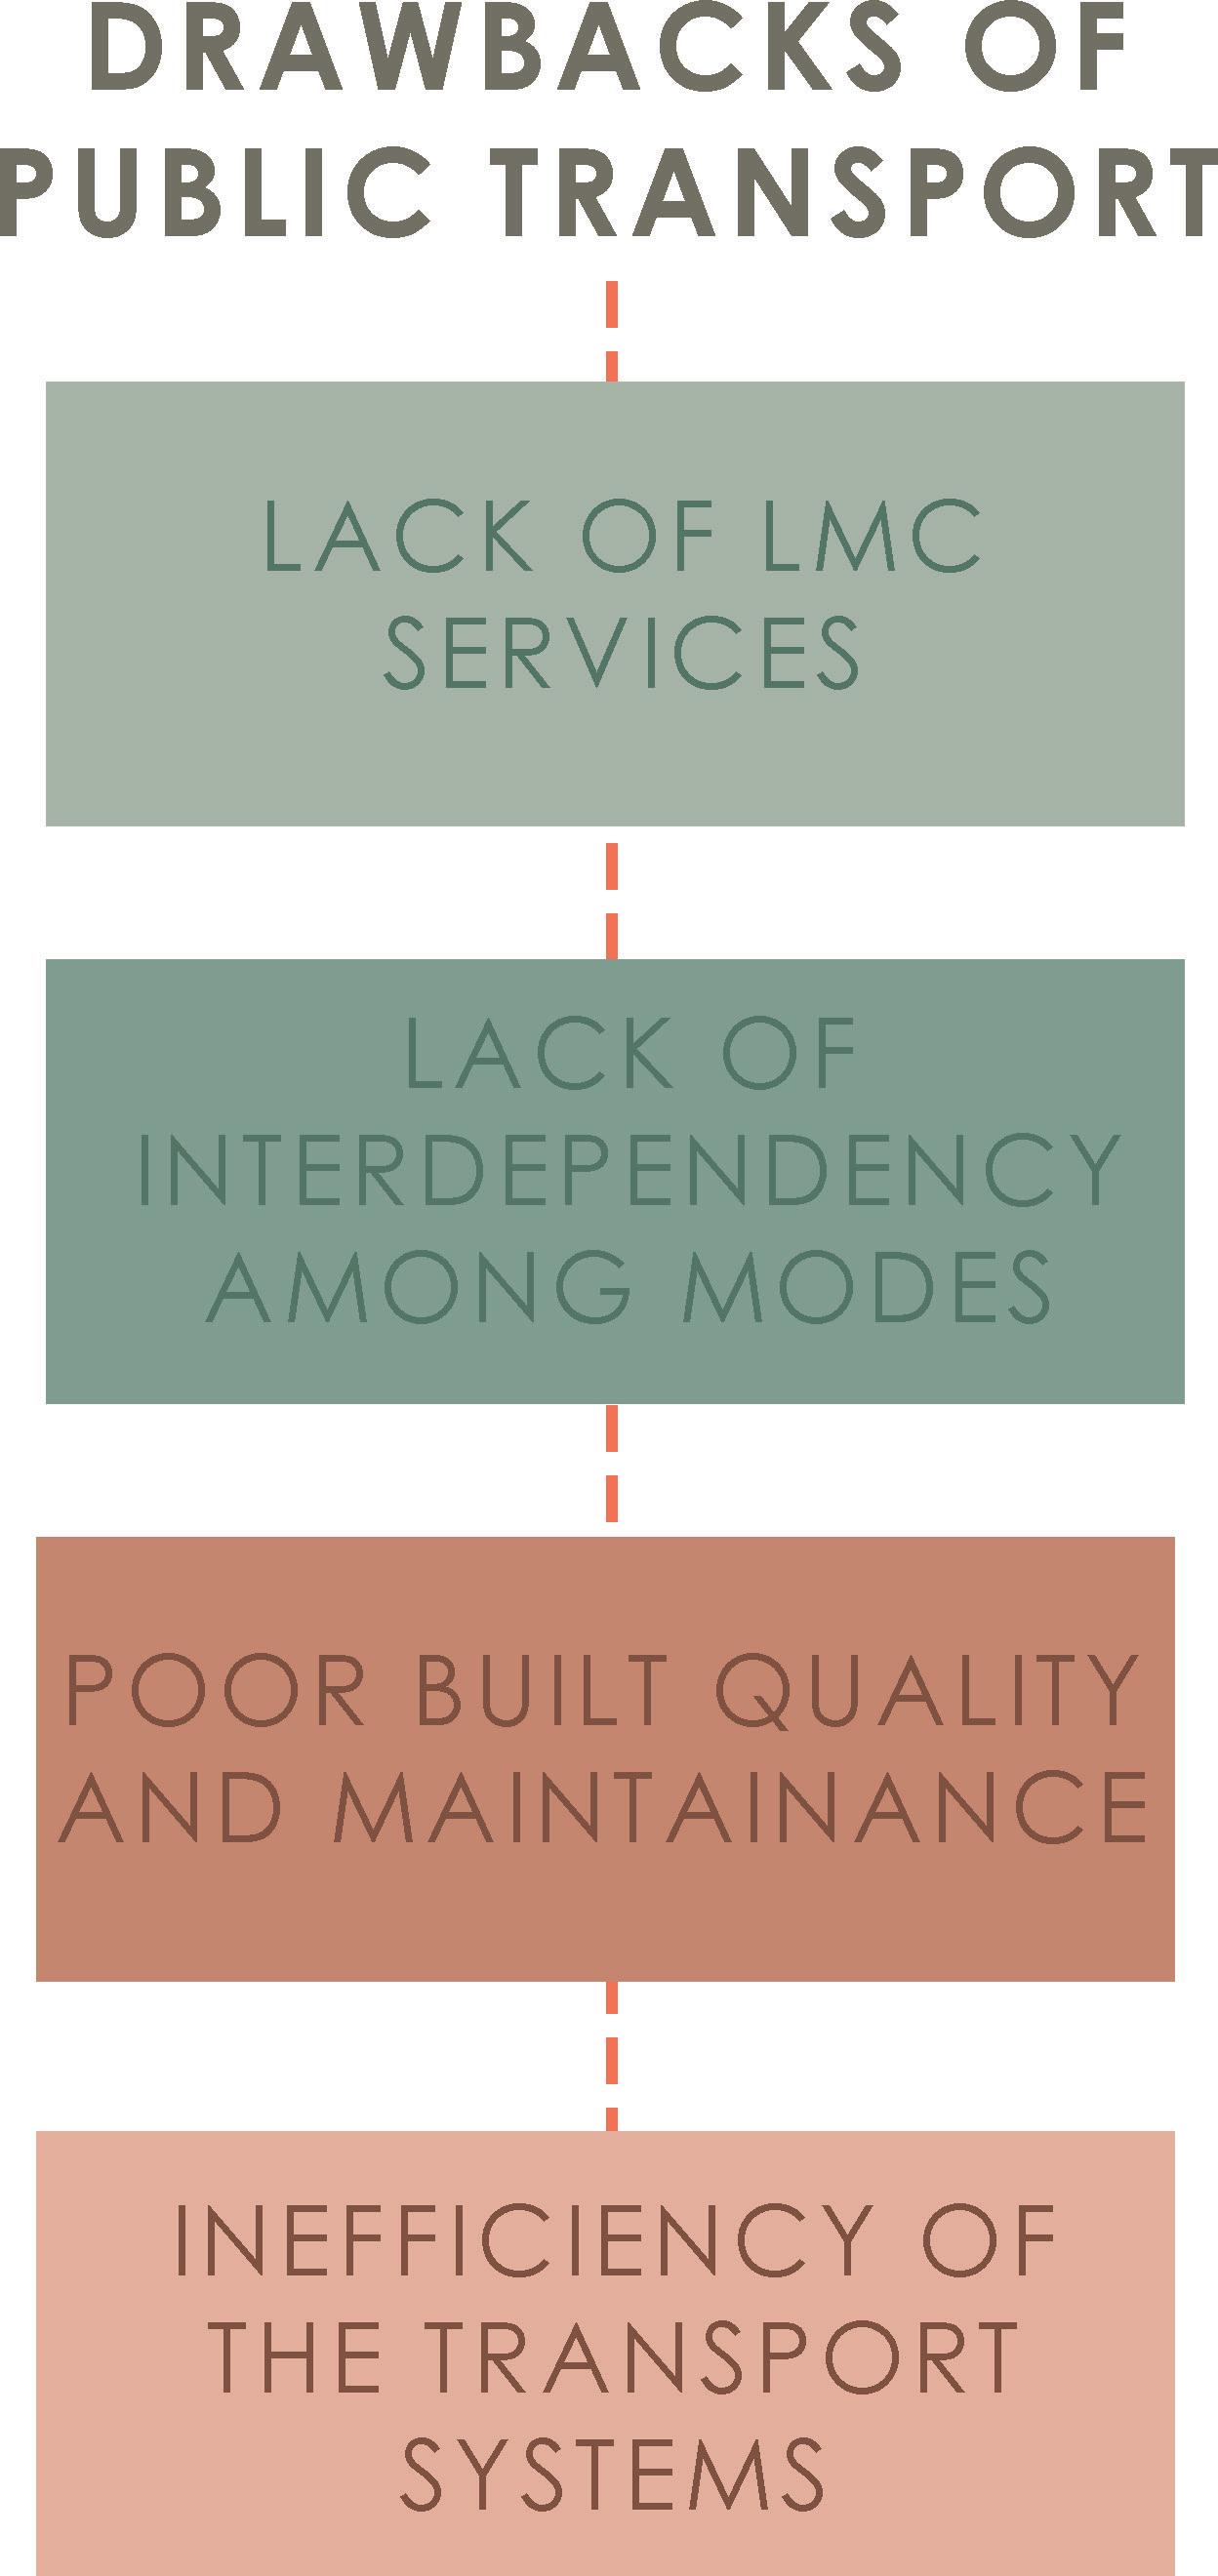
4) An overview of the LMC propositions in selected Indian cities: This section evaluates various methods and policies of urban transport implemented in different cities of the country and how the user reacts to the services provided. The conclusion of this section states that most users avoid the use of public transport due to its poor built quality, maintenance, inefficiency, lack of interdependence among multiple modes of transport, lack of LMC services, etc. This section suggests that transport services like autos and taxis should be looked at as feeder systems and not as competition for public transport. This will help in enhancing the user experience and encourage people to use public transport.
The paper concludes that the formulation of a framework for the LMC is required to evaluate its importance and implementation in urban transport systems. (A Chatterjee, 2023)
I Hussain Lakdawala I Sem IX - X I Design Dissertation I Rizvi 47
Fig 6.3.4. Drawbacks of Public transport (Author)
6.4- A Proposed Roadmap
to Enhance Last-Mile Connectivity in India’s Metro Rail Transit Systems
Report by Farha Irani (deputy town planner in the planning department of Mumbai Metro Rail Corporation). She focuses on planning schemes that include multi-modal transportation systems and last-mile connectivity.
The report starts off by mentioning the excess pressure formed on the urban transportation system of India due to the increasing population and how it will affect it in the near future. In India, the size of a city and the percentage of daily trips taken by commuters are directly linked (Irani, April 2022). A 2008 study by the Ministry of Housing and Urban Affairs (MoHUA) estimated that the number of daily trips in the top 87 urban centers will more than double from 228 million in 2007 to 482 million in 2031. This growth has increased the demand for public transport, which most Indian cities have been unable to meet due to the prevailing imbalance in the modal split favoring private vehicle usage amid the inadequate public transport infrastructure and its suboptimal use. (Irani, April 2022). The public transport facilities are not used as per their utmost capacity due to these reasons and also the lack of last-mile connectivity adds up to the point.
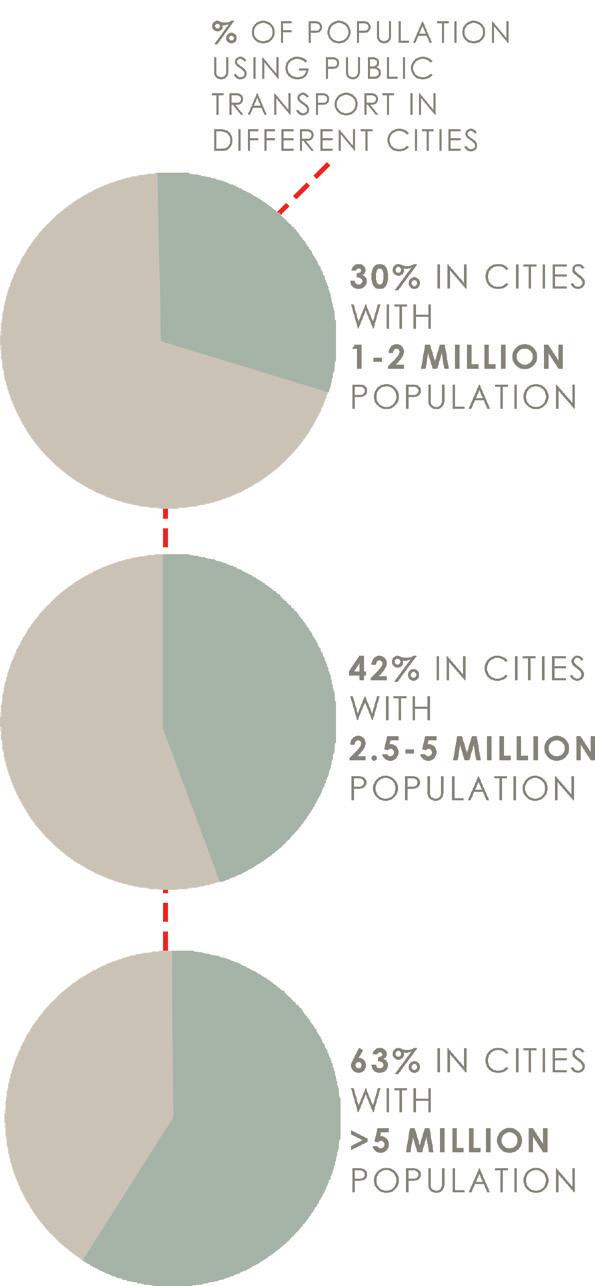
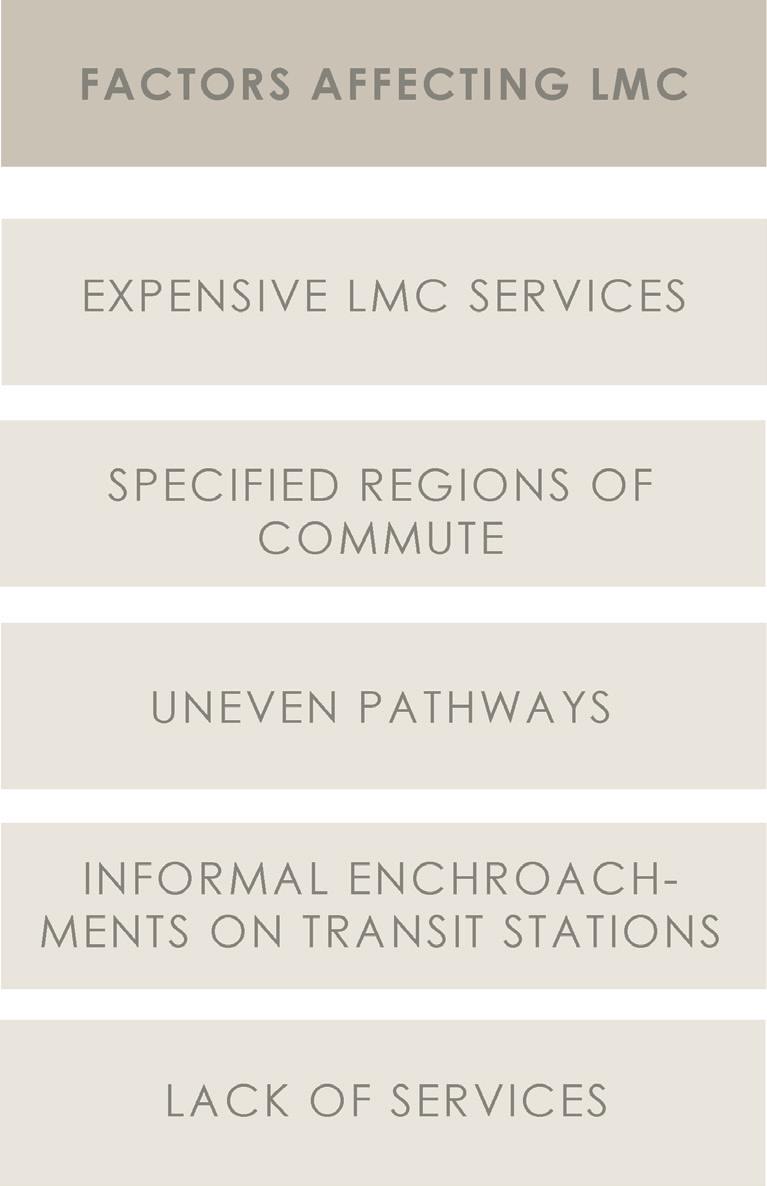
Public transportation systems account for 30 percent of trips in cities with populations between one and two million, 42 percent in areas with populations between two and five million, and 63 percent in cities with populations over five million. (Irani, April 2022). Due to the lack of public transport usage, the private vehicle growth has been 200 times compared to only 5 times of urban population growth. The use of feeder systems like autos, e-rickshaws, and taxis can be convenient but at the same time expensive, and also, they provide services in specific regions only. Apart from this, several site-specific issues like too far to access, uneven paths, informal encroachments on the paths, market setups on the footpaths and nodes, etc. can also affect the efficiency of LMC. (Irani, April 2022)
I Hussain Lakdawala I Sem IX - X I Design Dissertation I Rizvi 48
Fig 6.4.1. Pie charts showing usage of public transport in cities (Author)

The report also highlights how the city planning and policies do not account for a set of people with specific needs like the low-income groups, handicapped, women, elderly, and children. Since these spaces are not universally designed it does not encourage the idea of using public transport as a means for commuting. Apart from the bus and rail services which are governed by the state all other transport facilities and PTI are managed by several independent agencies. This leads to a lack of coordination as they are not accounted for by other modes of transport. Such lack of coordination makes it difficult for commuters to access multiple modes of transport and hence it fails the idea of last-mile connectivity.
Policy can play an important role in making urban transport sustainable through the implementation of last-mile connectivity. How pedestrian-driven planning along with the use of non-motorized systems can help improve not only connectivity but also resolve issues like traffic congestion, high pollution levels, travel time, etc. (Irani, April 2022).
I Hussain Lakdawala I Sem IX - X I Design Dissertation I Rizvi 49
Fig 6.4.2. Comparison with the size of the city and average population (Author)
Fig 6.4.3. Factors affecting LMC (Author)
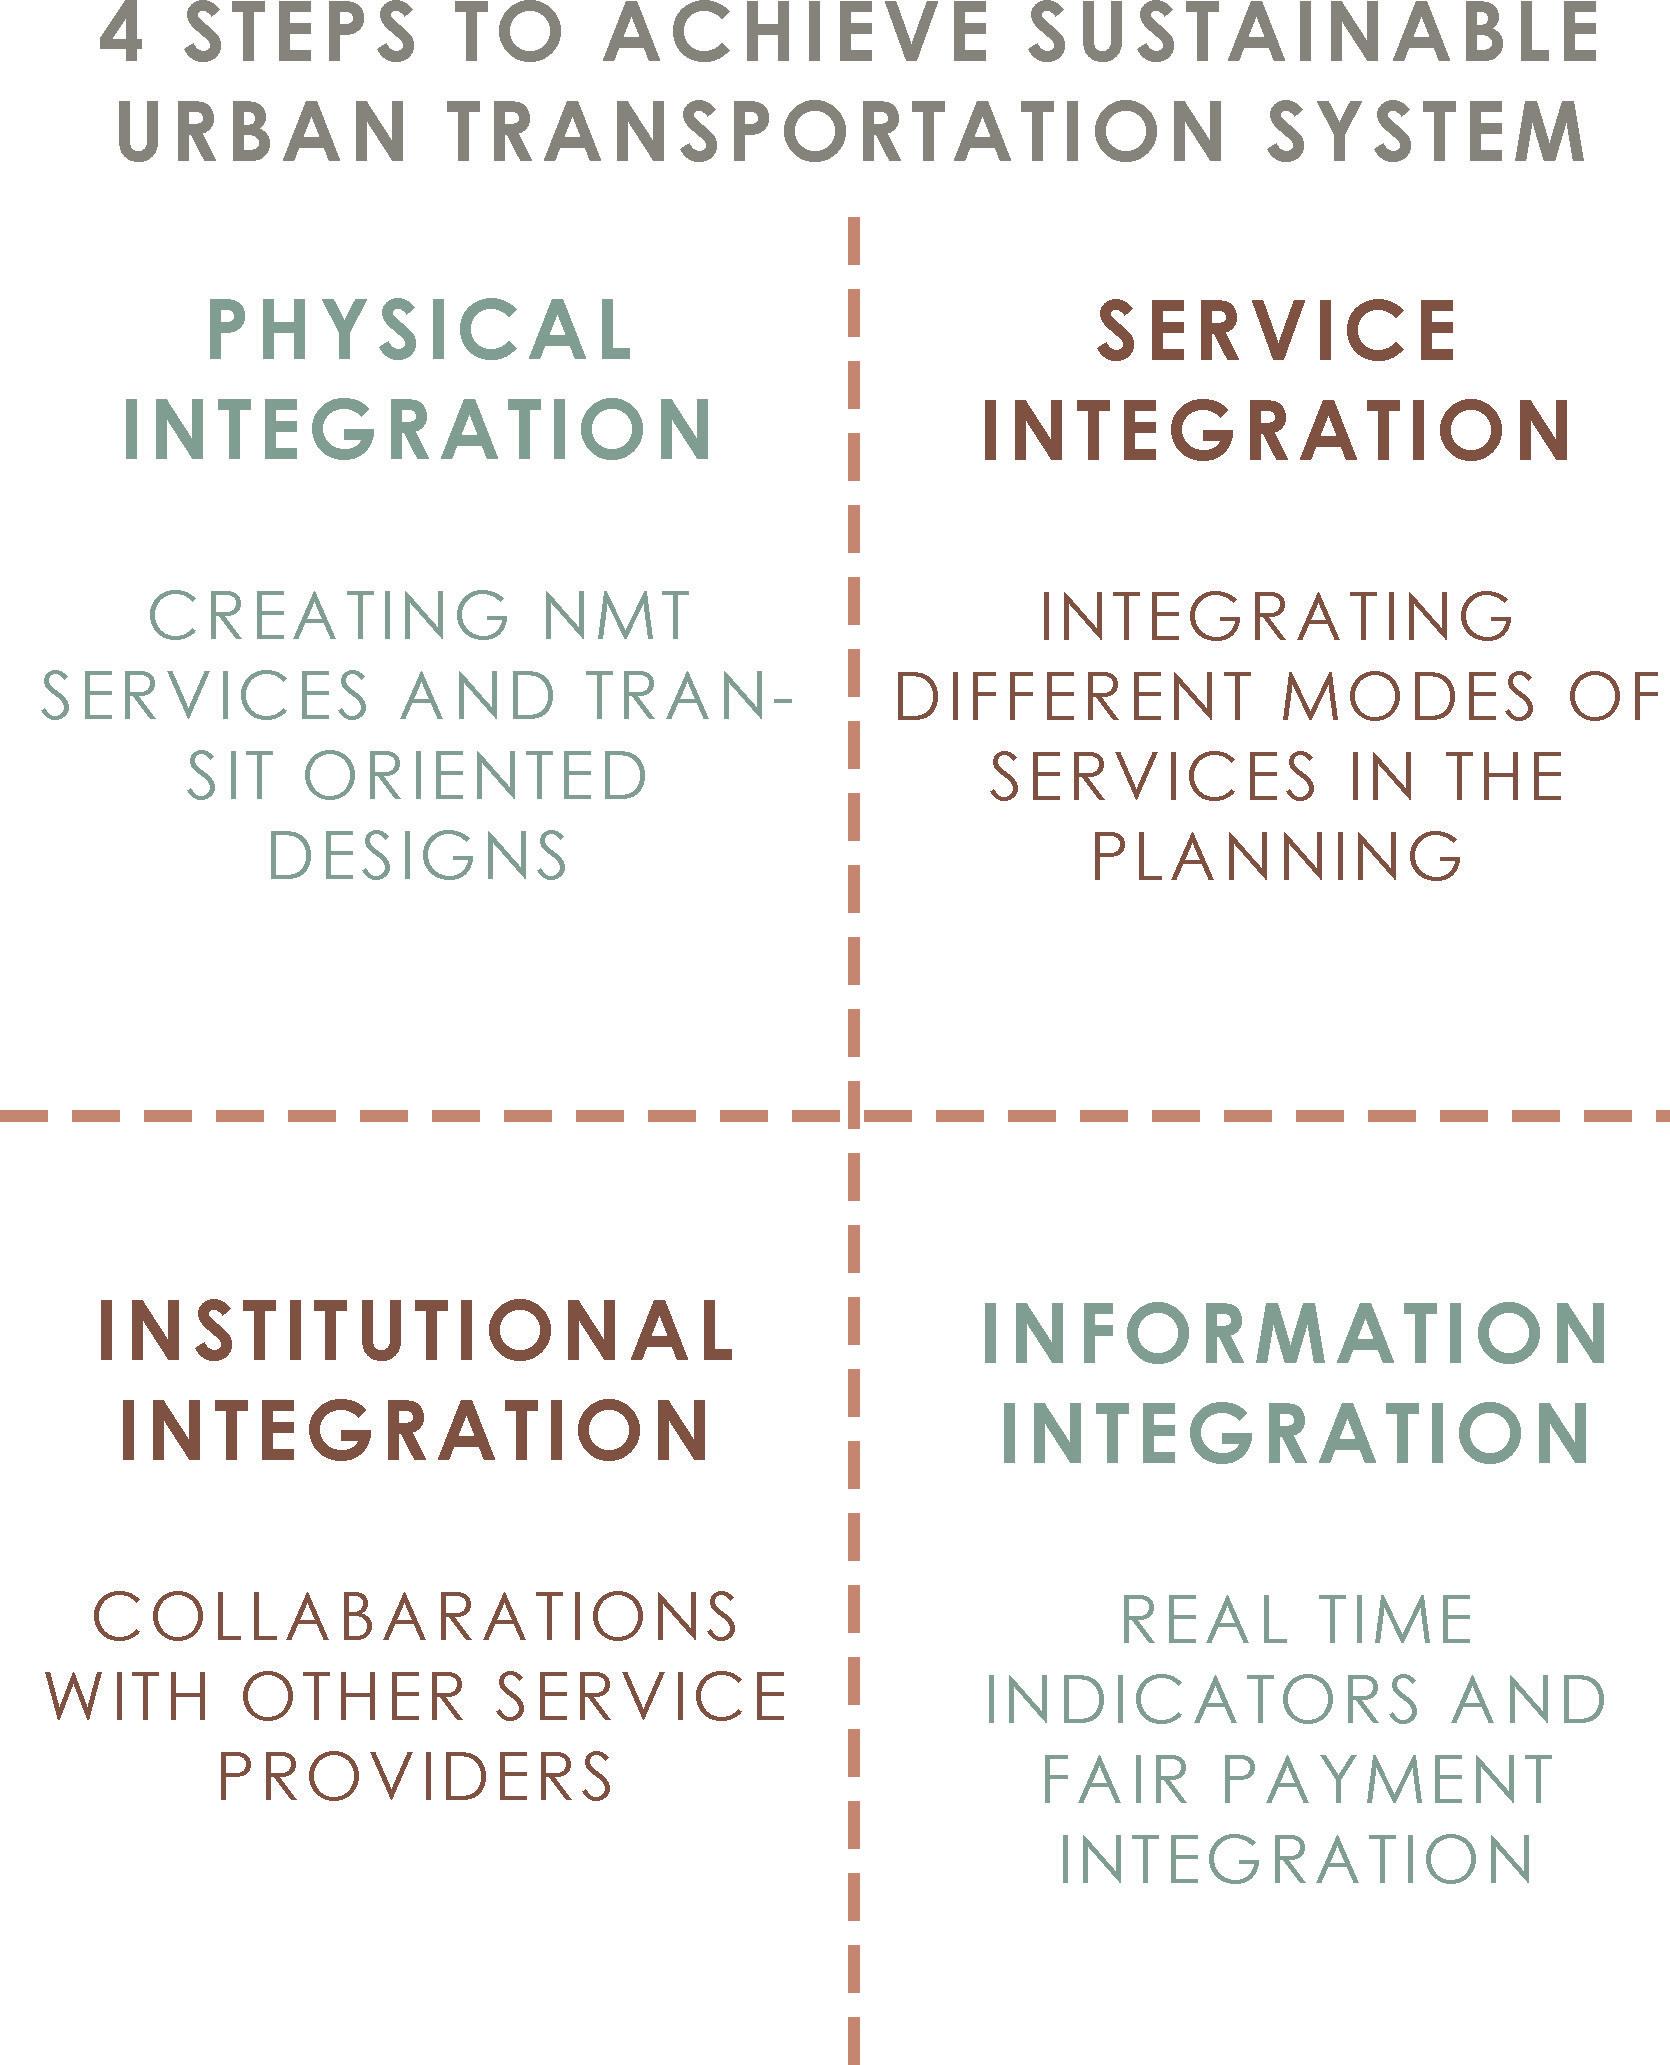
The report suggests that Structured last-mile connectivity will play an important role in maintaining and implementing a sustainable urban transport system. This can be achieved by 4 main aspects: physical integration, service integration, institutional integration, and information integration. Doing so will effectively improve people’s quality of life and positively impact urban economic growth. It may also inspire and serve as a model of development for other public mass transit systems. (Irani, April 2022).
I Hussain Lakdawala I Sem IX - X I Design Dissertation I Rizvi 50
Fig 6.4.4. Approach to achieve Sustainable Transport system (Author)
Report by: Chatrali Shirke , G. J. Joshi , V. Kandala , S. S. Arkatkard
As per Cervero (2006), TOD is a viable model for transportation and land-use integration in many rapidly developing cities of the world, including those in Asia. (Chatrali Shirkea, July 2016). It is said that TOD is a simple concept that can be defined as concentrating a moderately dense and pedestrian-friendly development around transit stations to promote the use of public transport, walking, use of bicycles, or any other mode over the use of private vehicles. TOD can be successful by the implementation of the 3 D’s density, diversity, and design.
Transit-oriented development schemes can play a very big role in adapting sustainable urban transportation in India It promotes the use of sustainable transport alternatives; it also helps in reducing the average travel time and trips. TOD development also has shown a significant decrease in traffic congestion as compared to conventional development. (Chatrali Shirkea, July 2016).
6.5- Transit Oriented Development and Its Impact on Level of Service of Roads & Metro: A Case Study of Mumbai Metro Line-I T.O.D
Density
Diversity Design
It also reduces the load on highways as people prefer to take the arterial roads to reach their destination faster. Moreover, a comprehensive analysis of TODs in the Washington,D.C., and Baltimore, Maryland, metropolitan areas by Zamir, K et al. (2014) found that people living in TODs made more trips by all modes of transportation but fewer trips by auto. The results also showed that TOD residents tended to travel shorter distances by all modes of transportation, a finding that implies the selection of closer destinations for their activities. (Chatrali Shirkea, July 2016).
I Hussain Lakdawala I Sem IX - X I Design Dissertation I Rizvi 51
Fig 6.5.1. The influence of 3D’S on T.O.D (Author)
Behaviour
TOD plays a vital role in sustainable development as Lindsey et al.(2010) suggest that substantial energy and greenhouse gas emissions savings are possible if commuters living and working close to rail were to use it for their daily work trips. Impacts on traffic and transportation, and physical and social infrastructure needs over the next 20 years are some of the major factors that affects the implementation of such potential move in the planning of the city. The study also demonstrates that with careful planning, design, financial modeling and phasing sustainable TOD communities can be created. Moreover, Renne (2009) presents a method to evaluate the sustainability of TODs based on five aspects of outcomes, including 1. Travel Behaviour, 2. The Local Economy, 3. The Natural Environment, 4. The Built Environment,5. The Social Environment. (Chatrali Shirkea, July 2016)
Sustainability of T.O.D’S
I Hussain Lakdawala I Sem IX - X I Design Dissertation I Rizvi 52
Natural Environment Travel
The Local Economy Built Environment Social Environment T.O.D Reduces Traffic Reduces Travel time Economic Promotes Walking Bicycle friendly Reduces Waiting time Promotes use of public trasnport Reduces Travel length
Fig 6.5.2. Sustainability of T.O.D’S (Author)
Fig 6.5.3. Benefits of T.O.D’S (Author)
I Hussain Lakdawala I Sem IX - X I Design Dissertation I Rizvi 53 Notes / Remarks
7.1- Case study on Virar Railway station
7.2- Case study on Bandra Railway station
7. Study of Cases
7.3- Case study on Andheri Railway station
7.4- Case study on Andheri Metro station
7.5- Case study on Thane Bus station
7.6- Case study on Ghatkopar Metro and Railway station
I Hussain Lakdawala I Sem IX - X I Design Dissertation I Rizvi 54
Criteria for Studying the
* The station should have access to atleast 2 or more modes of public transport.
* It should have access to atleast 2 or more PTI modes of transport.
* Average footfall throughout the day should be more than 1 lakh.
* There are 5 different parameters that define the existing condition of the station and station precinct.
1) Affordability
2) Comfort
3) Accessibility
4) Safety
5) Likeability
* Each parameter is scaled on a range of 1 to 5 with (1 being lowest and 5 being highest).
* Each case will have two inferences (user’s inferance and personal inference).
I Hussain Lakdawala I Sem IX - X I Design Dissertation I Rizvi 55
Cases 1 2 3 4 5
7.1. Virar Railway station
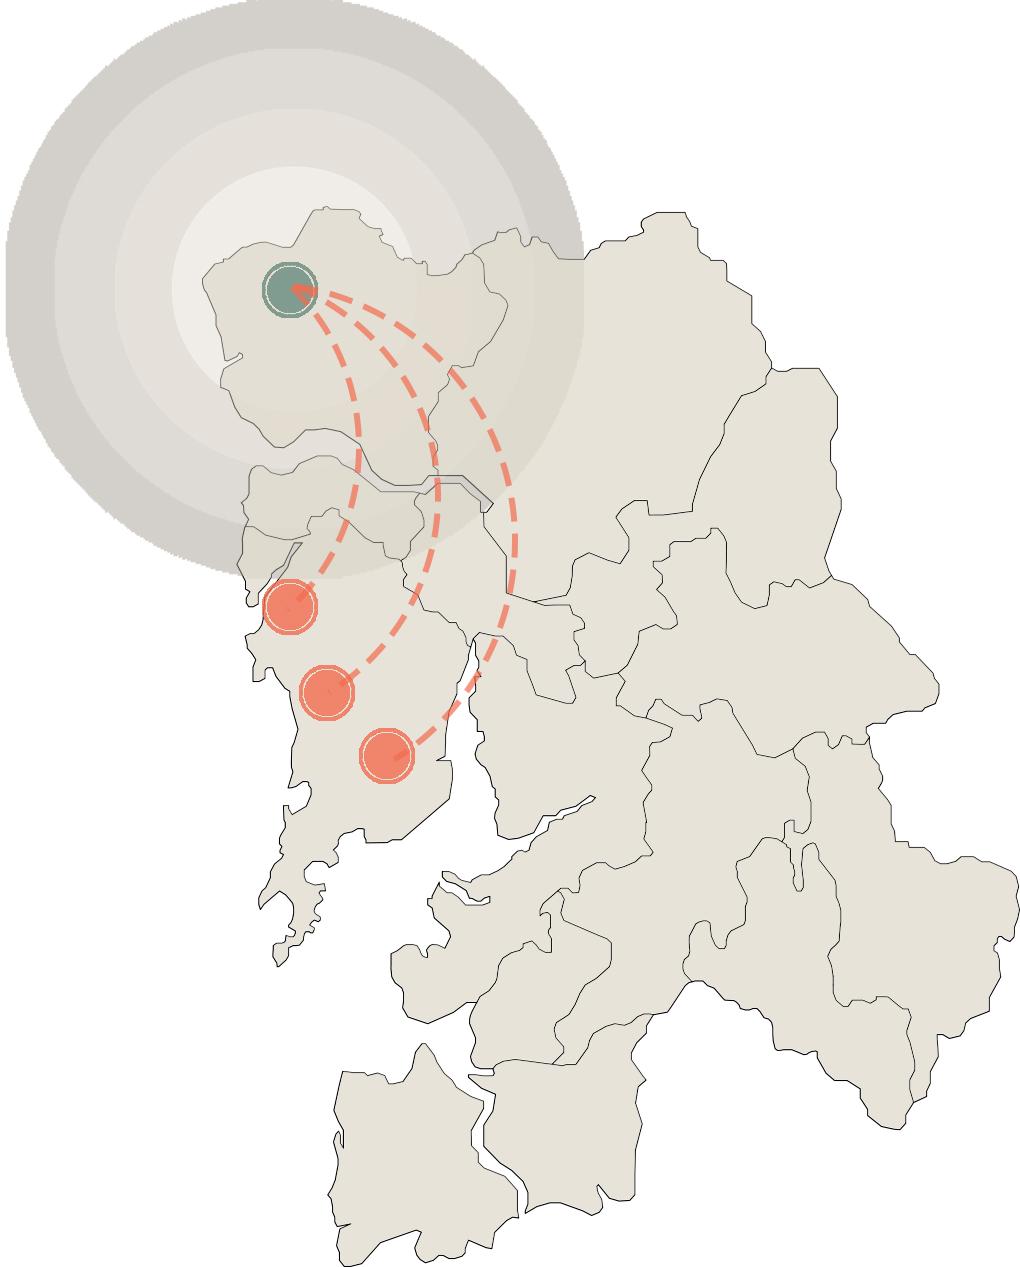

NAME: Parvinder Singh Chauhan
GENDER: Male.
AGE: 18 years.
OCCUPATION: Student.
* Does the planning of precinct help in the last-mile connectivity? -No
* Other factors affecting the lastmile connectivity? - Expensive
- Less efficient - No facilities
trip length: 40 kms
I Hussain Lakdawala I Sem IX - X I Design Dissertation I Rizvi 56
Virar
5 km 10 km 15 km 20 km
2. Borivali
1. Andheri
1. Andheri
3. Sion
Affordability Comfort Accessibility Safety Likeability Walking Modes of transport used Train Rickshaw 1 1 1 1 1 2 2 2 2 2 3 3 3 3 3 4 4 4 4 4 5 5 5 5 5
Average
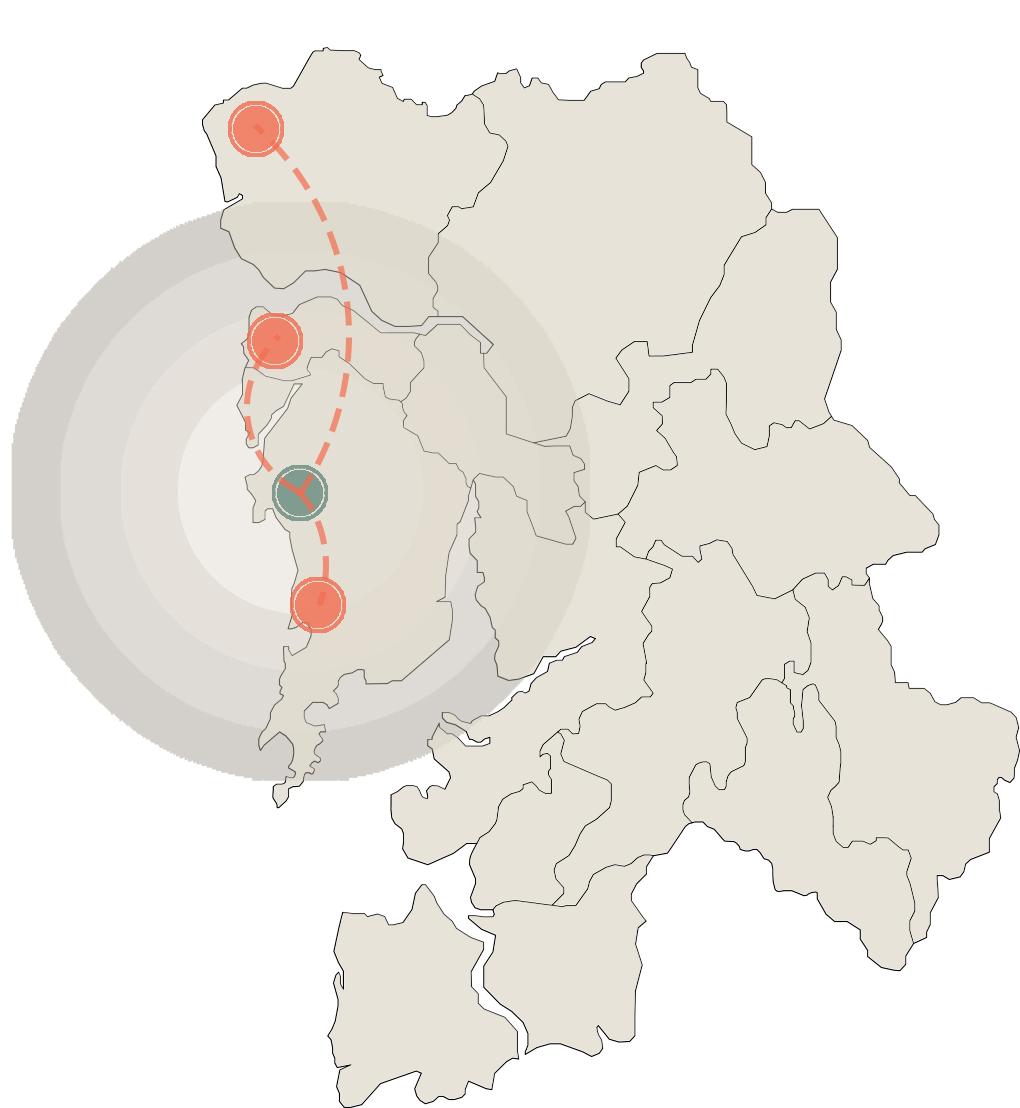
Fig 7.1.1. Map of MMR showing places travelled by users from Virar (Author)

NAME:
Reena Chavda
GENDER: Female.
AGE: 22 years.
OCCUPATION: Work / Employee.

NAME: Shalvesh Pawar.
GENDER: Male.
AGE: 28 years.
OCCUPATION: Work / Employee.
* Does the planning of precinct help in the last-mile connectivity? -Yes.
* Other factors affecting the lastmile connectivity?
- Traffic
- Lots of rickshaw stands
- No space to walk
Average trip length: 35 kms
USER’S INFERENCE
* Does the planning of precinct help in the last-mile connectivity? -Yes.
* Other factors affecting the lastmile connectivity?
- Lots of rickshaw stands
- No space to walk
Average trip length: 40-45 kms
* Requires more walking space.
* There are no proper infrasturture to guide the para-transit modes.
* Traffic congestion due to excess rickshaws.
* Ricksghaws are the major contributors of last-mile connectivity.
* The station precinct does not help in last-mile connectivity.
* Public transport access is good.
I Hussain Lakdawala I Sem IX - X I Design Dissertation I Rizvi 57
Affordability Affordability Comfort Comfort Accessibility Accessibility Safety Safety Likeability Likeability Walking Bus Modes of transport used Modes of transport used Train Train Rickshaw Rickshaw
1 1 1 1 1 1 1 1 1 1 2 2 2 2 2 2 2 2 2 2 3 3 3 3 3 3 3 3 3 3 4 4 4 4 4 4 4 4 4 4 5 5 5 5 5 5 5 5 5 5
3. Sion
2. Borivali
PERSONAL INFERENCE
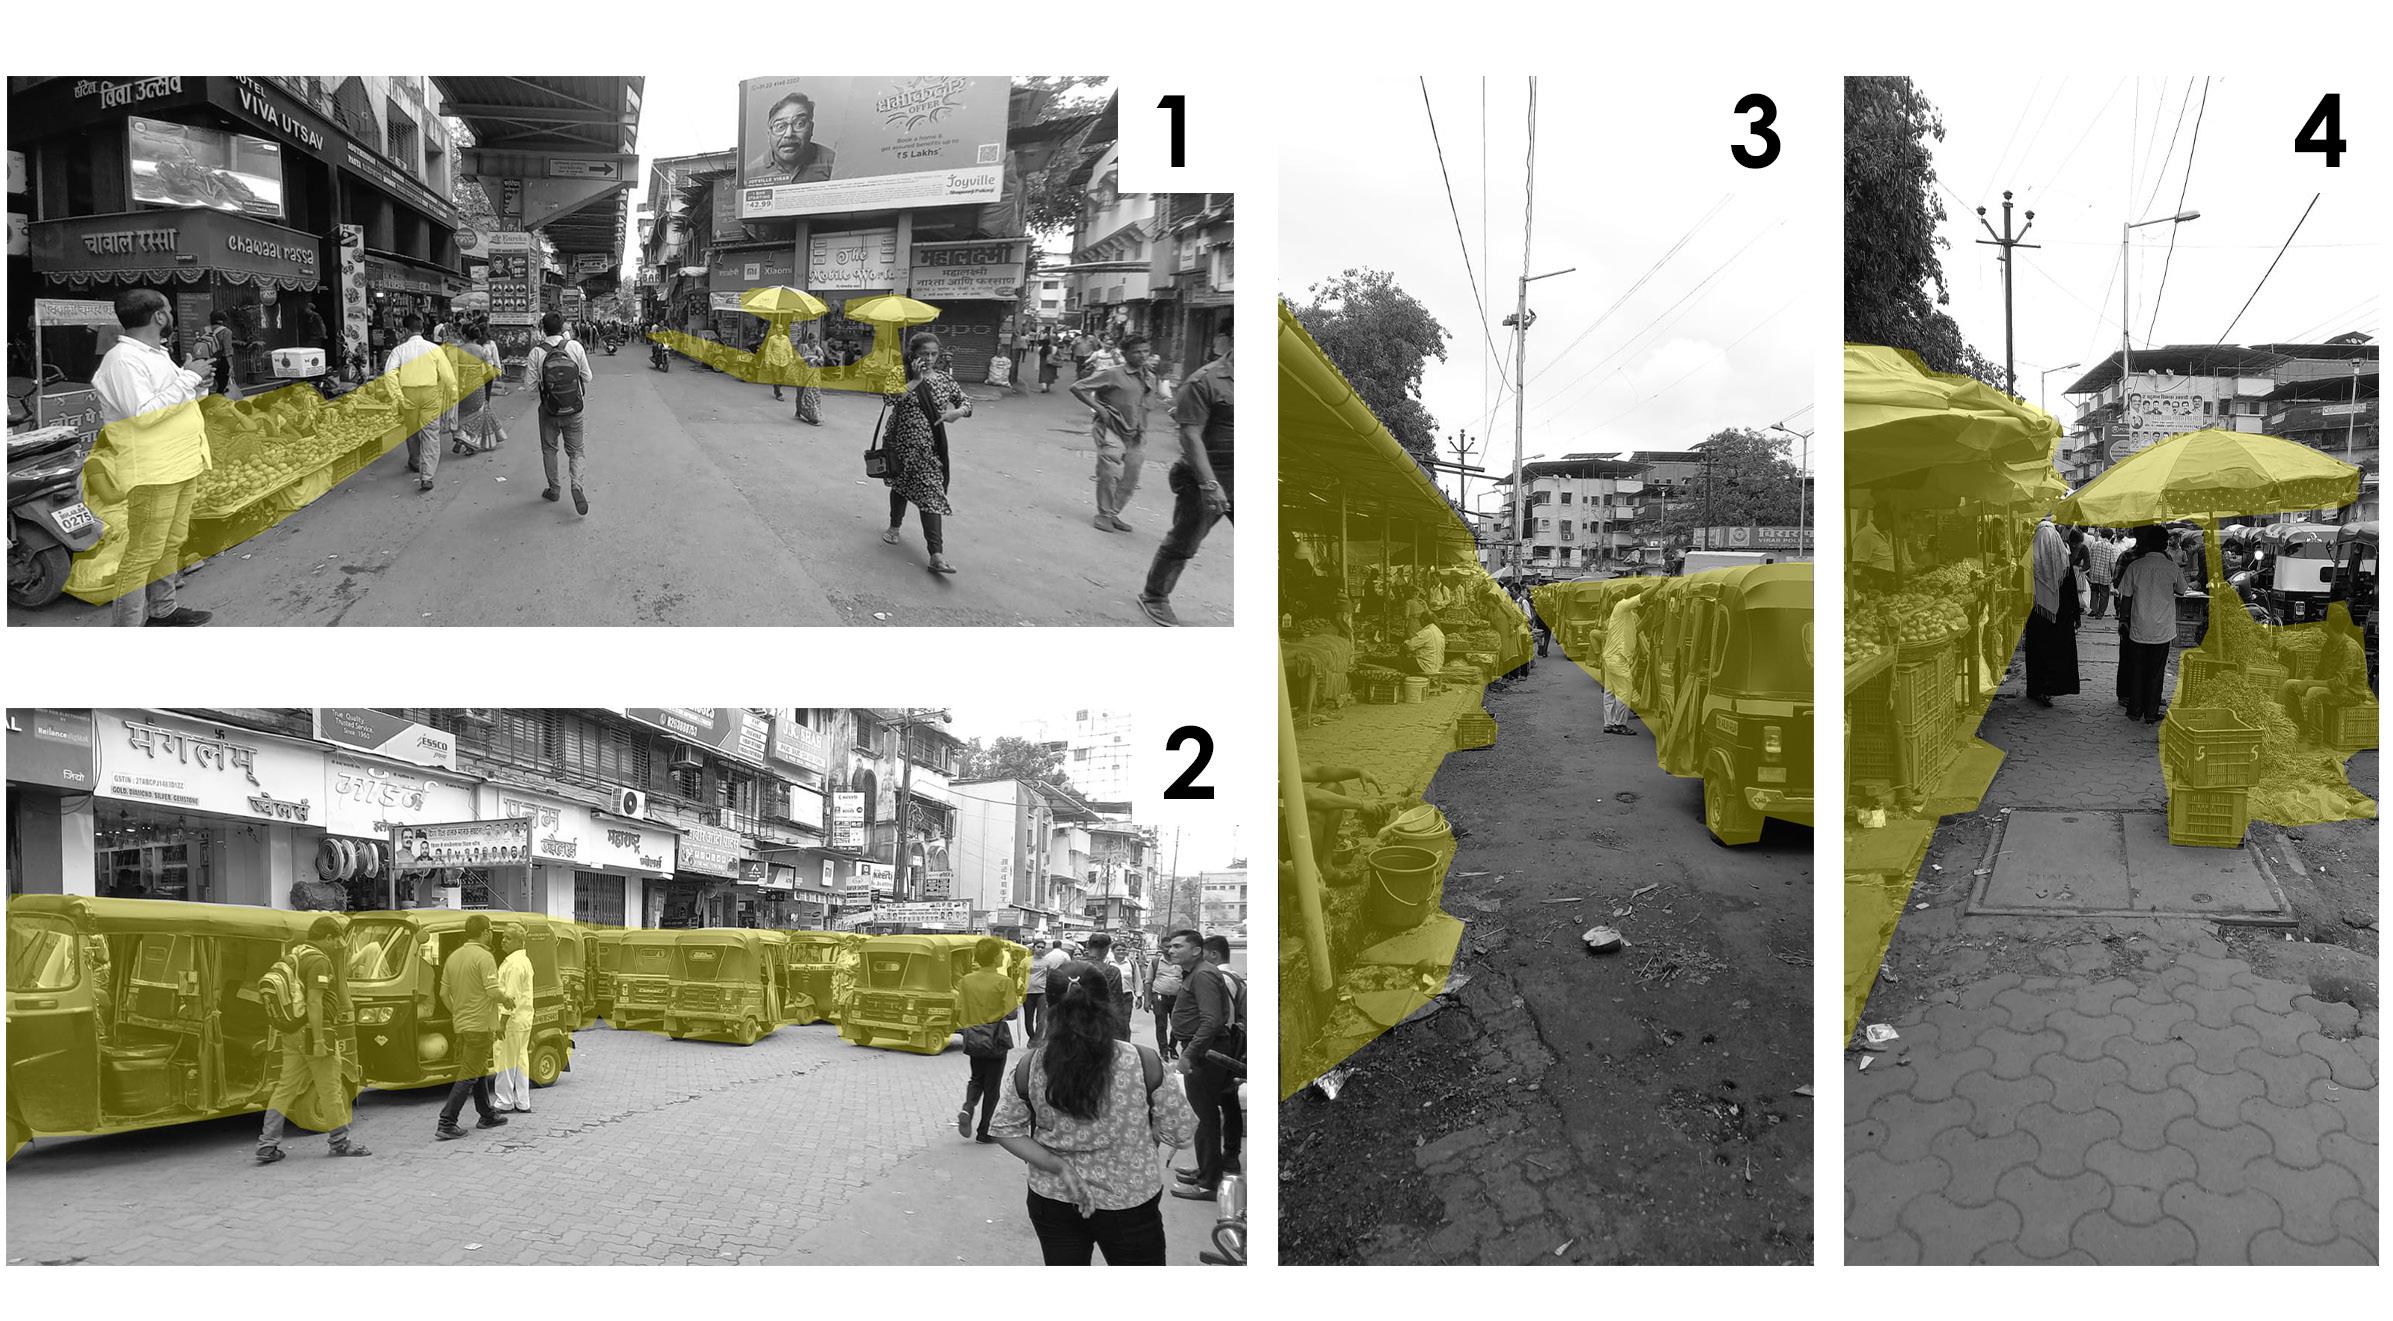
1. Informal market set up near station road.
2. Excess number of rickshaws with no guiding lanes.
3. Narrow spaces to walk between markets and ricksahaw stands.
4. Stalls covering major part of pedestrian Footpaths.
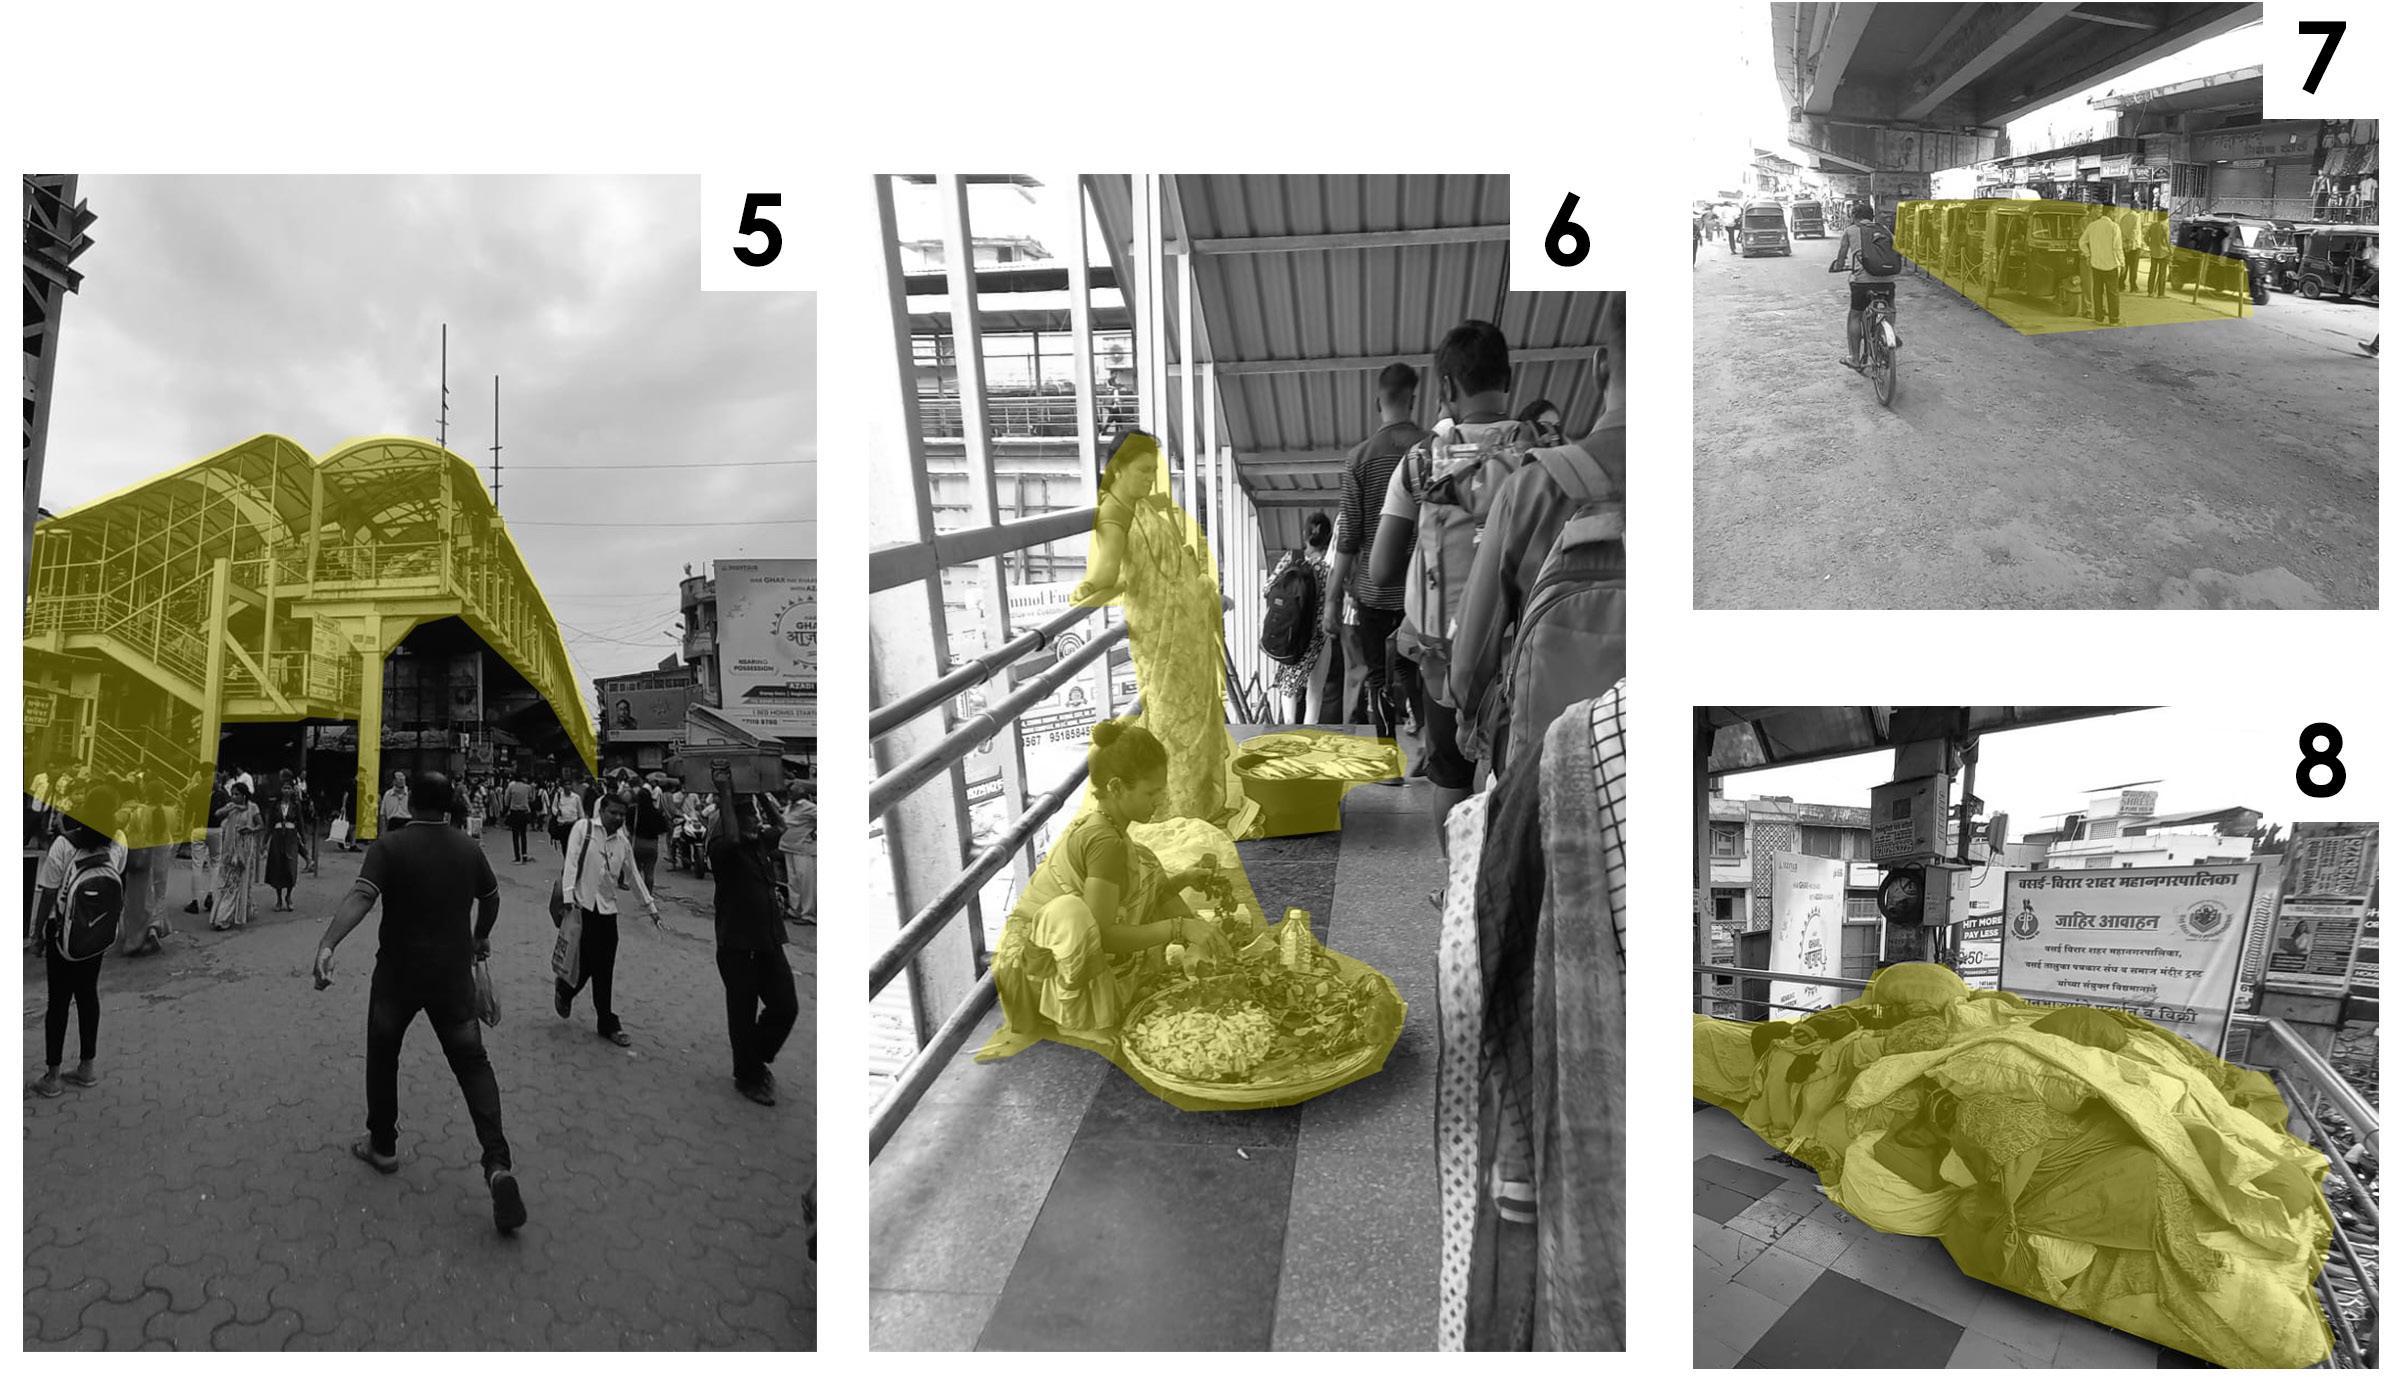
5. Pedestrian skywalk connecting station to Other parts of the city.
6. Hawkers on bridges hinders proper flow of people.
7. Rickshaw stands near station precinct.
8. Informal settlements on skywalks.
I Hussain Lakdawala I Sem IX - X I Design Dissertation I Rizvi 58
Fig 7.1.2. Vendors stalls near the exit of station (Author)
Fig 7.1.3. Improper flow of traffic (Author)
Fig 7.1.4. Narrow walking lanes (Author)
Fig 7.1.5. Enchroachment of stalls (Author)
Fig 7.1.6. Defunct skywalk due to lack of maintainance (Author)
Fig 7.1.7. Informal set-ups on skywalks and bridges (Author)
Fig 7.1.9. Informal encroachment on skywalks (Author)
Fig 7.1.8. Rickshaw stands (Author)
7.2. Bandra Railway station

NAME: Yogesh Mishra
GENDER: Male.
AGE: 38 years.
OCCUPATION: Construction worker.
* Does the planning of precinct help in the last-mile connectivity? -No
* Other factors affecting the lastmile connectivity?
- Less frequency
- No proper drop-off points
Average trip length: 25 kms
I Hussain Lakdawala I Sem IX - X I Design Dissertation I Rizvi 59
Bandra
2. Malad 1. Sewri
1. Sewri
3. Churchgate
Affordability Comfort Accessibility Safety Likeability Walking Modes of transport used Train Bus 1 1 1 1 1 2 2 2 2 2 3 3 3 3 3 4 4 4 4 4 5 5 5 5 5
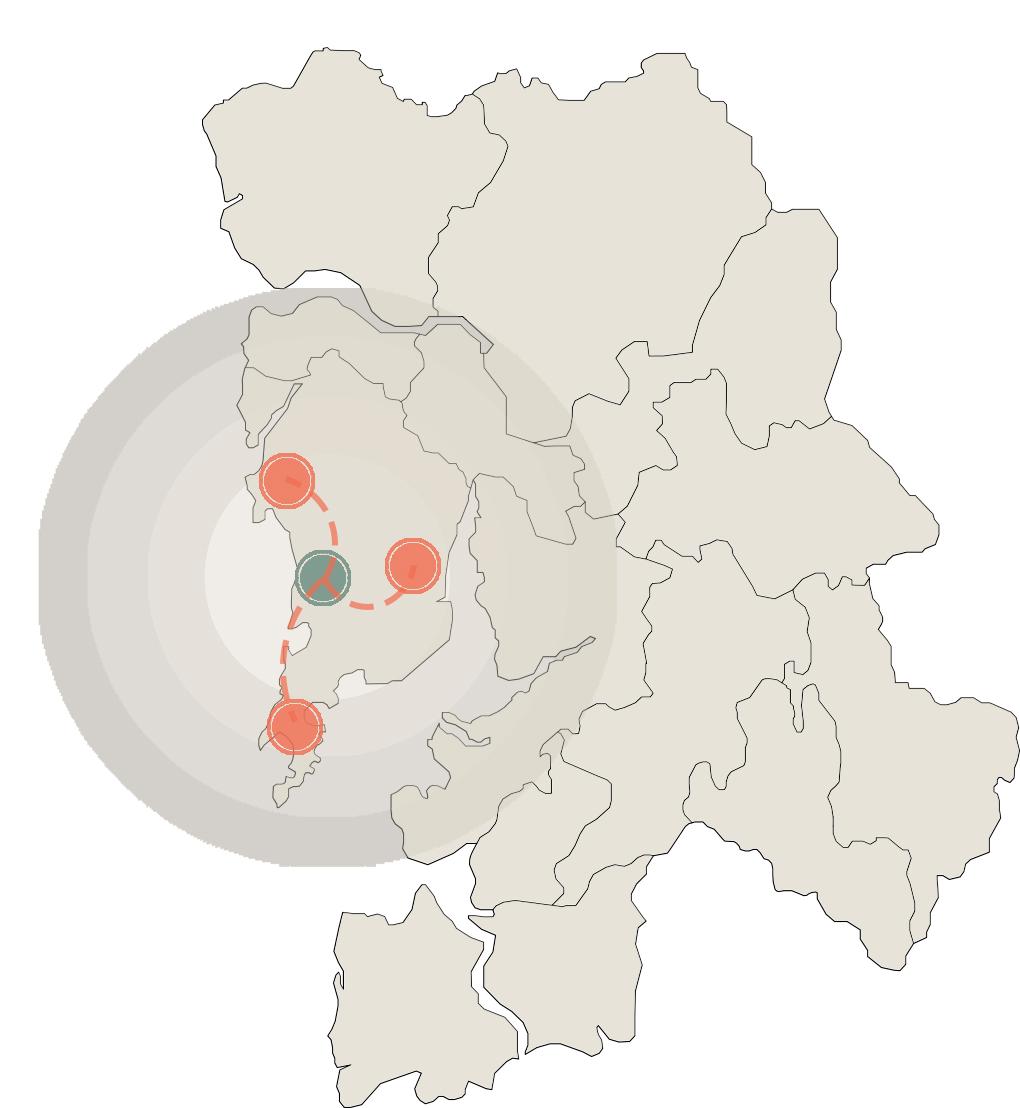
Fig 7.2.1. Map of MMR showing places travelled by users from Bandra (Author)
5km10km15km20km

NAME: Nilima Jha
GENDER: Female.
AGE: 55 years.
PHYSICAL CONDITION: Short limb.
OCCUPATION: Work / Employee.
* Does the planning of precinct help in the last-mile connectivity? -No.
* Other factors affecting the lastmile connectivity?
- No planning for the disabled
- Long waiting hours for bus
- Expensive rickshaw fairs
Average trip length: 15 kms

NAME: Andrew Joseph.
GENDER: Male.
AGE: 19 years.
OCCUPATION: Student.
* Does the planning of precinct help in the last-mile connectivity? -No.
* Other factors affecting the lastmile connectivity?
- Lots of rickshaws
- Unnecessary barricades to guide people in a specific way.
Average trip length: 20 kms
USER’S INFERENCE
* There are no proper infrasturture to guide the para-transit modes.
* Traffic congestion due to excess rickshaws.
* No consideration for physically disabled people.
* Pedestrian movement is not defined well.
* The station precinct help in last-mile connectivity.
* Bus service are available near the station precinct.
I Hussain Lakdawala I Sem IX - X I Design Dissertation I Rizvi 60
Affordability Affordability Comfort Comfort Accessibility Accessibility Safety Safety Likeability Likeability Walking Bus Modes of transport used Modes of transport used Train Train Rickshaw
1 1 1 1 1 1 1 1 1 1 2 2 2 2 2 2 2 2 2 2 3 3 3 3 3 3 3 3 3 3 4 4 4 4 4 4 4 4 4 4 5 5 5 5 5 5 5 5 5 5
3. Churchgate
2. Malad

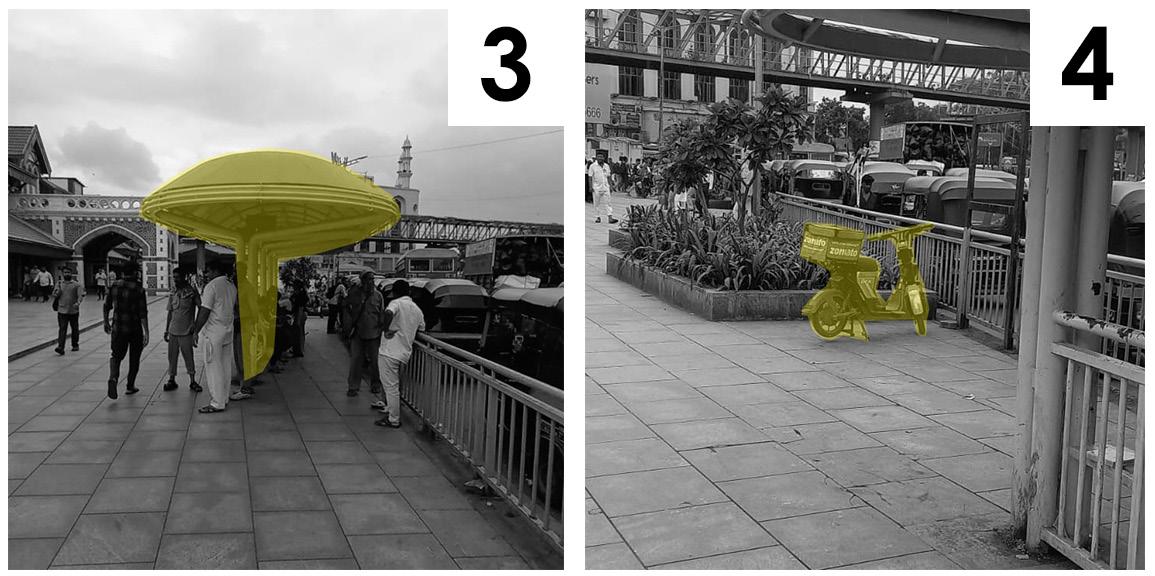
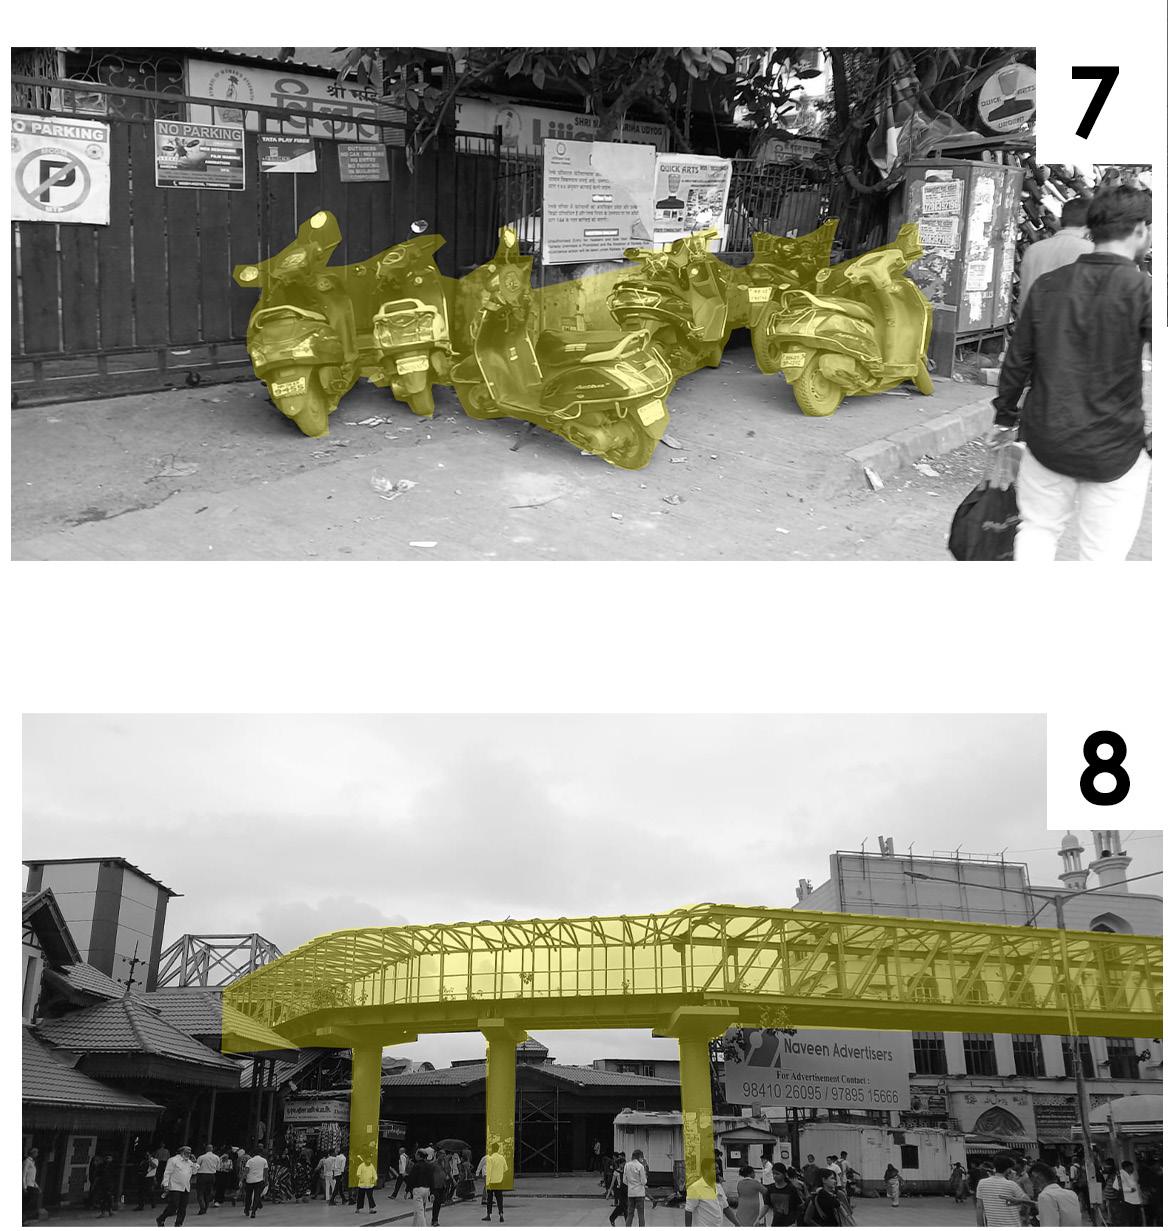
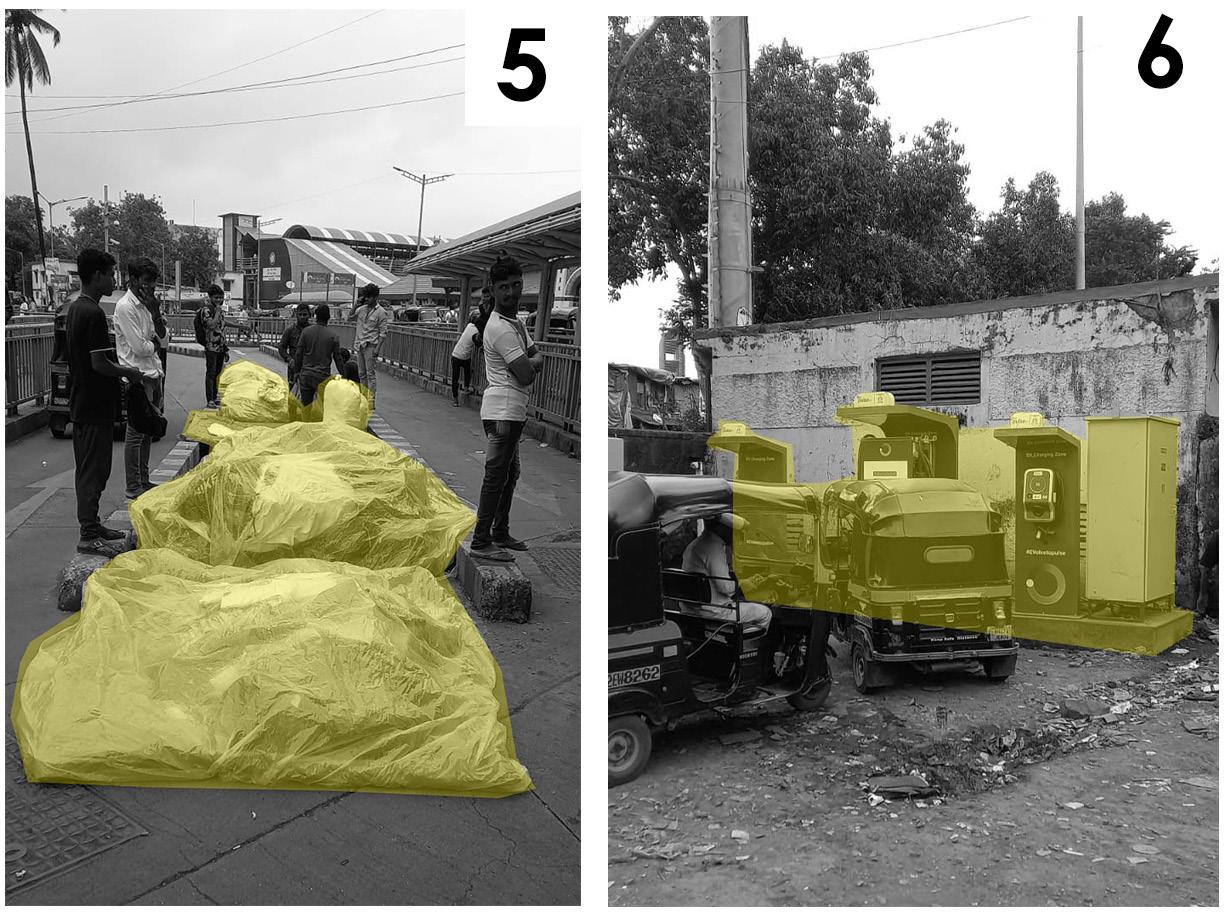
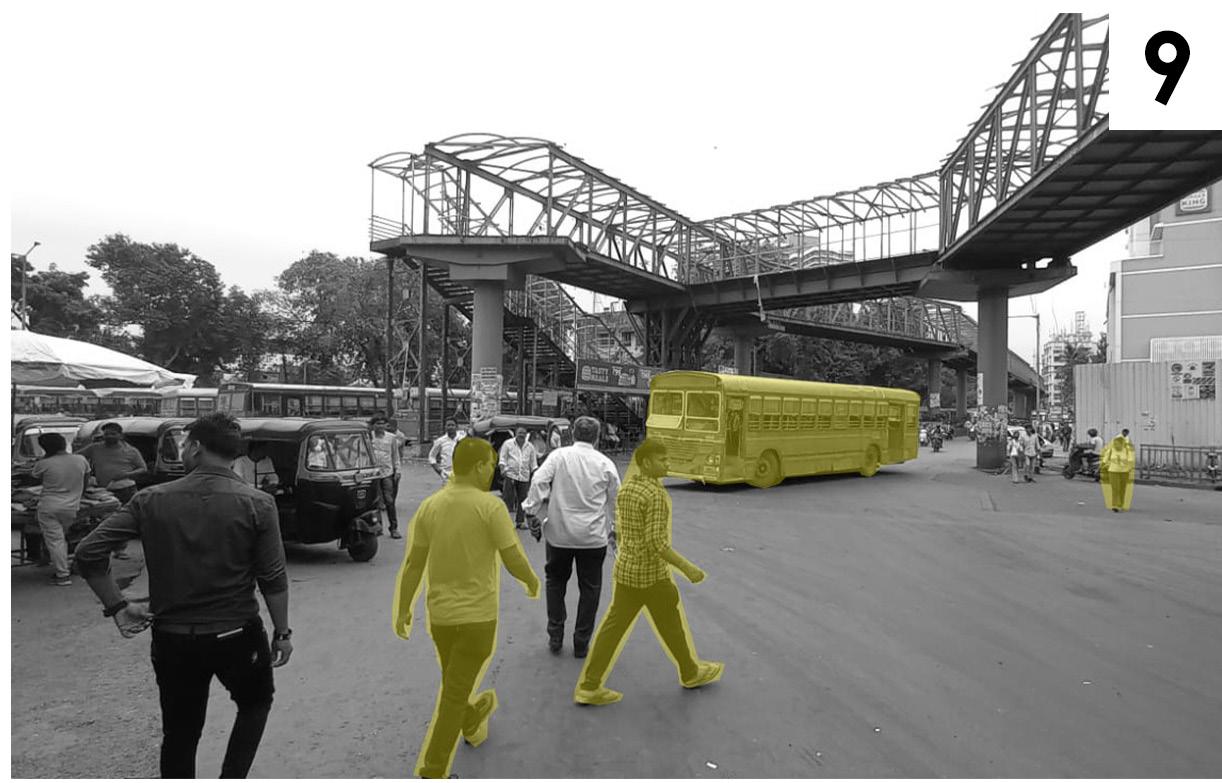
PERSONAL INFERENCE
1. Excess number of rickshaws with no guiding lanes.
2. No specific bus lanes hinders the movement of buses.
3. Bus stops are small and insufficient to cater the footfall.
4. Limited para-transit transport alternatives.
5. Market set ups on rickshaw lanes.
6. Charging points for electric vehicles.
7. Private vehicles parking on footpaths.
8. Non-functional skywalk.
9. No seperate pedestrian walkways.
I Hussain Lakdawala I Sem IX - X I Design Dissertation I Rizvi 61
Fig 7.2.2. Excess of Rickshaws congesting traffic (Author)
Fig 7.2.8. No proper parking spaces provided (Author)
Fig 7.2.9. Defunct skywalk due to poor maintainance (Author) Fig 7.2.10. Flow of traffic and pedestrian (Author)
Fig 7.2.3. No proper flow of vehciles (Author)
Fig 7.2.4. Small Bus-stops unable to cater footfall (Author)
Fig 7.2.5. Different modes of PTA available (Author)
Fig 7.2.6. Hawkers encroaching the Rickshaw lanes (Author)
Fig 7.2.7. Electric charging points provided at station (Author)
7.3. Andheri Railway station
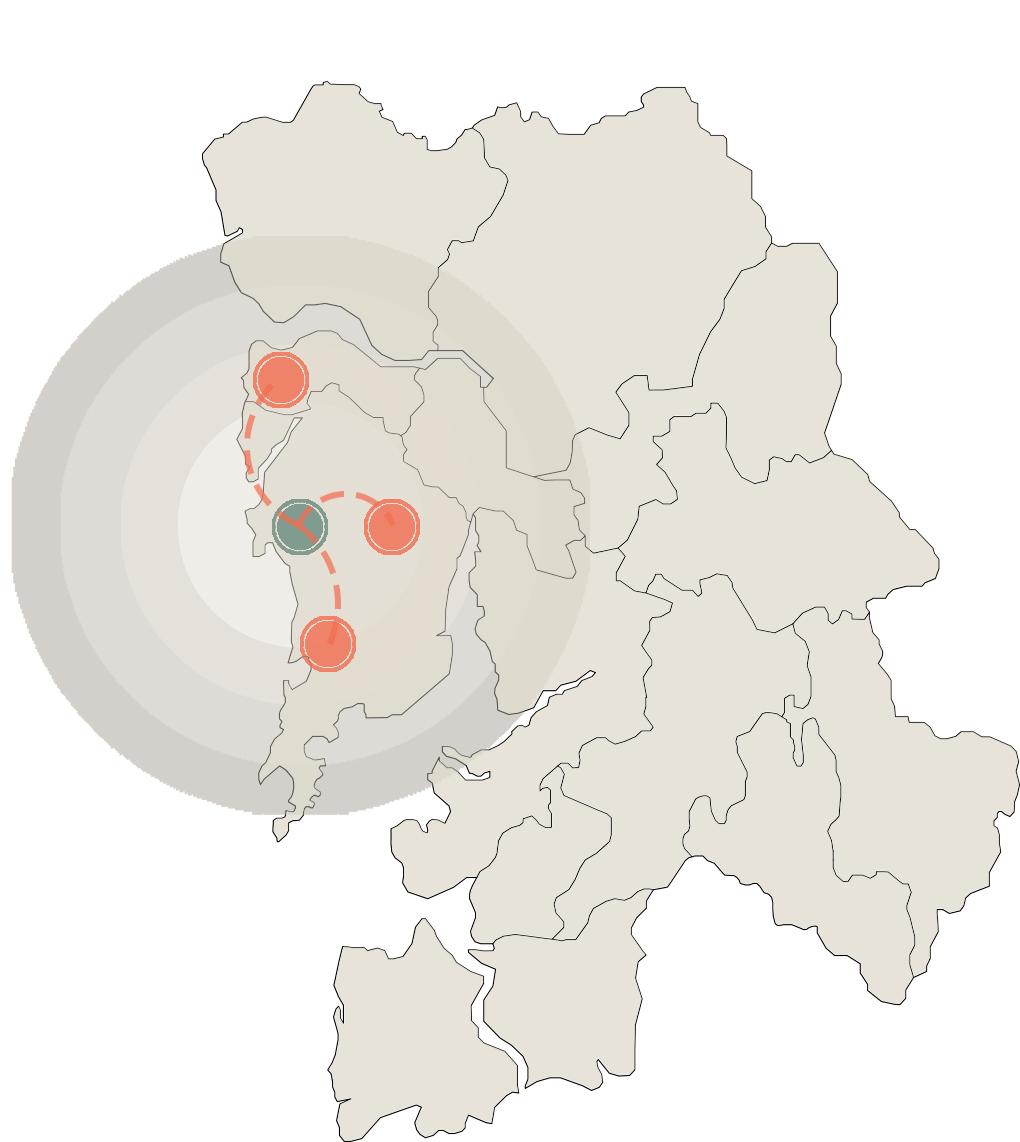

NAME: Vinayak Katiyar
GENDER: Male.
AGE: 22 years.
OCCUPATION: Student. Andheri
* Does the planning of precinct help in the last-mile connectivity?
-No
* Other factors affecting the lastmile connectivity?
- No specific rickshaw stands
- Bus stops are situated far from railway station
trip length: 10 kms
I Hussain Lakdawala I Sem IX - X I Design Dissertation I Rizvi 62
5km10km15km20km 2.
1. Mira Road
Bandra
1. Mira Road
3. Sakinaka
Affordability Comfort Accessibility Safety Likeability Bus Modes of transport used Train Rickshaw 1 1 1 1 1 2 2 2 2 2 3 3 3 3 3 4 4 4 4 4 5 5 5 5 5
Fig 7.3.1. Map of MMR showing places travelled by users from Andheri (Author)
Average

NAME: Nidhi Raut
GENDER: Female.
AGE: 18 years.
PHYSICAL CONDITION: N/A.
OCCUPATION: Student.
* Does the planning of precinct help in the last-mile connectivity? -Yes.
* Other factors affecting the lastmile connectivity?
- Rickshaw fairs are expensive.
- Less bus services
- Less frequency
Affordability

NAME: Jitesh.
GENDER: Male.
AGE: 23 years.
Affordability
Walking Train Rickshaw Bus
Average trip length: 10 kms
OCCUPATION: Work / Employee.
Walking
Modes of transport used Train
Modes of transport used
* Para-transit modes are expensive.
* Traffic congestion due to excess rickshaws.
* Bus services are less efficient.
* No public transport facility near station precinct.
* Does the planning of precinct help in the last-mile connectivity? -No.
* Other factors affecting the lastmile connectivity?
- Traffic
- Timing issues
Average trip length: 40-50 kms
I Hussain Lakdawala I Sem IX - X I Design Dissertation I Rizvi 63
Comfort Comfort Accessibility Accessibility Safety Safety
Likeability
Likeability
USER’S INFERENCE 1 1 1 1 1 1 1 1 1 1 2 2 2 2 2 2 2 2 2 2 3 3 3 3 3 3 3 3 3 3 4 4 4 4 4 4 4 4 4 4 5 5 5 5 5 5 5 5 5 5
3. Sakinaka
2. Bandra
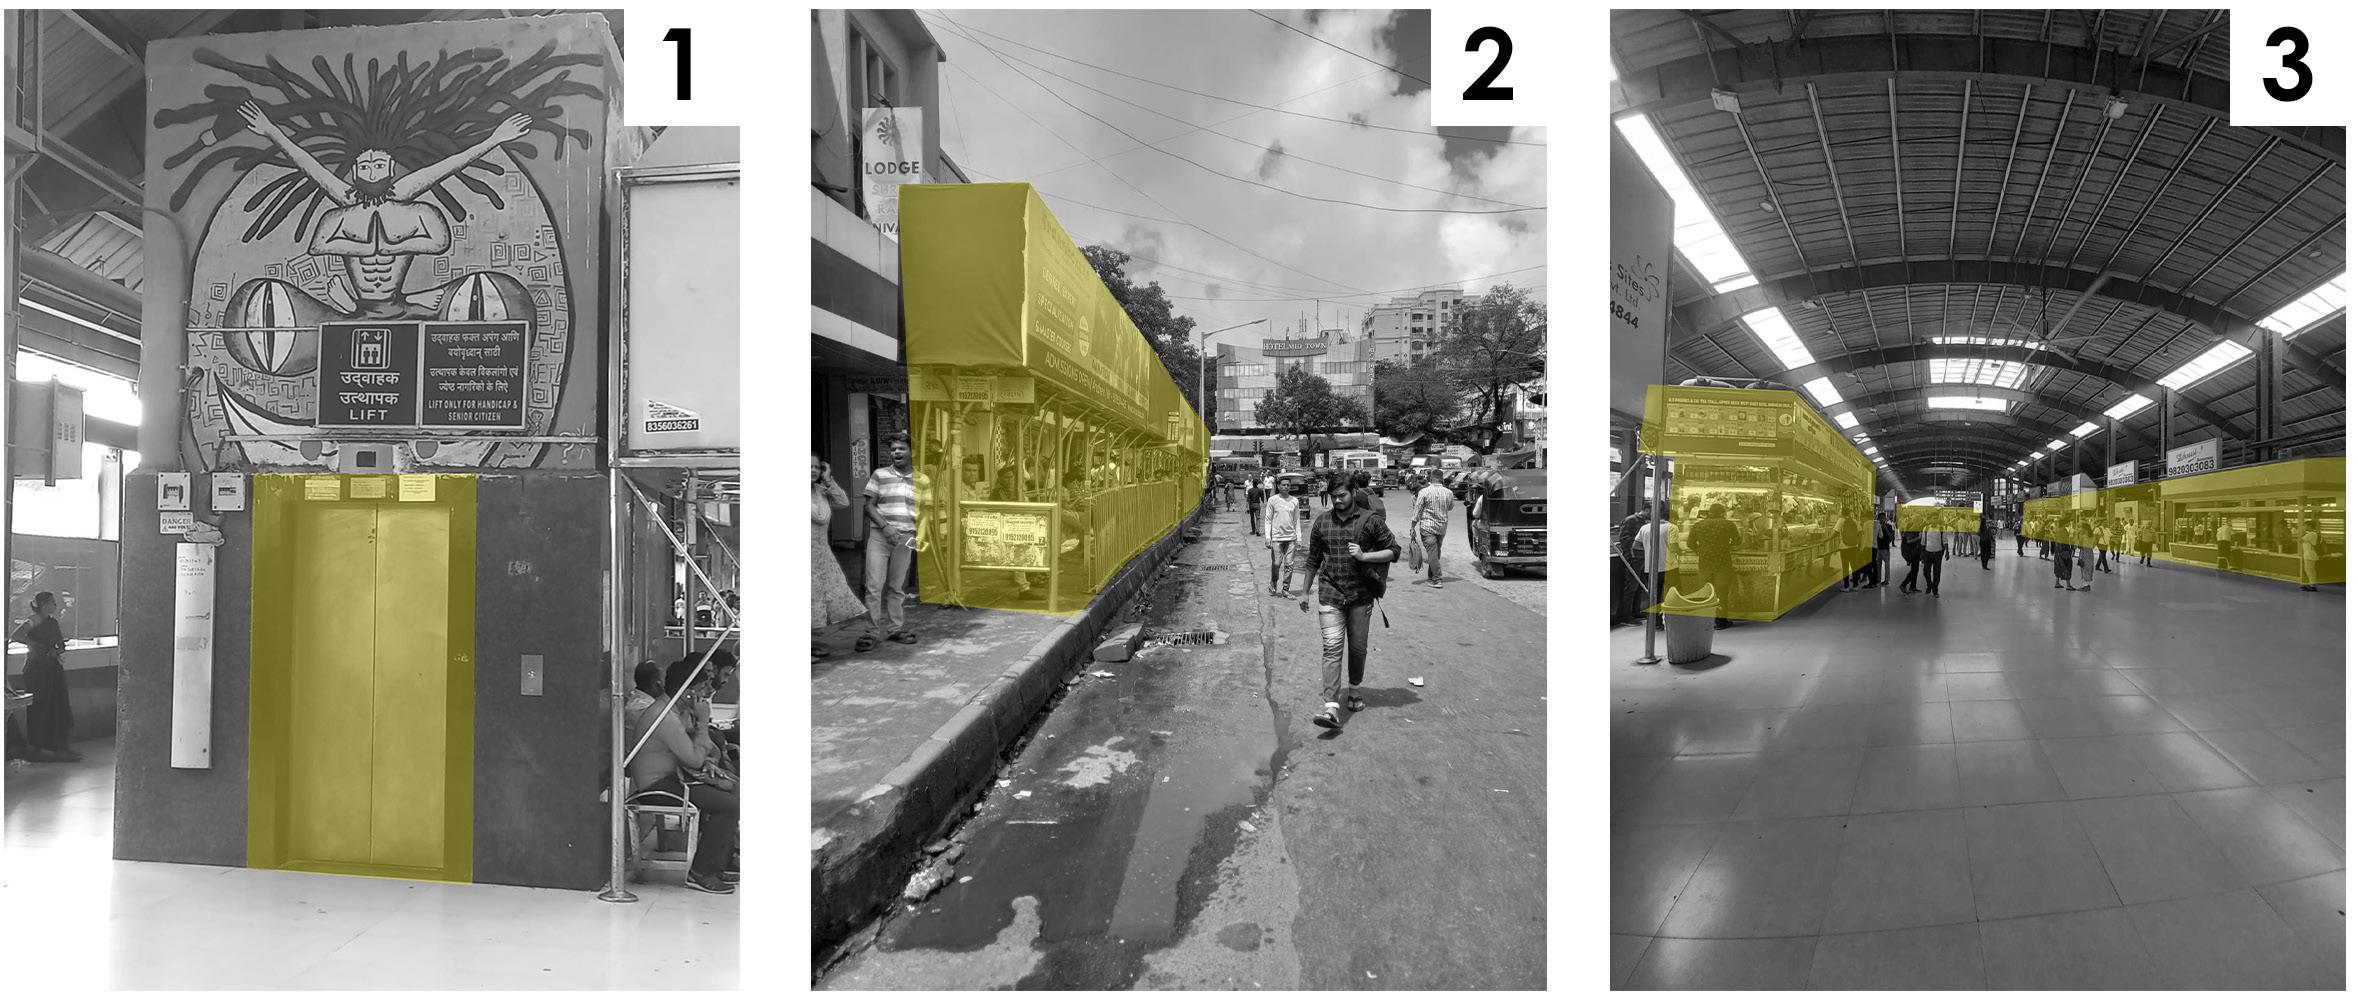

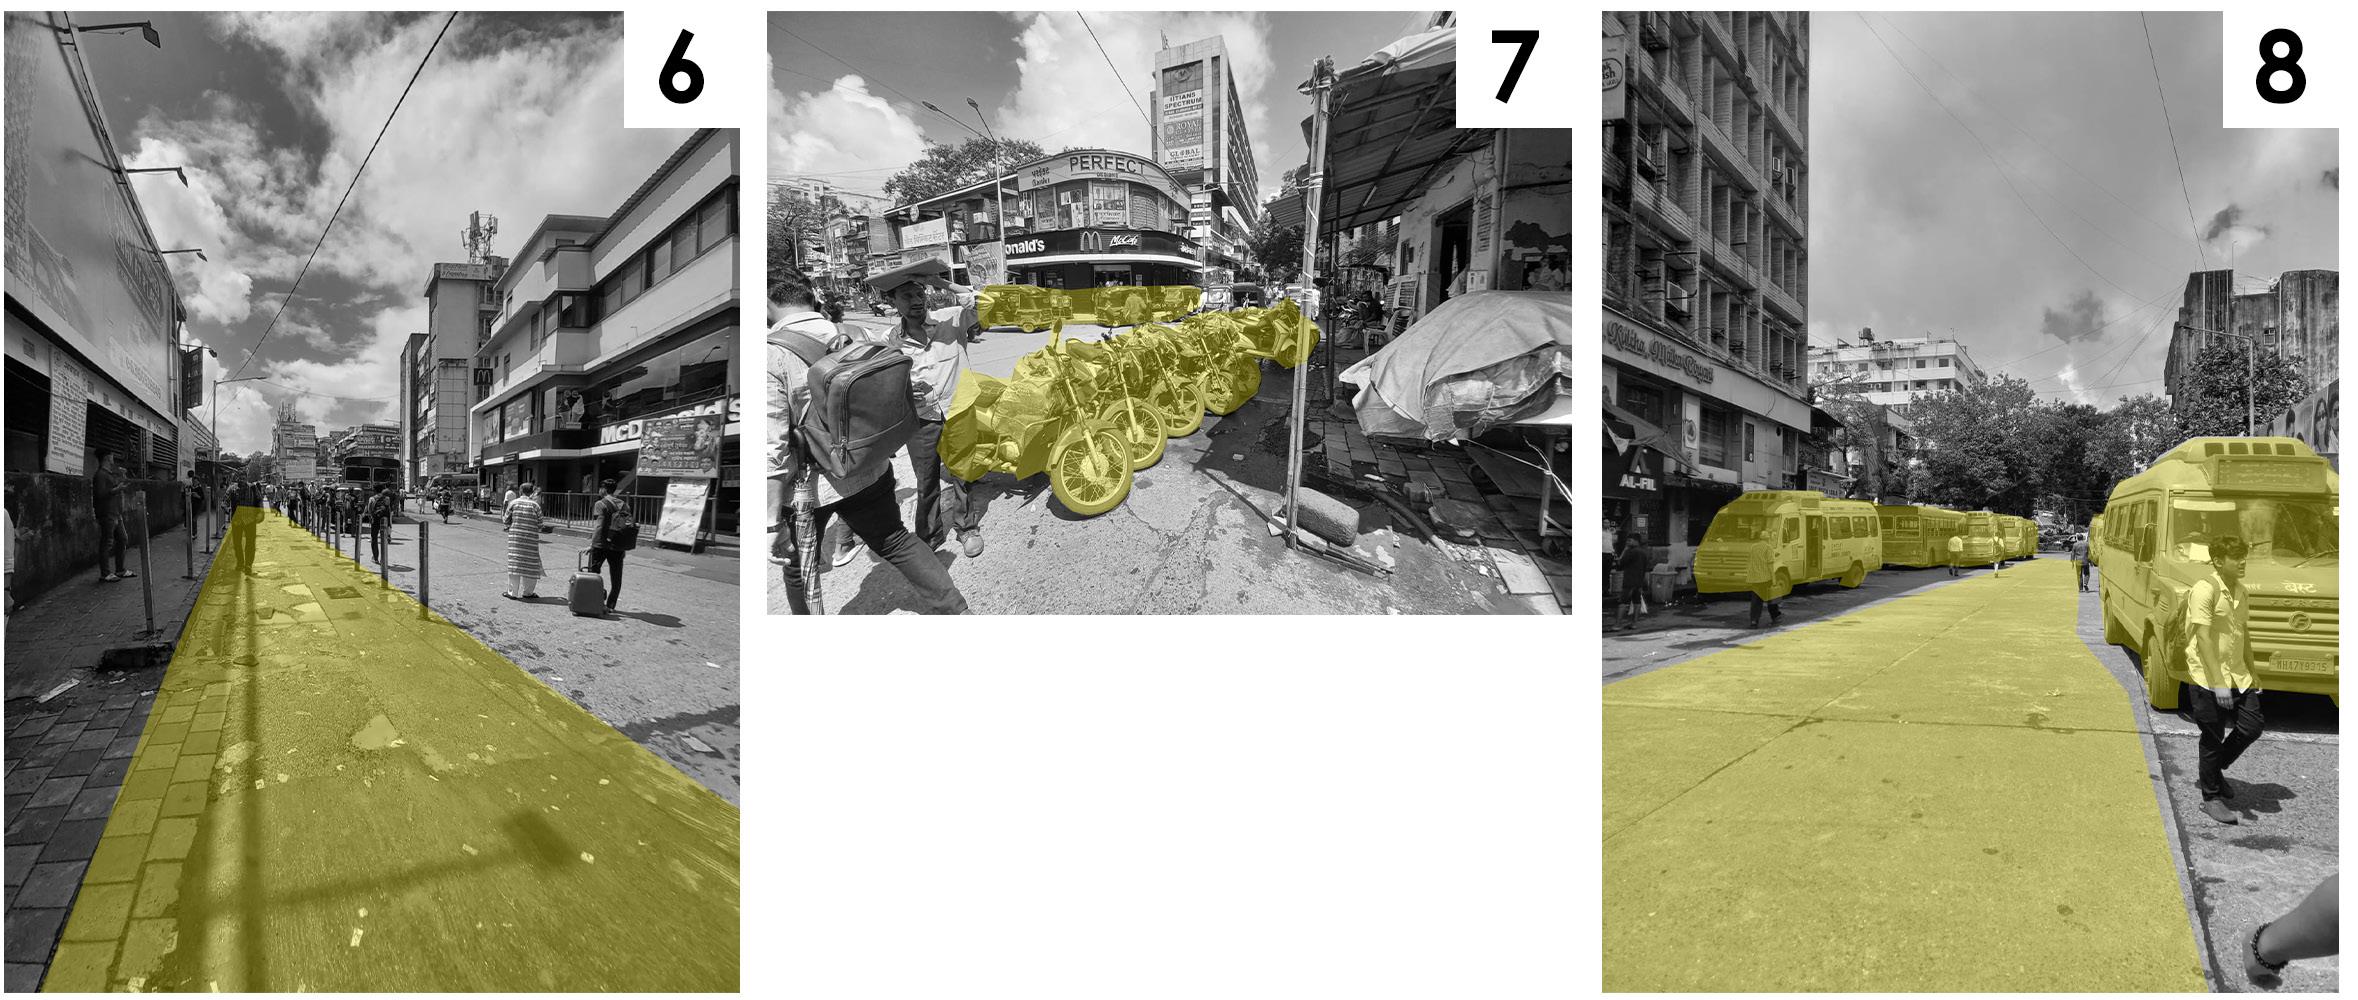
PERSONAL INFERENCE
1. Lift service provided for differently-abled.
2. Bus stops covering the footpaths making pedestrian to walk on roads.
3. Additional facilities provided on the footover bridge.
4. No proper planning for vehicular movement.
5. Central bridge connecting suburban rail with metro station.
6. Dedicated rickshaw lane outside station.
7. Private vehicles parking on roads causing congestion.
8. Dedicated lane for bus movement near bus stop.
I Hussain Lakdawala I Sem IX - X I Design Dissertation I Rizvi 64
Fig 7.3.2. Lift services for specially-abled(Author)
Fig 7.3.5. Large open road without proper managment of traffic (Author)
Fig 7.3.6. Wide bridges for easy commute of the passangers (Author)
Fig 7.3.7. Dedicated Rickshaw lane at the exit (Author)
Fig 7.3.8. Unauthrized parking near exits (Author)
Fig 7.3.9. Seperate route for B.E.S.T Buses (Author)
Fig 7.3.3. Congested Bus stops (Author)
Fig 7.3.4. Facilities at the bridge (Author)
7.4. Andheri Metro station

NAME: Avinash Mathur
GENDER: Male.
AGE: 16 years.
OCCUPATION: Student.
* Does the planning of precinct help in the last-mile connectivity?
-No
* Other factors affecting the lastmile connectivity?
- Footover bridge helps in easy acces
- A lot to walk from train to metro station
Average trip length: 25-30 kms
I Hussain Lakdawala I Sem IX - X I Design Dissertation I Rizvi 65
Andheri
2. Virar
3. Bandra
1. Dahisar
1. Dahisar
Affordability Comfort Accessibility Safety Likeability Metro Modes of transport used Train Rickshaw 1 1 1 1 1 2 2 2 2 2 3 3 3 3 3 4 4 4 4 4 5 5 5 5 5
Fig 7.4.1. Map of MMR showing places travelled by users from Andheri metro (Author)

NAME: Zainab
Lokhandwala
GENDER: Female.
AGE: 25 years.
PHYSICAL CONDITION: N.A.
OCCUPATION: Work / Employee.
* Does the planning of precinct help in the last-mile connectivity? -Yes.
* Other factors affecting the lastmile connectivity?
- Rickshaw fairs are expensive.
- Less bus services
- Less frequency
Average trip length: 40-45 kms

NAME: Jignesh.
GENDER: Male.
AGE: 34 years.
OCCUPATION: Work / Employee.
USER’S INFERENCE
* Does the planning of precinct help in the last-mile connectivity? -No.
* Other factors affecting the lastmile connectivity?
- Traffic congestion
- Timing issues
- Lot of waiting time
* Lot of waiting time.
* Traffic congestion due to excess rickshaws.
* Bus services are less efficient.
* Lot of walking between two stations.
* Connecting bridge between rail and metro train helps in better connectivity.
I Hussain Lakdawala I Sem IX - X I Design Dissertation I Rizvi 66
Affordability Affordability Comfort Comfort Accessibility Accessibility
Average
Safety Safety Likeability Likeability Walking Metro
transport used Metro Train Walking Train
trip length: 15 kms
Modes of transport used Modes of
1 1 1 1 1 1 1 1 1 1 2 2 2 2 2 2 2 2 2 2 3 3 3 3 3 3 3 3 3 3 4 4 4 4 4 4 4 4 4 4 5 5 5 5 5 5 5 5 5 5
3. Bandra
2. Virar
PERSONAL INFERENCE
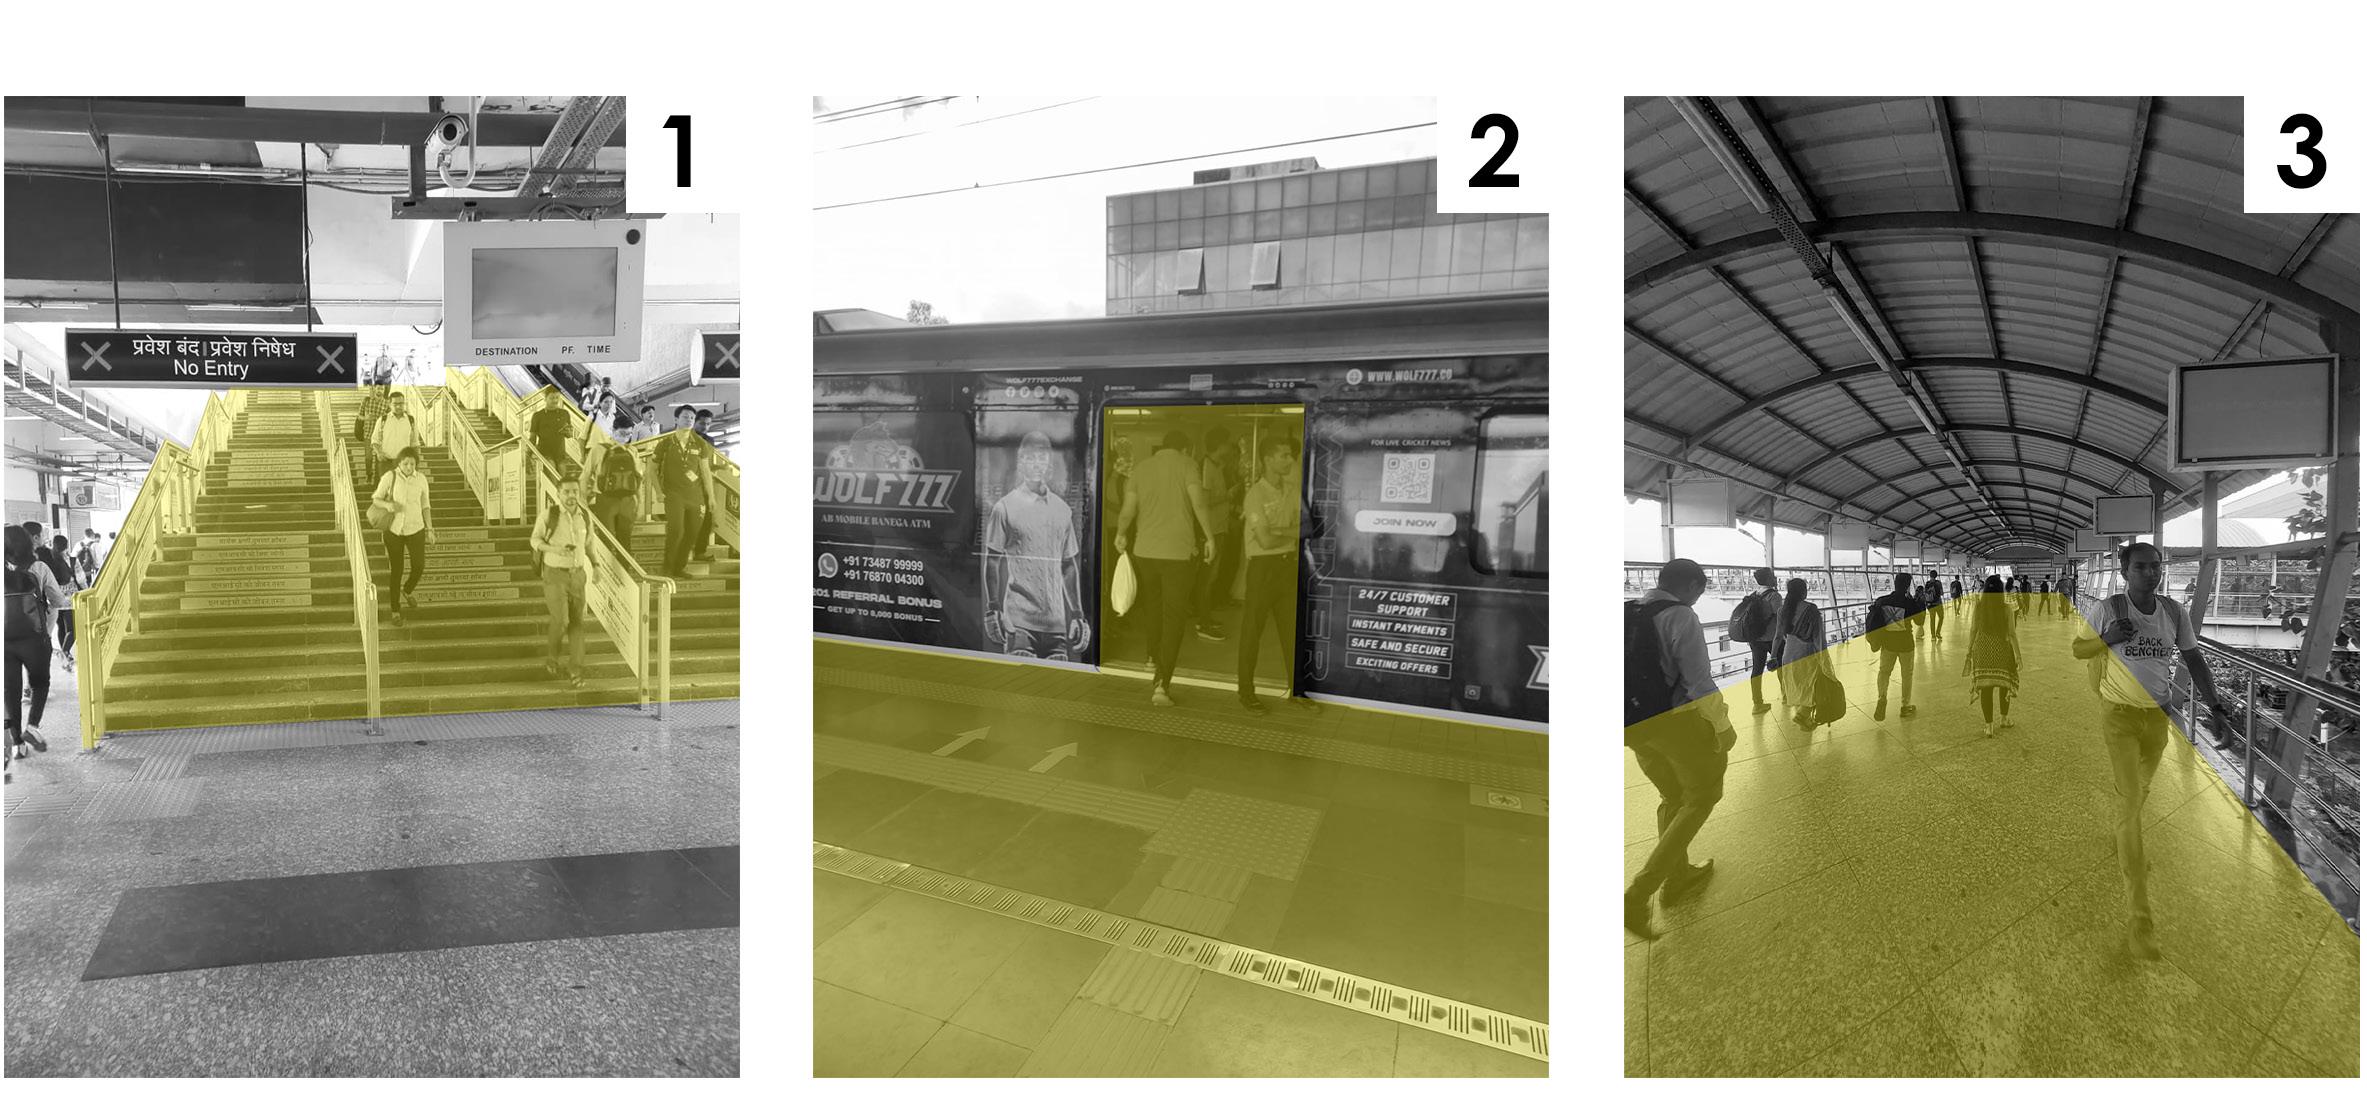
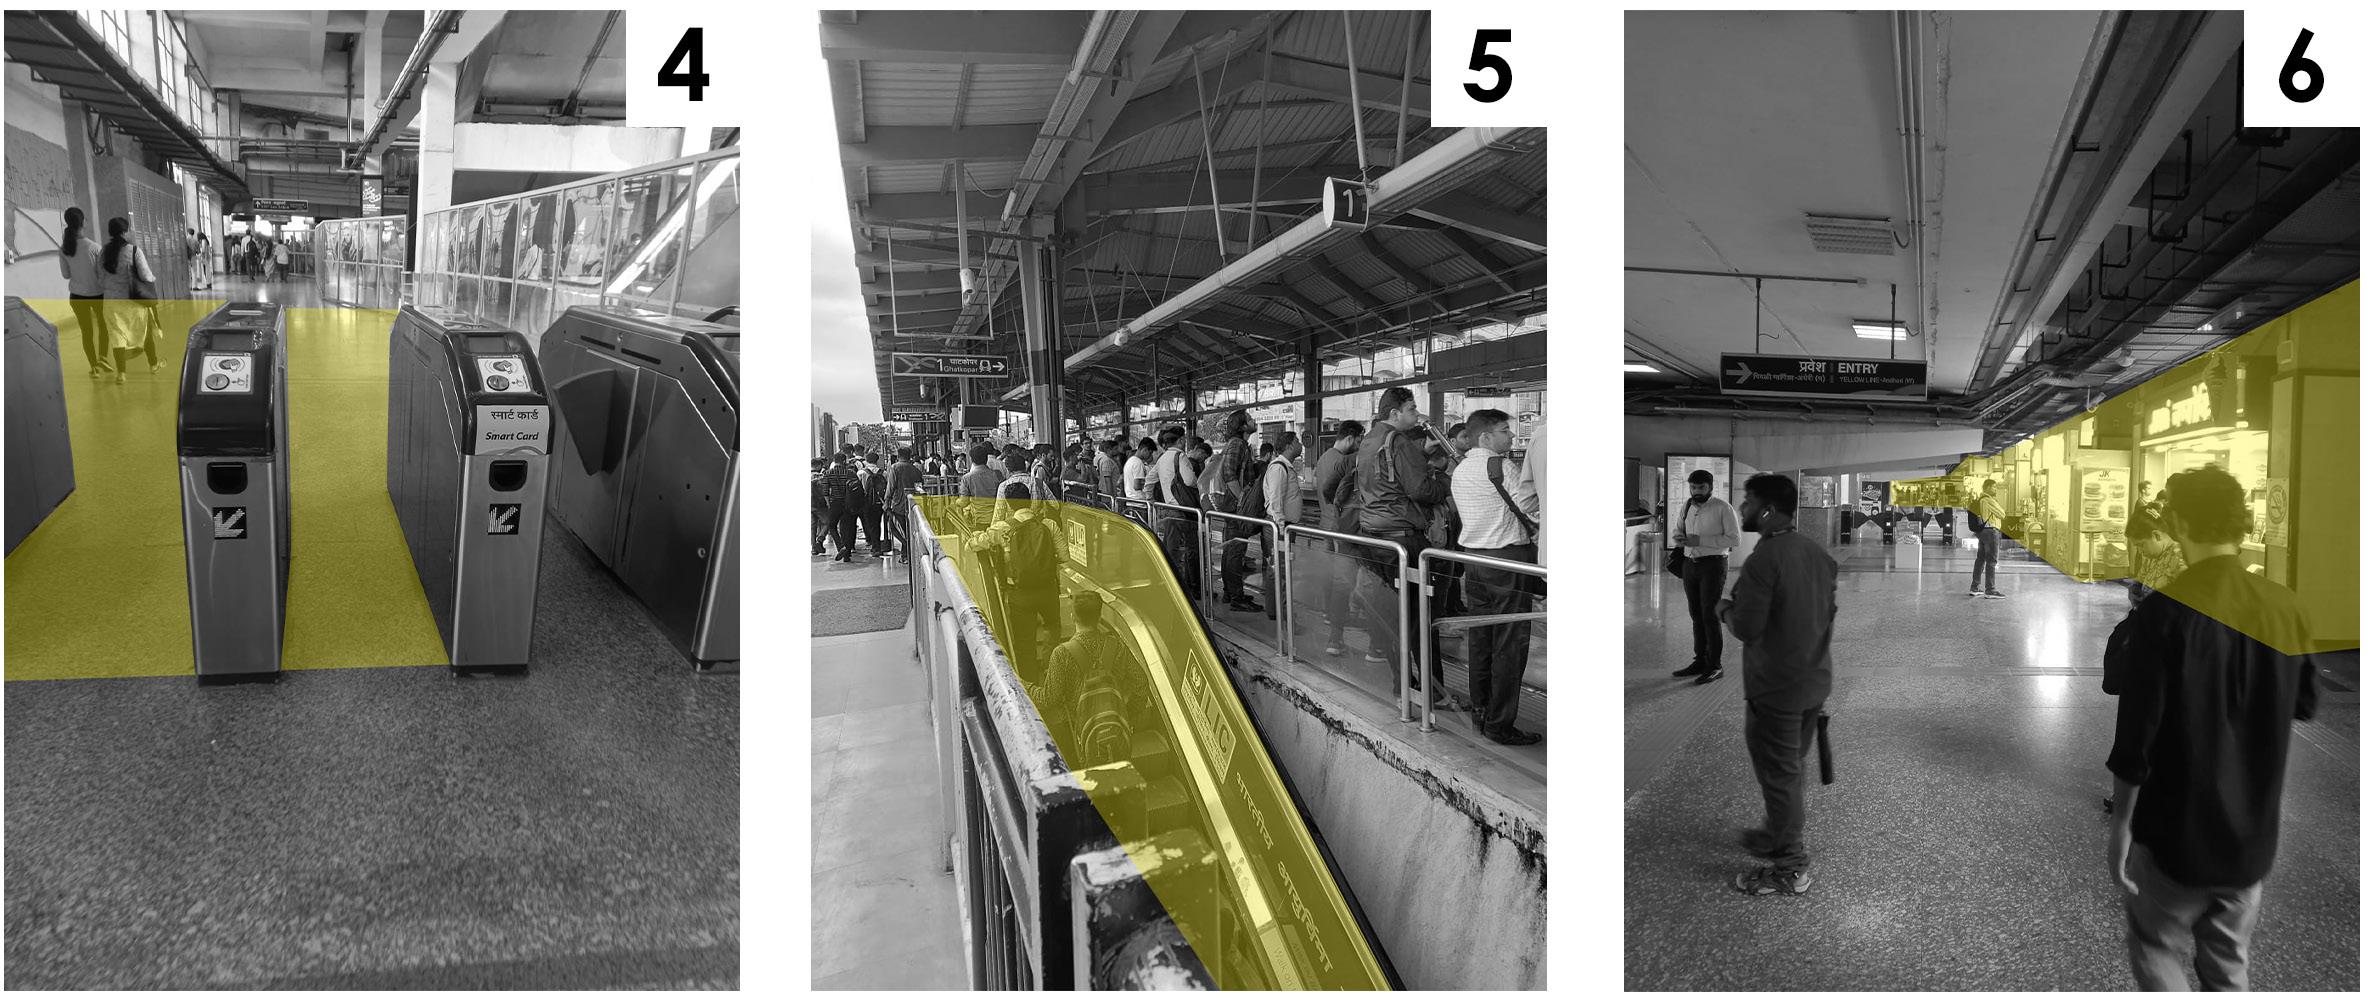
1. Only one lift provided at the end of the station.
2. Train and platform levels are the same level for easy boarding.
3. Conecting bridge between train and metro station helps in easy access to different modes.
4. The checkpoints are not wide enough for wheel-chair.
5. Escalators only provided to go upwards.
6. Additional facilities provided at the station.
I Hussain Lakdawala I Sem IX - X I Design Dissertation I Rizvi 67
Fig 7.4.2. Only straircase access in some areas (Author)
Fig 7.4.5. Narrow spaces between checkpoints (Author)
Fig 7.4.3. Levels of platform and train are same for easy access (Author)
Fig 7.4.6. Elevators and lifts provided in central areas of the stations (Author)
Fig 7.4.4. Connecting bridge between Railway and Metro line (Author)
Fig 7.4.7. Facilities provided on the station (Author)

NAME: Jitesh
GENDER: Male.
AGE: 23 years.
OCCUPATION: Work / Employee.
* Does the planning of precinct help in the last-mile connectivity? -No
* Other factors affecting the lastmile connectivity?
- Lot of travel time.
- Inefficient ptm services.
- Timing issues
Average trip length: 40-50 kms
I Hussain Lakdawala I Sem IX - X I Design Dissertation I Rizvi 68 7.5. Thane
station
Bus
Thane
3. Mulund
1. Panvel
1. Panvel
2. Mumbra
Affordability Comfort Accessibility Safety Likeability Bus Modes of transport used Train Walking 1 1 1 1 1 2 2 2 2 2 3 3 3 3 3 4 4 4 4 4 5 5 5 5 5
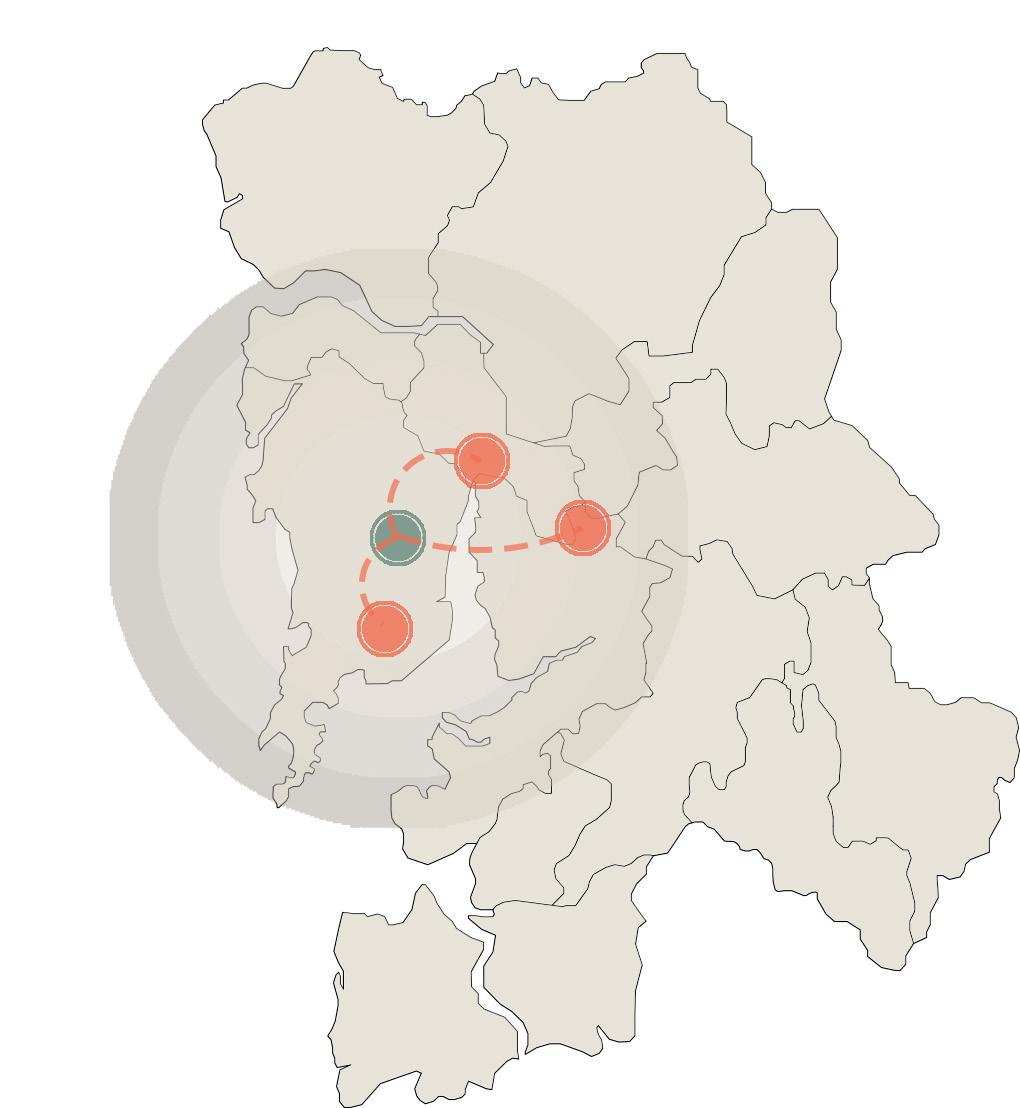
Fig 7.5.1. Map of MMR showing places travelled by users from Thane (Author)

NAME: Vaneeta Pawar
GENDER: Female.
AGE: 36 years.
PHYSICAL CONDITION: Asthama.
OCCUPATION: Work / Employee.
* Does the planning of precinct help in the last-mile connectivity? -No.
* Other factors affecting the lastmile connectivity?
- Rickshaws are expensive.
- Long waiting hours for bus.
- Buses are over crowded.
Average trip length: 30 kms

NAME: Nomaan Ansari.
GENDER: Male.
AGE: 32 years.
OCCUPATION: Work / Employee.
* Does the planning of precinct help in the last-mile connectivity? -Yes.
* Other factors affecting the lastmile connectivity?
- Integration of bus and train station.
- Bus fairs are economic.
Average trip length: 15-20 kms
USER’S INFERENCE
* Traffic congestion due to excess rickshaws.
* No consideration for physically disabled people.
* The station precinct help in last-mile connectivity.
* Bus service are available above the station precinct.
* Dedicated lane for bus makes it easier to circulate traffic.
I Hussain Lakdawala I Sem IX - X I Design Dissertation I Rizvi 69
Affordability Affordability Comfort Comfort Accessibility Accessibility Safety Safety Likeability Likeability Walking Modes of transport used Modes of transport used Train
1 1 1 1 1 1 1 1 1 1 2 2 2 2 2 2 2 2 2 2 3 3 3 3 3 3 3 3 3 3 4 4 4 4 4 4 4 4 4 4 5 5 5 5 5 5 5 5 5 5
3. Mulund
Bus Bus
2. Mumbra
Walking Train

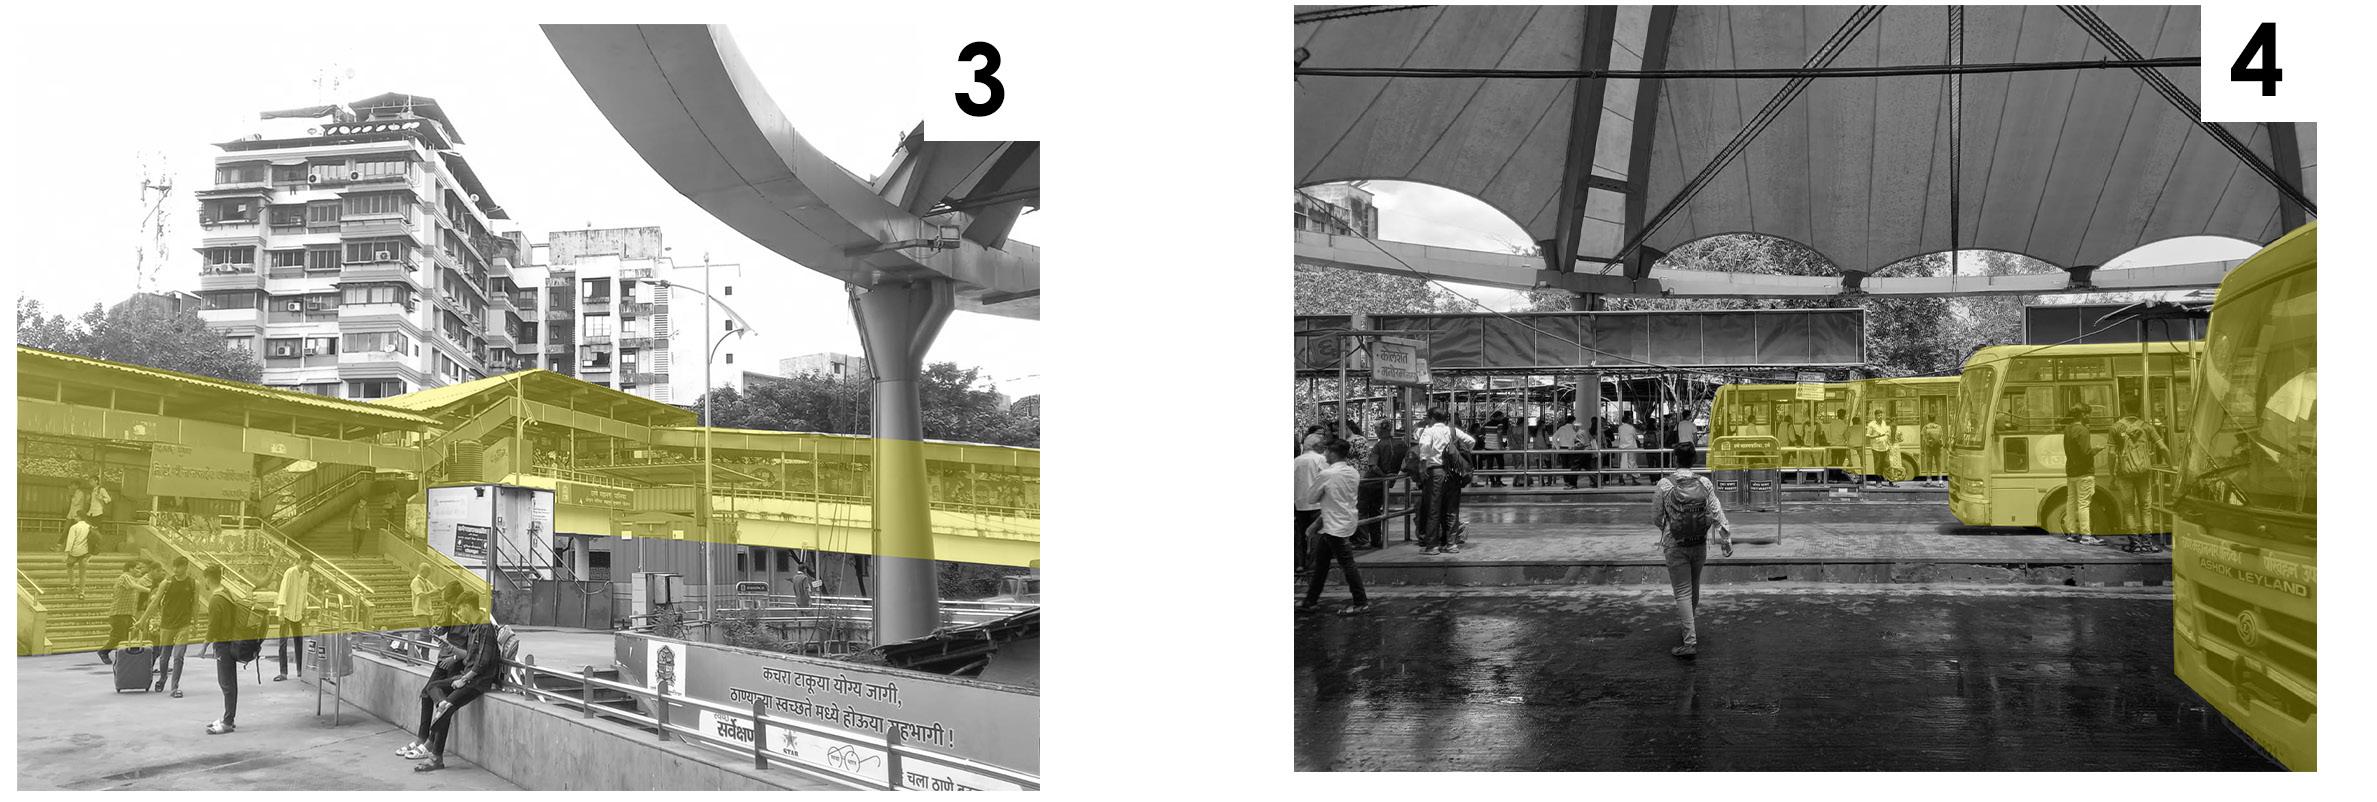
PERSONAL INFERENCE
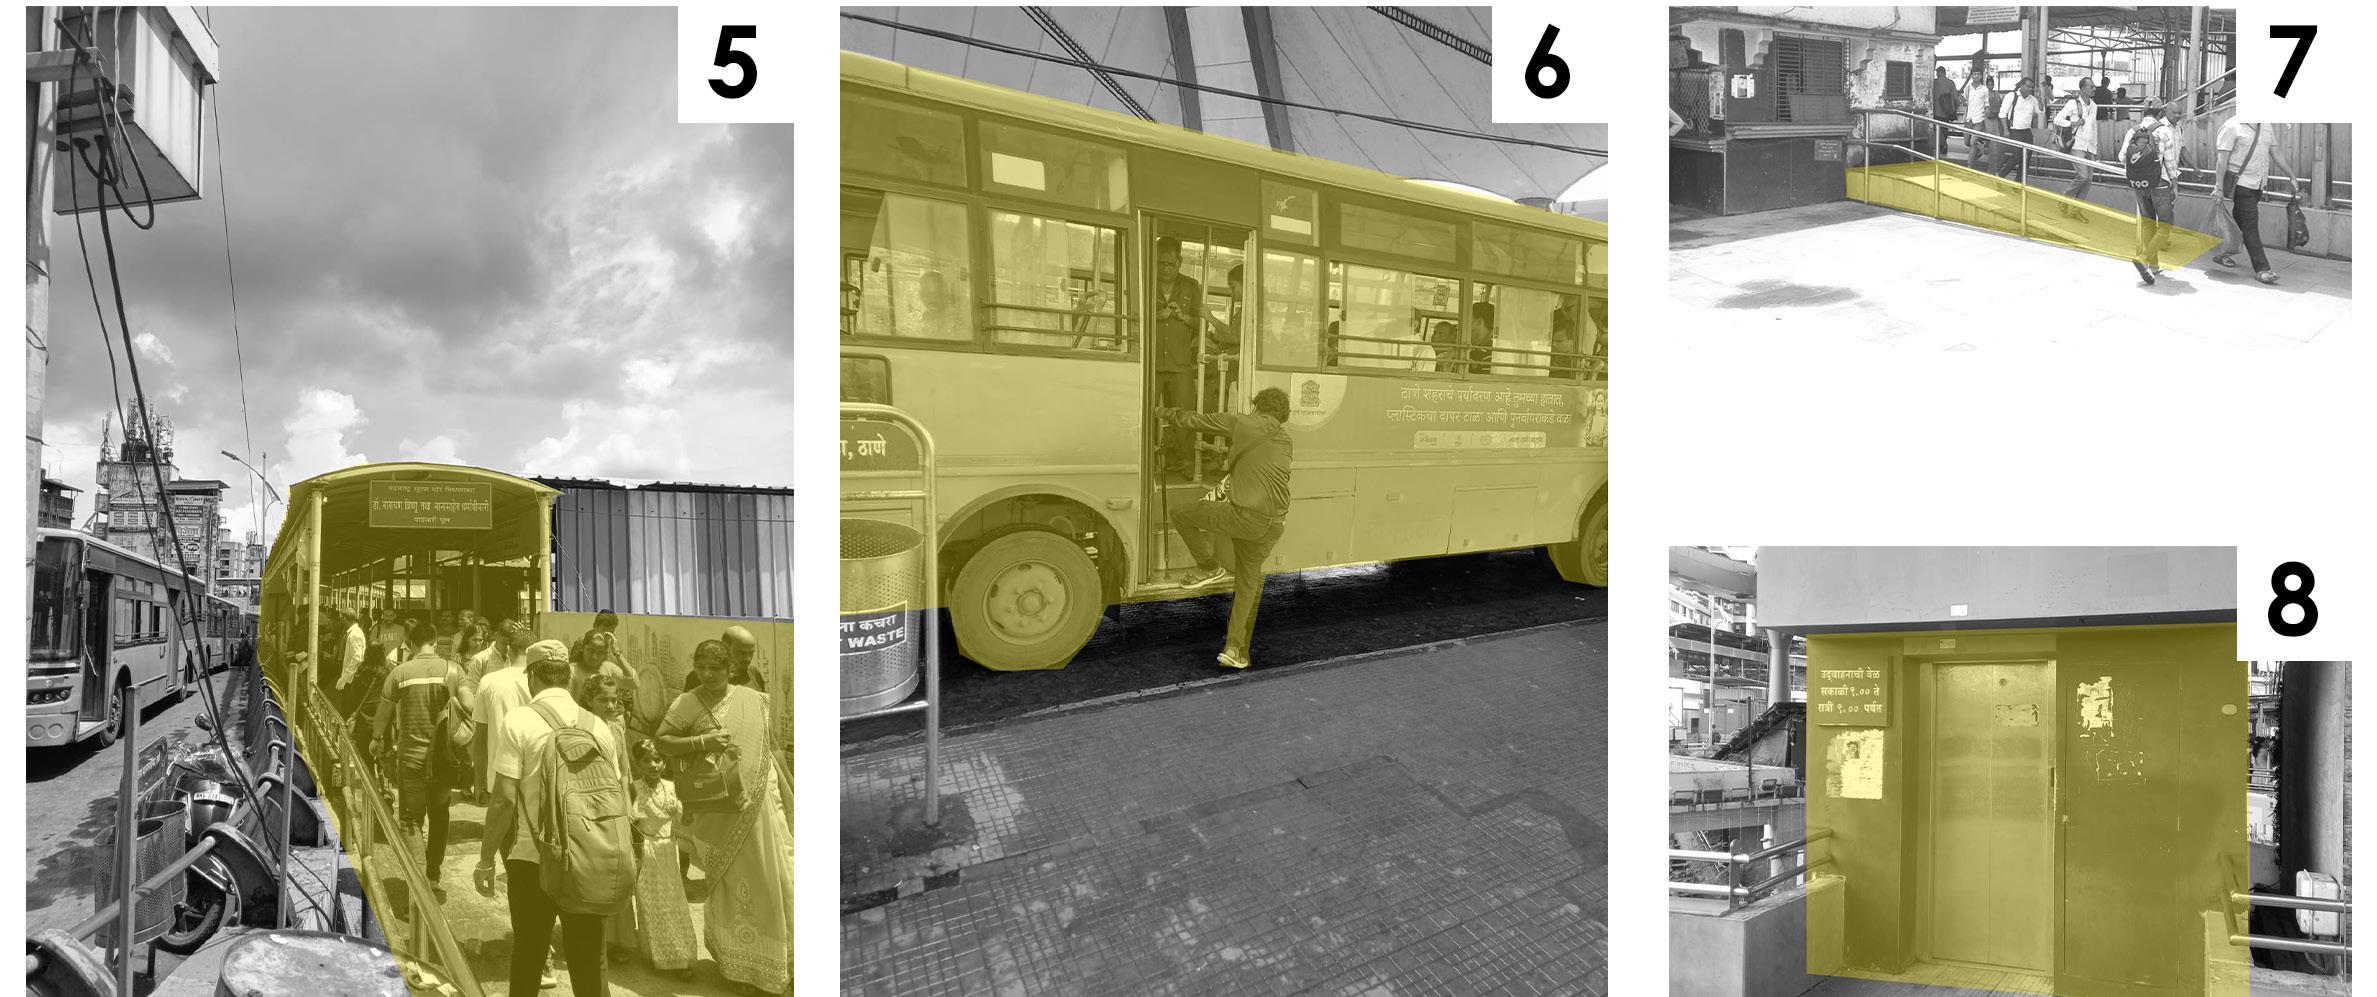
1. Dedicated area for rickshaw stands and taxi stands.
2. Elevated lanes for bus to reduce congestion.
3. Elevated skywalk connecting bus stand and railway station.
4. Different lanes for city and local buses.
5. Skywalk that connects the bus stand to multiple business zones.
6. Bus stops are not universally designed.
7. Provision of ramps only in specific areas.
8. Lift provided on railway station to connect it to bus stand above.
I Hussain Lakdawala I Sem IX - X I Design Dissertation I Rizvi 70
Fig 7.5.2. Dedicated lanes for PTA transport (Author)
Fig 7.5.4. Skywalks connecting different regions (Author)
Fig 7.5.6. Skywalks connecting different regions (Author)
Fig 7.5.8. Provisions of ramps for physically-abled (Author)
Fig 7.5.7. Boarding areas not universally designed (Author)
Fig 7.5.9. Provision of lifts and elevators to access the depot (Author)
Fig 7.5.3. Elevated road dedicated for the buses (Author)
Fig 7.5.5. Dedicated slots for the regional and city buses (Author)
7.6. Ghatkopar Train and Metro station

NAME: Himanshu Patel
GENDER: Male.
AGE: 27 years.
OCCUPATION: Work / Employee. Ghatkopar
* Does the planning of precinct help in the last-mile connectivity?
-No
* Other factors affecting the lastmile connectivity?
- No proper dropp-off points.
- No parking space.
- Traffic
Average trip length: 15-20 kms
I Hussain Lakdawala I Sem IX - X I Design Dissertation I Rizvi 71
2. Mumbra
1. Kurla
1. Kurla
3. Mulund
Affordability Comfort Accessibility Safety Likeability Metro Modes of transport used Train 1 1 1 1 1 2 2 2 2 2 3 3 3 3 3 4 4 4 4 4 5 5 5 5 5
Fig 7.6.1. Map of MMR showing places travelled by users from Ghatkopar Railway and Metro (Author)

NAME: Ishaan Sheikh
GENDER: Male.
AGE: 21 years.
PHYSICAL CONDITION: N/A
OCCUPATION: Student.
* Does the planning of precinct help in the last-mile connectivity? -Yes.
* Other factors affecting the lastmile connectivity?
- Integration of metro and rail station helps in easy access.

NAME: Riddhi Desai.
GENDER: Female.
AGE: 36 years.
OCCUPATION: Teacher.
Metro Train Bus Bus
Modes of transport used Modes of transport used Metro
Average trip length: 30-40 kms
USER’S INFERENCE
* Traffic congestion due to excess rickshaws.
* Lot of rickshaw stands.
* Narrow roads outside station.
* No ramps or lifts on the bridges.
* Does the planning of precinct help in the last-mile connectivity? -No.
* Other factors affecting the lastmile connectivity? None
Average trip length: 20 kms
* Easy access to metro station.
* Bus service are available outside the station precinct.
* Rickshaws for different locations outside the station.
I Hussain Lakdawala I Sem IX - X I Design Dissertation I Rizvi 72
Affordability Affordability Comfort Comfort Accessibility Accessibility Safety Safety Likeability Likeability Rickshaw
1 1 1 1 1 1 1 1 1 1 2 2 2 2 2 2 2 2 2 2 3 3 3 3 3 3 3 3 3 3 4 4 4 4 4 4 4 4 4 4 5 5 5 5 5 5 5 5 5 5
3. Mulund
2. Mumbra
PERSONAL INFERENCE
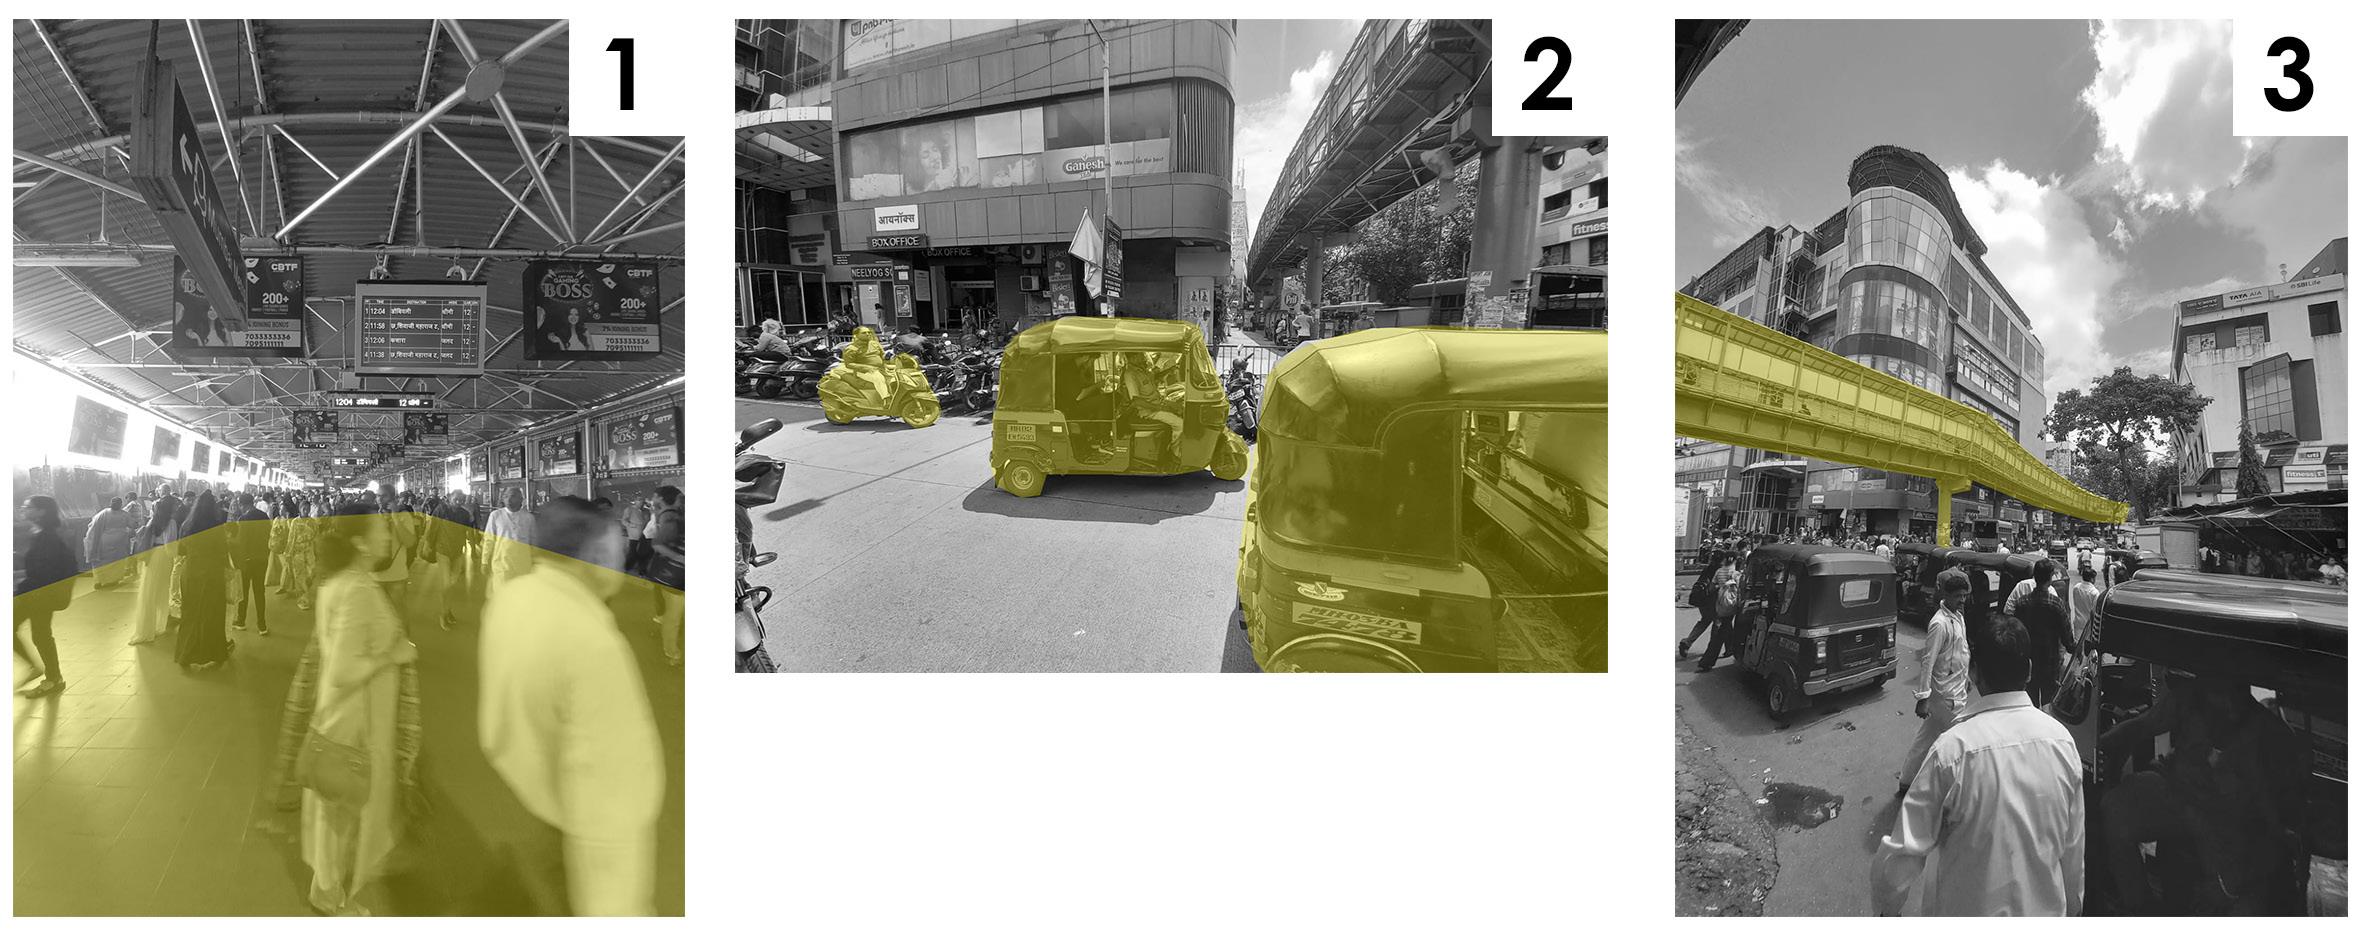
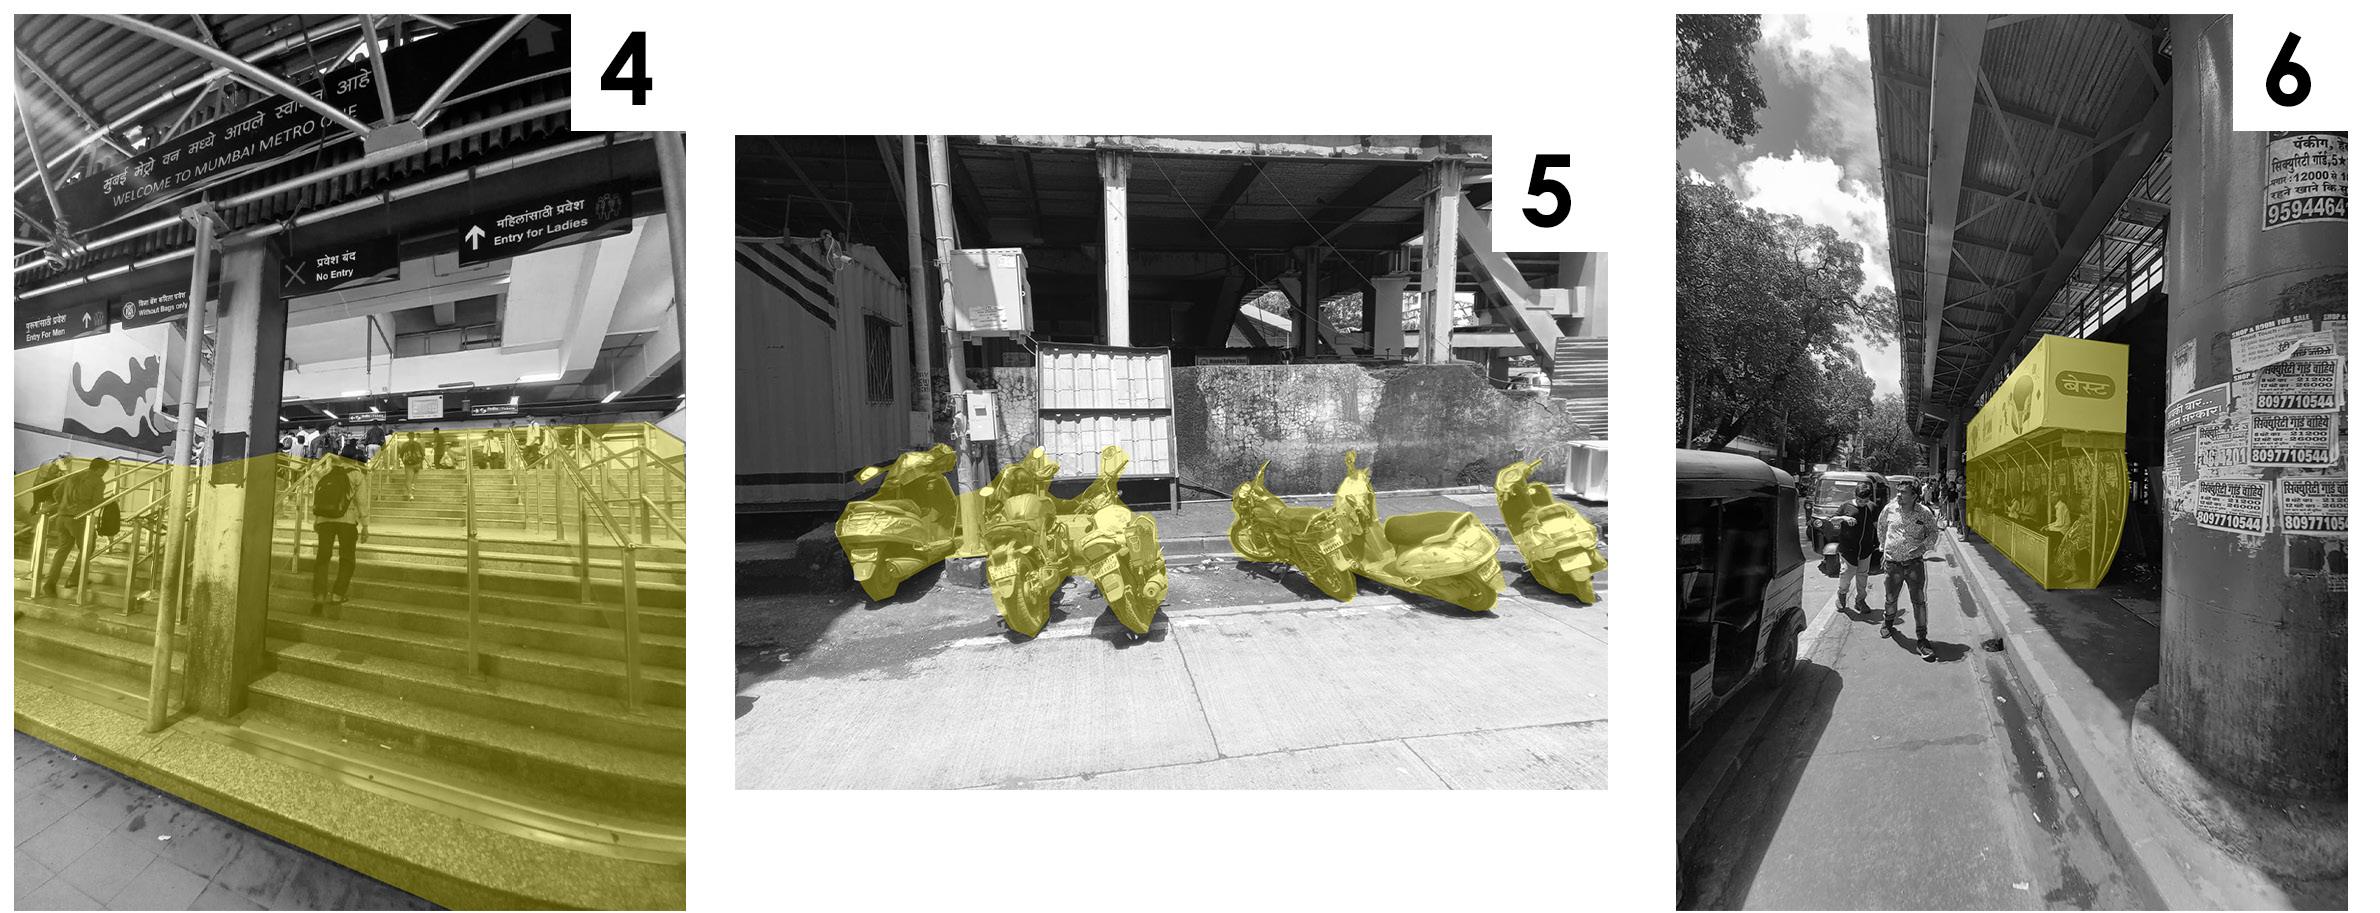
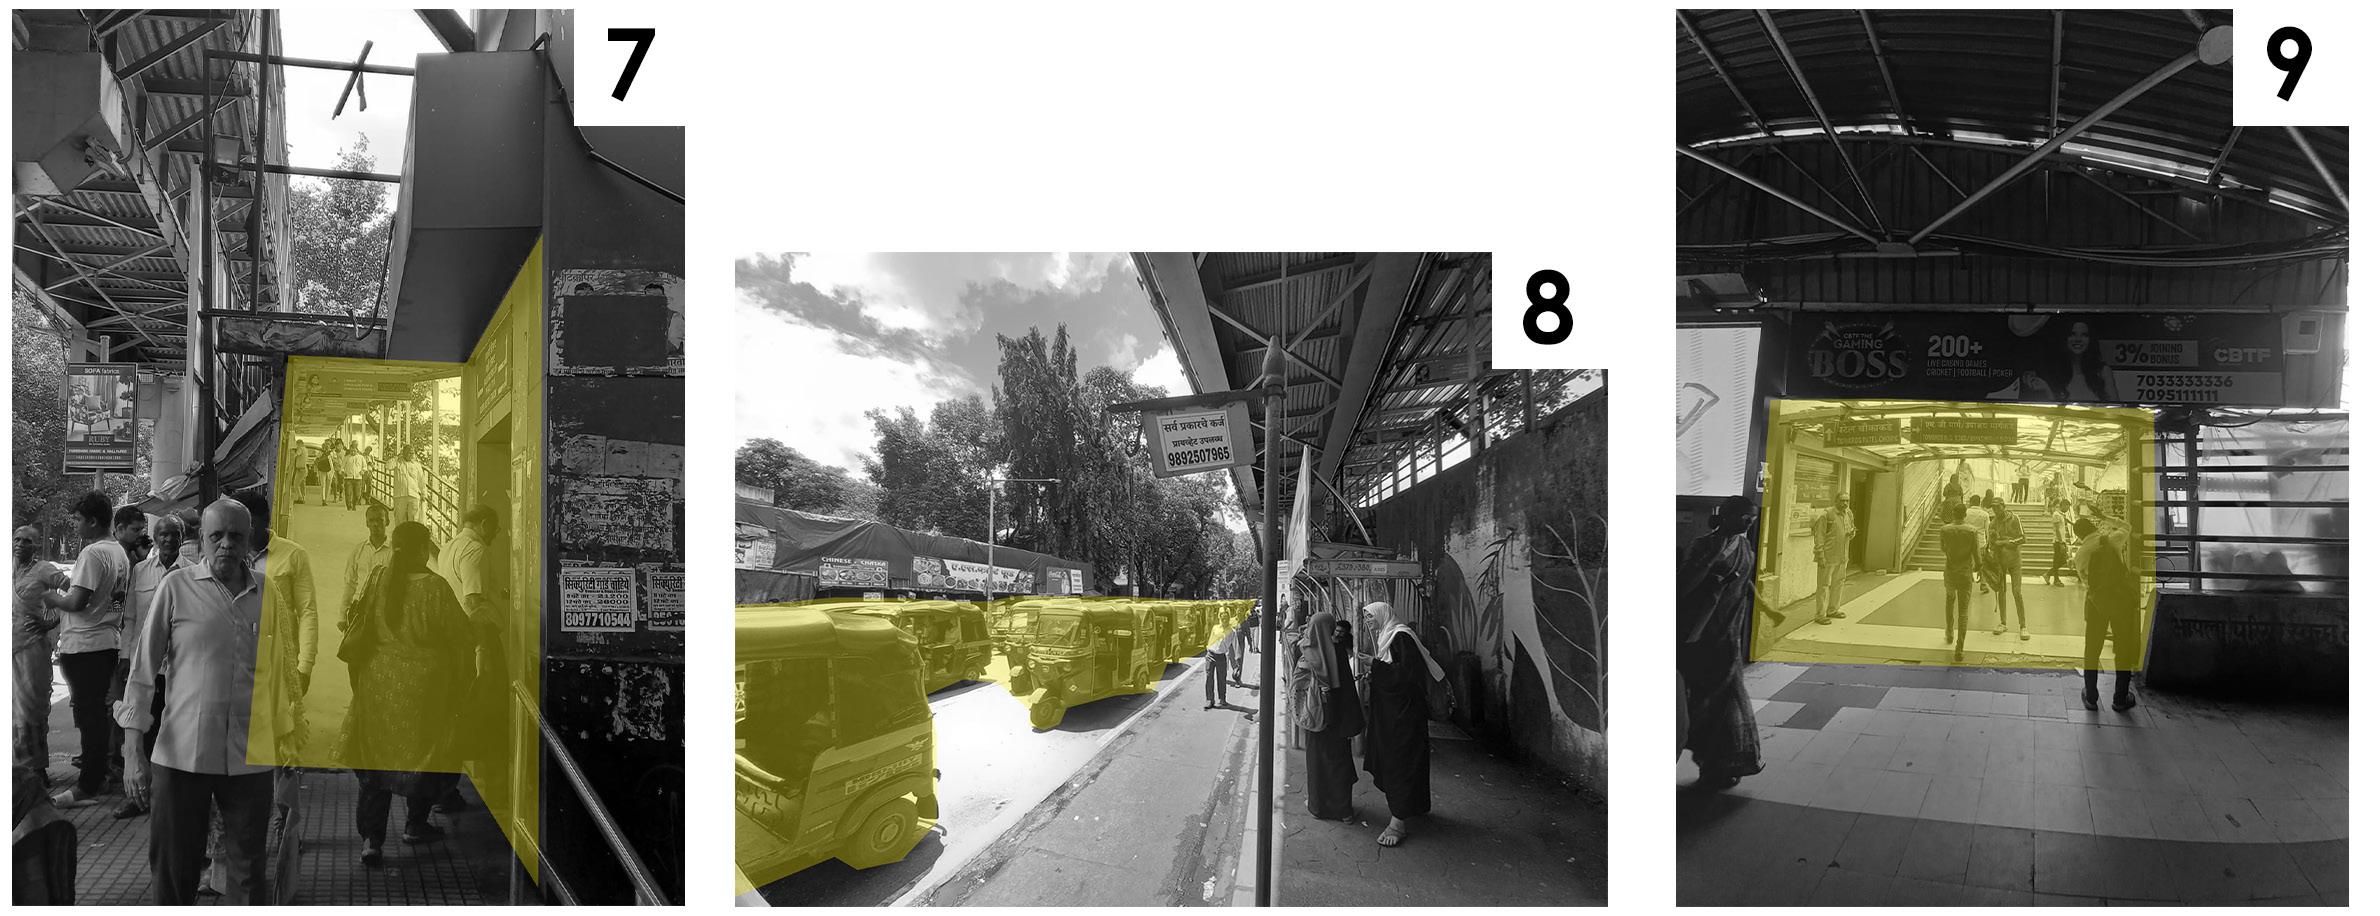
1. Overhead bridge connecting the train and metro station.
2. No proper drop-off points.
3. Elevated skywalk connecting various regions.
4. Only staircase access between two bridges.
5. No dedicated parking zones for private vehicles.
6. Bus stops are overhshadowed by rickshaws.
7. Elevators and ramps provided for differently abled.
8. Traffic congestion due to rickshaws.
9. Skywalks to encourage pedestrian movement.
I Hussain Lakdawala I Sem IX - X I Design Dissertation I Rizvi 73
Fig 7.6.2. Wide bridges connecting Metro and Railway (Author)
Fig 7.6.5. Staircase access (Author)
Fig 7.6.8. Ramps and lifts access (Author)
Fig 7.6.9. Excess of Rickshaws (Author) Fig 7.6.10. Station bridge extending to other parts of the region (Author)
Fig 7.6.6. Unauthorized parking (Author)
Fig 7.6.7. Bus stops at exits (Author)
Fig 7.6.3. No proper drop-off points near entry (Author)
Fig 7.6.4. Skywalks (Author)
8. Conceptual Framework
I Hussain Lakdawala I Sem IX - X I Design Dissertation I Rizvi 74
Home
Public Transport Last-Mile Connectivity
Monorail
ECONOMIC EFFECTS
Effects of LMC
SOCIAL
EFFECTS
SOLUTIONS
Sustainable trasnport system
Increased connectivity
Pedestrian-oriented Development
PARAMETERS
Affordability Comfort
Accessibility
Likeability
ENVIRONMENTAL EFFECTS
ISSUES
Poor infrastructure
I Hussain Lakdawala I Sem IX - X I Design Dissertation I Rizvi 75
Car Taxi Bicycle Bus Metro
Train
Rickshaw
Bike
Walking Workspaces
Safety Frequency
efficient
congestion
Expensive Less
Traffic
Poor networks
9.1- Secondary Case studies
9. Design Program
9.2- Design Program
9.3- Operational Framework
I Hussain Lakdawala I Sem IX - X I Design Dissertation I Rizvi 76
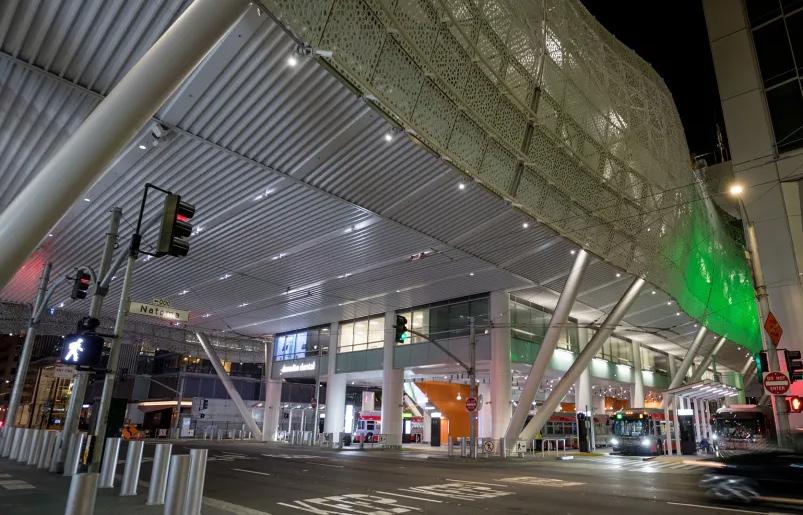
Case 01: The Trans Bay Terminal project, San Francisco

Fig 9.1.1: Aerial view of the transit hub (https://www.smwllc.com/projects/transbay-transit-center/)
* Name: The Trans Bay Terminal project.
* Location: San Fransico, U.S.A.
* Architect: Pelli Clarke Pelli.
* Project type: T.O.D.
* Completion: 2013-2017.
* Cost: 4.2 Billion dollars.
* Area: 1.5 million Sq.ft.
* Funding: Local, Rregional, State, Federal.
Fig 9.1.2: View of the Lower ground floor ( https://mtc.ca.gov/operations/programs-projects/transit-hubs/salesforce-transbay-transit-center)
* The project comprises of part transportation hub, part public park and urban space, and part offices and retail establishments.
* It will cater to 11 different types of local and national transportation facilities
I Hussain Lakdawala I Sem IX - X I Design Dissertation I Rizvi 77
9.1- Secondary Case studies
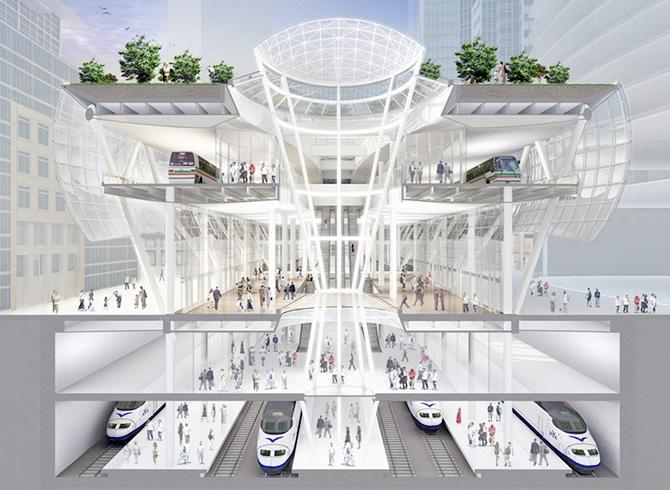
Fig 9.1.3: Section through the structure ( https://www.wired.com/2010/01/san-francisco-transbay-transit-center/)
* It is a Five level structure with each level having different functions
* Second basement level: High speed trains and Light rail system.
* First level basement: Commercial and Retail components.
* Ground level: Commercial and Retail components.
* Upper Level 1: Bus transit systems and depot.
* Upper Level 2: Sky garden and Public park.
* A 1070 foot tall tower designed by the same Architects which will reserve 60 storeys for Commercial and Business sectors which will add up to overall Revenue of the Transit hub.
* The Transbay Transit Center will span five city blocks, housing a variety of programs that will attract many different types of users to the downtown site.
* A green spaces with diverse and native bay area plants, a 1000-person amphitheater, a cafe, playground, and an art and educational cultural center as well as a variety of cycling and pedestrian paths are some of the design program incorporated in the design.
I Hussain Lakdawala I Sem IX - X I Design Dissertation I Rizvi 78
Case 02: Anaheim Regional Transportation Intermodal Center
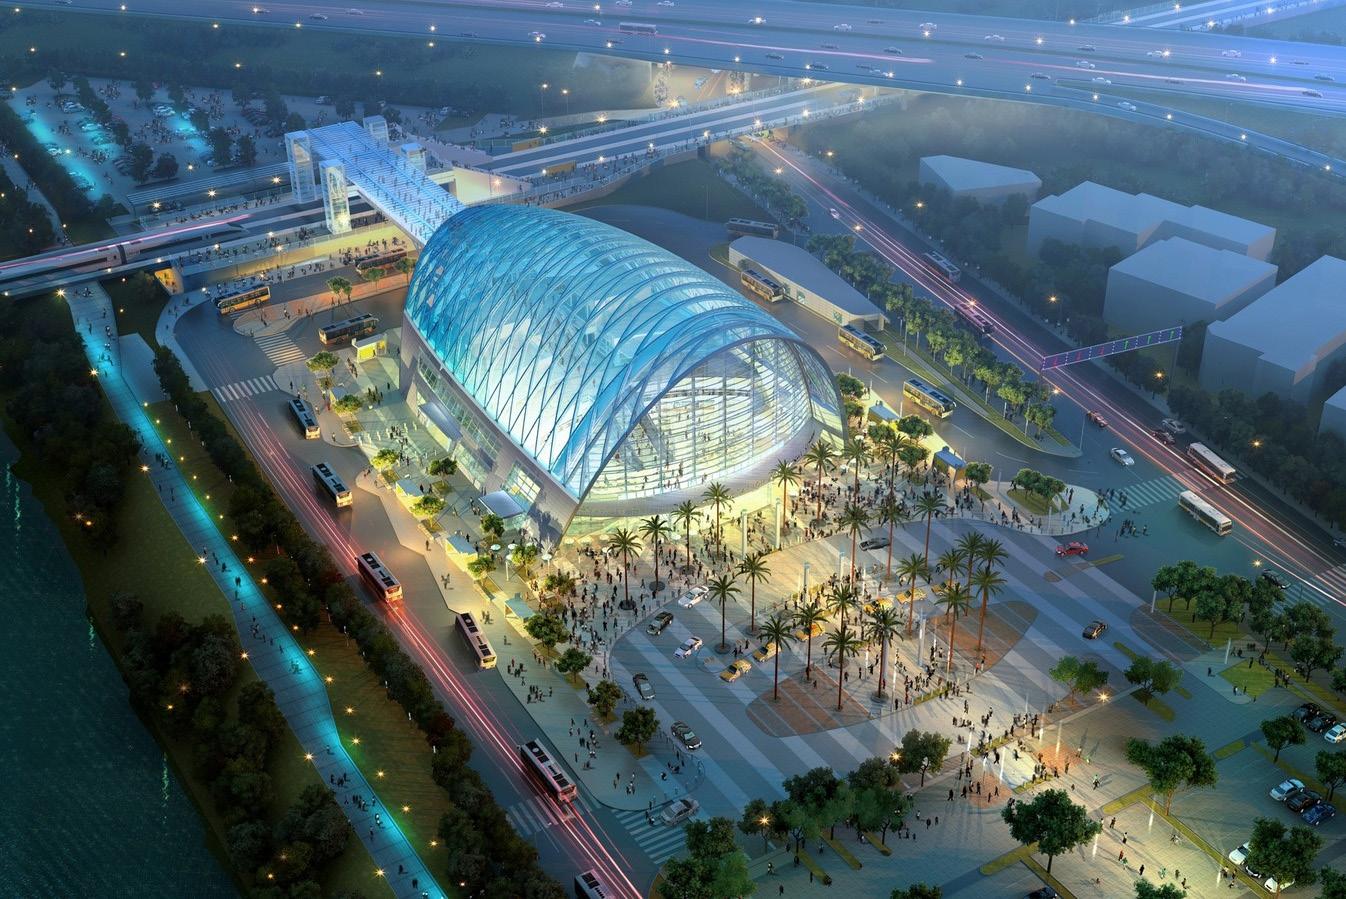
Fig 9.1.4: Aerial view of the transportation Intermodal Center (https://www.re-thinkingthefuture.com/wp-content/uploads/2021/01/A2977-Multi-modal-transit-hubsImage-38_ARTIC-Aerial-View_%C2%A9HOK.jpg)
* Name: Anaheim Regional Transportation Intermodal Center
* Location: Orange County, U.S.A.
* Architect: HOK.
* Project type: T.O.D.
* Completion: 2014.
* Cost: 4.2 Billion dollars.
* Area: 67,000 Sq.ft.
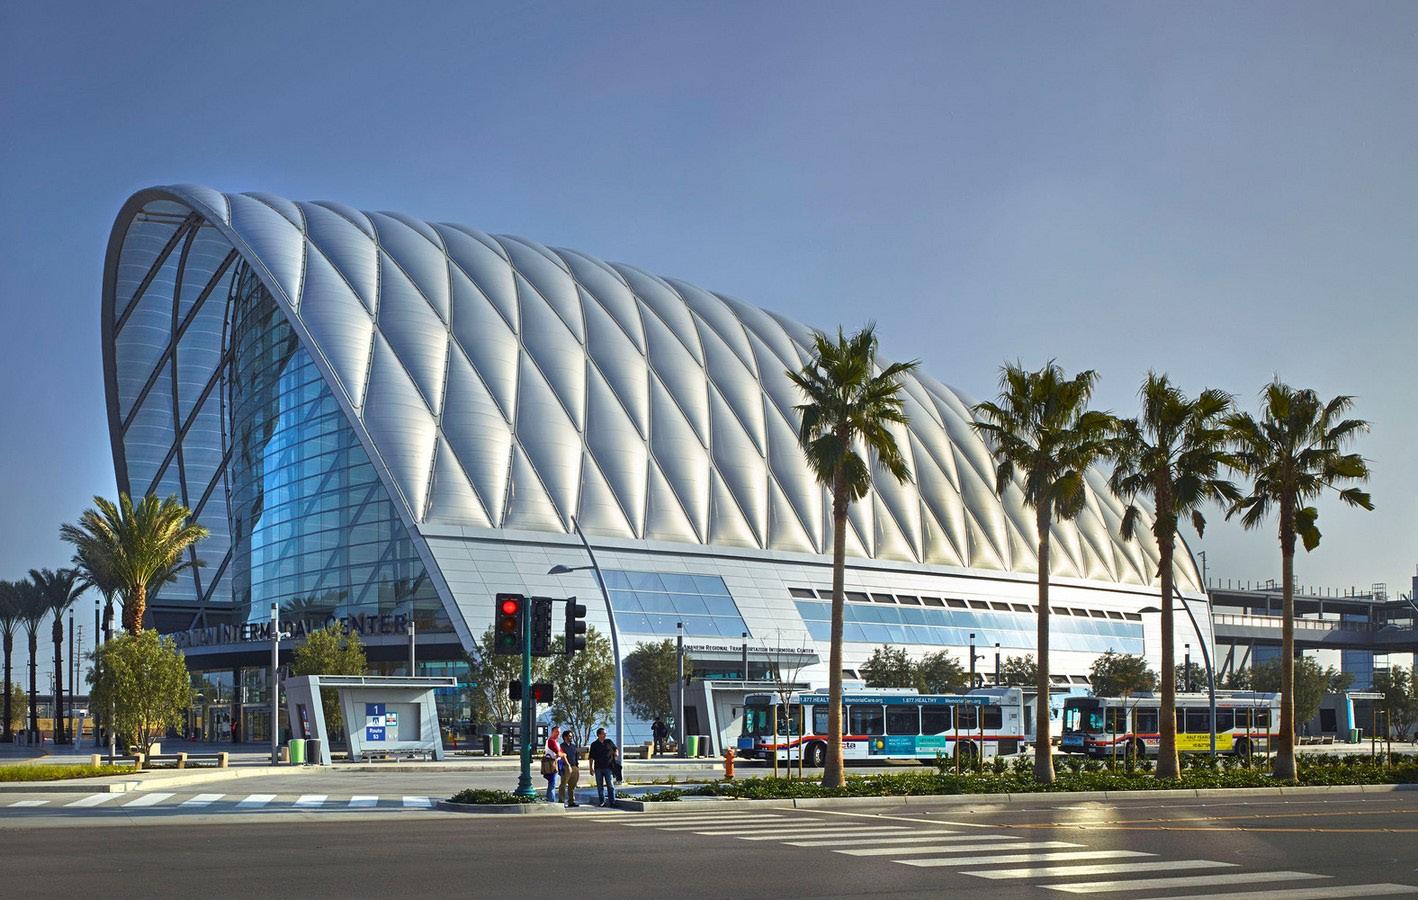
Fig 9.1.5: Side view of the Intermodal Center (https://www.archdaily.com/615466/anaheim-regional-transportation-intermodal-center-hok/551cb77de58ecef247000099-cf005563-2-jpg)
* The project is a Community focused building
* It serves more than 3 million people annually.
* The Transit hub links commuter and regional rail service and intercity bus systems including Amtrak, Metrolink, OCTA bus service, Anaheim Resort Transportation (ART), Megabus.com and Greyhound.
I Hussain Lakdawala I Sem IX - X I Design Dissertation I Rizvi 79
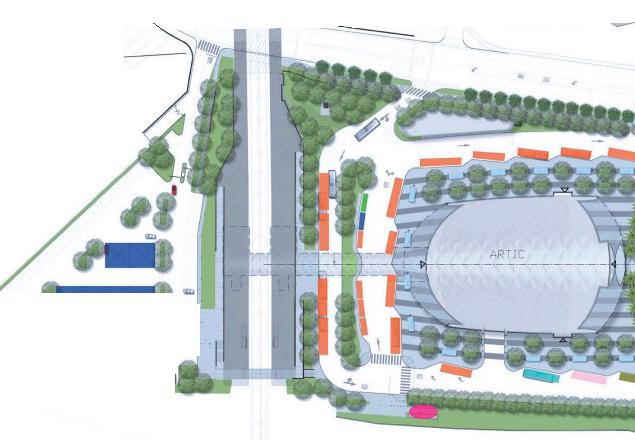
Fig 9.1.6: Master plan of ARTIC Center (https://www.anaheim.net/DocumentCenter/View/986/Capital-Program-Update-Presentation--August-2013-PDF?bidId=)
* Total of 10 different transportation facilities like Metrolink, Amtrak, Intercity buses, International buses, Taxi services, Charter buses, Private vehicles, Bicycle, Pedestrian access.
* Amenities like transit-oriented retail, Wi-Fi and charging stations, parking, bike racks, lockers, community space and specialty dining are thought of while planning the Hub.
* The Transit Hub is designed to be Pedestrian friendly and the planning of the future land use and developments around the facility is also done with respect to pedestrian movements.
* The ARTIC has recieved U.S. Green Building Council LEED Platinum certification for its sustainable approach in designing the structure. Due to this the structure consumes 50% less energy.
* It creates employment for around 5000 people.
I Hussain Lakdawala I Sem IX - X I Design Dissertation I Rizvi 80
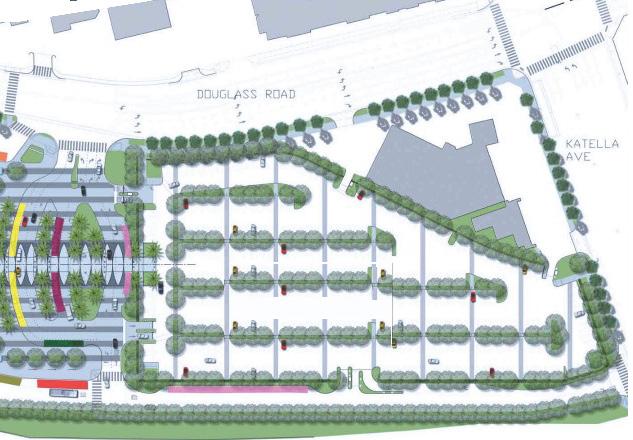
LEGEND
OCTA Bus service
Metro link
AMTRAK
Shuttle service
Bus provider 1
Bus provider 2
ART Service
Taxi pick-up
Taxi queue
Shuttle pick-up
Drop off area
Bicycle parking
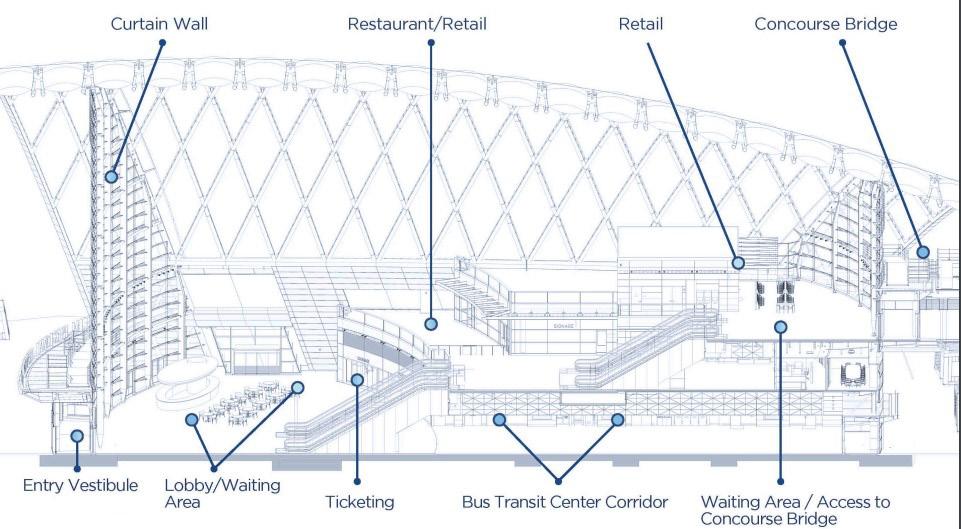
Fig 9.1.7: Section of ARTIC Center (https://www.anaheim.net/DocumentCenter/View/986/Capital-Program-Update-Presentation--August-2013-PDF?bidId=)
I Hussain Lakdawala I Sem IX - X I Design Dissertation I Rizvi 81
9.2- Design Program
* The brief tries to bridge the gap between the Public Transportation facilities and the user’s destinations.
* The main aim is to connect that last mile of the route to the rest of the journey. The components of the Design Program is further divided into 4 sections :
* Design Components: Main aim of these components will be easy commute of passengers, Modal shift between different modes of transport, and Larger Public interests and Urban inserts.
* Commercial Components: It also looks upon certain revenue generations schemes that can help sustain the project for a longer run.
* Accessibility Components: Components which will help in easy Access and Larger network extensions to different locations.
* Service Components: Services are for the seamless functioning of the prior mentioned components.
Design Program
Design
components
Design components
* Pedestrian-oriented Design.
* Bicycle stands
* Public parks
* Community engagement areas
* Eateries
* Charging stations
* Bus access
Essential components
* PTI Transport access
* Universally designed platforms and stops
* Ticket counters
* Governing authorities office spaces
I Hussain Lakdawala I Sem IX - X I Design Dissertation I Rizvi 82
Commercial components
* Commercial and Retail set-ups
* Informal and Formal Markets
* Advertisements
* Hoardings.
* Private vehicles parking
* Institutional sector
Accessibility components
* Ciculation spaces
* Passageways
* Footover Bridges
* Skywalks
* Subways
* Platforms
* Transit Interchange Corridors
Services components
* Toilets
* Lifts
* Escalators
* Office spaces
* Fire fighting
* AHU Room
* Water supply
* STP plant
* D.G Room
* Meter room
I Hussain Lakdawala I Sem IX - X I Design Dissertation I Rizvi 83
9.3- Operational Framework
* Operational Framework helps in the schematic connections of the ideas presented in the thesis or research.
* It is methodoligical in nature.
* It helps framing out the methods, criterias, steps and measure that needs to be taken in order to operate the ideas presented.
* The following framework discusses 4 different aspects for each sector: Stakeholders, Funding agencies, Construction, Revenue schemes
* The following operational framework is a hypothetical framework designed for educational purpose based on the research and it does not venture into any legal aspects of it.
Design
components
STAKEHOLDERS: MMRDA, Commuters, Indian Railways, B.E.S.T, PTI Transport unions, Taxi unions, R.T.O, Private Bus owners, Shop owners, Hawkers.
CONSTRUCTION: MMRCL, Indian Railways, Private sectors, Western Railway, MHADA.
Design Program
FUNDING AGENCIES: MMRDA, MMRCL, Indian Railways, MHADA, Private sectors for shares
REVENUE: Parks, Charging stations, Rents, Hoardings, Bill boards.
I Hussain Lakdawala I Sem IX - X I Design Dissertation I Rizvi 84
STAKEHOLDERS: Shop owners, Commuters, Local Residents,
Commercial components
CONSTRUCTION: MMRDA, Private sectors, Indian Railways, Western Railways
FUNDING AGENCIES: MMRDA, Private sectors, Indian Railways, Western Railways
REVENUE: Rent, Liese, Advertisements, Hoarding
STAKEHOLDERS: Commuters, Hawkers, Vendors
Accessibility components
CONSTRUCTION: MMRDA, Private sectors, Indian Railways, Western Railways
FUNDING AGENCIES: MMRDA, Private sectors, Indian Railways, Western Railways
REVENUE: From Commercial sector
STAKEHOLDERS: Commuters, Hawkers, Vendors, Employees, PTI Unions, Bus drivers,
Services components
CONSTRUCTION: MMRDA, Private sectors, Indian Railways, Western Railways
FUNDING AGENCIES: MMRDA, Private sectors, Indian Railways, Western Railways
REVENUE: From Commercial sector
I Hussain Lakdawala I Sem IX - X I Design Dissertation I Rizvi 85
10.1- Andheri Railway and Metro station
10.2- Bandra Suburban Railway station
10. Potential Sites
10.3- Virar Suburban Railway station
10.4- Ghatkopar Railway and Metro station
I Hussain Lakdawala I Sem IX - X I Design Dissertation I Rizvi 86
Grading criteria for Potential Sites
Grading criteria for Potential sites
* The station should have access to atleast 2 or more modes of public transport.
* It should have access to atleast 2 or more PTI modes of transport.
* Average footfall throughout the day should be more than 1 lakh.
* S.W.O.T analysis to highlight positive and negative aspects of the station and station precinct.
* Potential of the sites are analysed on the basis of 5 factors:
1) different modes of transport
2) Larger transport networks and connections
3) Potential for Business and Commerce
4) Surrounding Context and Landuse
5) Population density and daily Footfall
* Each factor is graded on the scale of 1 to 5 (1 being lowest and 5 being highest).
* A total of 25 points is considered for evaluation. 1 2 3 4 5
I Hussain Lakdawala I Sem IX - X I Design Dissertation I Rizvi 87
Site 01:
Andheri Railway and Metro station
I Hussain Lakdawala I Sem IX - X I Design Dissertation I Rizvi 88
Site 01: Andheri Railway and Metro station
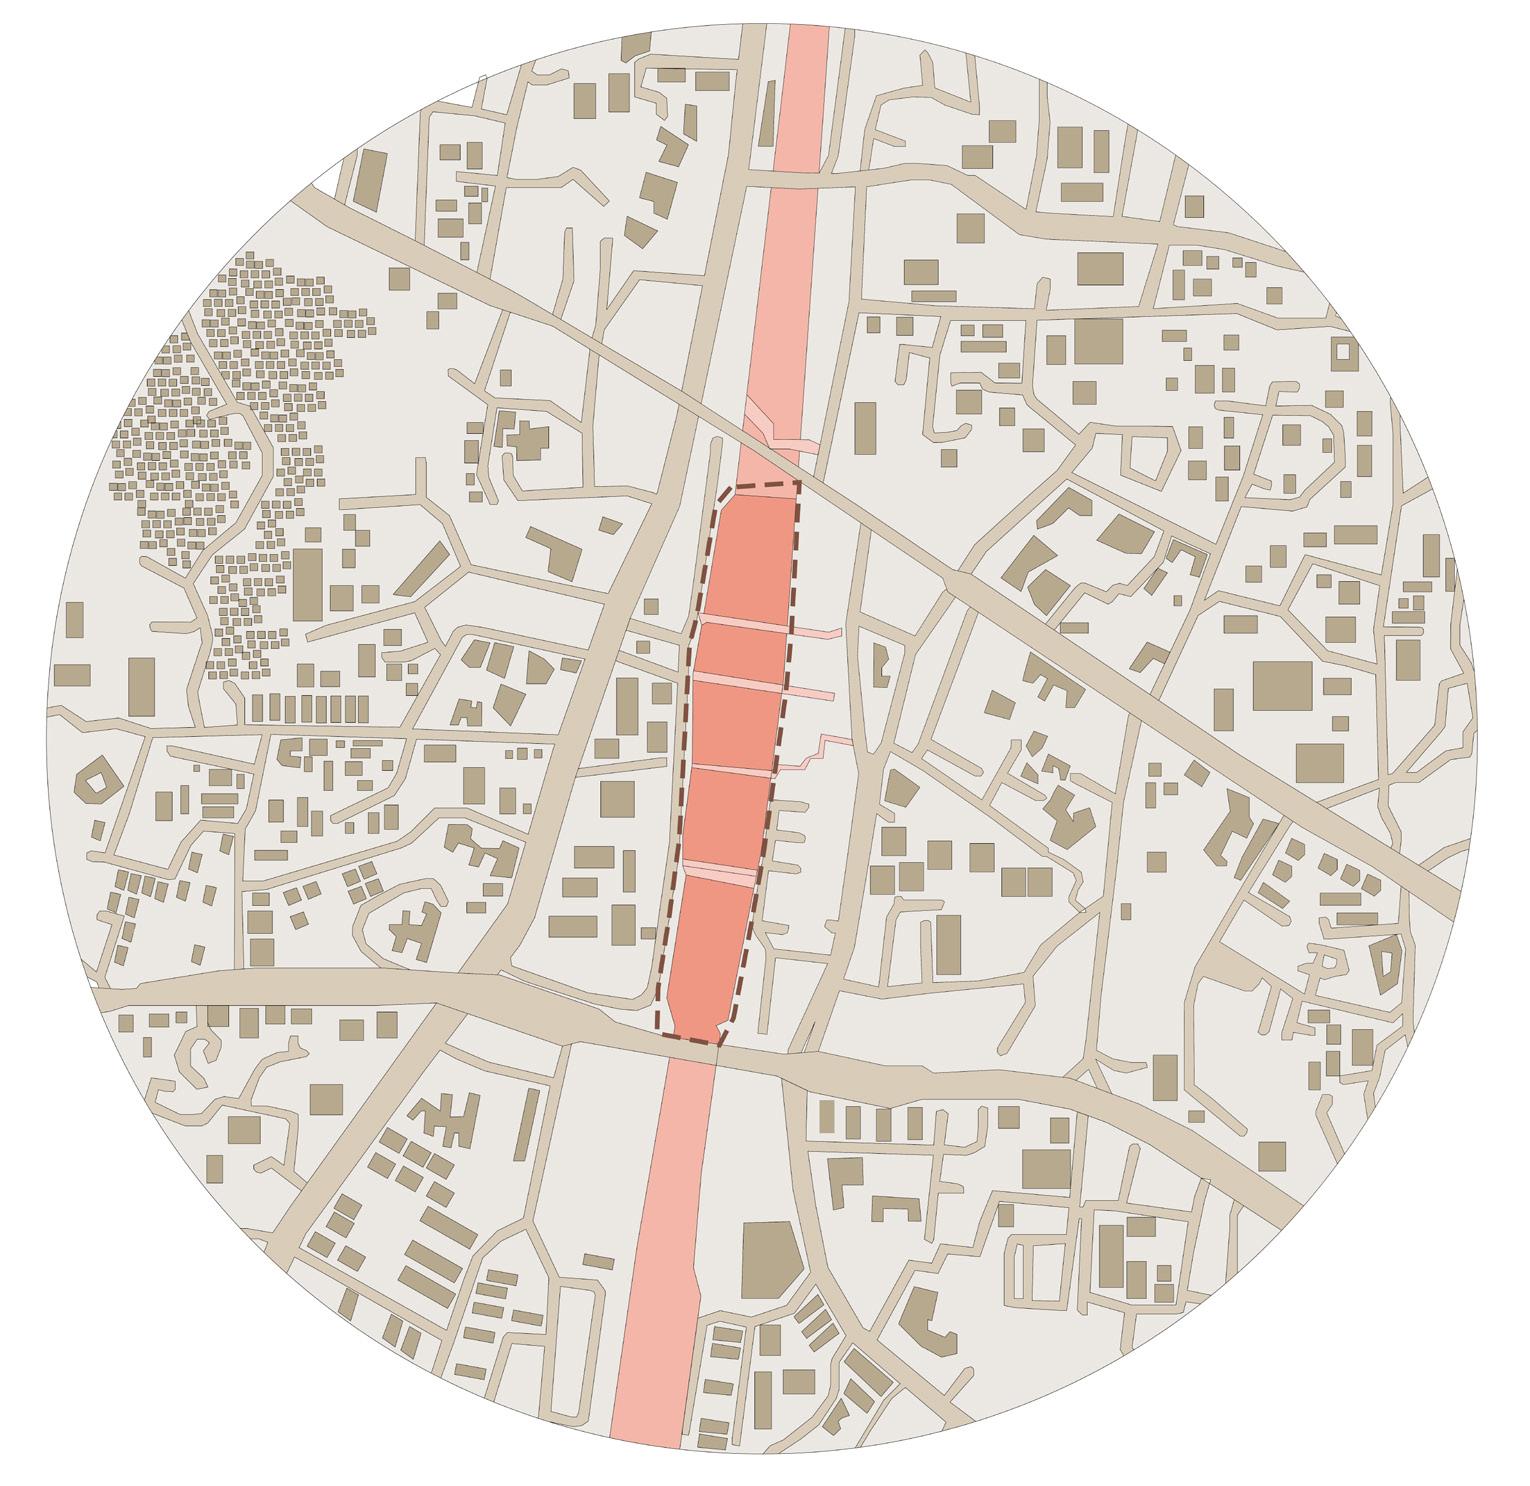
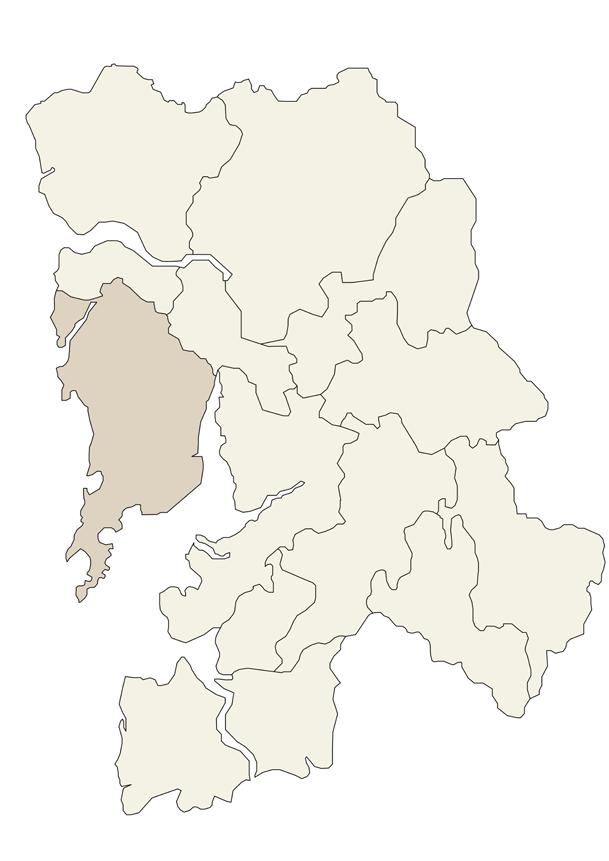
Andheri suburban Railway Station is one the most busiest and crucial railway station of the western railway.
It connects to metro station and other important working districts via Roadways. It becomes an important node to access not only the north-south directions but also the east-west directions which is comparatively less accessible.
Strengths
* Multi-modal transit station.
* Large footfall.
* Access to several working districts.
* East-West connection corridor.
Weakness Opportunities Threats
* Dense development.
* Not enough development opportunities around Station precinct.
* Can create Employment .
* Reduce waiting time.
*Easy access by making it Universally designed.
* Can attract larger footfall .
I Hussain Lakdawala I Sem IX - X I Design Dissertation I Rizvi 89
Fig 10.1.1: Map of Andheri station precinct (Author)
Fig 10.1.2 : Map of Mumbai Metropolitan region (Author)
01. Different modes of transport
Auto-rickshaw
Accessibility to different parts of the city from Andheri is quite convenient due to availability of multiple modes of transport.
02. Larger transport networks and connections
The Suburban line connects the suburbs to the island city.
The Metro line 2A connect the eastern and western parts of the city via Andheri.
The western express highway passing through Andheri connects the regions via road networks.
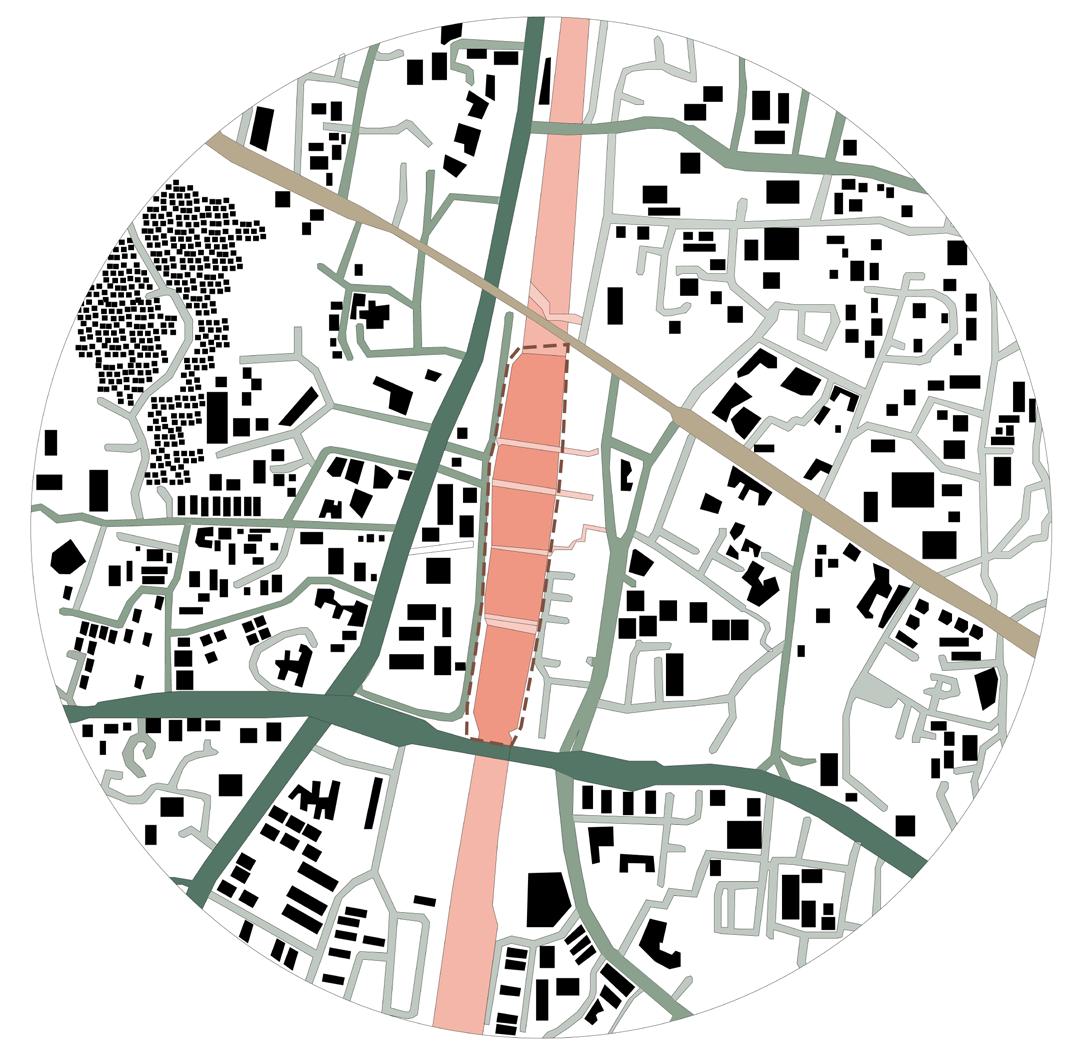
03. Potential for Commerce / Business
The area near the station precinct is densely developed due to its strategic location in the city.
Redevelopment or redesigning of such already existing commercial spaces is the only solution for such sites.
I Hussain Lakdawala I Sem IX - X I Design Dissertation I Rizvi 90
Railway line Metro line Primary road Tertiary road Secondary road Built mass 1 1 1 2 2 2 3 3 3 4 4 4 5 5 5 Train Metro B.E.S.T Bus Walking
Fig 10.1.3: Map showing transport network of Andheri station precinct (Author)
04. Surrounding context / Land-use
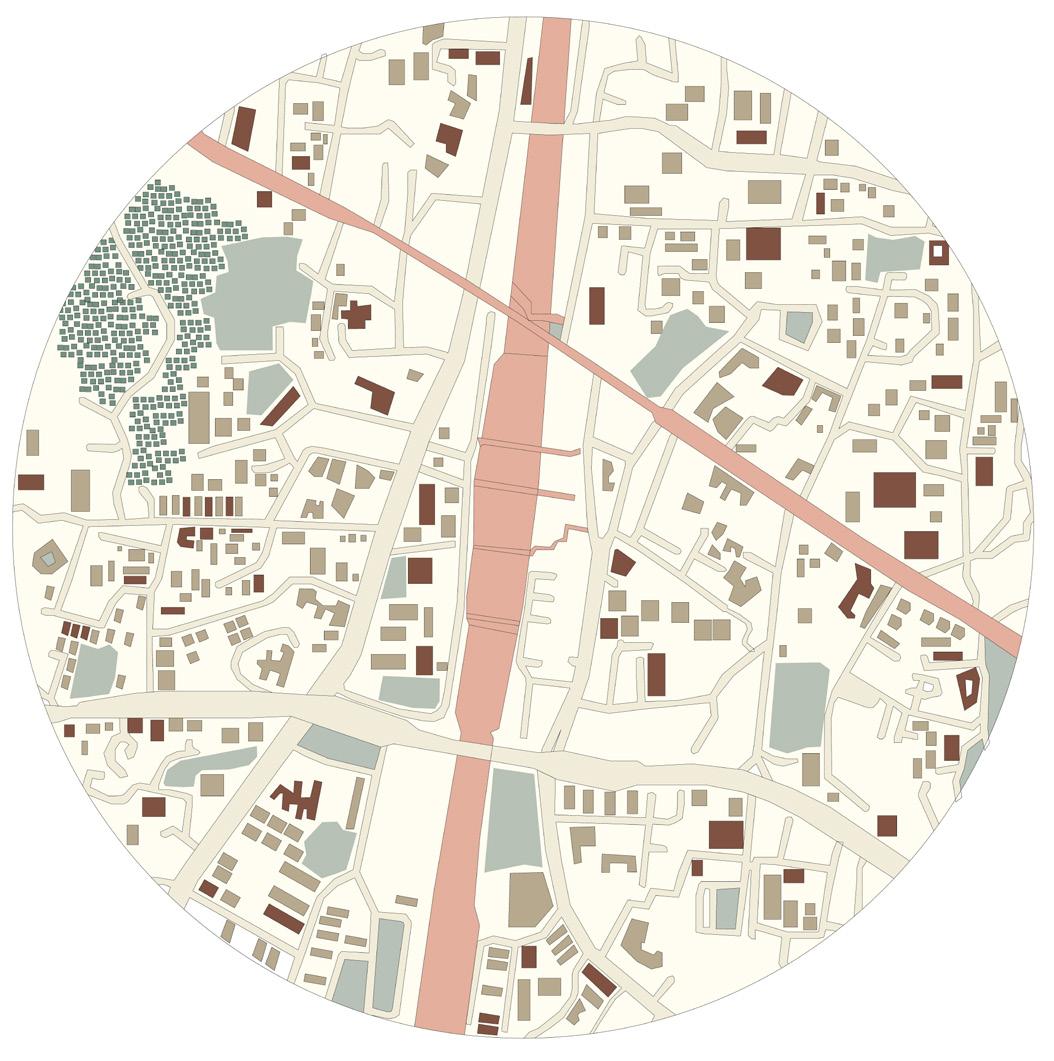
The majority of the land around station precinct is acquired by transportation and road networks. The immediate context is filled with mixed use building
Commercial zones are scattered around the region as it is one of the city’s Business district.
Transportation
Road network
Residential
Informal settlement
Open spaces
Commercial
Undefined space
05. Population density / Daily footfall
The maximum footfall is on the platforms of suburban railway, metro station and the connecting bridges between two modes. Andheri has the largest footfall of commuters in Western railway. The total of approximately 12 lakhs commuters travel daily from Andheri railway station. (Mantak mehta, TOI, 2019).
Railway line
Metro line
Primary road
1 1 2 2 3 3 4 4 5 5
Secondary road
Tertiary road
Built mass
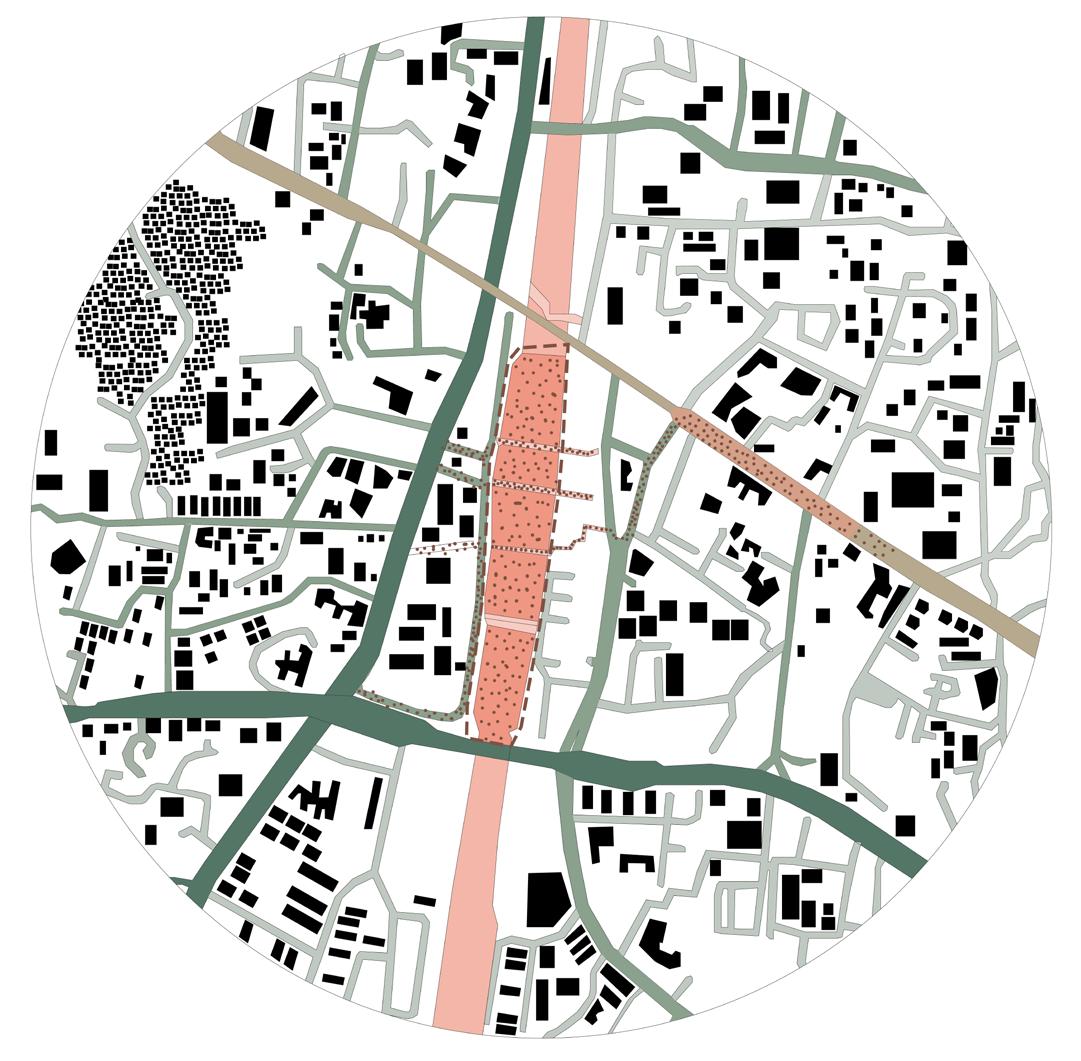
Total Points: 19 / 25 PTS.
I Hussain Lakdawala I Sem IX - X I Design Dissertation I Rizvi 91
Fig 10.1.4: Land use of Andheri station precinct (Author)
Fig 10.1.5: Footfall map of Andheri station precinct (Author)
Site 02:
Bandra Railway station
I Hussain Lakdawala I Sem IX - X I Design Dissertation I Rizvi 92
Site 02: Bandra Suburban Railway station


Bandra suburban Railway Station is one the most important interchange junction of the Western and Harbour line. It connects the western part of the city to the central and eastern parts. Bandra terminus is also an important junction for all the long distance train travelling across the country.
Strengths
* BKC one of the most important business district can be accessed from Bandra.
* Large footfall.
* Situated in the epicentre of the city.
Weakness Opportunities Threats
* Informal settlements across the precinct.
* No proper planning in terms of flow of traffic and people.
* Can create Employement .
* Reduced waiting time.
*Easy access by making it Universally designed.
I Hussain Lakdawala I Sem IX - X I Design Dissertation I Rizvi 93
Fig 10.2.1: Map of Bandra station precinct (Author)
Fig 10.2.2 : Map of Mumbai Metropolitan region (Author)
01. Different modes of transport
Autorickshaw
Access to the internal parts of Bandra is catered via B.E.S.T Bus services or Auto-rickshaws. Walking is usually avoided as the commercial complexes are not in the walk-able radius.
02. Larger transport networks and connections
The Western line connects the north and south of the city. The Harbour line connects bandra to Panvel and C.S.T.
The western express highway and S.V road are two primary roads connecting the regions via roadways.

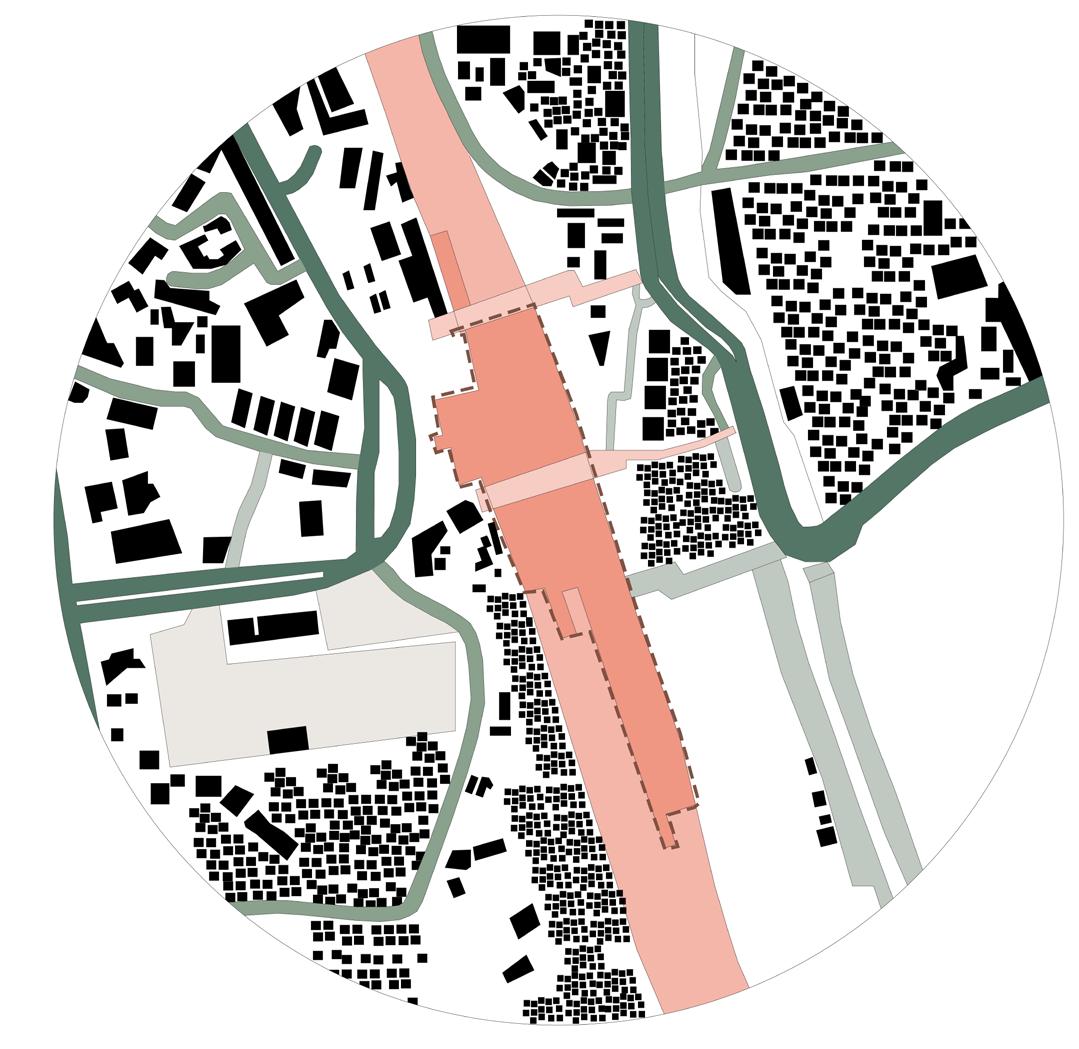
03. Potential for Commerce / Business
Most of the land around the station precinct is occupied by informal settlements on both sides of the station. Redevelopment of such settlements can create opportunities to develop commerce and employment.
I Hussain Lakdawala I Sem IX - X I Design Dissertation I Rizvi 94
Railway line Primary road Tertiary road Secondary road Built mass 1 1 1 2 2 2 3 3 3 4 4 4 5 5 5 Train B.E.S.T Bus Walking
Fig 10.2.3: Map showing transport networks of Bandra station precinct (Author)
04. Surrounding context / Land-use
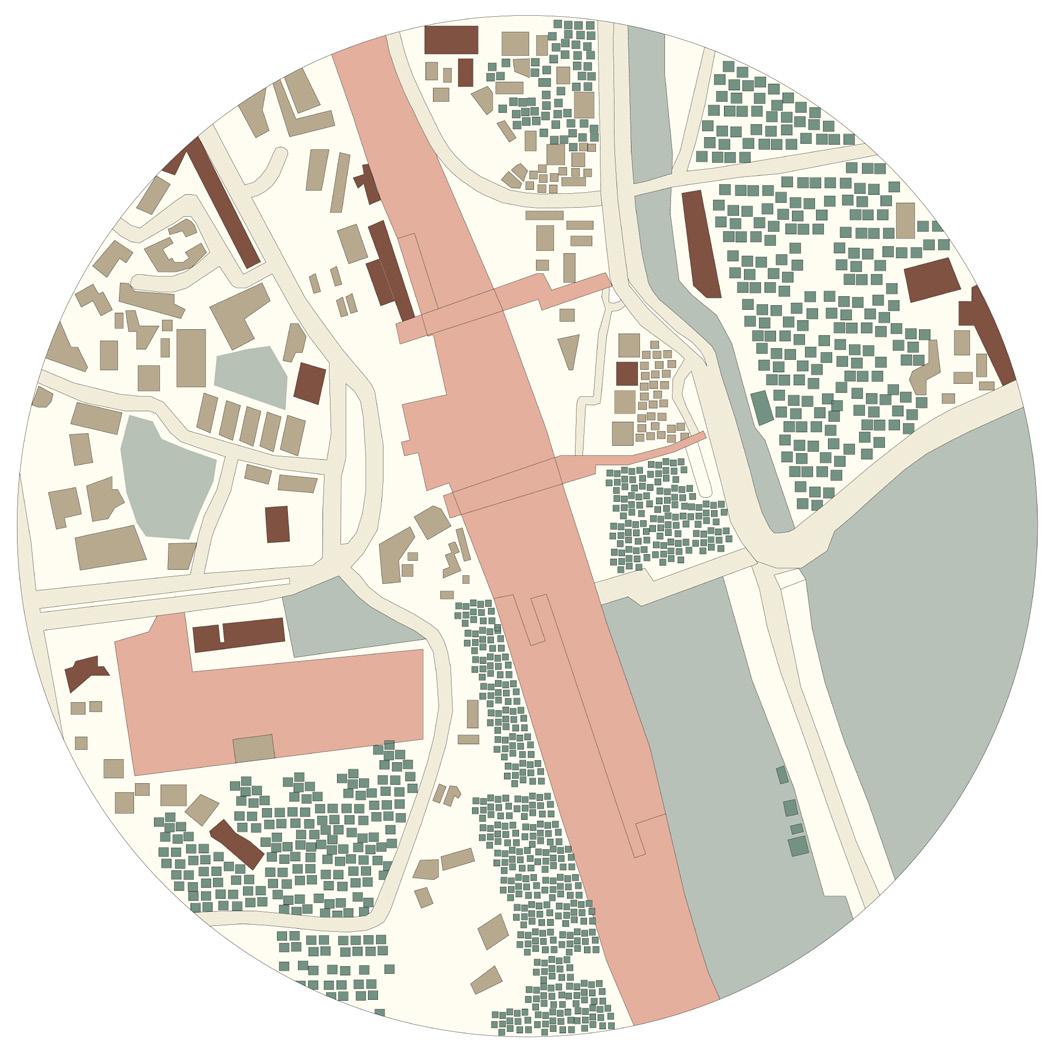
Most of the land around station Precinct is occupied by Informal settlements.
S.V road, Western express highway, Bandra Station and Terminus and B.E.S.T Bus depot acquires maximum land under Transportation and road networks.
There are few Residential and commerical development as well.
Transportation
Road network
Residential
Informal settlement
Open spaces
Commercial
Undefined space
05. Population density / Daily footfall
Bandra has the third largest footfall of commuters in Western railway after Churchgate and Andheri. (B. Aklekar, mid-day, 2022).
The total of approximately 4.9 lakhs commuters travel daily from Bandra railway station. (B. Aklekar, midday, 2022).
Railway line
Primary road
Secondary road
1 1 2 2 3 3 4 4 5 5
Tertiary road
Built mass
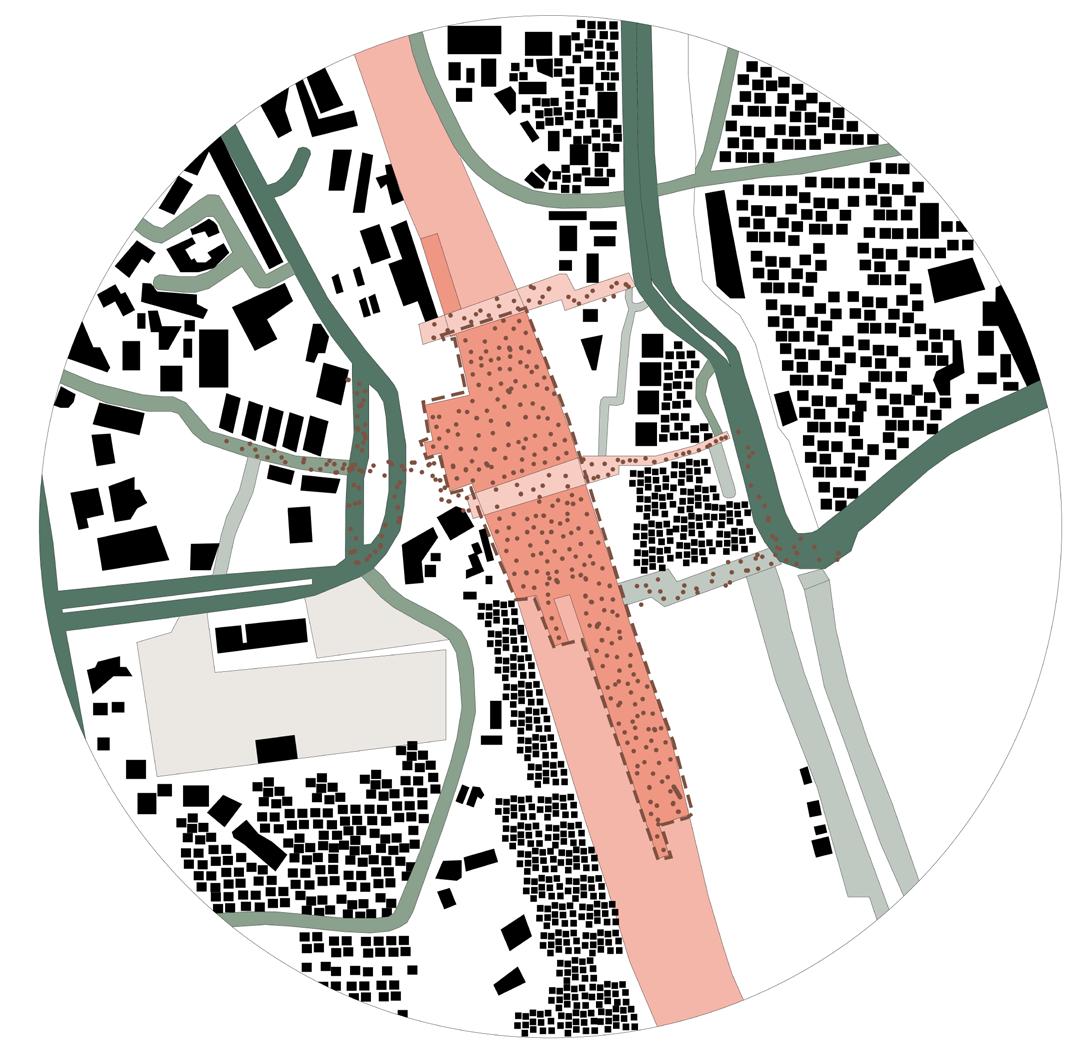
Total Points: 17 / 25 PTS.
I Hussain Lakdawala I Sem IX - X I Design Dissertation I Rizvi 95
Fig 10.2.4: Landuse map of Bandra station precinct (Author)
Fig 10.2.5: Footfall map of Bandra station precinct (Author)
Site 03:
Virar Railway station
I Hussain Lakdawala I Sem IX - X I Design Dissertation I Rizvi 96
Site 03: Virar Suburban Railway station
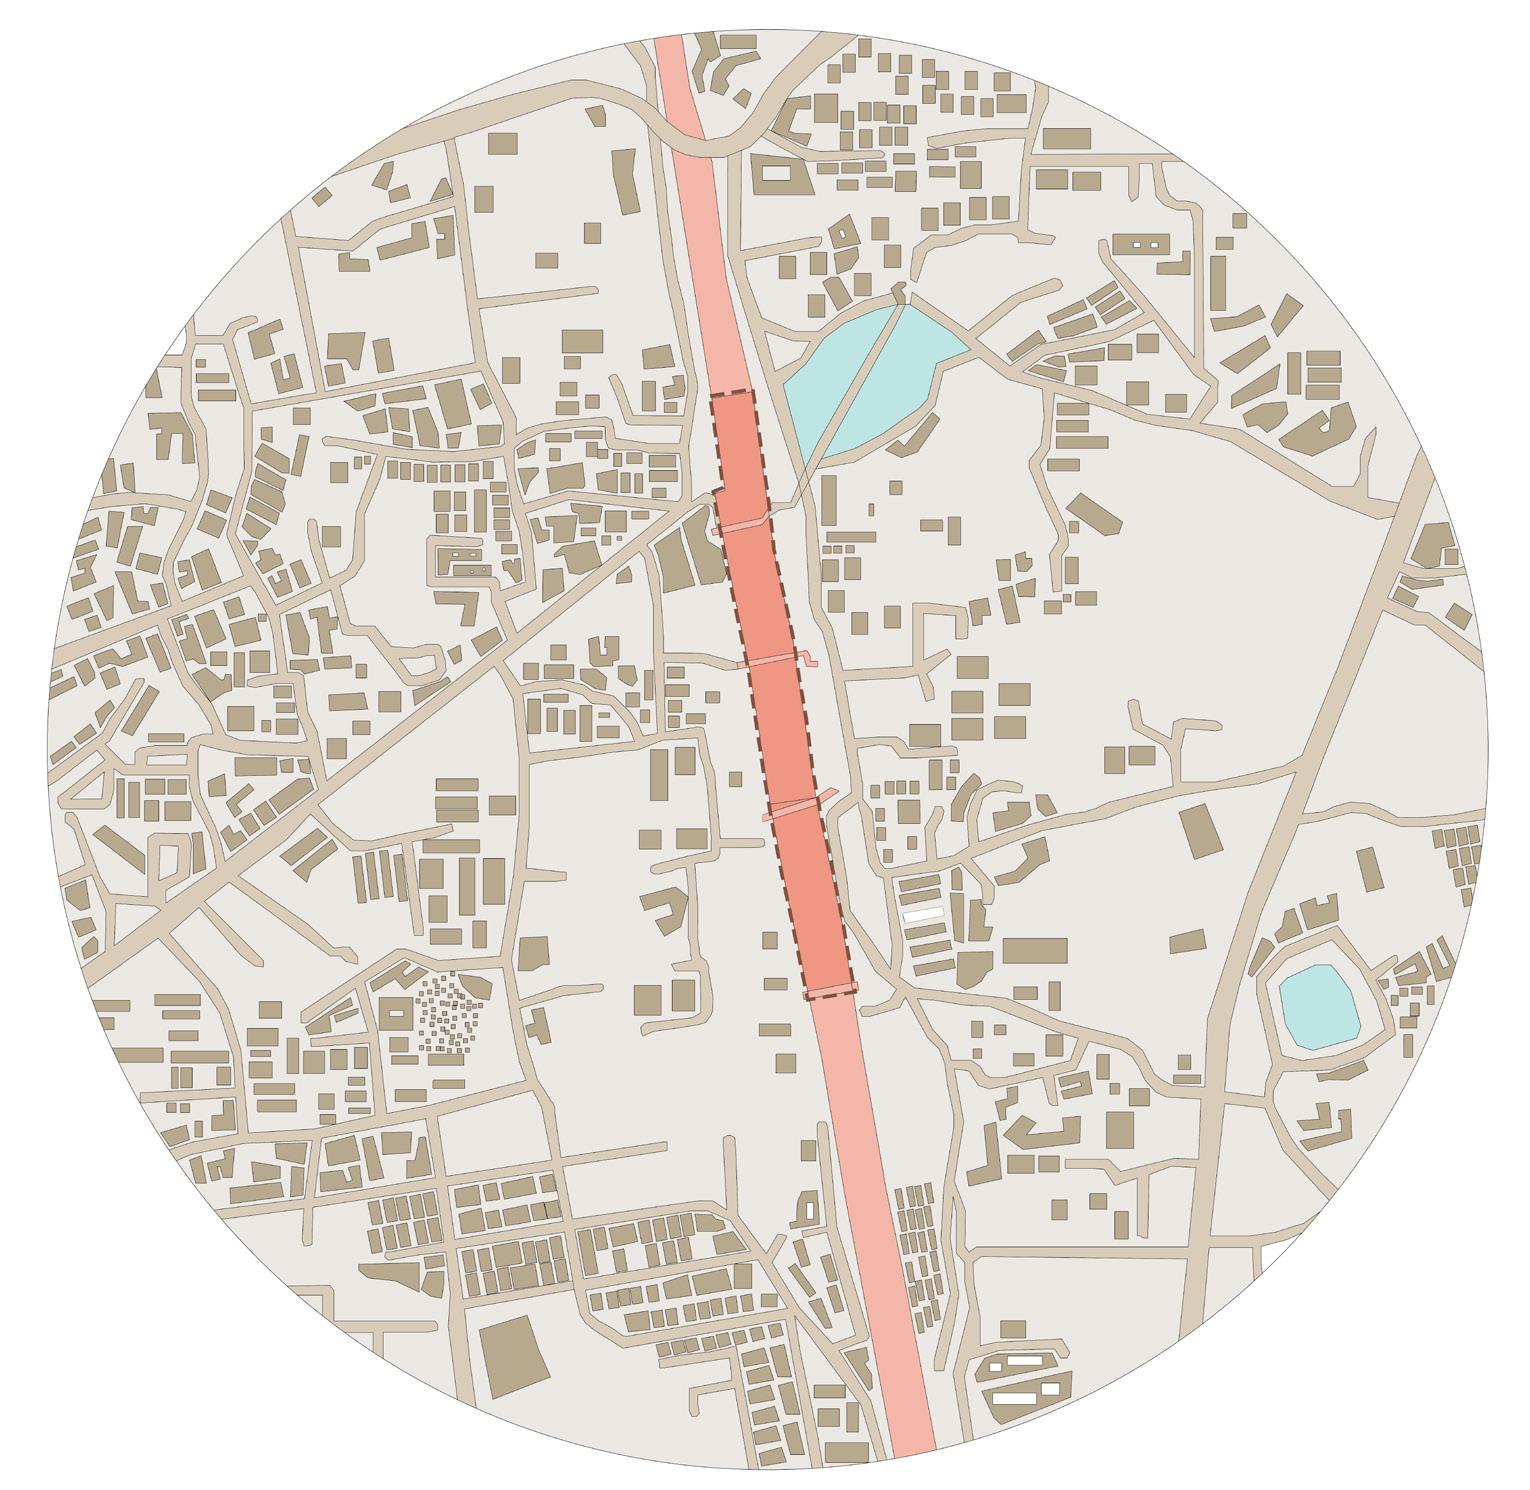

Virar Railway station is the center of the Western railway line which extends till Dahanu Road station in north and Churchgate station in south . It connects the southern and northen parts of the city.
Strengths
* Potential for commercial development.
* Large footfall.
* Emerging housing and town-planning projects.
Weakness Opportunities Threats
* Limited modes of transport.
* Dense development near Station Precinct.
* Can create Employement .
* Proper flow of traffic and pedestrian.
I Hussain Lakdawala I Sem IX - X I Design Dissertation I Rizvi 97
Fig 10.3.1: Map of Virar station precinct (Author)
Fig 10.3.2 : Map of Mumbai Metropolitan region (Author)
01. Different modes of transport
Autorickshaw
Local places are accessed via Rickshaws and Walking as the development is quite dense around the station. MSRTC buses are used for accessing outskirts of the region
02. Larger transport networks and connections
The Western line connects the north and south of the city.
MSRTC buses connects different regions of the state via Road networks.
Regions like Alibaug, Pune, Lonavala, Thane, Karjat, Panvel are also accessible from Virar due to MSTRC services.
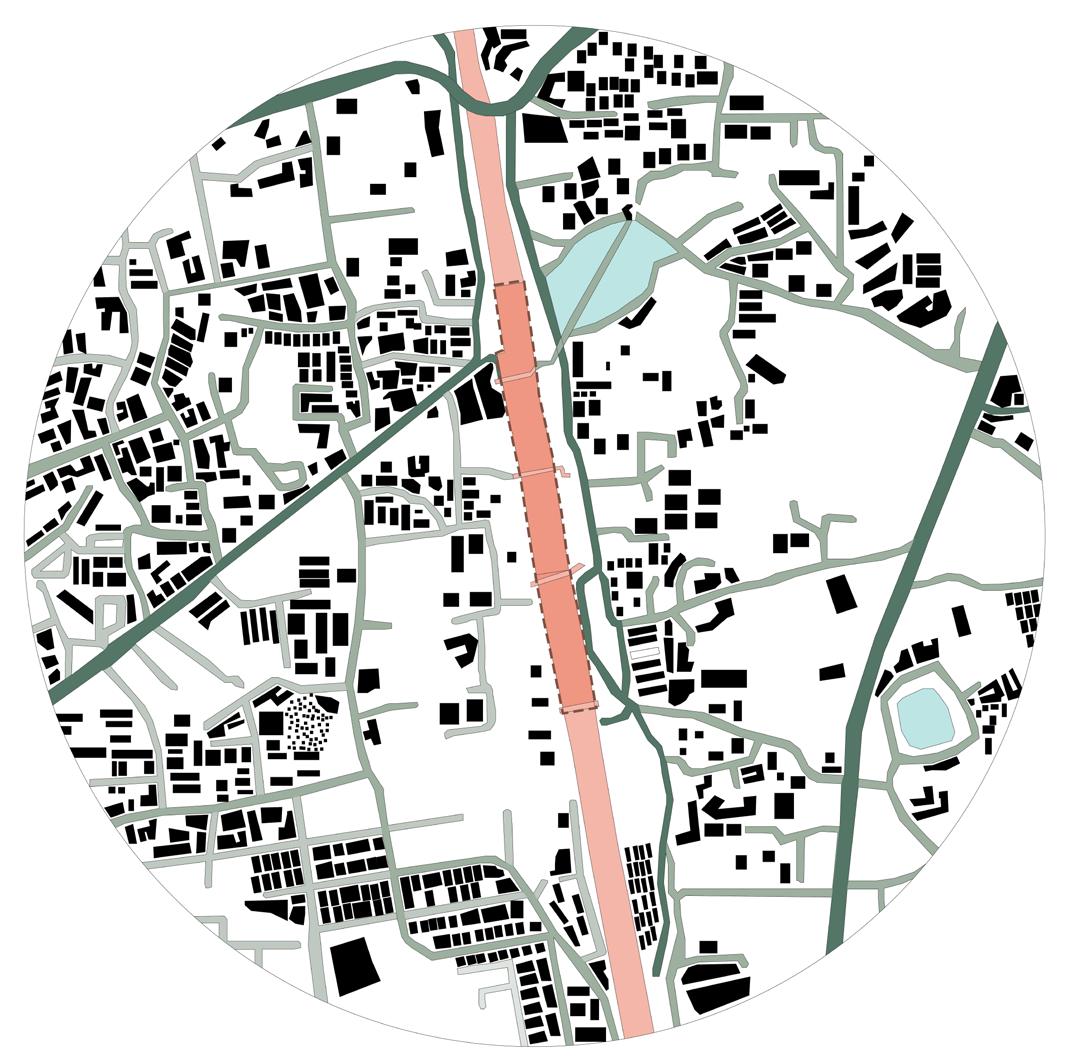
03. Potential for Commerce / Business
Vasai-Virar region is emerging as one of the commercial hubs in the suburban region of the city.
Recent years have seen a lot of housing projects and townships schemes in this region which results in growth of Commerce and Business.
I Hussain Lakdawala I Sem IX - X I Design Dissertation I Rizvi 98
Railway line Primary road Tertiary road Secondary road Built mass 1 1 1 2 2 2 3 3 3 4 4 4 5 5 5 Train MSRTC
Bus Walking
Fig 10.3.3: Map showing transport networks of Virar station precinct (Author)
04. Surrounding context / Land-use
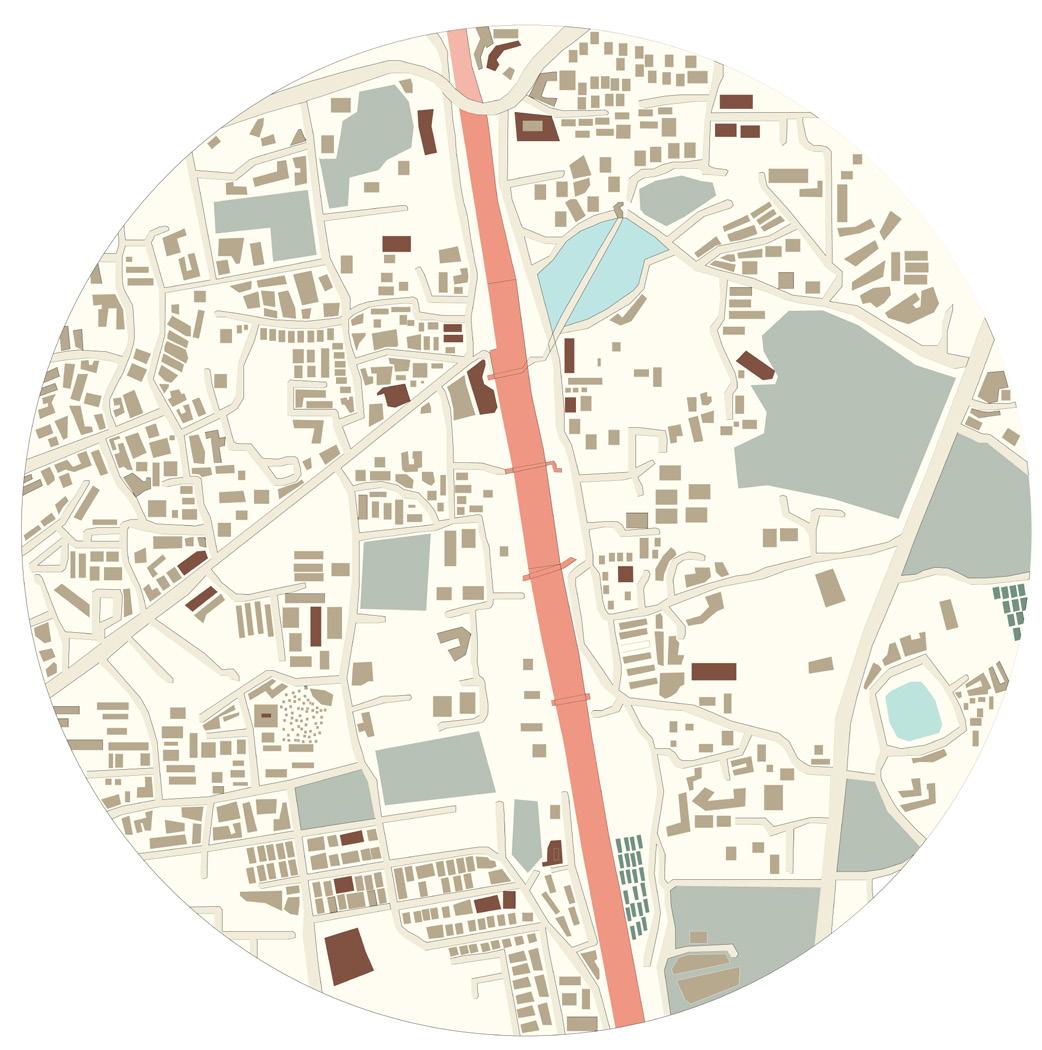
There are lot of mixed use (niche dukaan upar makaan) and commercial set-ups in the proximity of the station. Most of the land is aquired by Residential projects.
Patch of Informal settlements along the stretch of Railway line.
Transportation Road network
Residential
Informal
05. Population density / Daily footfall
Virar station witnesses a significant amount of footfall throughout the day, maxiumum during the peak hours in morning and evening. The total of approximately 2.5 lakhs commuters travel daily from Virar railway station.
settlement 1 1 2 2 3 3 4 4 5 5
Railway line
Primary road
Secondary road
Open spaces
Commercial
Undefined space
Water bodies
Tertiary road
Built mass
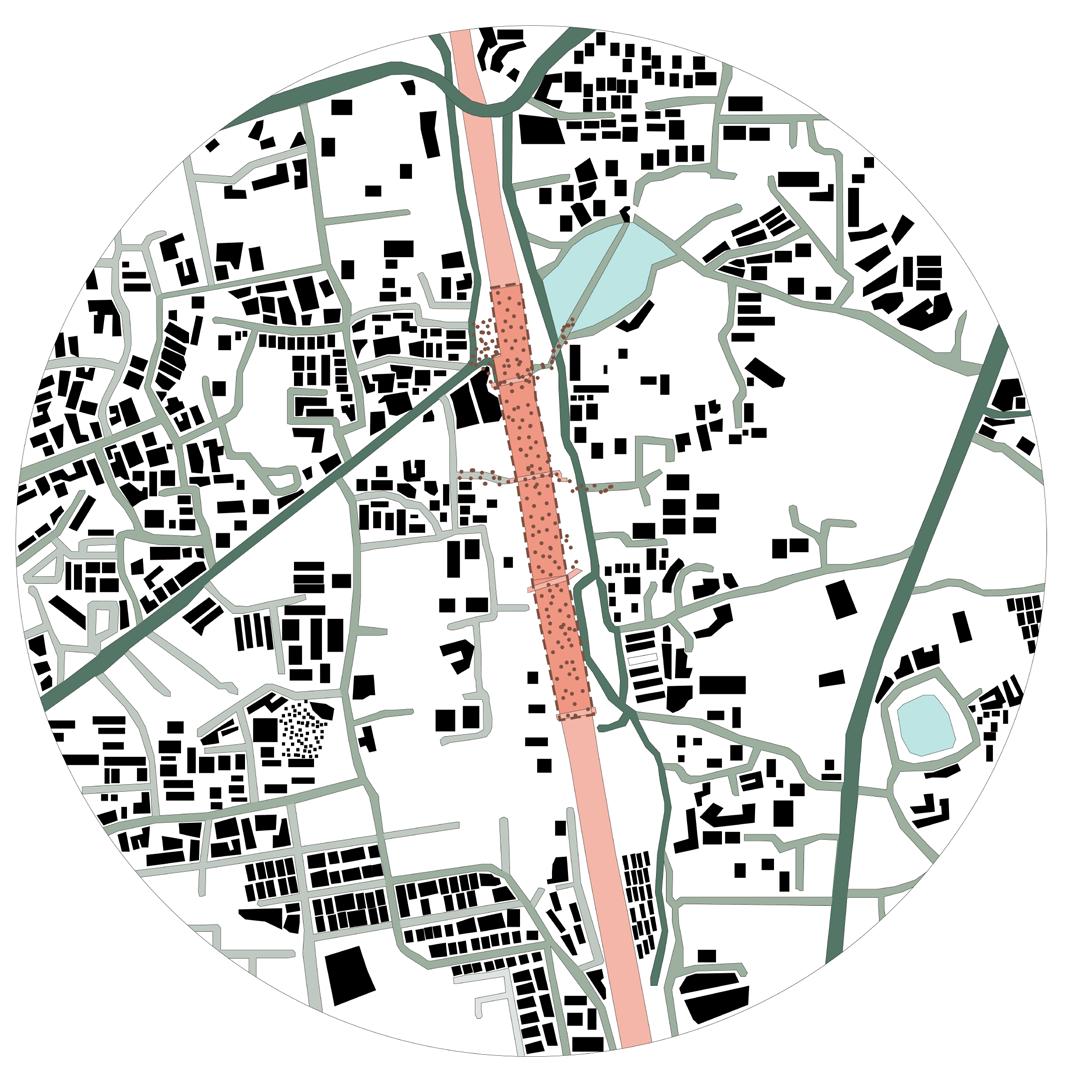
Total Points: 19 / 25 PTS.
I Hussain Lakdawala I Sem IX - X I Design Dissertation I Rizvi 99
Fig 10.3.4: Land use map of Virar station precinct (Author)
Fig 10.3.5: Footfall map of Virar station precinct (Author)
Site
04:
Ghatkopar Railway and Metro station
I Hussain Lakdawala I Sem IX - X I Design Dissertation I Rizvi 100
Site 04: Ghatkopar Railway and Metro station
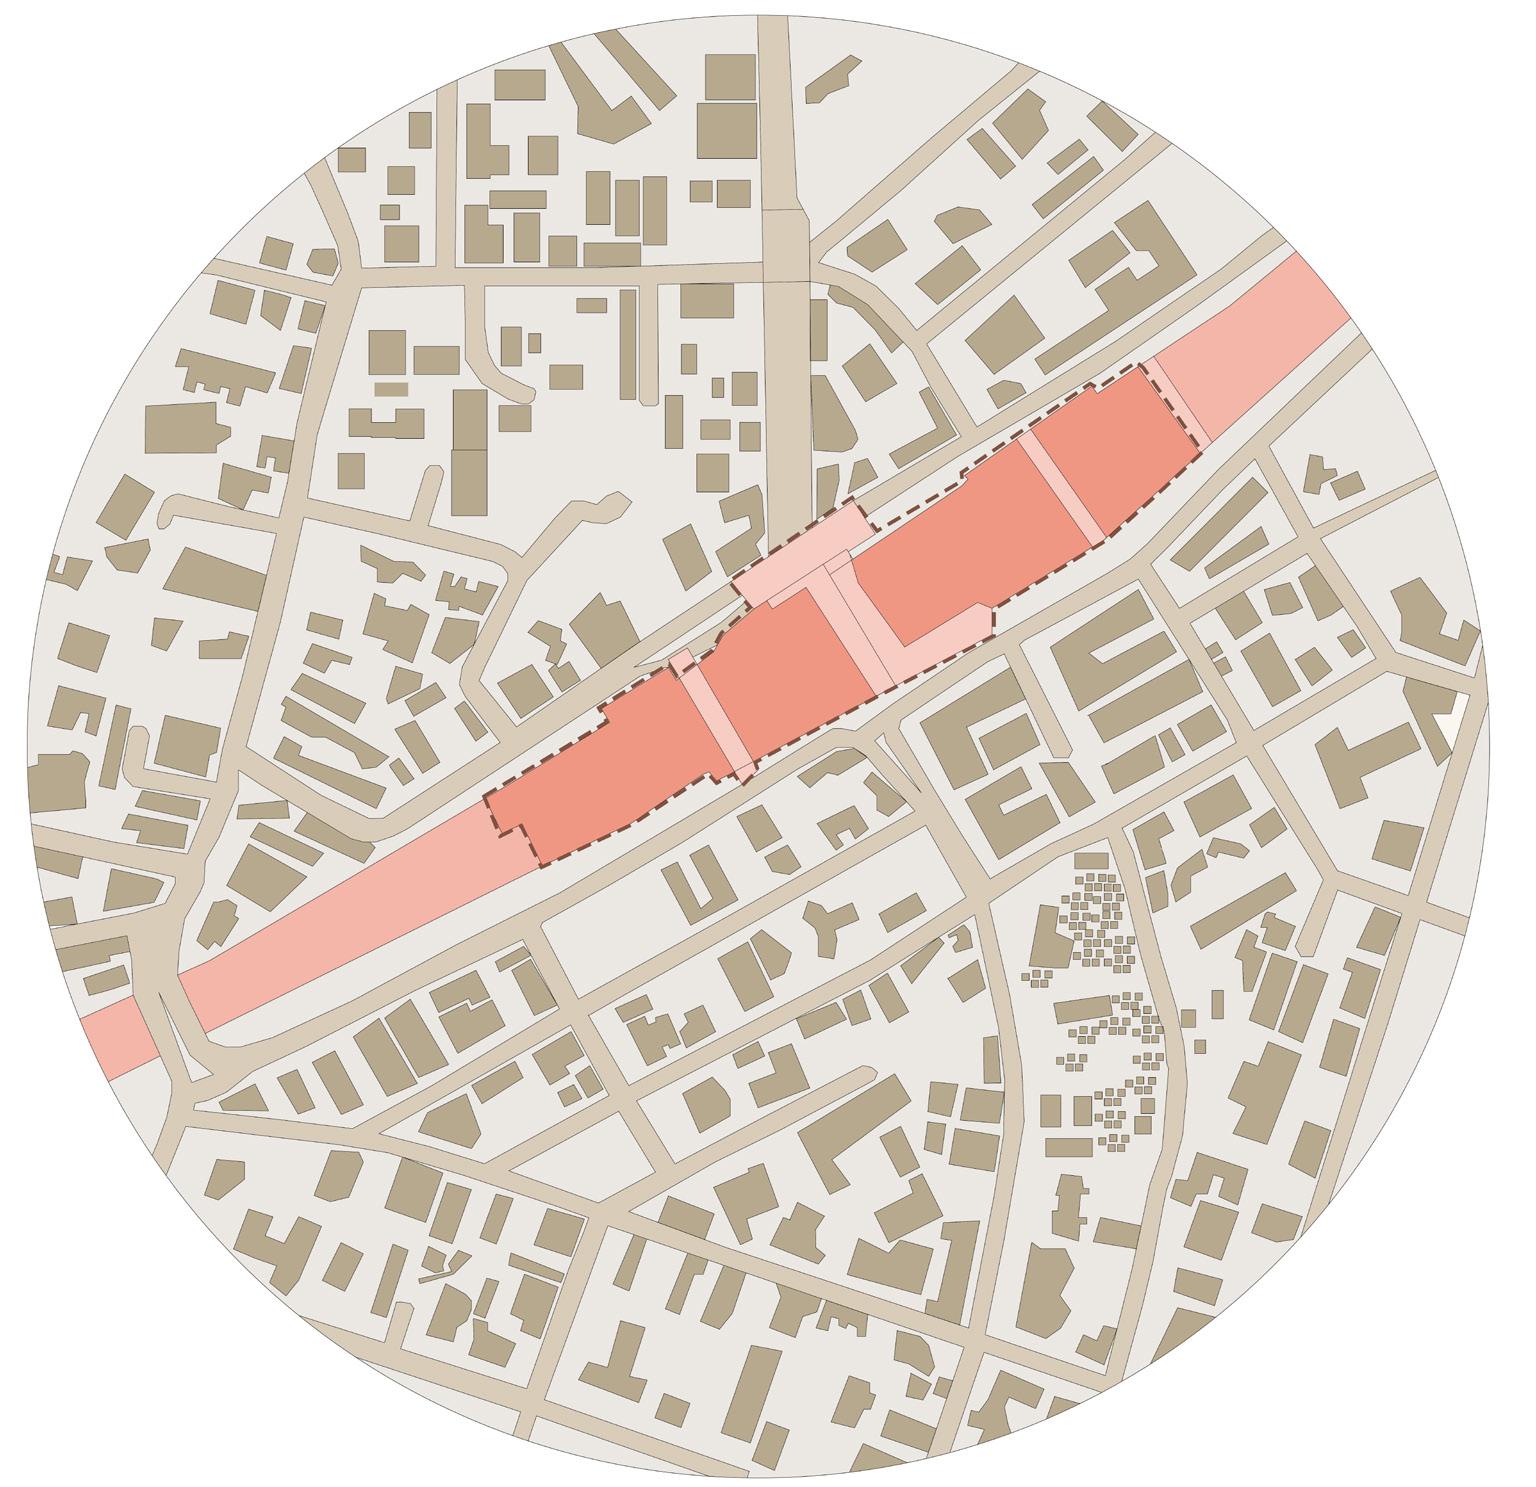
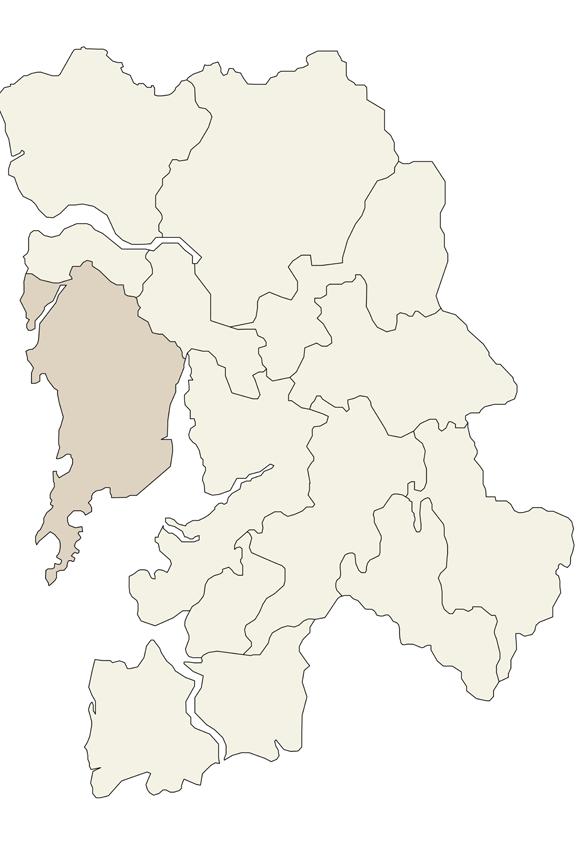
Ghatkopar Railway station is one of the most populated stations of the Central Railway line of the city.
Metro line 2A which runs from Ghatkopar to Versova increases East-West connectivity. The overlapping of Metro line 2A and Metro line 2 further extends connections towards South and North.
Strengths
* Availability of Multi modal shift in transport services.
* Large footfall as it is an important junction .
Weakness Opportunities Threats
* No scope for further development near station
* No proper planning in terms of flow of traffic and people.
* Can reduce traffic congestion with proper planning .
* Reduced waiting time.
*Easy access by making it Universally designed.
I Hussain Lakdawala I Sem IX - X I Design Dissertation I Rizvi 101
Fig 10.4.1: Map of Ghatkopar station precinct (Author)
Fig 10.4.2 : Map of Mumbai Metropolitan region (Author)
01. Different modes of transport
Access to different parts of the city is easy due to availability of Central railway and Metro at one place.
Internal routes are catered by Bus and Rickshaws
02. Larger transport networks and connections
The Central line connects from C.S.T to Karjat/ Kasara etc.
Metro services East-West connect from Ghatkopar to Versova

03. Potential for Commerce / Business
The region is well connected to different parts of the city and hence can be a potential site for business centers.
I Hussain Lakdawala I Sem IX - X I Design Dissertation I Rizvi 102
1 1 1 2 2 2 3 3 3 4 4 4 5 5 5
B.E.S.T
Walking Railway line Metro line Primary road Tertiary road Secondary road Built mass
Auto-rickshaw Train Metro
Bus
Fig 10.4.3: Map showing transport networks of Ghatkopar station precinct (Author)
04. Surrounding context / Land-use
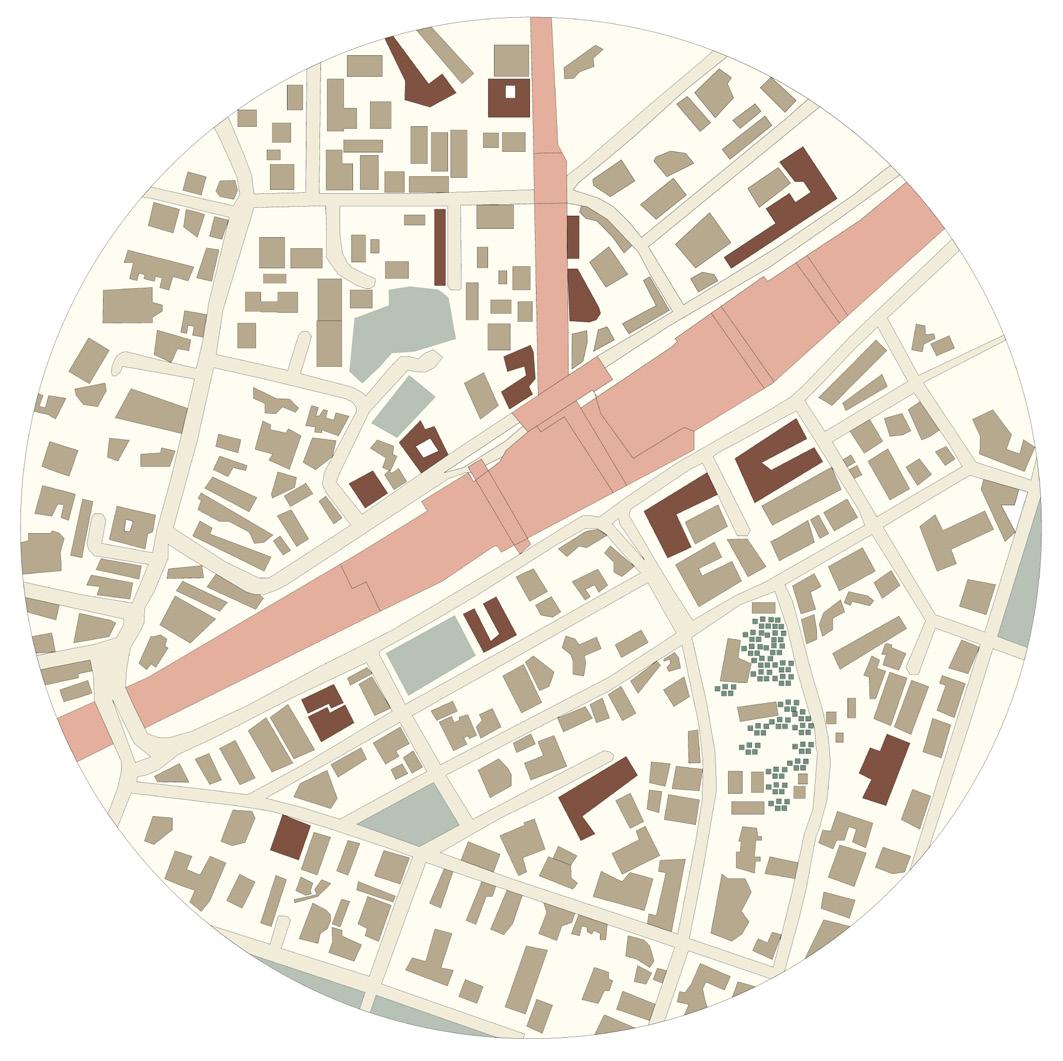
Most of the land around station precinct witnesses Residential areas. There are few commercial centers around the station and along the Metro line.
Transportation
Road network
Residential
Informal settlement
05. Population density / Daily footfall
Ghatkopar is one of the busiest Railway station on Central line and the addition of Metro line has added upto the overall Footfall .
The total of approximately 3.8 lakhs commuters travel daily from Ghatkopar railway station and 2 lakhs travel from Ghatkopar Metro . (Kamal Mishra, Mumbai mirror, 2019)
Railway line
Metro line
Primary road
Open spaces
Commercial
Undefined space
Secondary road
Tertiary road
Built mass
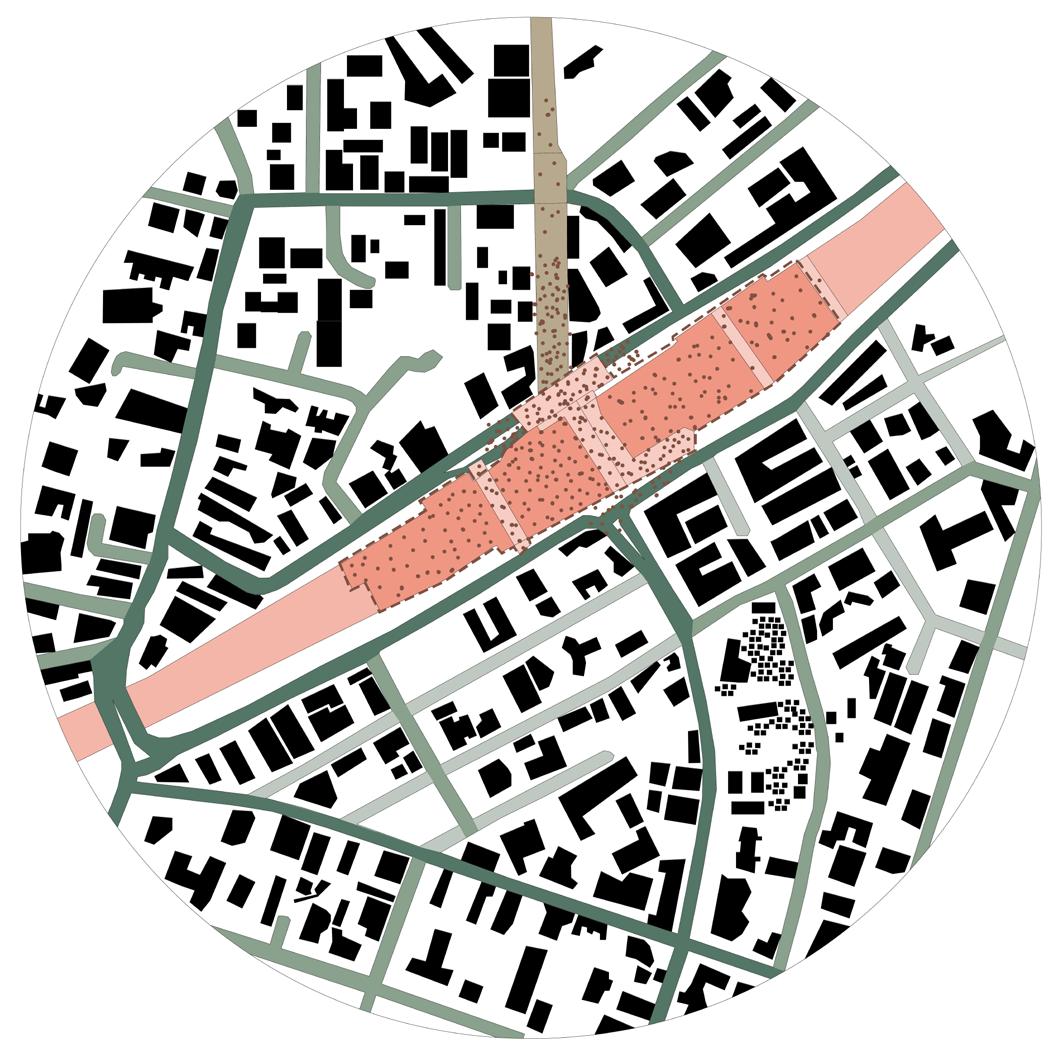
Total Points: 18 / 25 PTS.
I Hussain Lakdawala I Sem IX - X I Design Dissertation I Rizvi 103
1 1 2 2 3 3 4 4 5 5
Fig 10.4.4: Land use of Ghatkopar station precinct (Author)
Fig 10.4.5: Footfall of Ghatkopar station precinct (Author)
As per the analysis and the grading of the four potential sites:
1) Andheri Railway and Metro station: 19 / 25 pts.
2) Bandra Railway station: 17 / 25 pts.
3) Virar Railway station: 19 / 25 pts.
4) Ghatkopar Railway and Metro station: 18 / 25 pts.
* Compared to Andheri Metro and Railway station, Virar Railway station has much more potential in terms of commerce and Business sector.
* Andheri is much more densely populated and developed compared to Virar.
* Enhancing the Transportation network can create an opportunity for Virar to emerge as one of the CBD’s in the northen suburbs.
I Hussain Lakdawala I Sem IX - X I Design Dissertation I Rizvi 104 10.4-
Conclusion
I Hussain Lakdawala I Sem IX - X I Design Dissertation I Rizvi 105 Notes / Remarks
11. Appendix
I Hussain Lakdawala I Sem IX - X I Design Dissertation I Rizvi 106
* Name: * Age:
* Gender: * Occupation:
* Any special physical or mental condition:
* Where Do You Stay?
* Where do you go to work/college?
* How much do you travel daily?
* Different types of modes used?
* Is it affordable?
* Is it comfortable?
* How good is the accessibility?
* Is it safe?
* How much do you like to travel via this mode?
I Hussain Lakdawala I Sem IX - X I Design Dissertation I Rizvi 107 11.1- Questionnaire
1 1 1 1 1 2 2 2 2 2 3 3 3 3 3 4 4 4 4 4 5 5 5 5 5
I Hussain Lakdawala I Sem IX - X I Design Dissertation I Rizvi 108 12.
Bibliography
17 Sudhir Badami - Setting the Right Priorities for Mumbai Transportation
https://udri.org/wp-content/uploads/Mumbai%20Reader/MR%2010/17%20Sudhir%20 Badami%20-%20Setting%20the%20Right%20Priorities%20for%20Mumbai%20Transportation.pdf
The Automobilization of Mumbai: A Walking City That Privileges Cars http://infrapolitics.c4sr.columbia.edu/studentProjects/Geary/index.html
Transport in Cities: India indicators
https://environmentaldocuments.com/embarq/India-Integrated-Transport-Indicators-EMBARQ.pdf
Citizen matters Mumbai: Last mile connectivity still a problem for Mumbaikars https://mumbai.citizenmatters.in/mumbai-commute-local-train-metro-last-mile-connectivity-32876#:~:text=%E2%80%9CThe%20last%20mile%20connectivity%20problem,roads%2C%E2%80%9D%20says%20Sree%20Kumar.
Towards better accessibility and mobility in indian cities- by K V Krishna Rao.
https://www.urbanmobilityindia.in/Upload/Conference/841c5bd4-f1e9-490d-9f21f64bd1962a73.pdf
Sustainable Urban Transport in India
https://www.urbanmobilityindia.in/Upload/Conference/841c5bd4-f1e9-490d-9f21f64bd1962a73.pdf
Mumbai Metropolitan Region: Railway-guided development https://www.niua.org/tod/todfisc/book.php?book=1§ion=4
Last Mile Connectivity in the Indian Scenario: A literary review https://www.researchgate.net/publication/370858800_Last_Mile_Connectivity_in_the_ Indian_Scenario_A_literary_review
I Hussain Lakdawala I Sem IX - X I Design Dissertation I Rizvi 109 12.1- Refrences
12.2- Bibliography
For Research:
https://wrirosscities.org/sites/default/files/India-Integrated-Transport-Indicators-EMBARQ.pdf
http://www.urbanmobilityindia.in/Upload/Conference/841c5bd4-f1e9-490d-9f21-f64bd1962a73.pdf
https://portal.mcgm.gov.in/irj/go/km/docs/documents/MCGM%20Department%20 List/Roads%20and%20Traffic/Docs/CMP%20for%20Greater%20Mumbai/Executive%20 Summary/Executive%20Summary.pdf
https://www2.deloitte.com/content/dam/insights/us/articles/4331_Deloitte-City-Mobility-Index/Mumbai_GlobalCityMobility_WEB.pdf
https://www.statista.com/statistics/1251933/india-modal-share-of-public-transport-inmumbai/
https://www.designingbuildings.co.uk/wiki/Integrated_transport_system#:~:text=Some%20examples%20of%20integration%20between,train%2C%20subway%2Ftube%20services
https://www.niua.org/tod/todfisc/book.php?book=1§ion=4
https://www.academia.edu/36652643/Mumbai_Transportation_System_Transformation
http://www.diva-portal.org/smash/get/diva2:584736/FULLTEXT01.pdf
https://udri.org/wp-content/uploads/Mumbai%20Reader/MR%2010/17%20Sudhir%20 Badami%20-%20Setting%20the%20Right%20Priorities%20for%20Mumbai%20Transportation.pdf
https://www.researchgate.net/publication/370858800_Last_Mile_Connectivity_in_the_ Indian_Scenario_A_literary_review
https://www.orfonline.org/research/a-proposed-roadmap-to-enhance-last-mile-connectivity-in-india/
https://urbz.net/articles/mumbais-last-mile-challenge
http://pdf.wri.org/sustainable_urban_transport_india.pdf
https://www.academia.edu/14343153/Last_Mile_Connectivity_For_Efficient_Public_ Transportation_Systems
https://www.niua.org/tod/todfisc/book.php?book=1§ion=4
http://shodhbhagirathi.iitr.ac.in:8081/jspui/image/pdf/web/viewer.html?file=/jspui/bitstream/123456789/13933/1/NAVNEET%20SINGH%20RAJPUT.pdf
I Hussain Lakdawala I Sem IX - X I Design Dissertation I Rizvi 110
For Mapping:
https://dpremarks.mcgm.gov.in/dp2034/
https://www.google.com/maps/place/Andheri/@19.1208373,72.8437413,199m/data=!3m1!1e3!4m6!3m5!1s0x3be7c9d20e8766d9:0x516e9a11b7586888!8m2!3d19.1198242!4 d72.846531!16s%2Fm%2F0hnbzbm!5m1!1e4?entry=ttu
https://www.google.com/maps/place/Ghatkopar+railway+station/@19.0857348,72.9064308,797m/data=!3m2!1e3!4b1!4m6!3m5!1s0x3be7c750e3f91cc7:0x56f756d2a4e73156!8m2!3d19.0857297!4d72.9090057!16s%2Fm%2F0hgq0k4!5m1!1e4?entry=ttu
https://www.google.com/maps/place/Virar/@19.4547613,72.8094192,795m/data=!3m2!1e3!4b1!4m6!3m5!1s0x3be7a9844efb9ba9:0x23c0bfbf325618cf!8m2!3d19.454756 3!4d72.8119941!16s%2Fm%2F0hq_658!5m1!1e4?entry=ttu
https://www.mid-day.com/mumbai/mumbai-news/article/mumbai-how-crowding-atbandra-and-kurla-stations-can-be-fixed-23250781#:~:text=According%20to%20a%20 survey%20conducted,WR%20after%20Churchgate%20and%20Andheri
https://timesofindia.indiatimes.com/city/mumbai/daily-commuters-at-andheri-stationup-7-lakh-since-2013/articleshow/71344232.cms
https://mumbaimirror.indiatimes.com/mumbai/other/crs-mission-ghatkopar/articleshow/71787835.cms#:~:text=Ghatkopar%20witnesses%20a%20daily%20footfall,records%20around%206%20lakh%20footfalls
For Case studies:
https://www.archdaily.com/356982/transbay-transit-center-in-san-francisco-pelliclarke-pelli
https://www.arch2o.com/transbay-transit-center-pelli-clarke-pelli-architects/arch2o-transbay-transit-center-pelli-clarke-pelli-architects-13/
https://www.anaheim.net/DocumentCenter/View/986/Capital-Program-Update-Presentation--August-2013-PDF?bidId
https://www.archdaily.com/615466/anaheim-regional-transportation-intermodal-center-hok
I Hussain Lakdawala I Sem IX - X I Design Dissertation I Rizvi 111
13. Designsem X
Site analsysis
Existing site issues
Case studies
Zoning based on function
Reason to construct under-ground transport system
Construction method: Slab and beam method
Master plan
First level plan
Concourse level plan
Platform level plan
Sections
E.V.S
Exploded axonometric view
Construction details
Services plan
DD Panels
I Hussain Lakdawala I Sem IX - X I Design Dissertation I Rizvi 112
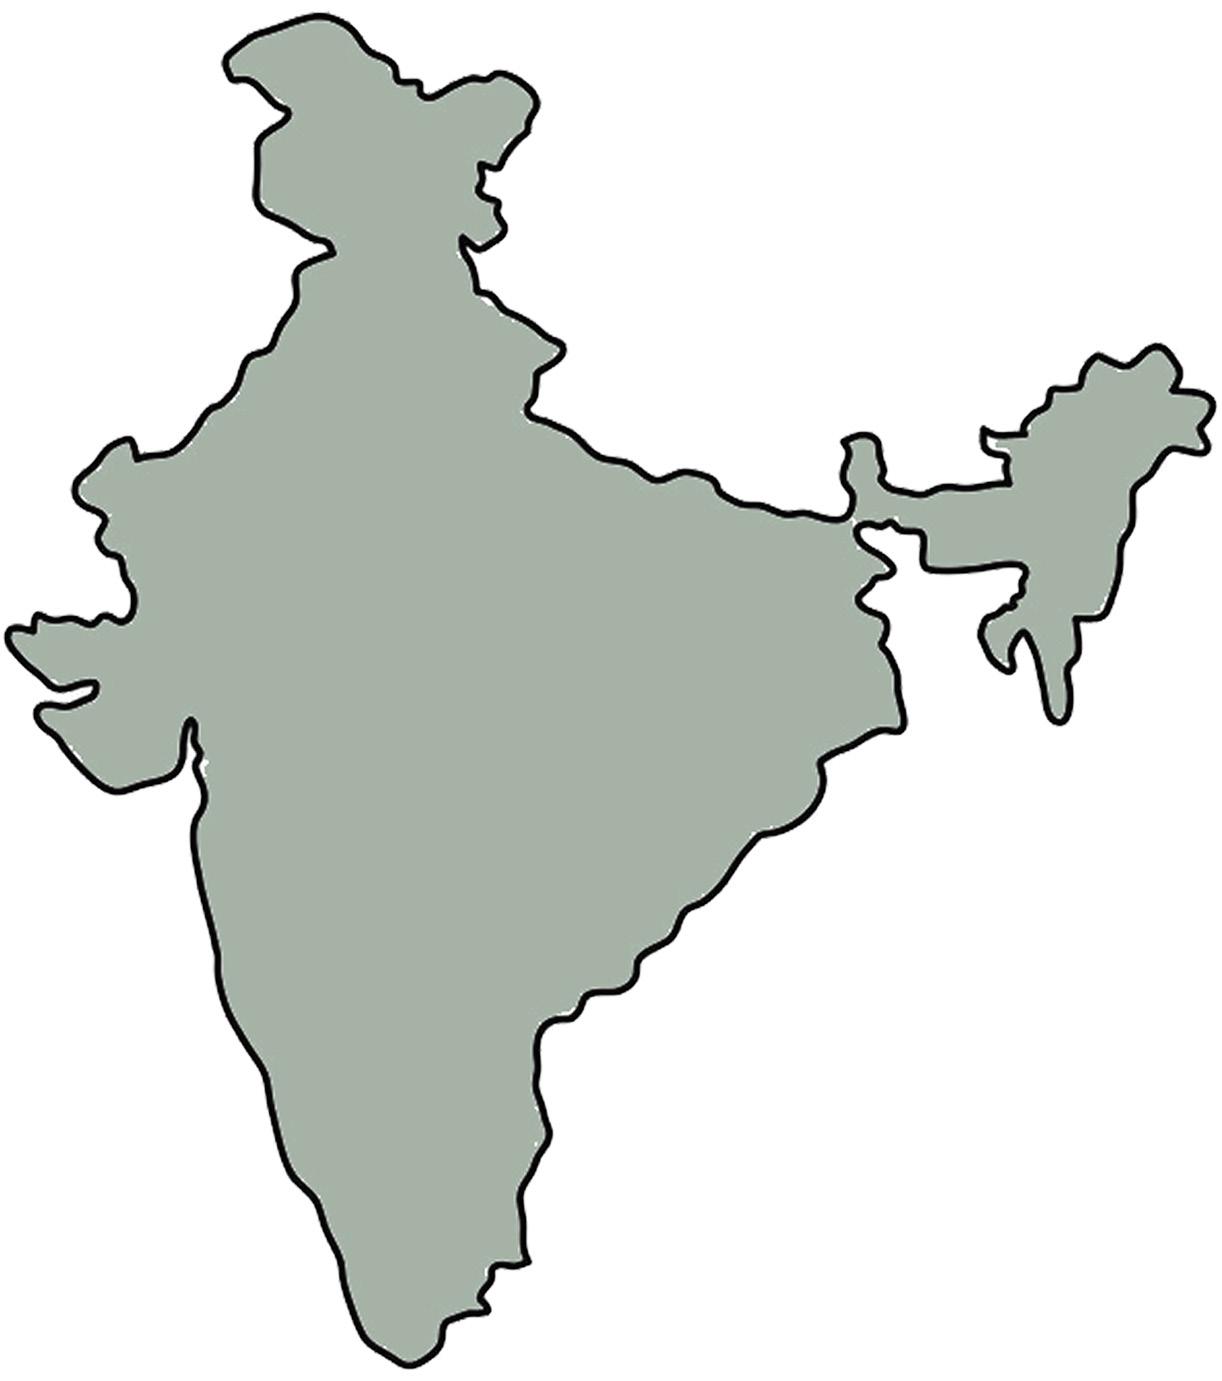
LOCATION: Virar is a coastal city taluka Vasai and district of Palghar, India. It is clubbed into Vasai-Virar city, administered by Vasai-Virar Municipal Corporation. It lies in south part of Palghar District in Vasai Taluka and north to the city of Mumbai. It is an important part of Palghar District because Palghar is the outermost part of northern side of Mumbai Metropolitan Region.
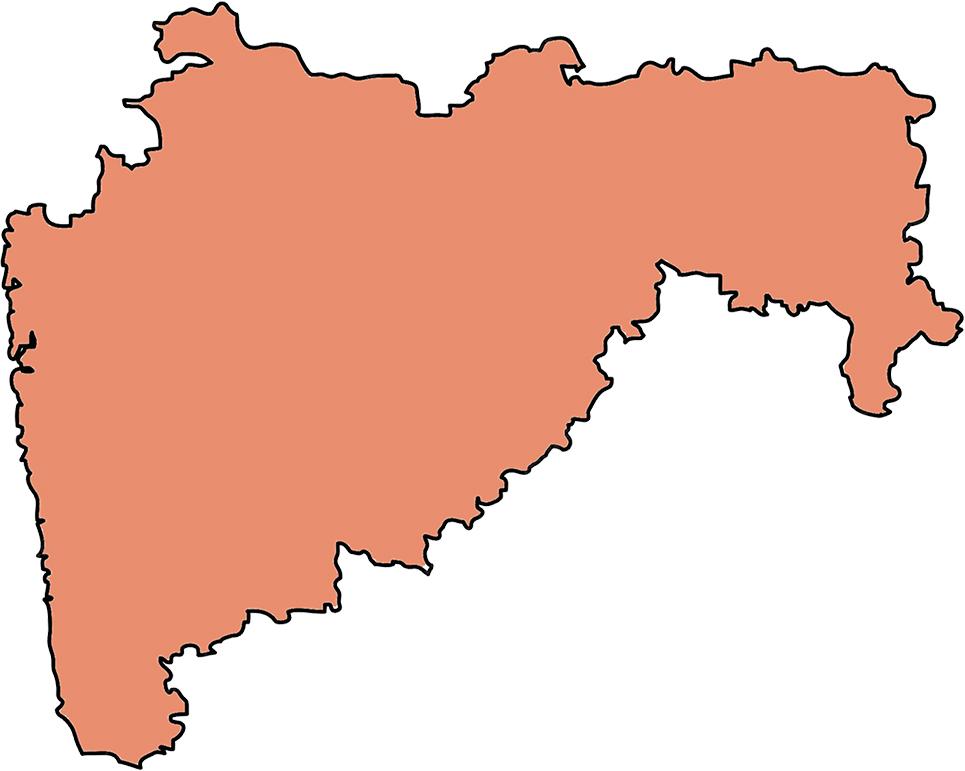
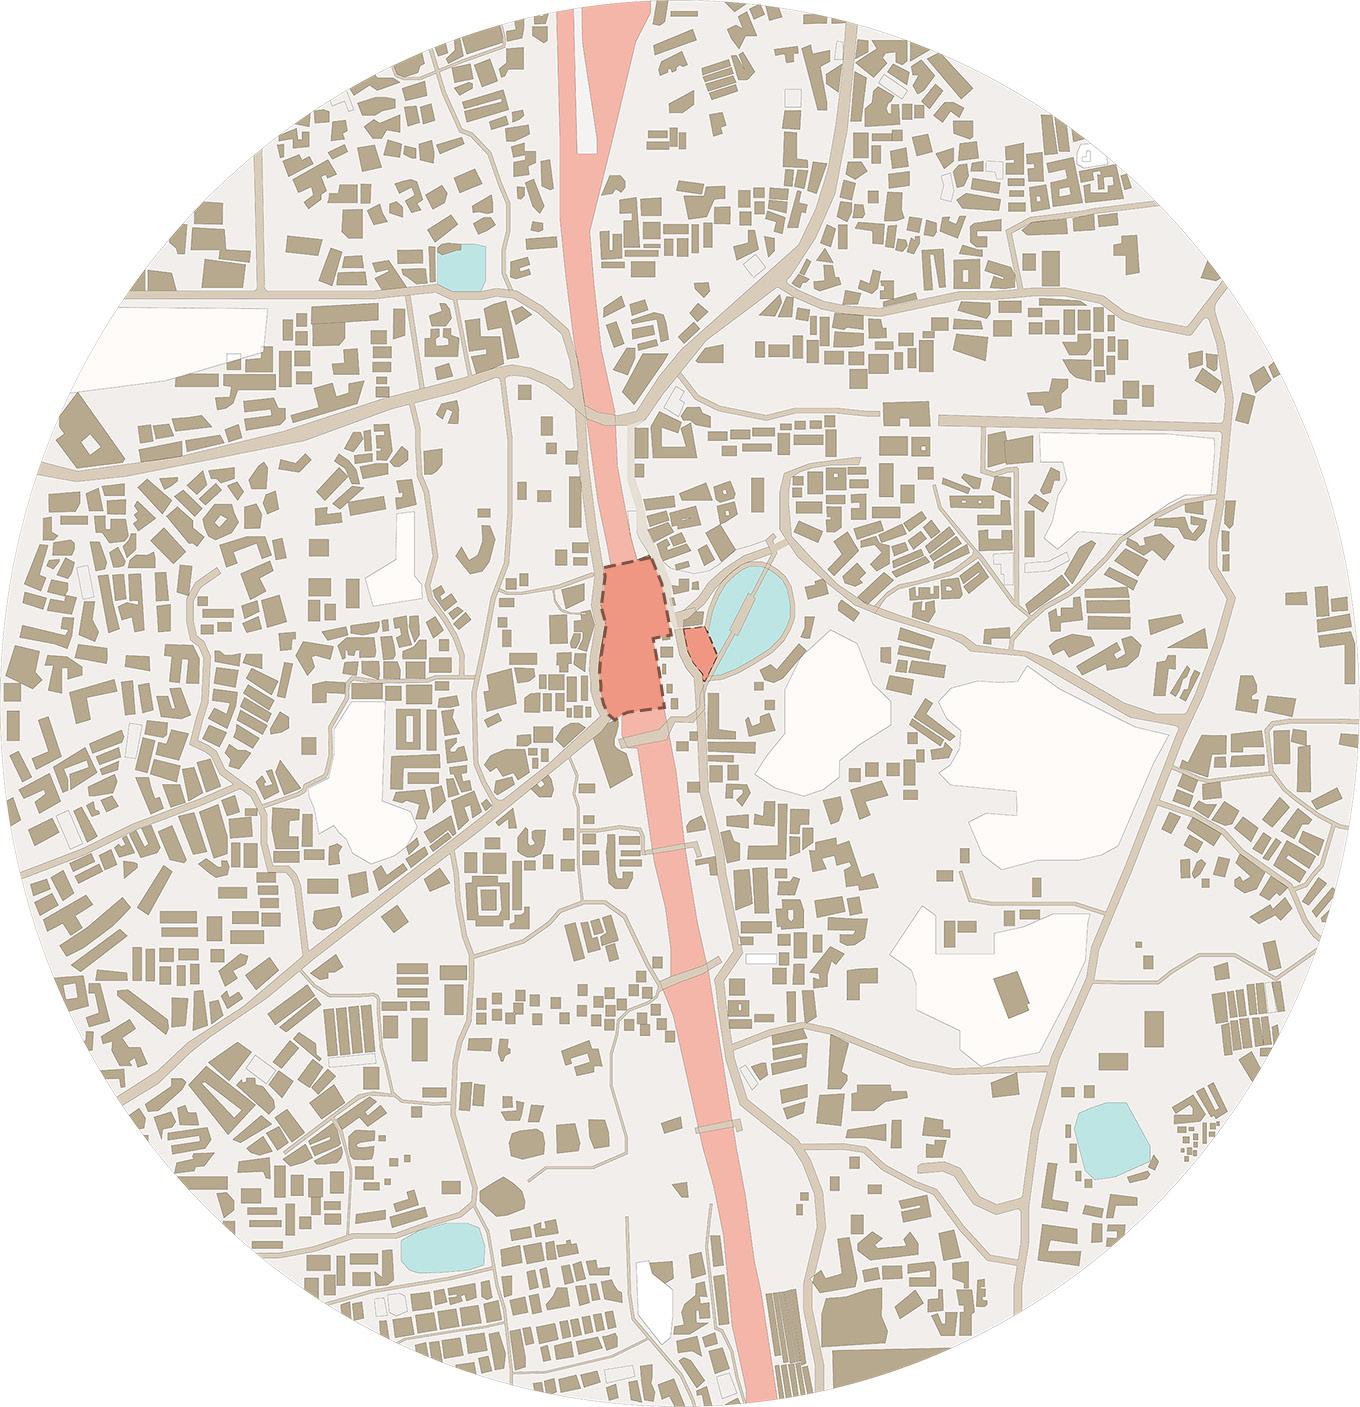
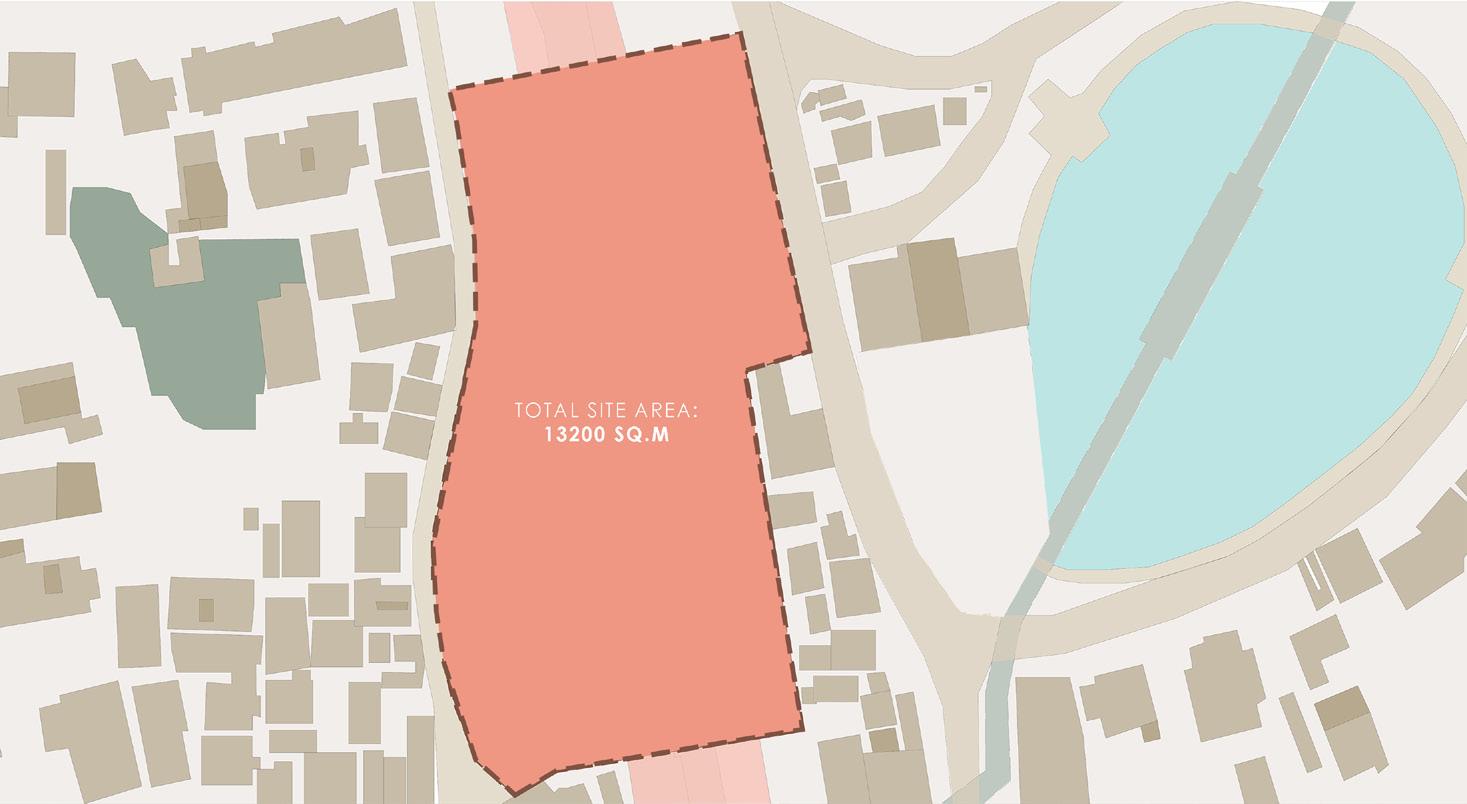
SITE: Virar railway station is one of the prominent railway stations on the Western Line of Mumbai Suburban Railway due to being the station on the line with high frequency of local-train transit for both ends, Palghar (Dahanu) as well as Churchgate (South Mumbai).Due to its better connectivity to the main city and the potential for business makes this place an important hub for commerce and development.
I Hussain Lakdawala I Sem IX - X I Design Dissertation I Rizvi 113
SITE ANALYSIS
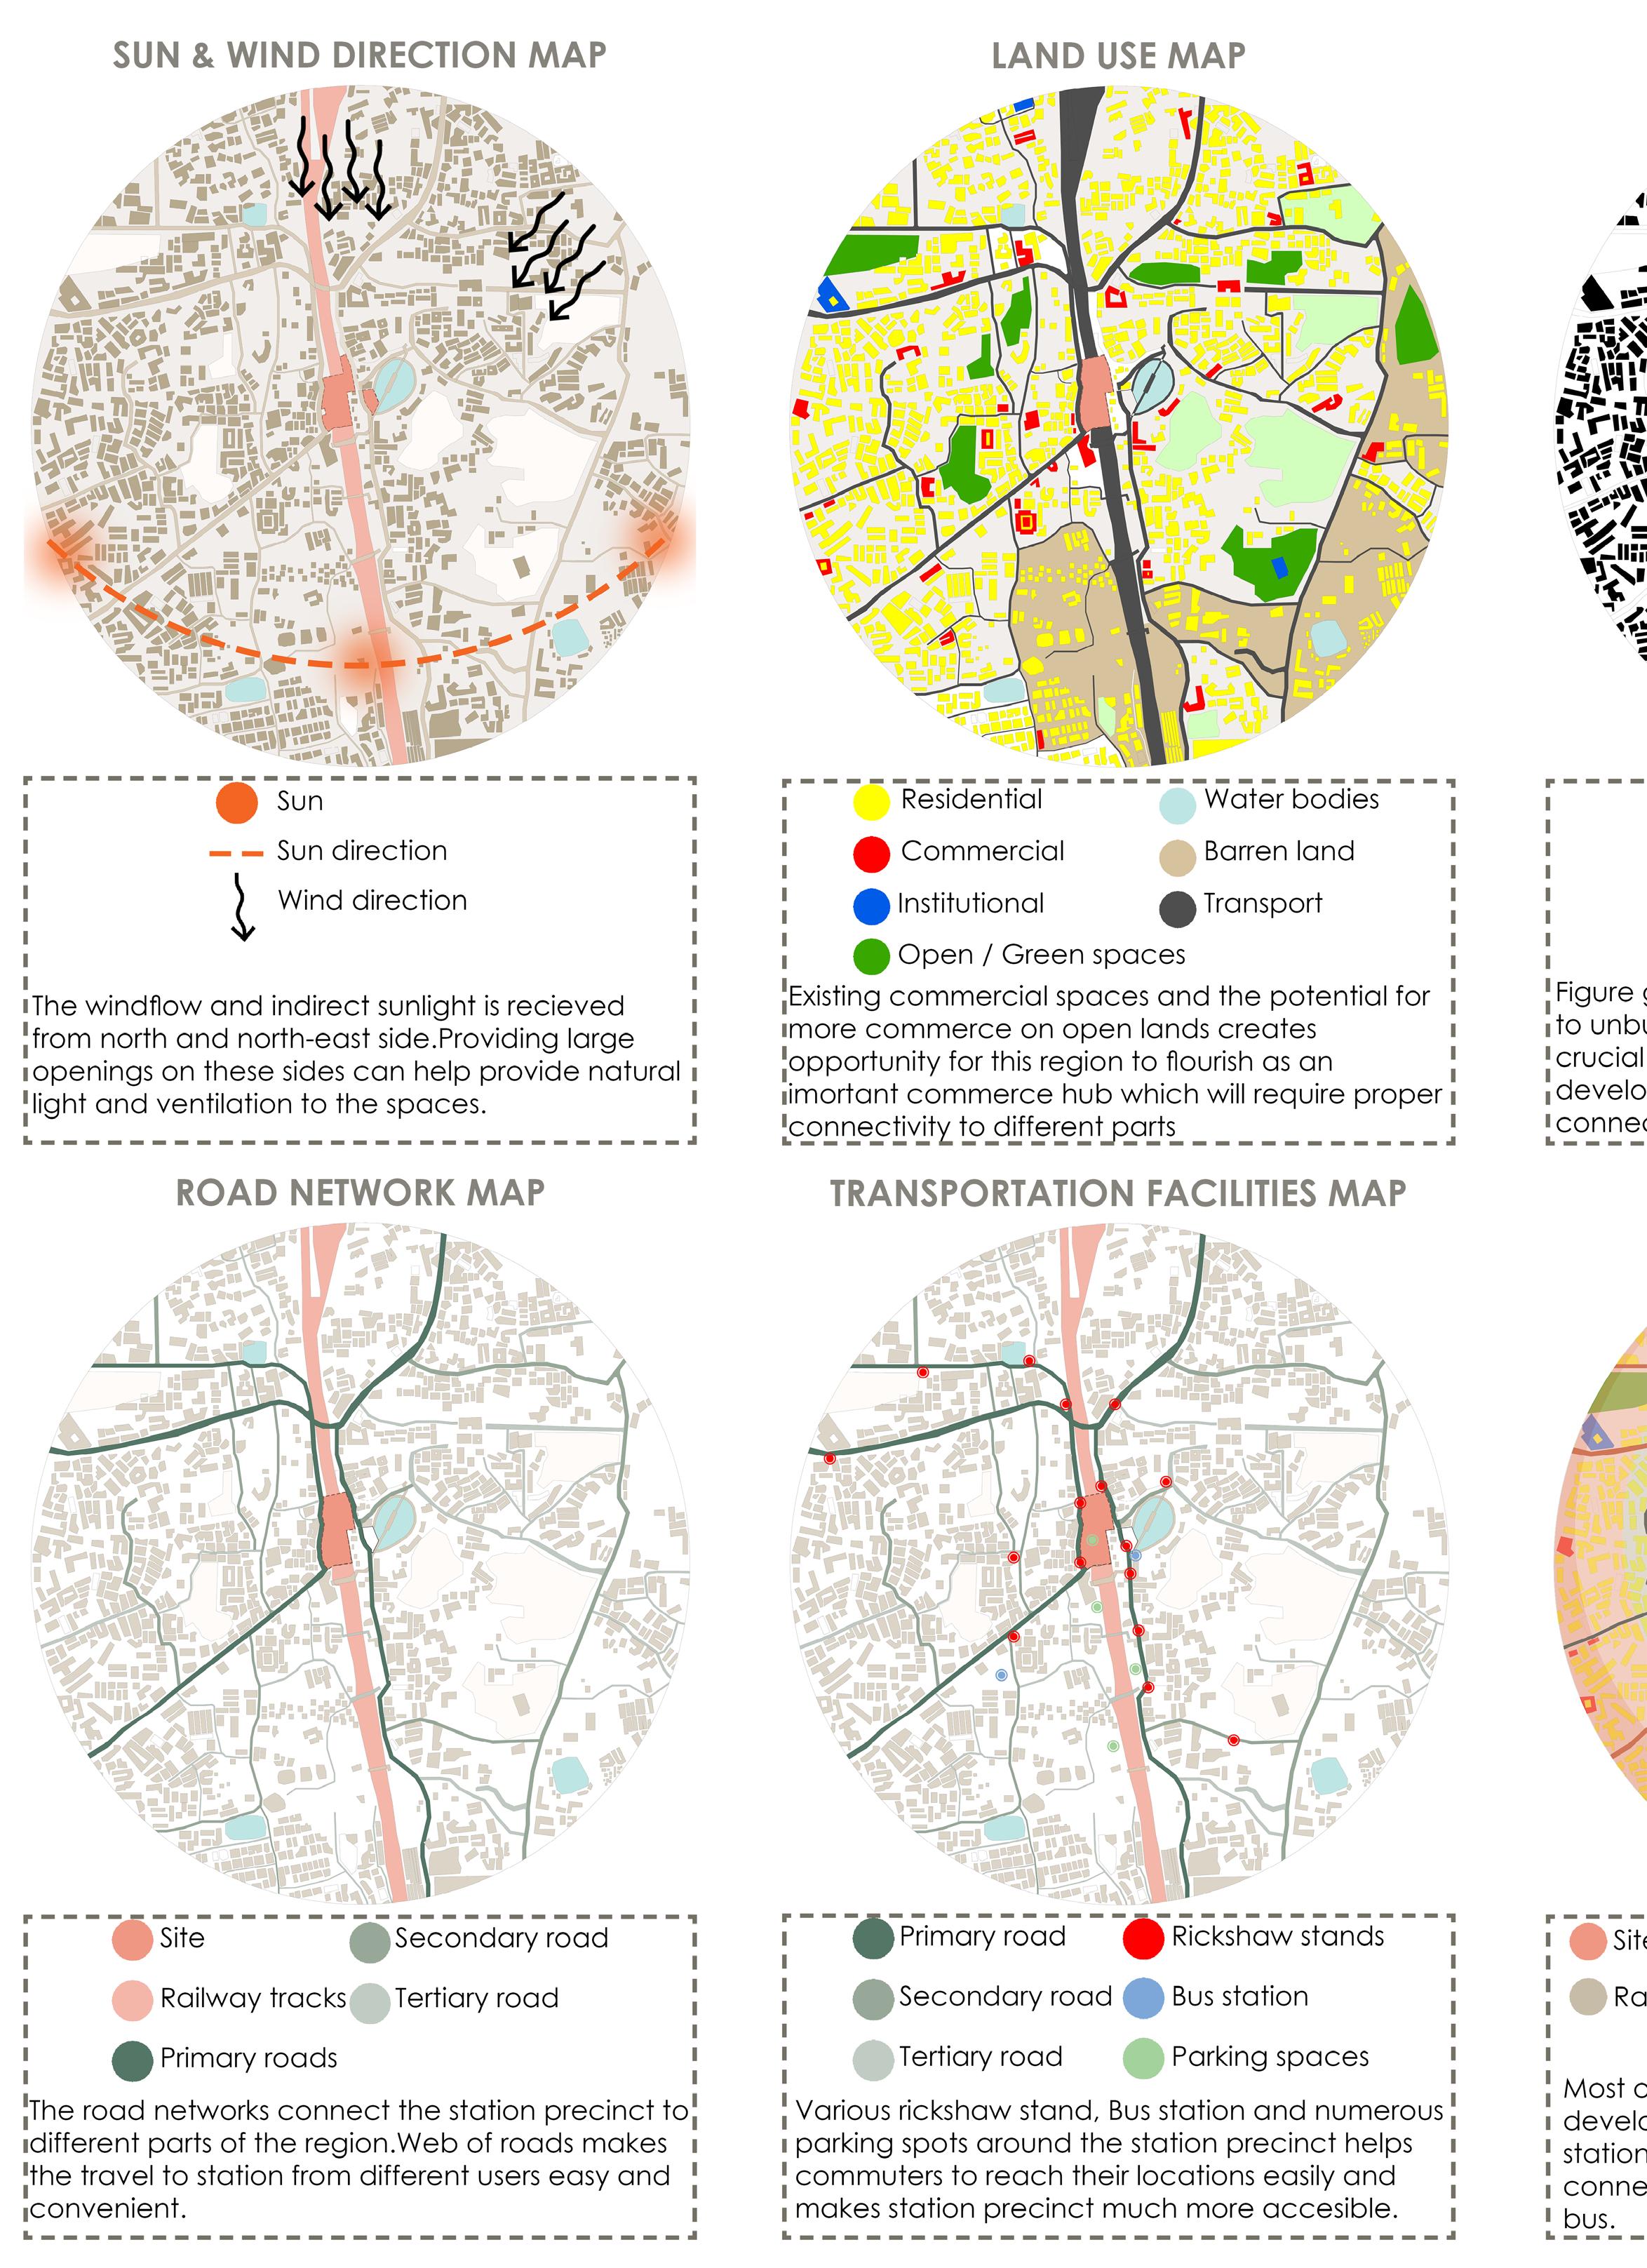
I Hussain Lakdawala I Sem IX - X I Design Dissertation I Rizvi 114

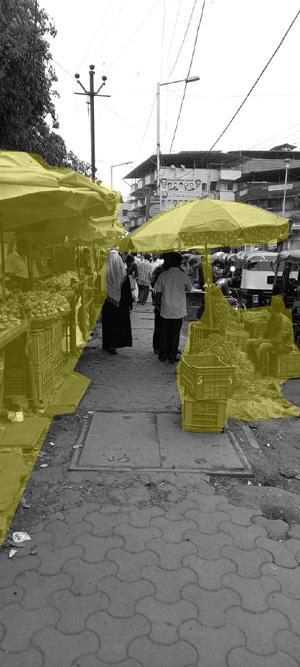
Footpath is occupied by the umbrellas of the stalls which makes it difficult for the pedestrian to walk on thefootpath.
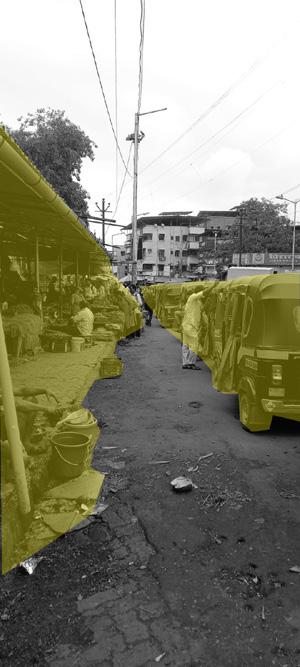
Narrow space left between the market and rickshaw stands for the people to walk through the roads.
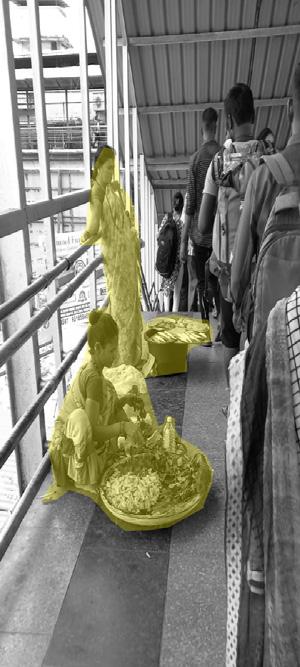
Encroachment on the railway footover bridge by the local hawkers hinders the pedestrian flow.
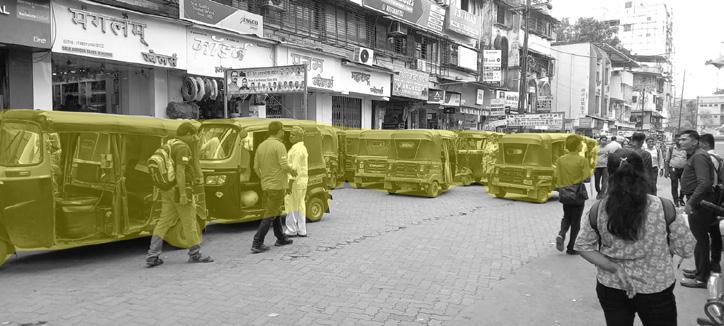
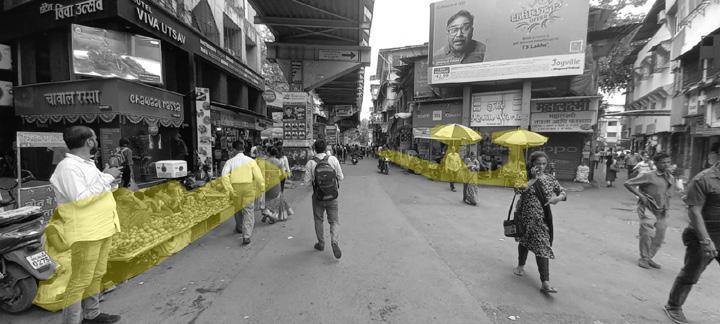
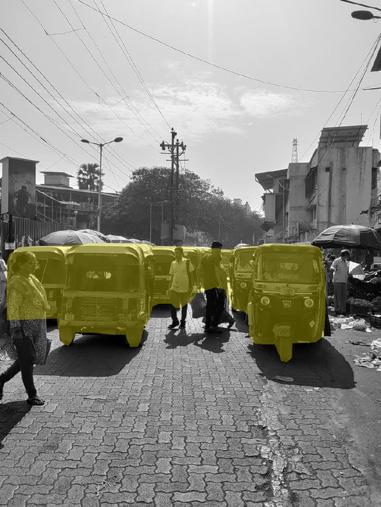
Improper flow of rickshaw near station area created traffic congestion.
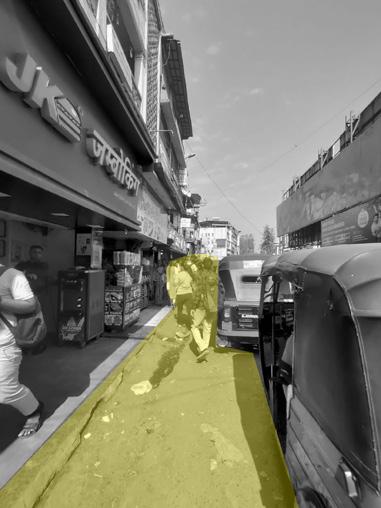
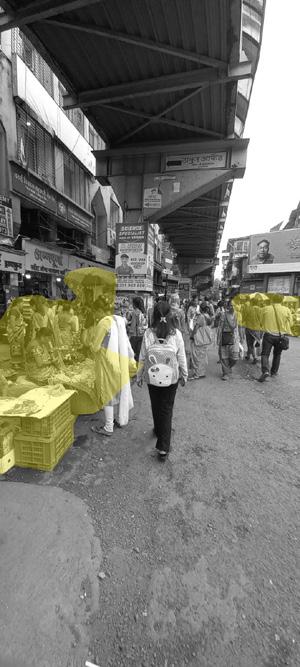
Encroachment on the railway footover bridge by the local hawkers hinders the pedestrian flow.
Numerous rickshaw stands for different locations creates chaos and traffic congestion on smaller roads.
Informal market setups near the exit of the railway station creates a lot of hinderance in the flow of pedestrian and vehicular movement.
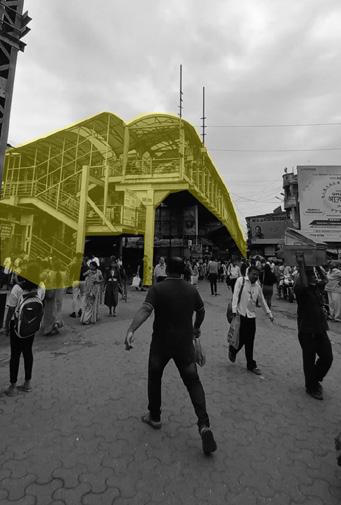
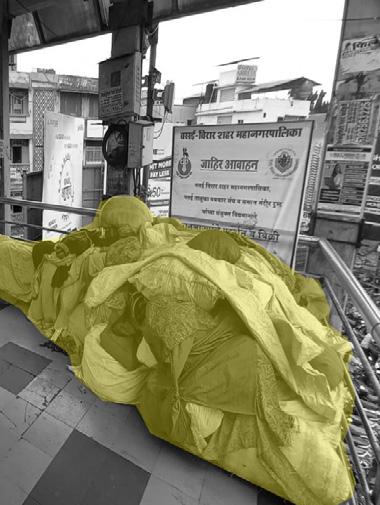
Informal settlement on the extended skywalk discourages people to use this facility and use the main road instead.
Not enough space for pedestrian to walk on the footpath due to shop enchroachment and rickshaw stands.
Small offset near the railway bridge is used by hawkers and vendors to setup their shops
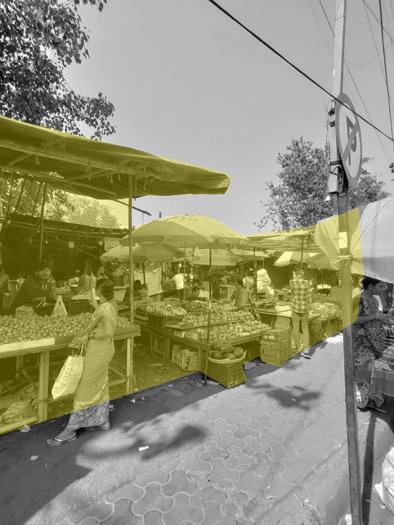
I Hussain Lakdawala I Sem IX - X I Design Dissertation I Rizvi 115 EXISTING SITE ISSUES
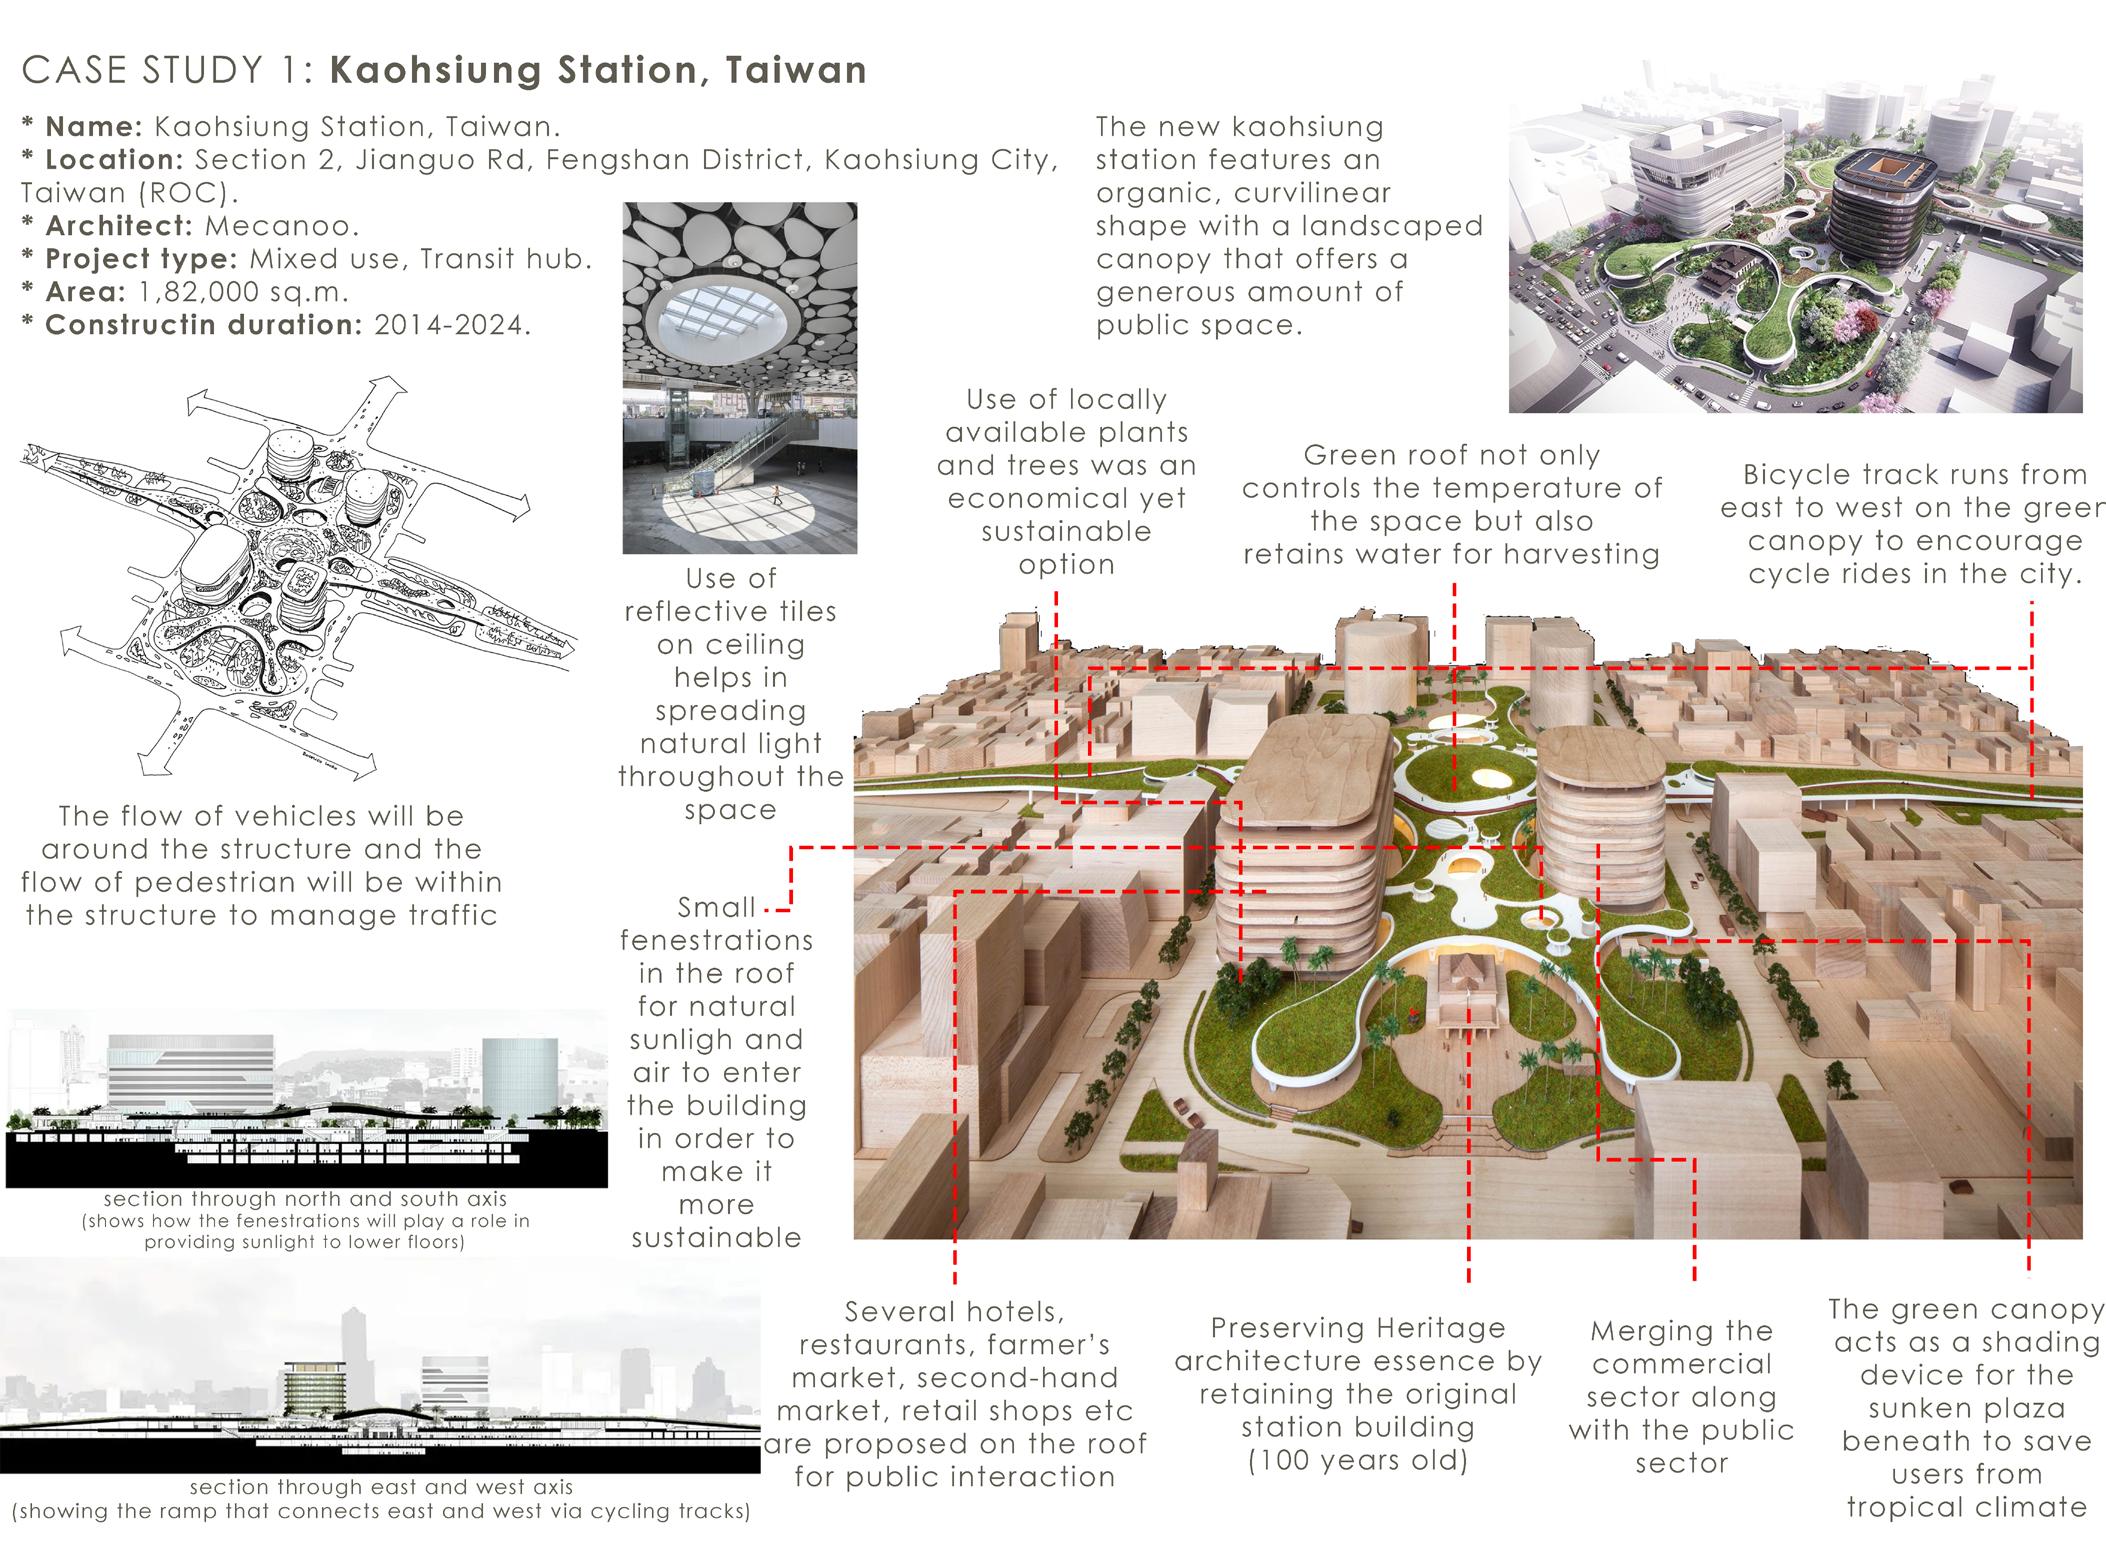
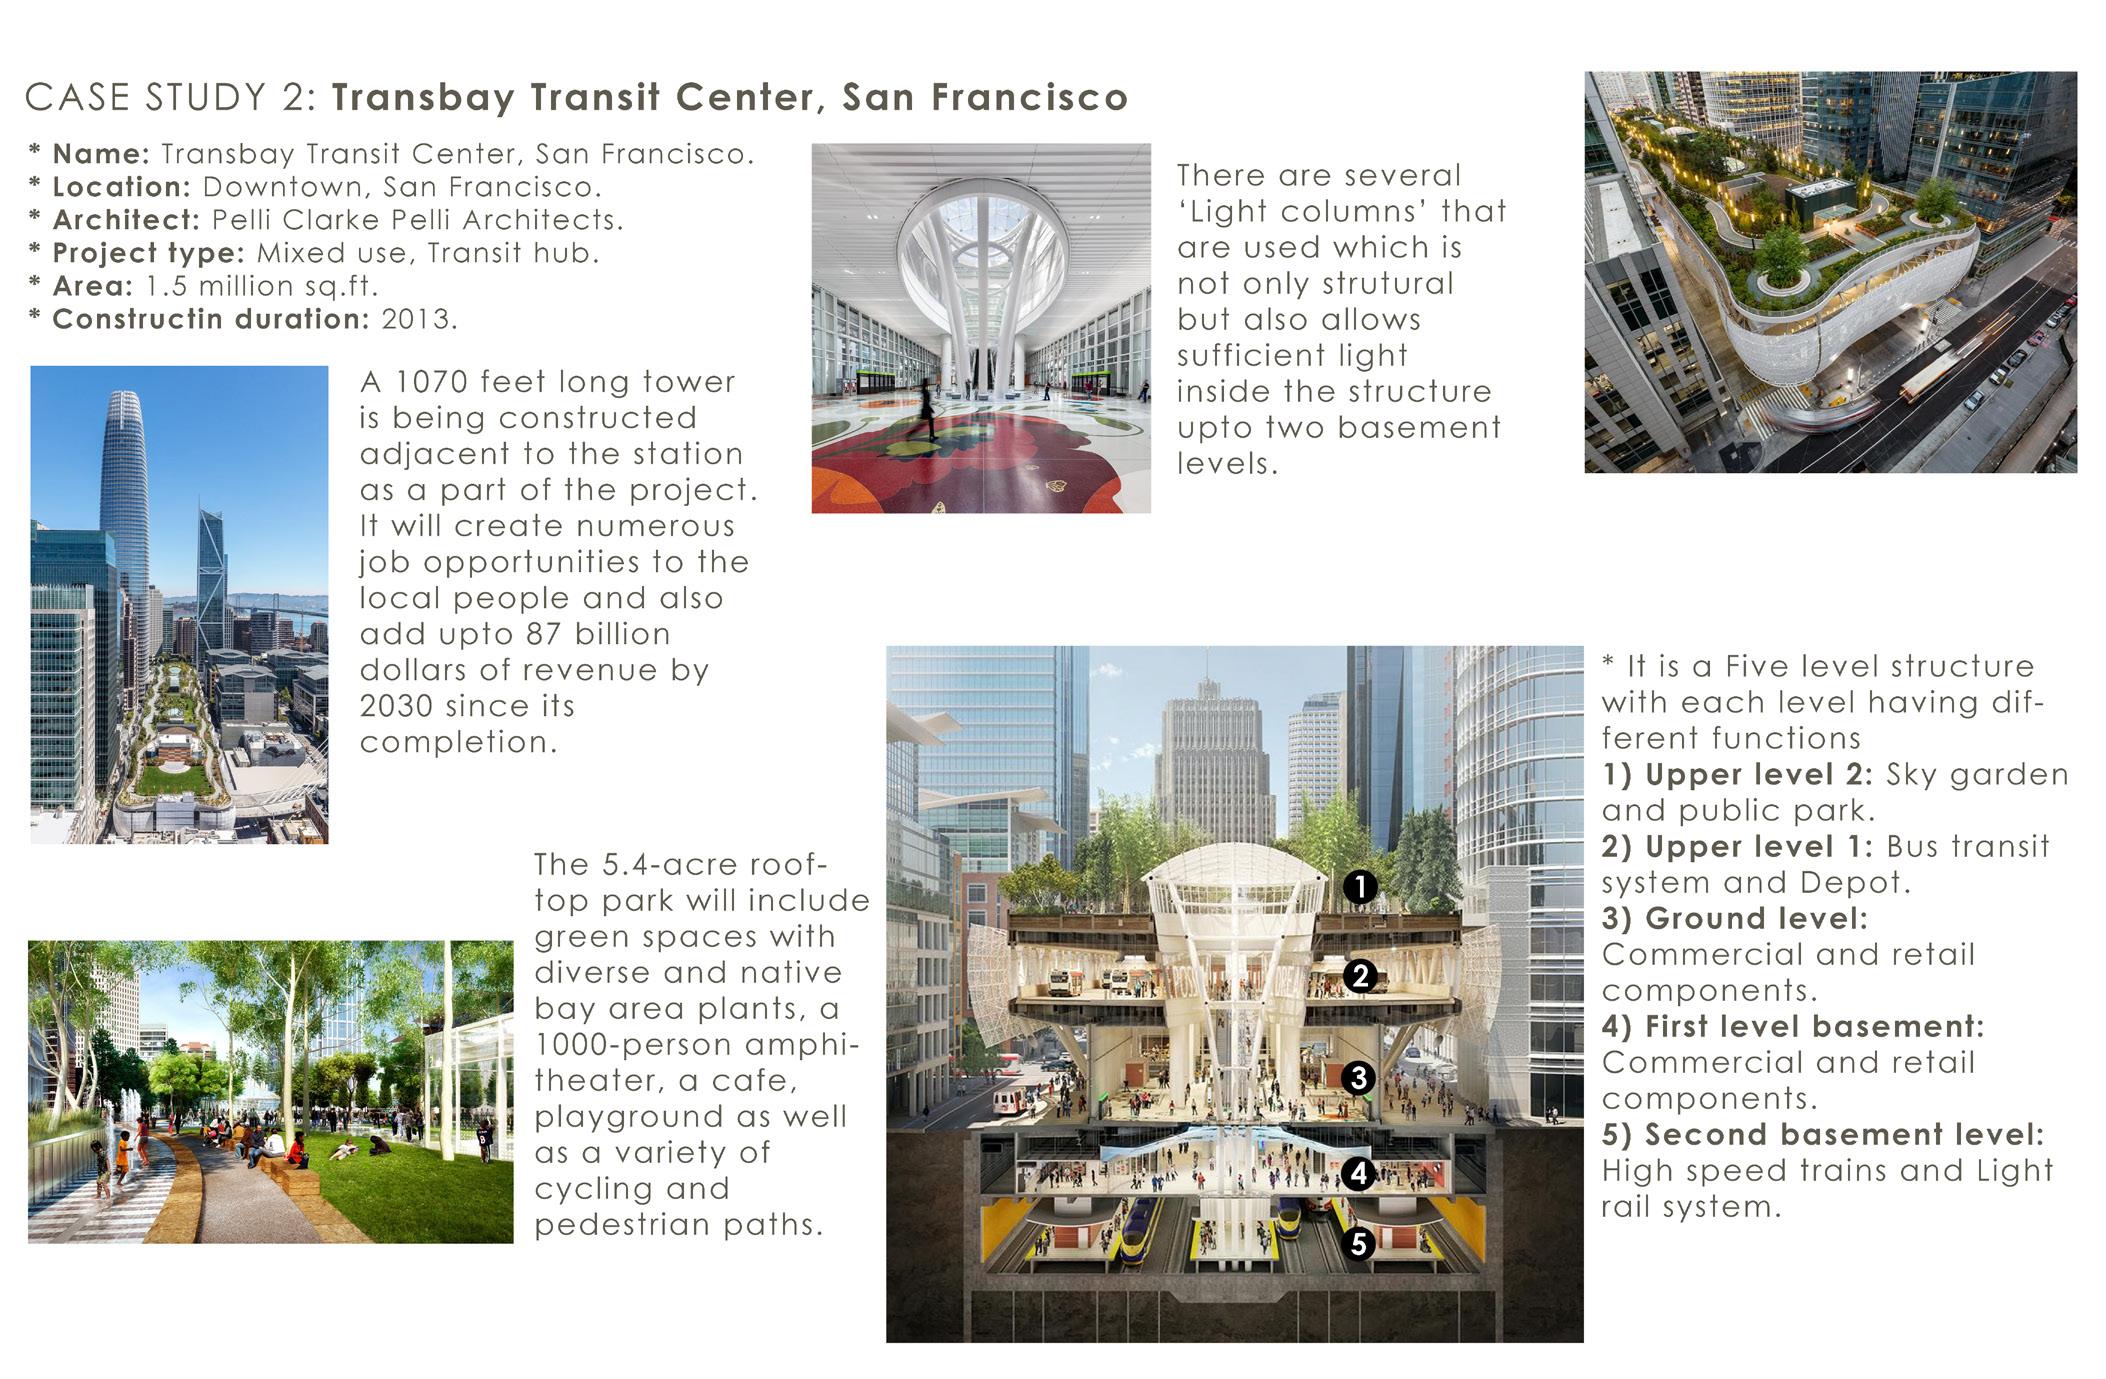
I Hussain Lakdawala I Sem IX - X I Design Dissertation I Rizvi 116 CASE STUDIES
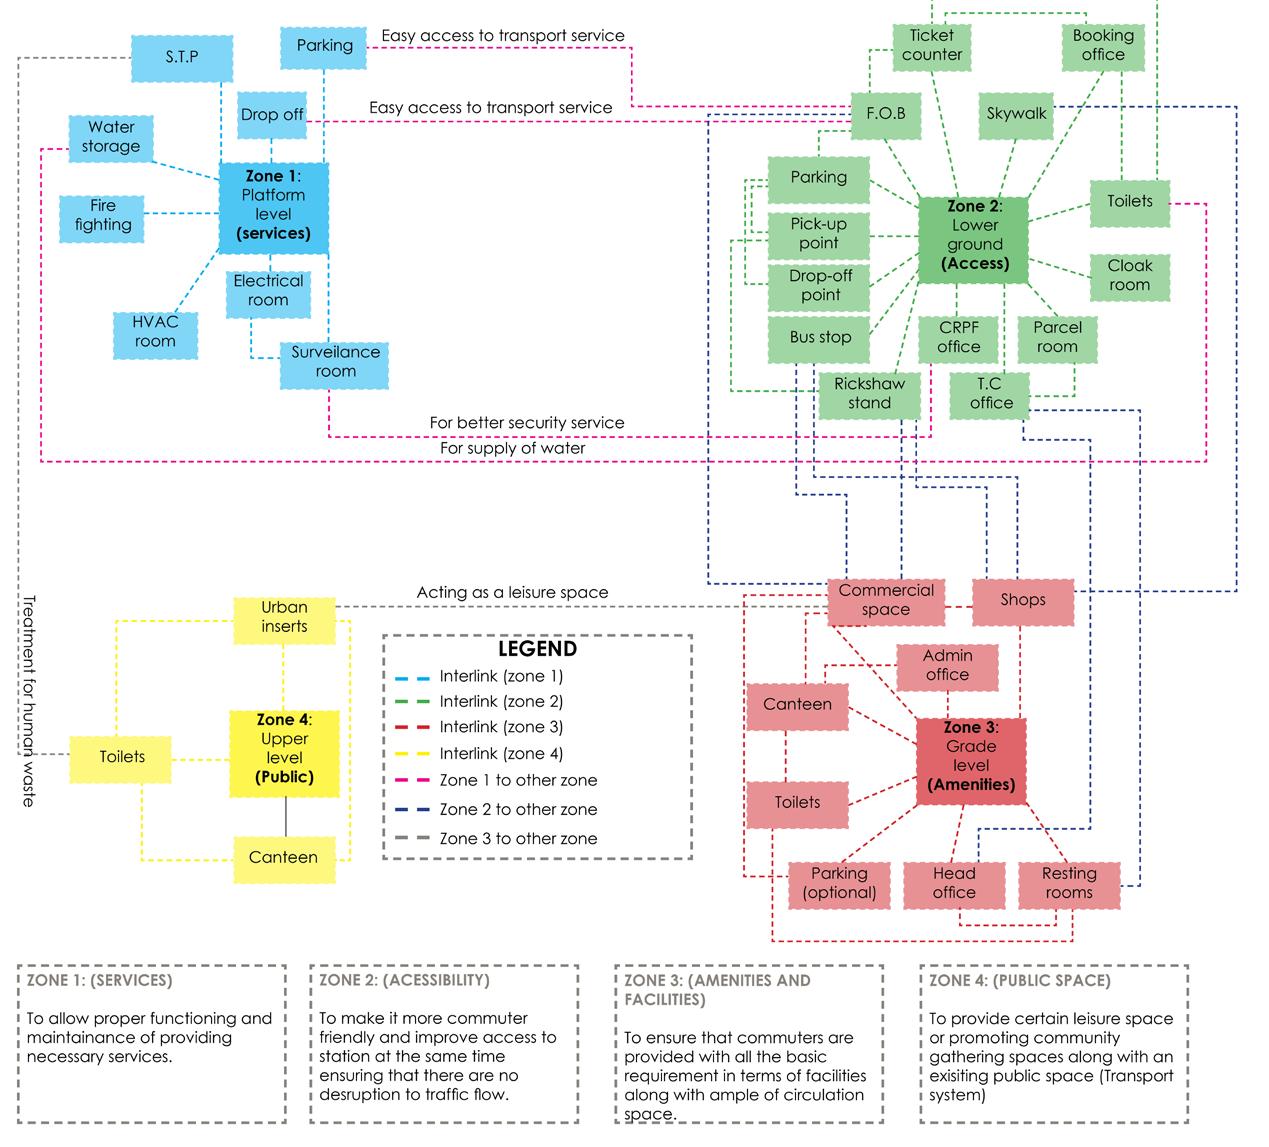


CONCEPTS


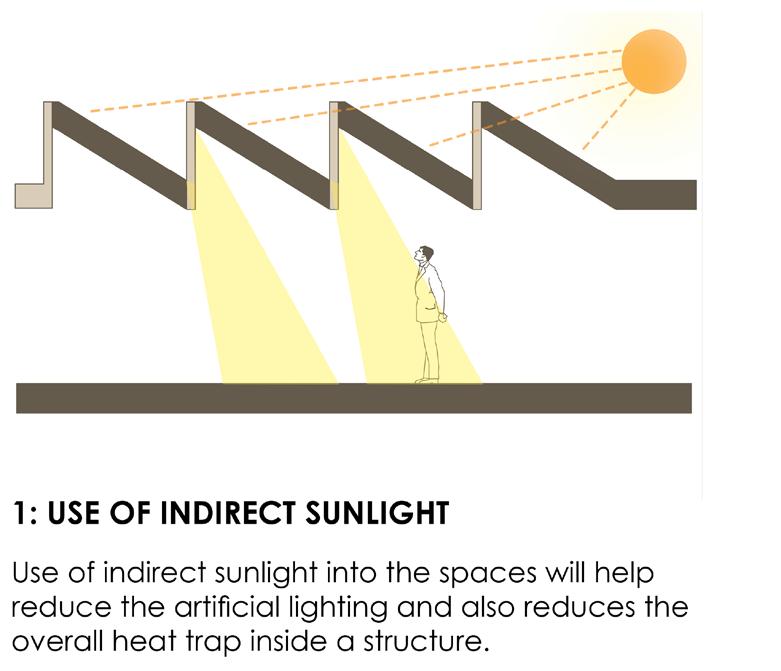


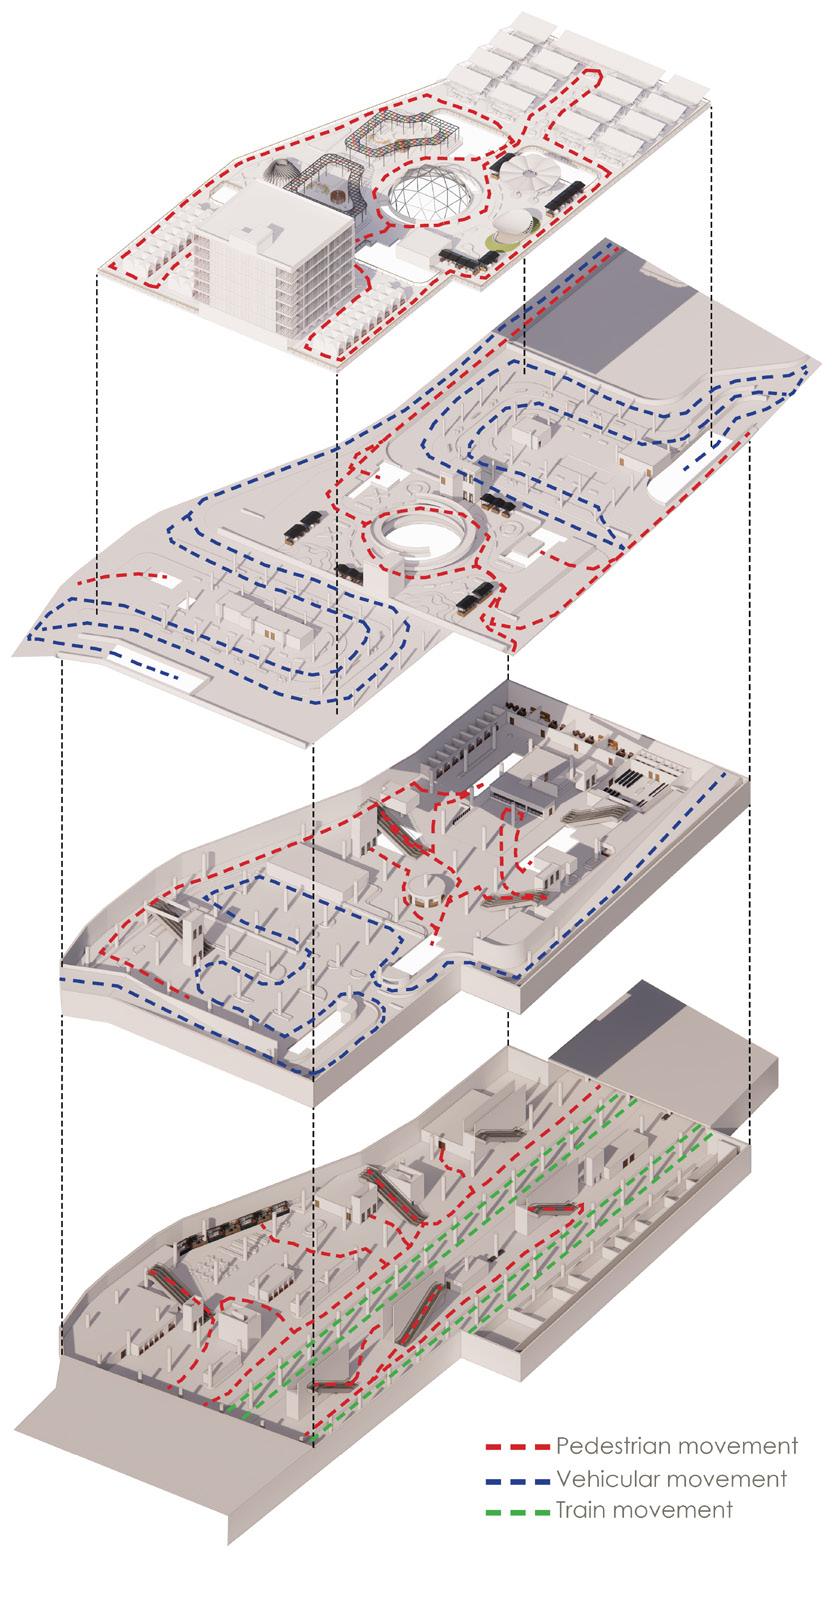

CIRCULATION DIAGRAMS
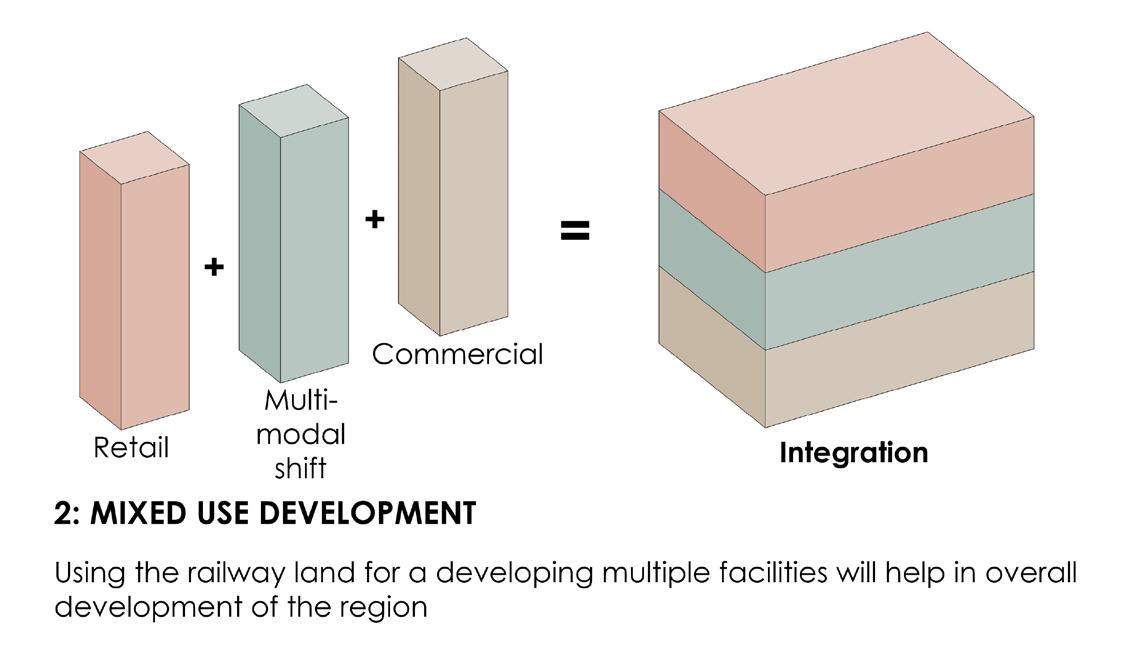
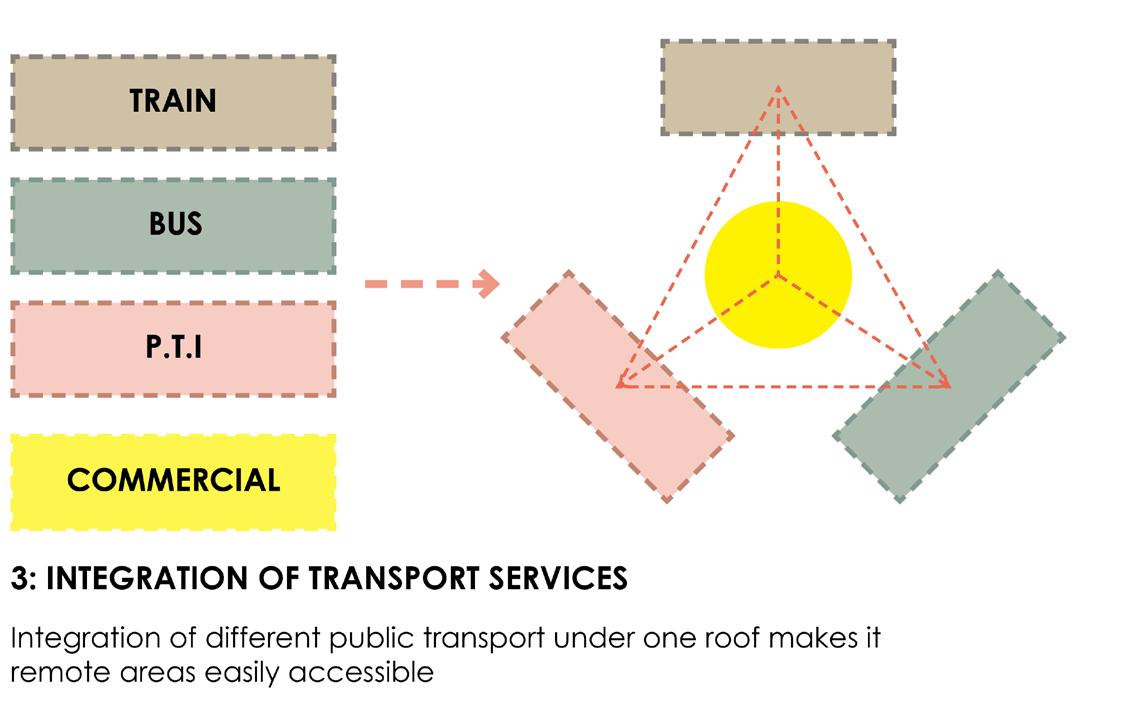

I Hussain Lakdawala I Sem IX - X I Design Dissertation I Rizvi 117 ZONING ACTIVITIES BASED ON FUNCTIONS
REASONS TO CONSTRUCT UNDER-GROUND TRANSPORT SYSTEM
* Need for change in approach in designing towns and transport facilities.
* Make proper use of valuable grade level land.
* Approach to motivate T.O.D module.
* Proper segregation of public transportation facilities and pedestrian movement.
* Encouraging use of public transport by increasing the facilities.
* Eradicating the barrier (railway tracks) between two sides of the same region (to have even development across the region).

Key plan showing the length of underground ramp
* To reduce traffic congestion on grade level
WORKING OF TRAIN TUNNELS
*Made of solid concrete tubes or precast sections.
* Excavation and digging is done via TBM machines (Tunnel Boring machines).
* Aspects to consider before construction 1) Topology, 2) Geology, 3) Ground conditions, 4) Environment, 5) Excavation ease.
* Load on ground: 1) Weight of tunnels, 2) Weight of fast moving trains.

I Hussain Lakdawala I Sem IX - X I Design Dissertation I Rizvi 118
CONSTRUCTION METHOD: SLAB AND BEAM METHOD
( TOP DOWN CONSTRUCTION METHOD)
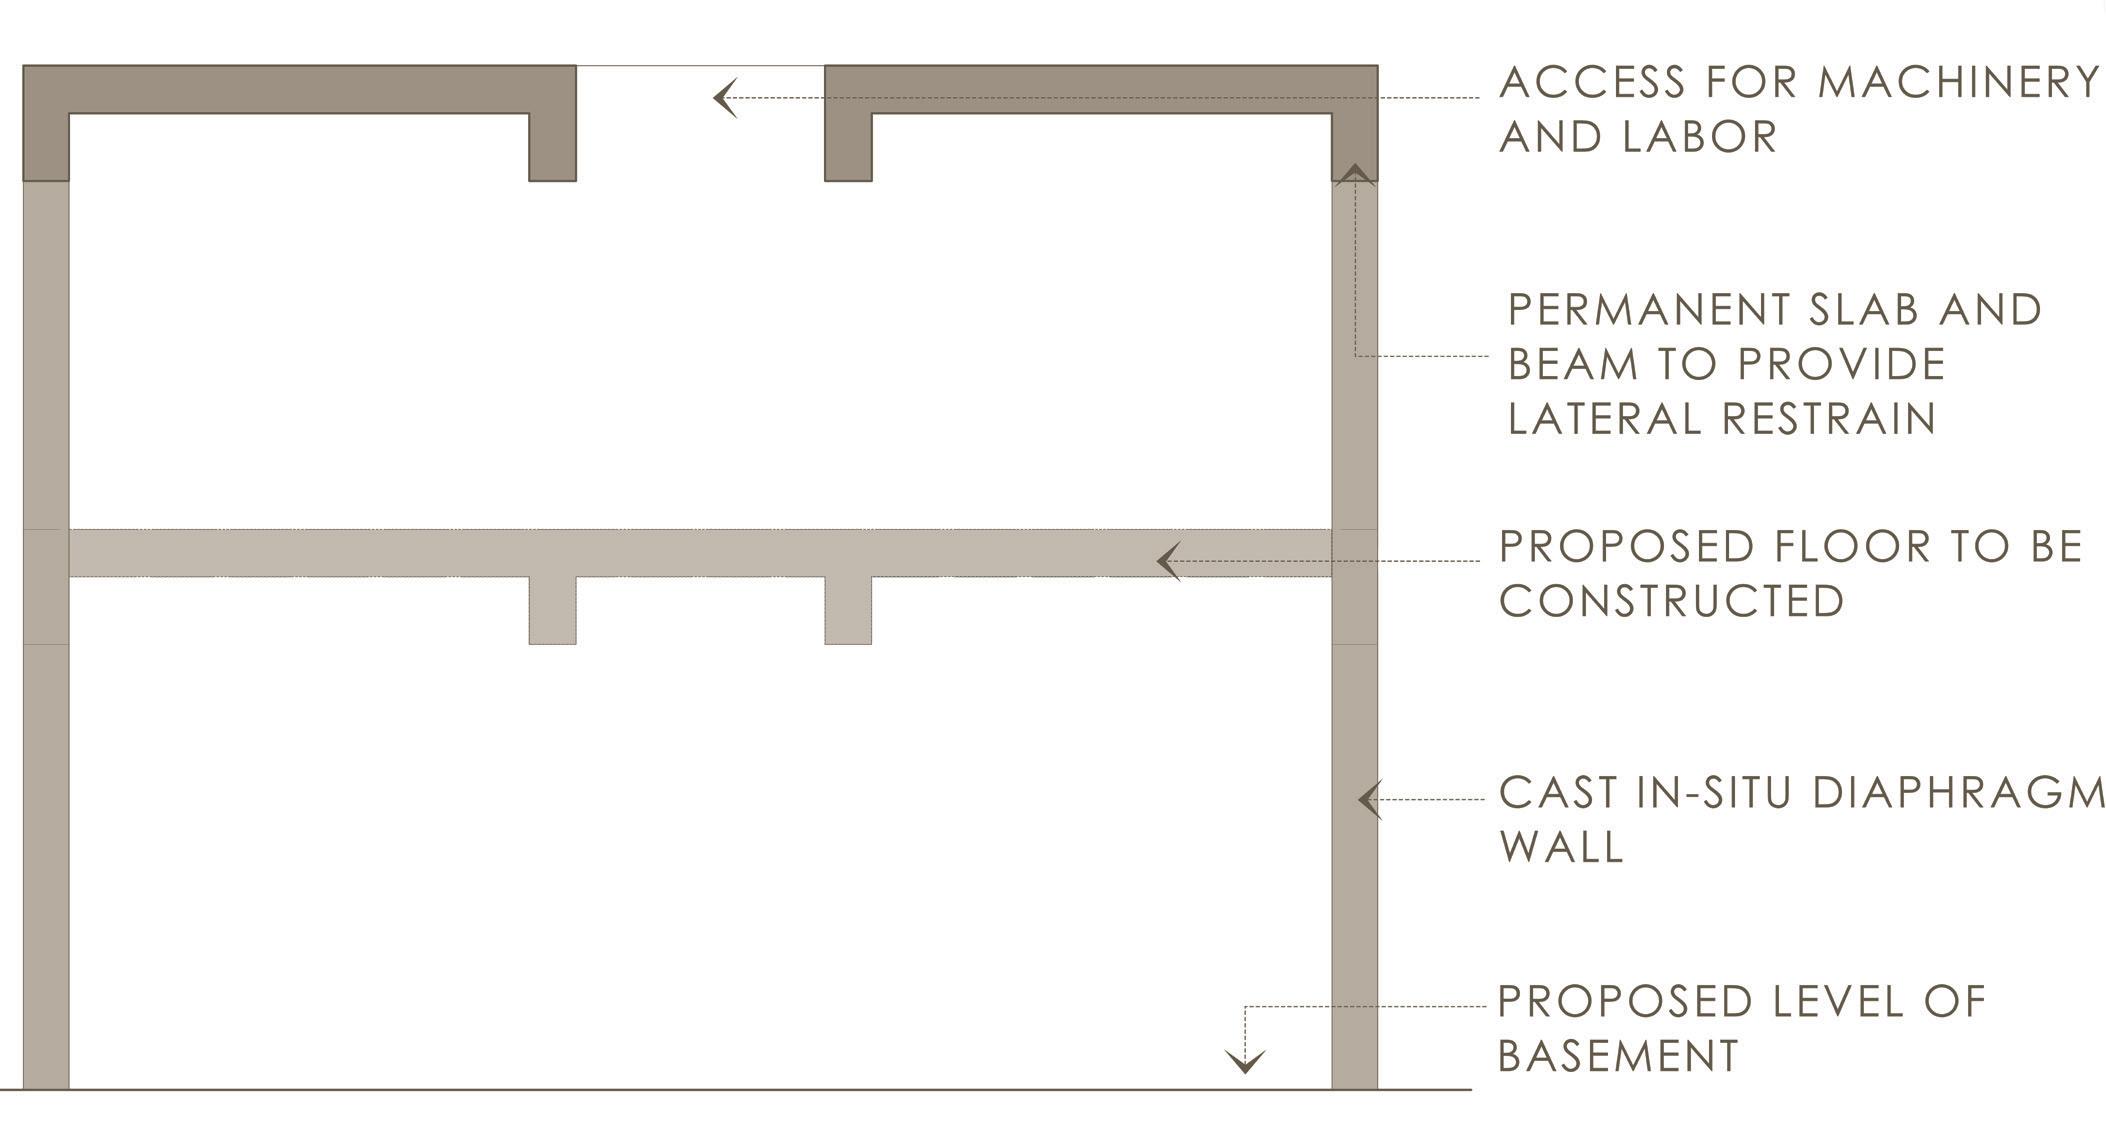
* Top down construction is a construction methodology that allows simultaneous construction of above-ground and below-ground levels.
* It offers several advantages in terms of time efficiency, cost savings, and safety.
* The purpose of this method is to expedite the construction process and maximize the use of space by utilizing the excavation area as the foundation for subsequent construction.
* The permanent station structure walls are built along the excavations boundary from the top to bottom construction.
* Diaphragm wall or bored secant pile wall are used.
* Roof slab is casted first then the furher excavation is carried out.
* Strutting systems are usually the slabs of the structure.
* Such construction systems require high skilled labour.
* The initial cost of construction is comparetively higher than other methods.
* Top-down construction requires lesser width for construction.
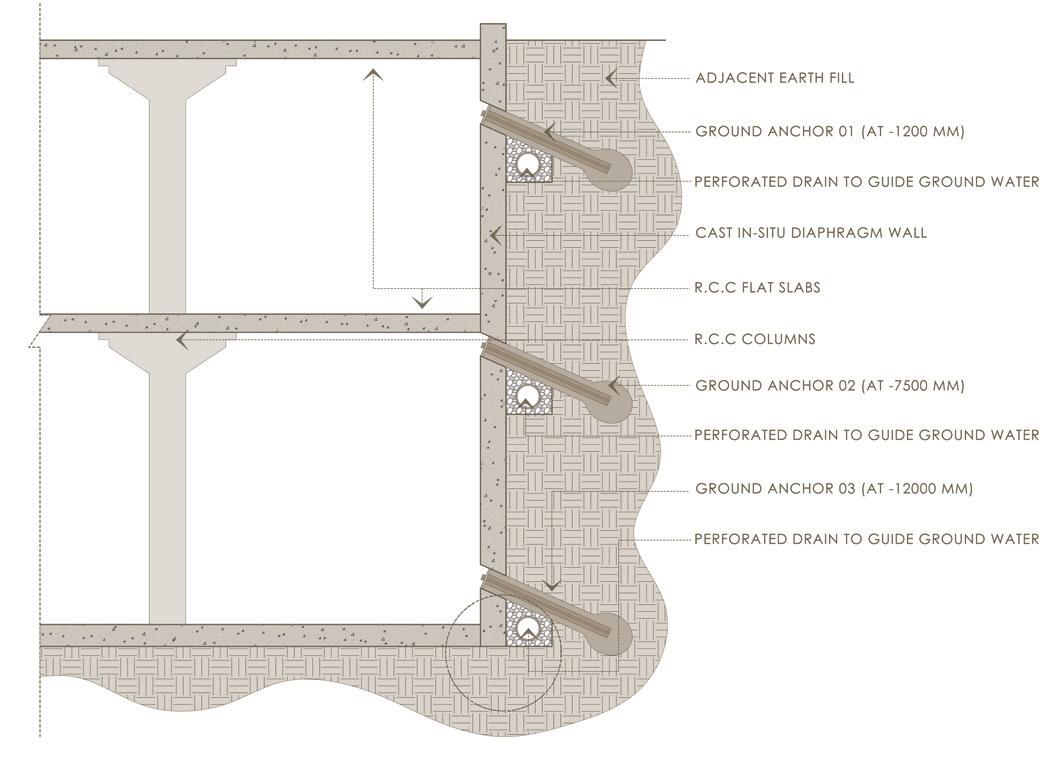
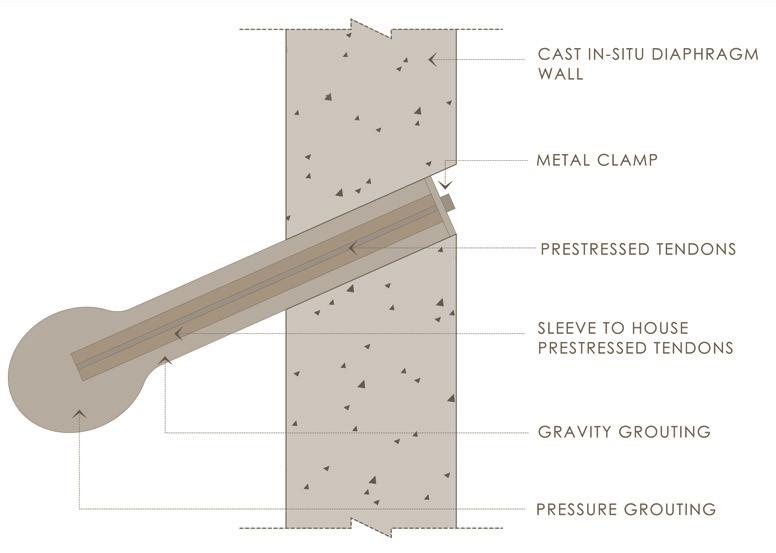
I Hussain Lakdawala I Sem IX - X I Design Dissertation I Rizvi 119
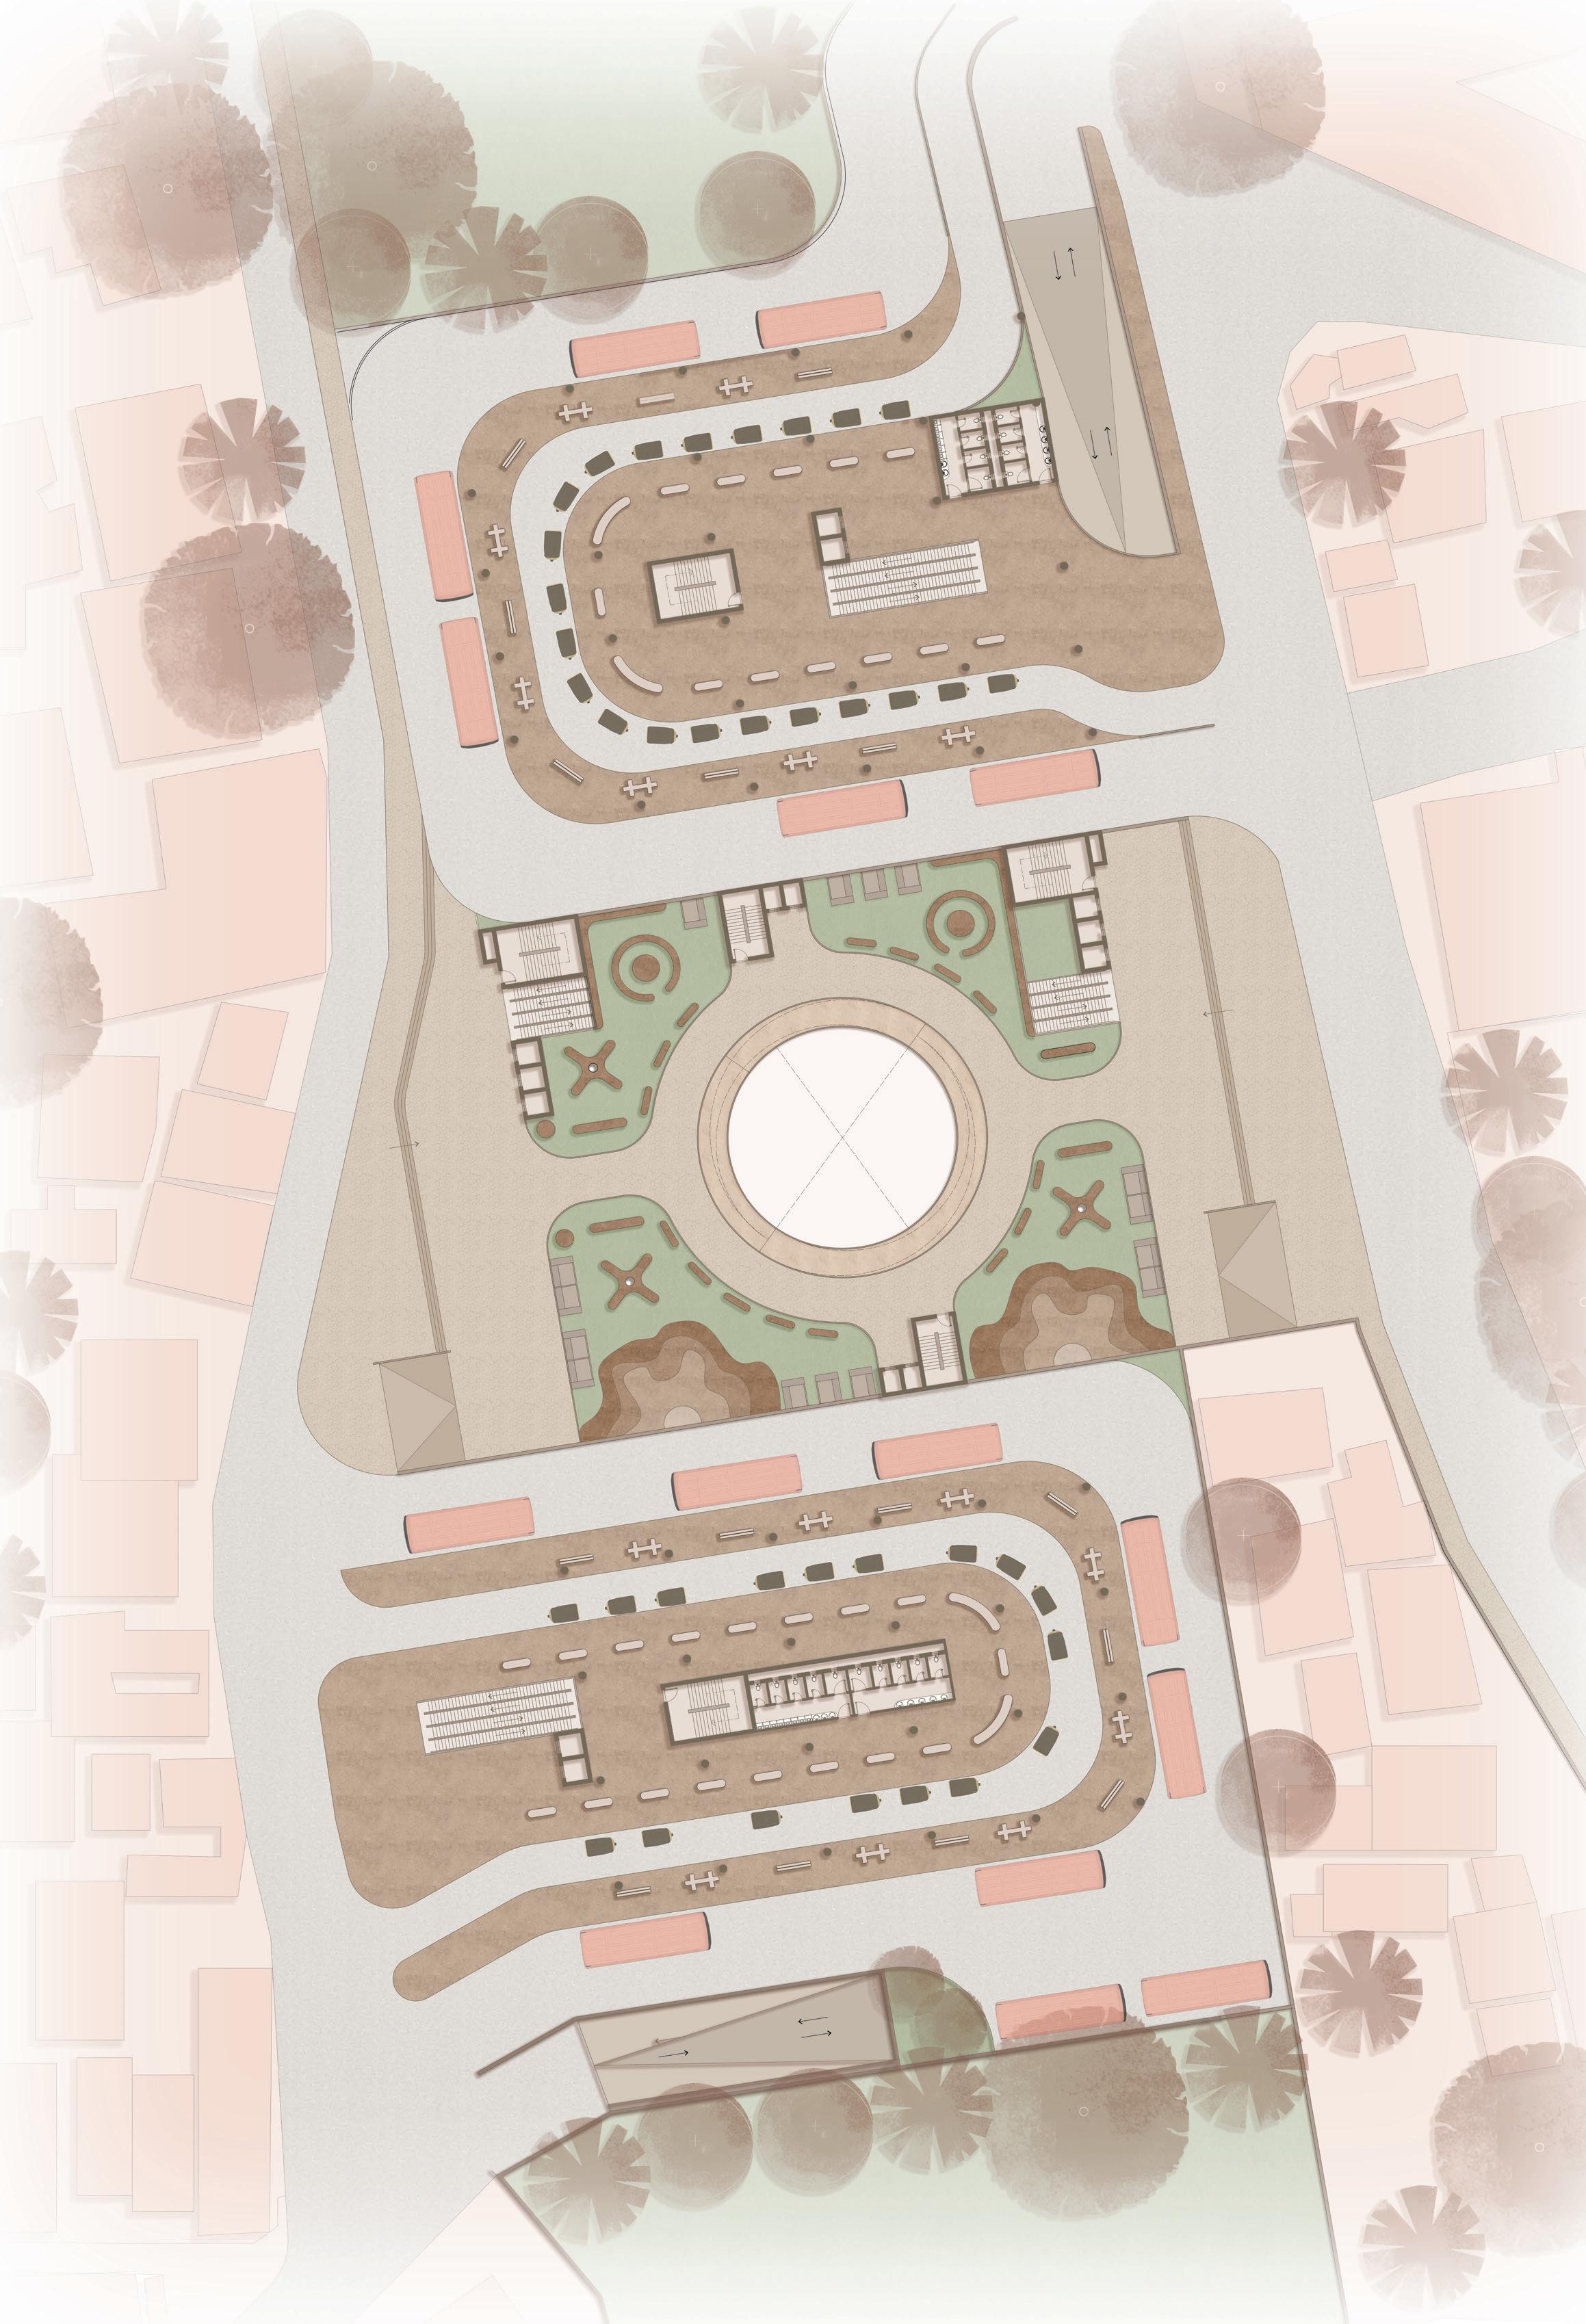
MASTER PLAN
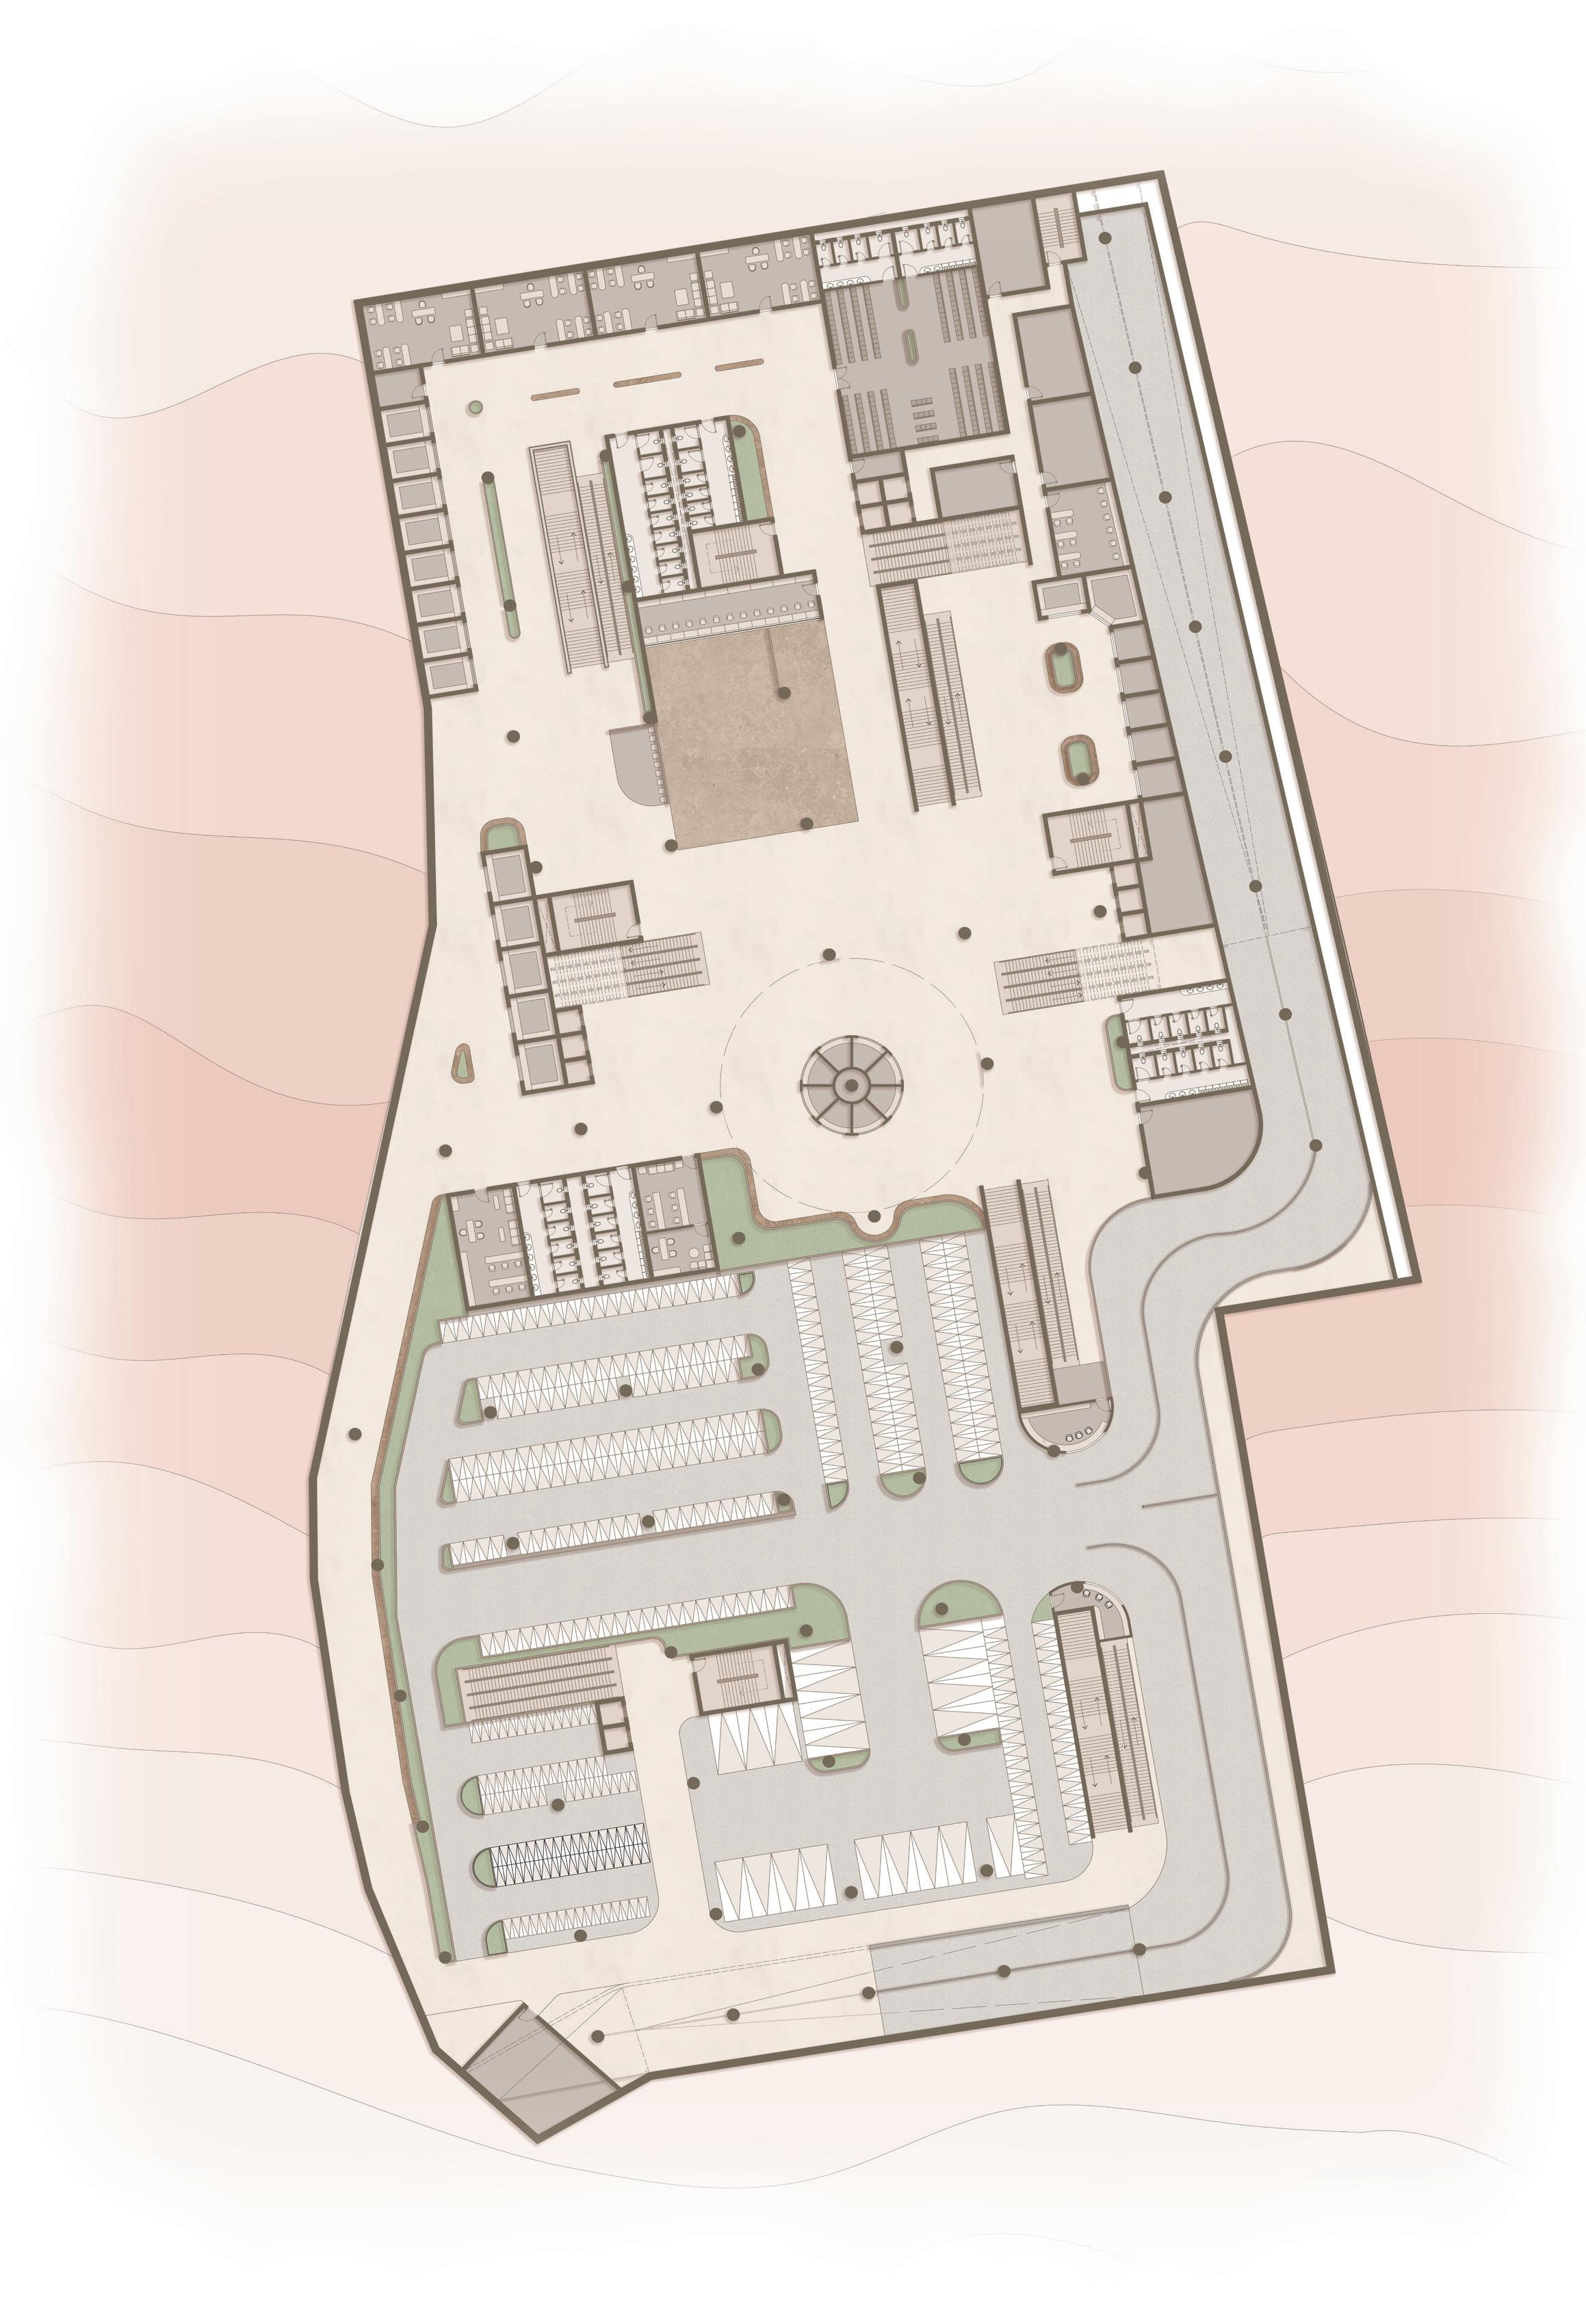
CONCOURSE LEVEL PLAN
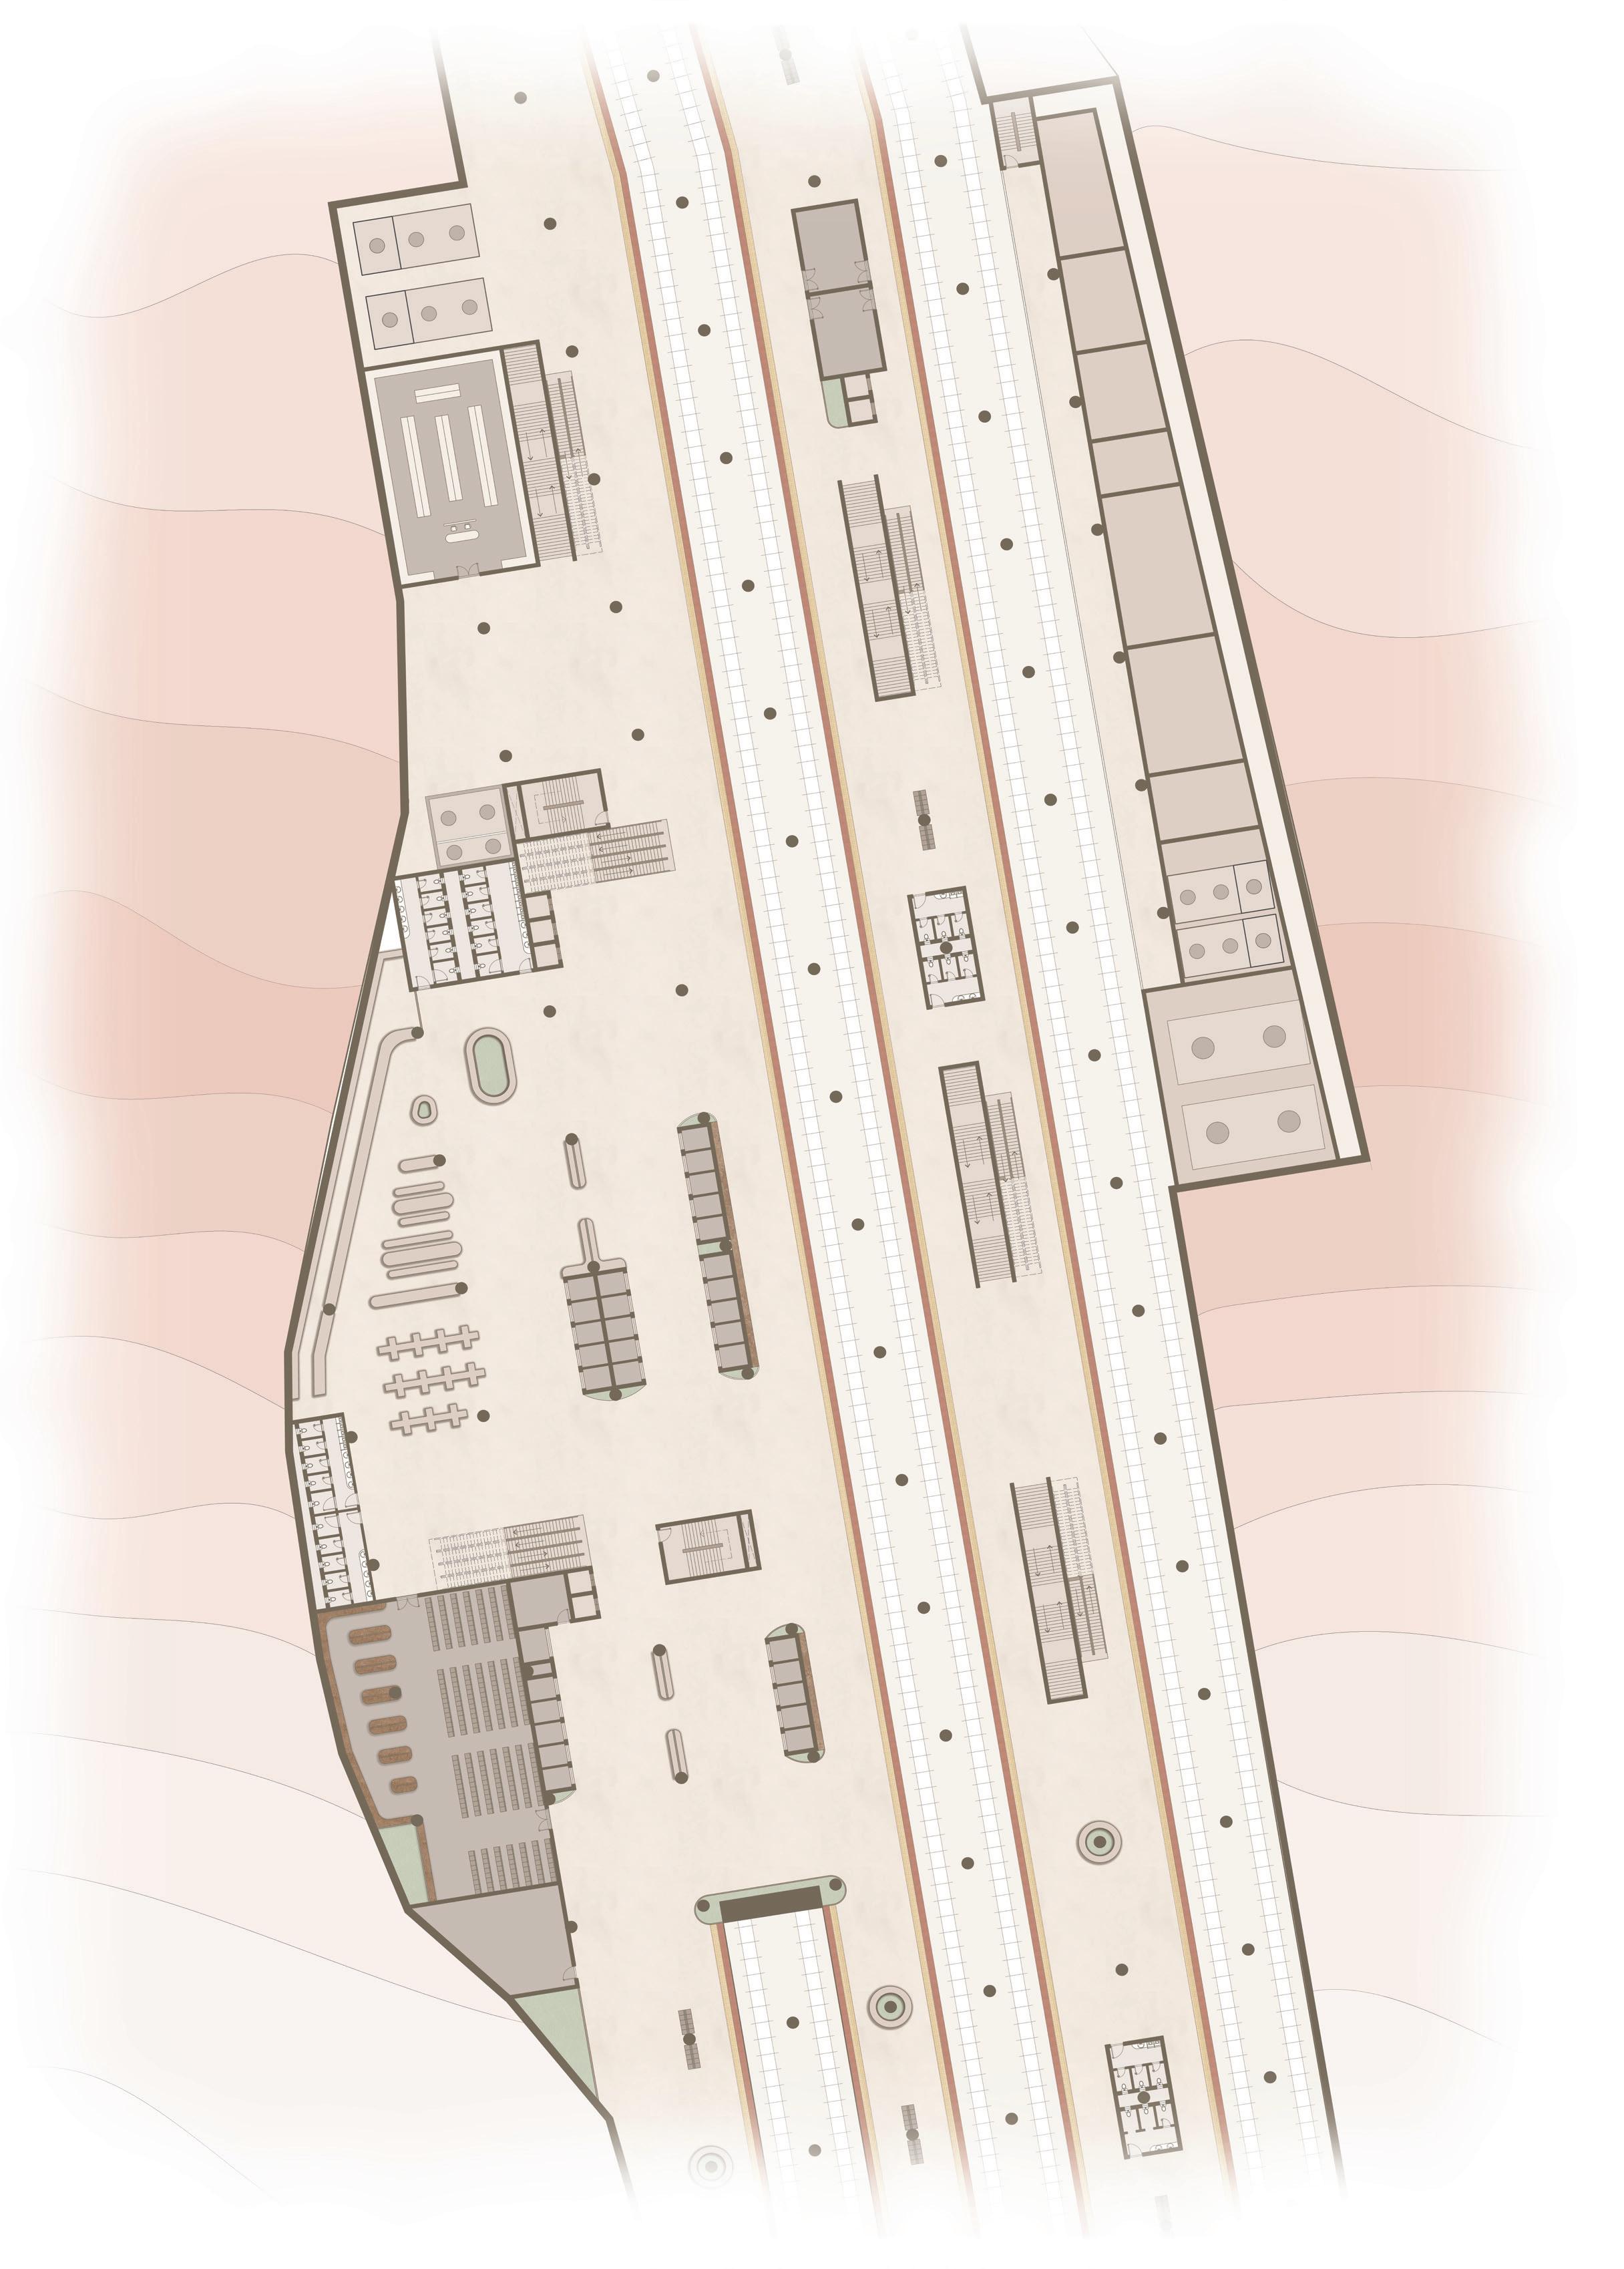
PLATFORM LEVEL PLAN
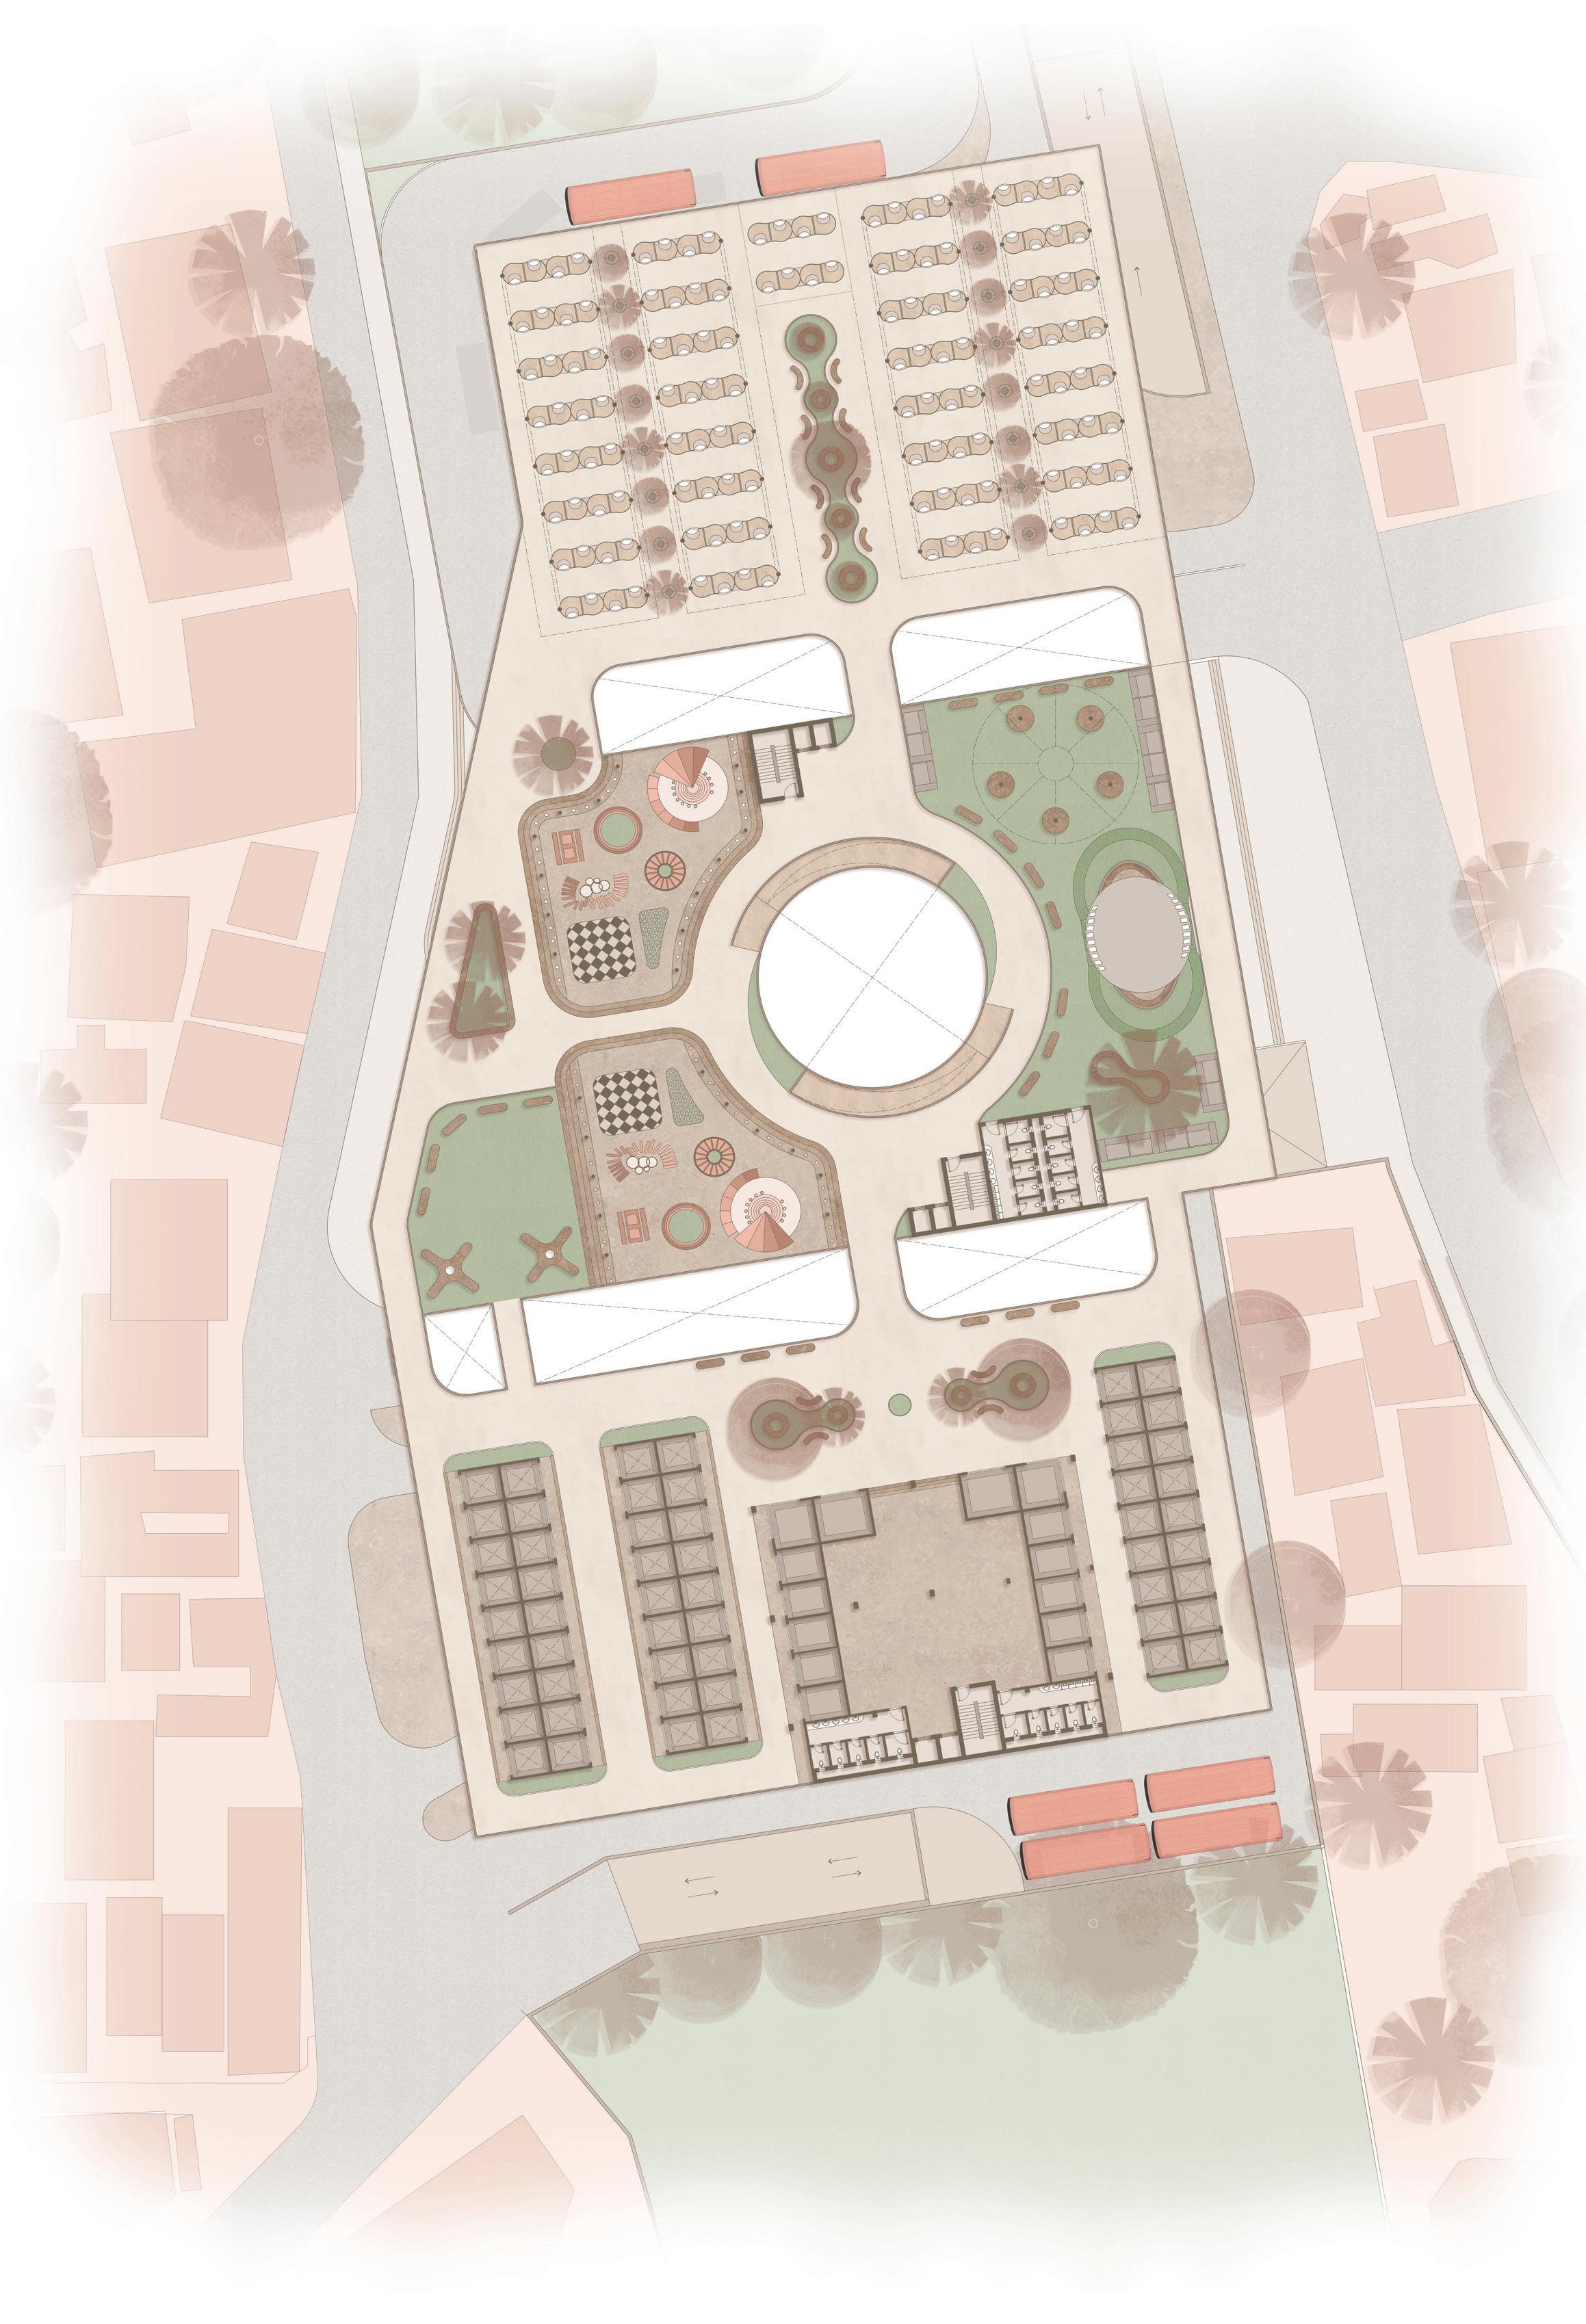
FIRST LEVEL PLAN
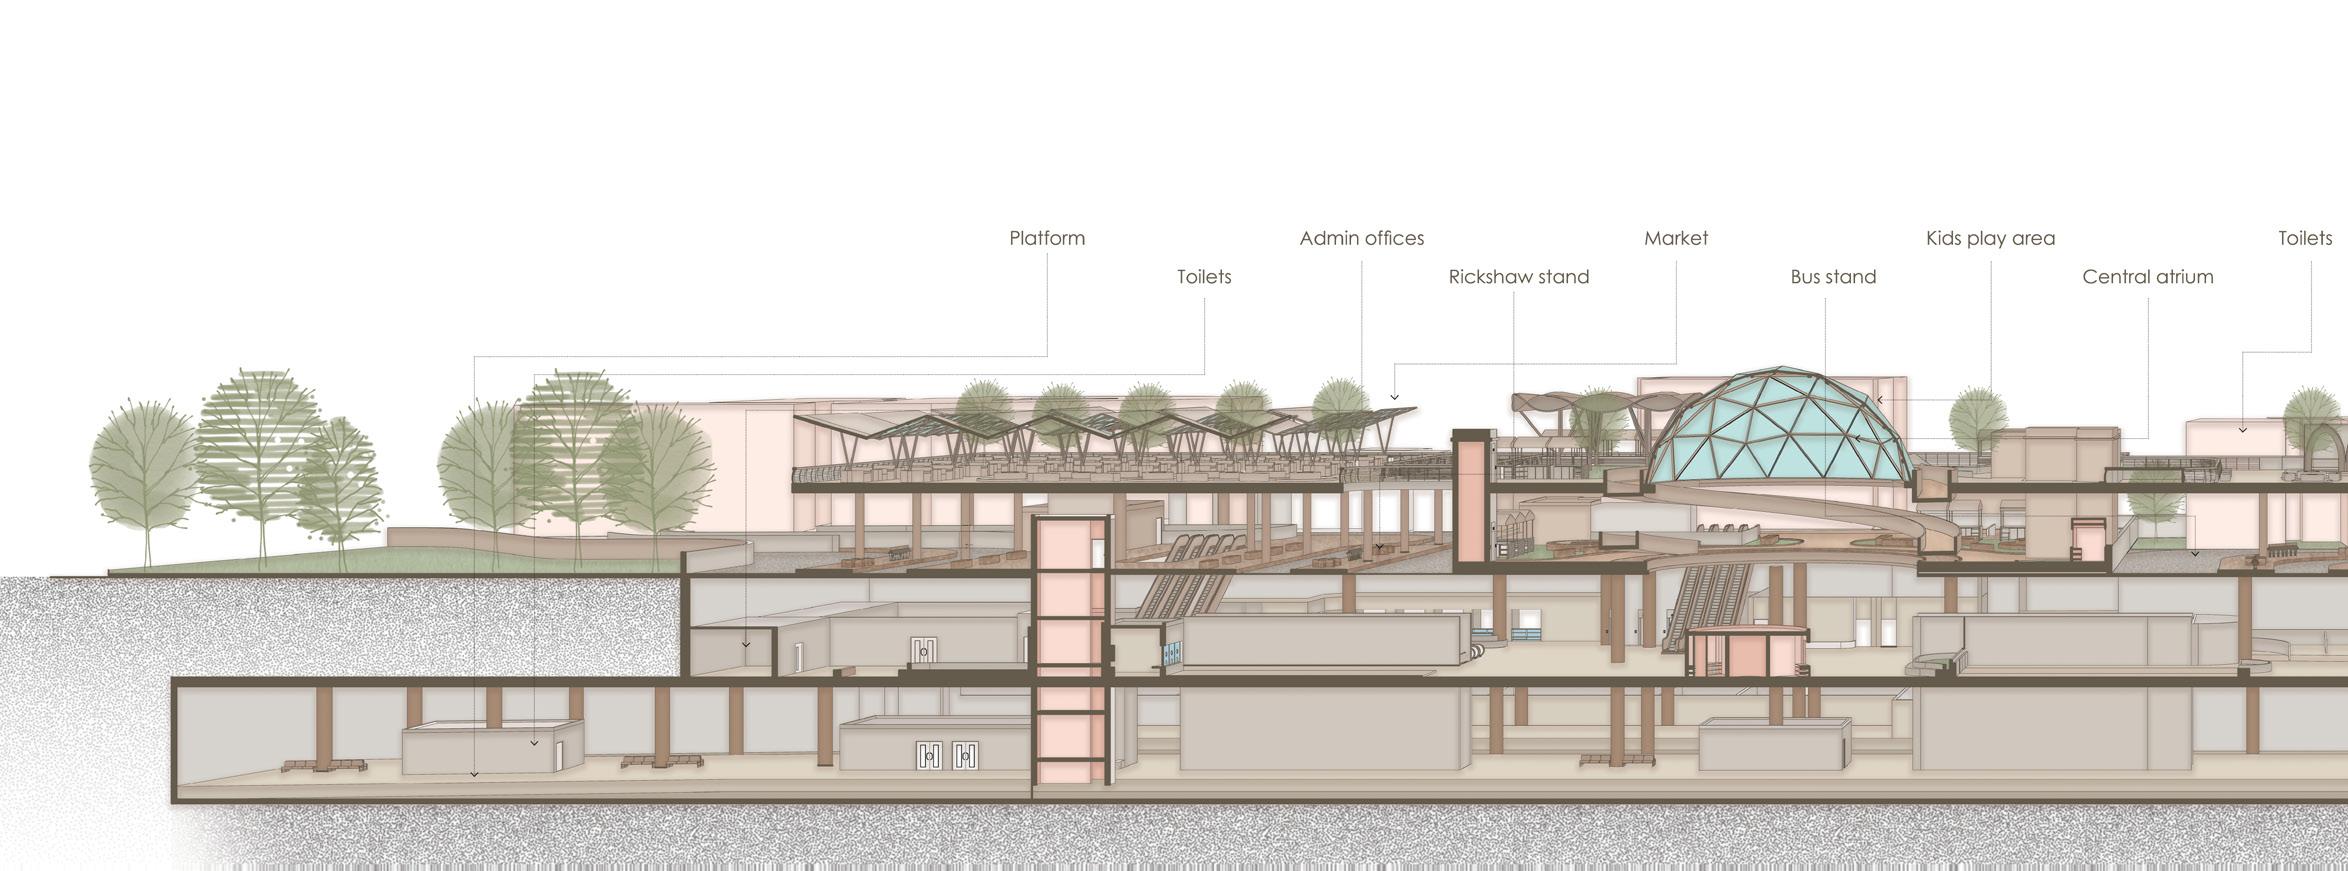
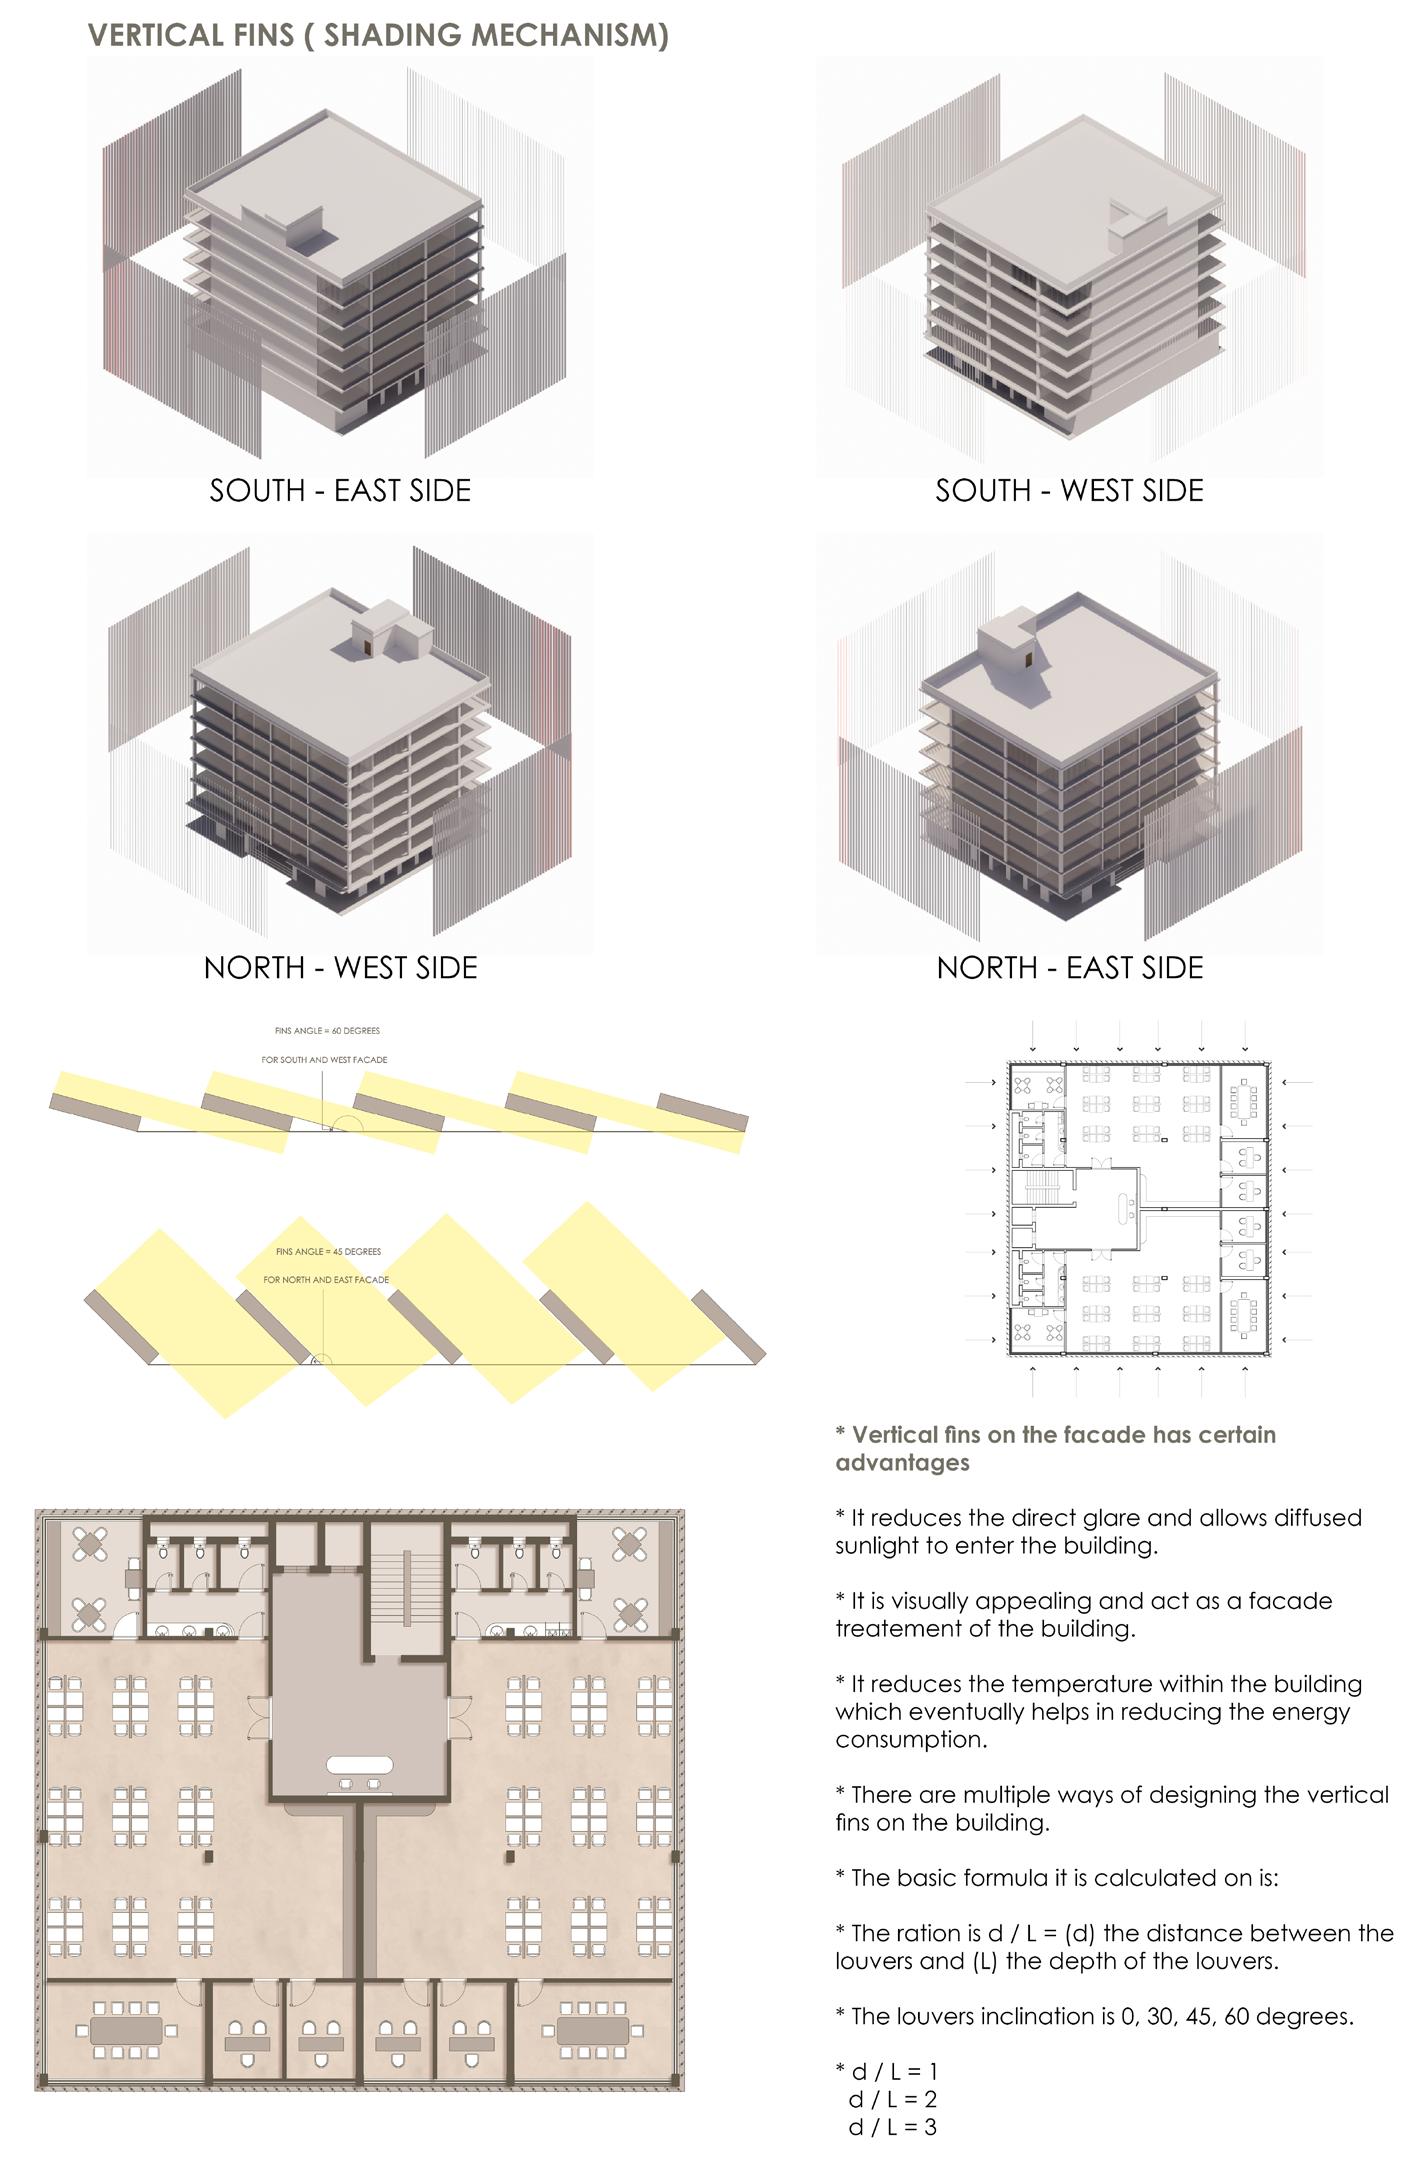
SCHEMATIC PLAN FOR SOLAR ENERGY GENERATION
ROOF AREA USED FOR SOLAR PANELS LEGEND
ROOF LINE
Total energy generated / day = 540 x 30 = 16200 Kw / day. For one year = 16200 x 365 = 59,13,000 Kw
I Hussain Lakdawala I Sem IX - X I Design Dissertation I Rizvi 124
+/-0.15 +/-0.60+/-0.45 +/-0.15 +/-0.30 +/-0.45 +/-0.60 Kids play
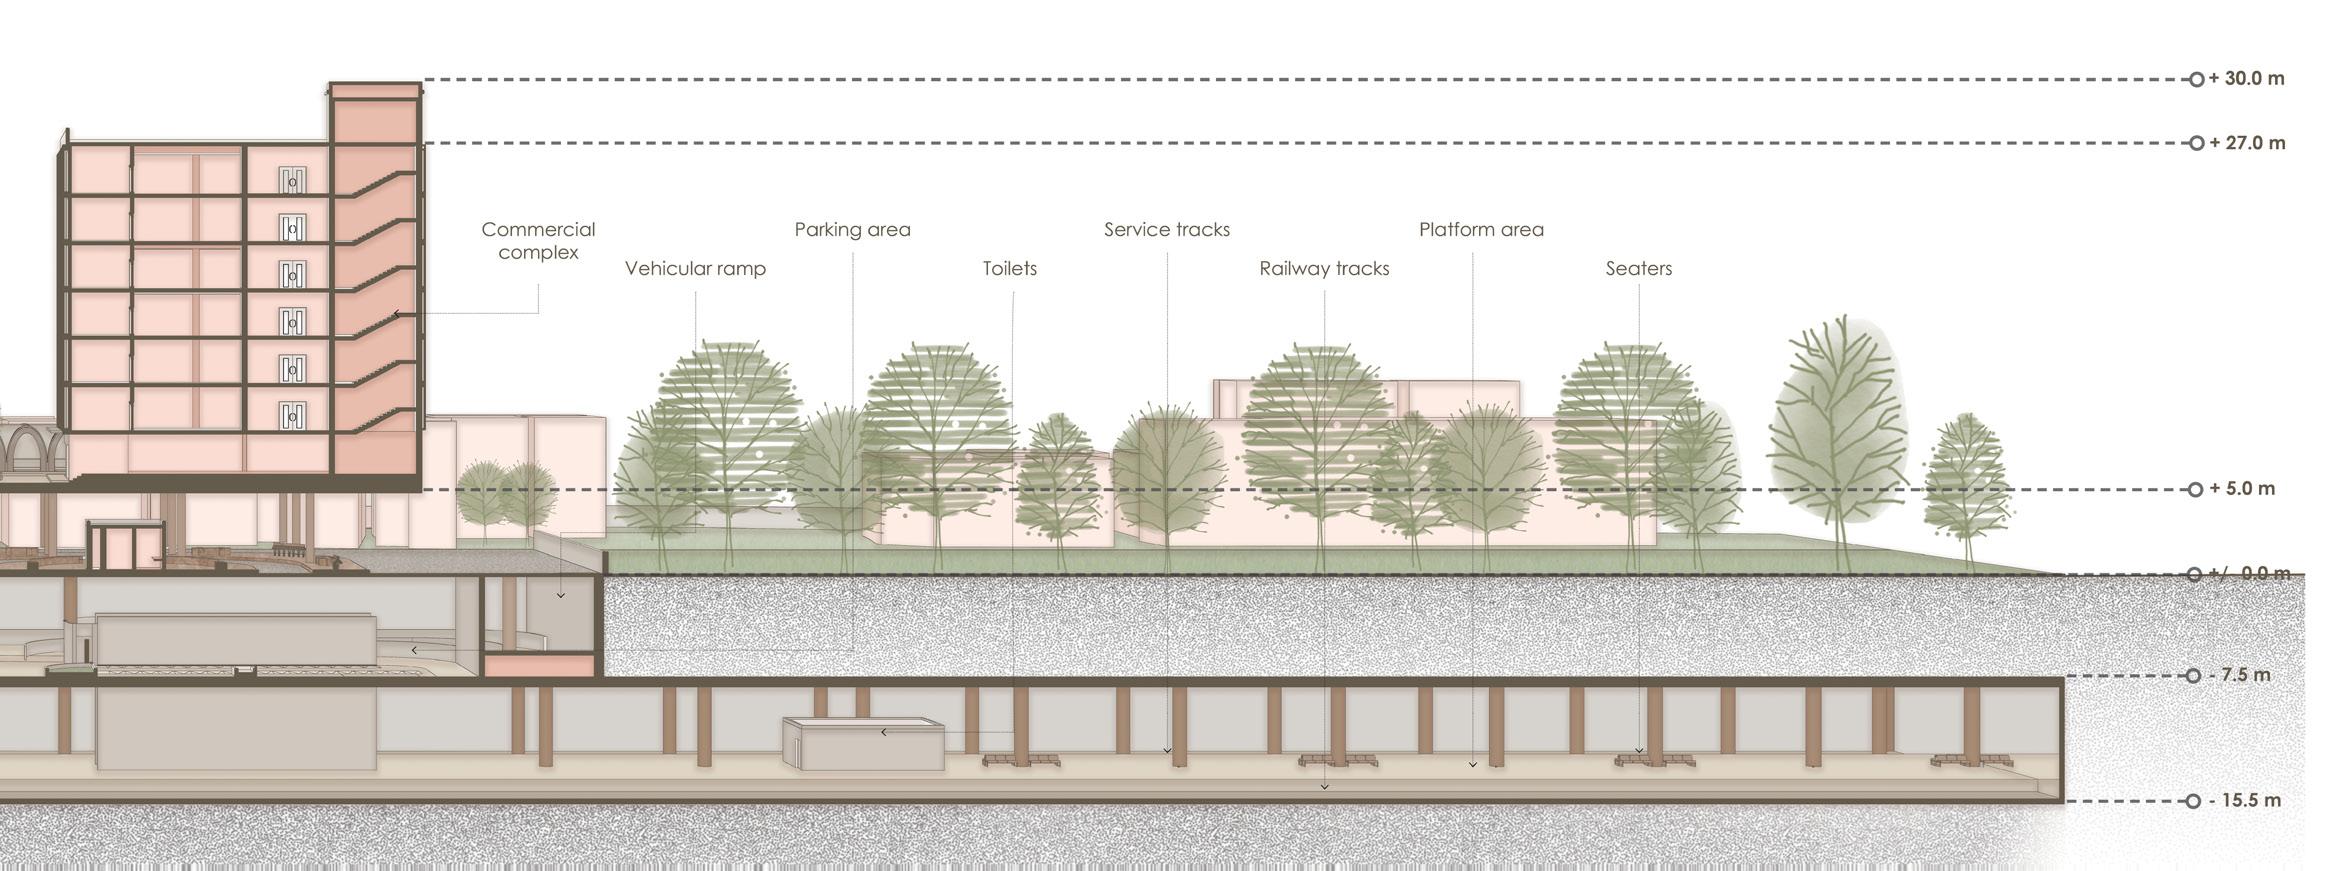
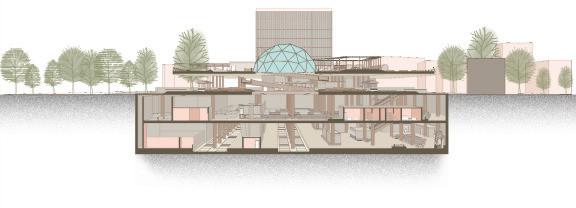
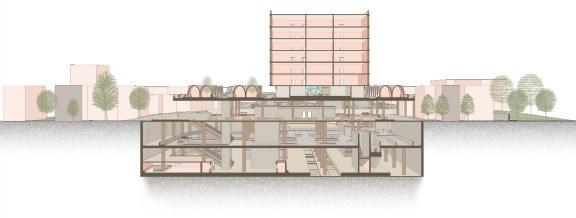
I Hussain Lakdawala I Sem IX - X I Design Dissertation I Rizvi 125 Services room Commercial complex Railway tracks Central atrium Toilets Kids play area Parking Lane Food stalls Seaters Admin block Dual way ramp Cafeteria - 15.5 m - 7.5 m +/- 0.0 m + 5.0 m + 8.0 m + 27.0 m Waiting room Shops Escalators and lifts Parking area Bus stand Commercial complex Seaters - 15.5 m - 7.5 m +/- 0.0 m + 5.0 m + 9.0 m +12.0 m +15.0 m +18.0 m + 21.0 m + 24.0 m +27.0 m
SECTION A-A’ SECTION B-B’ SECTION C-C’
FIRST LEVEL
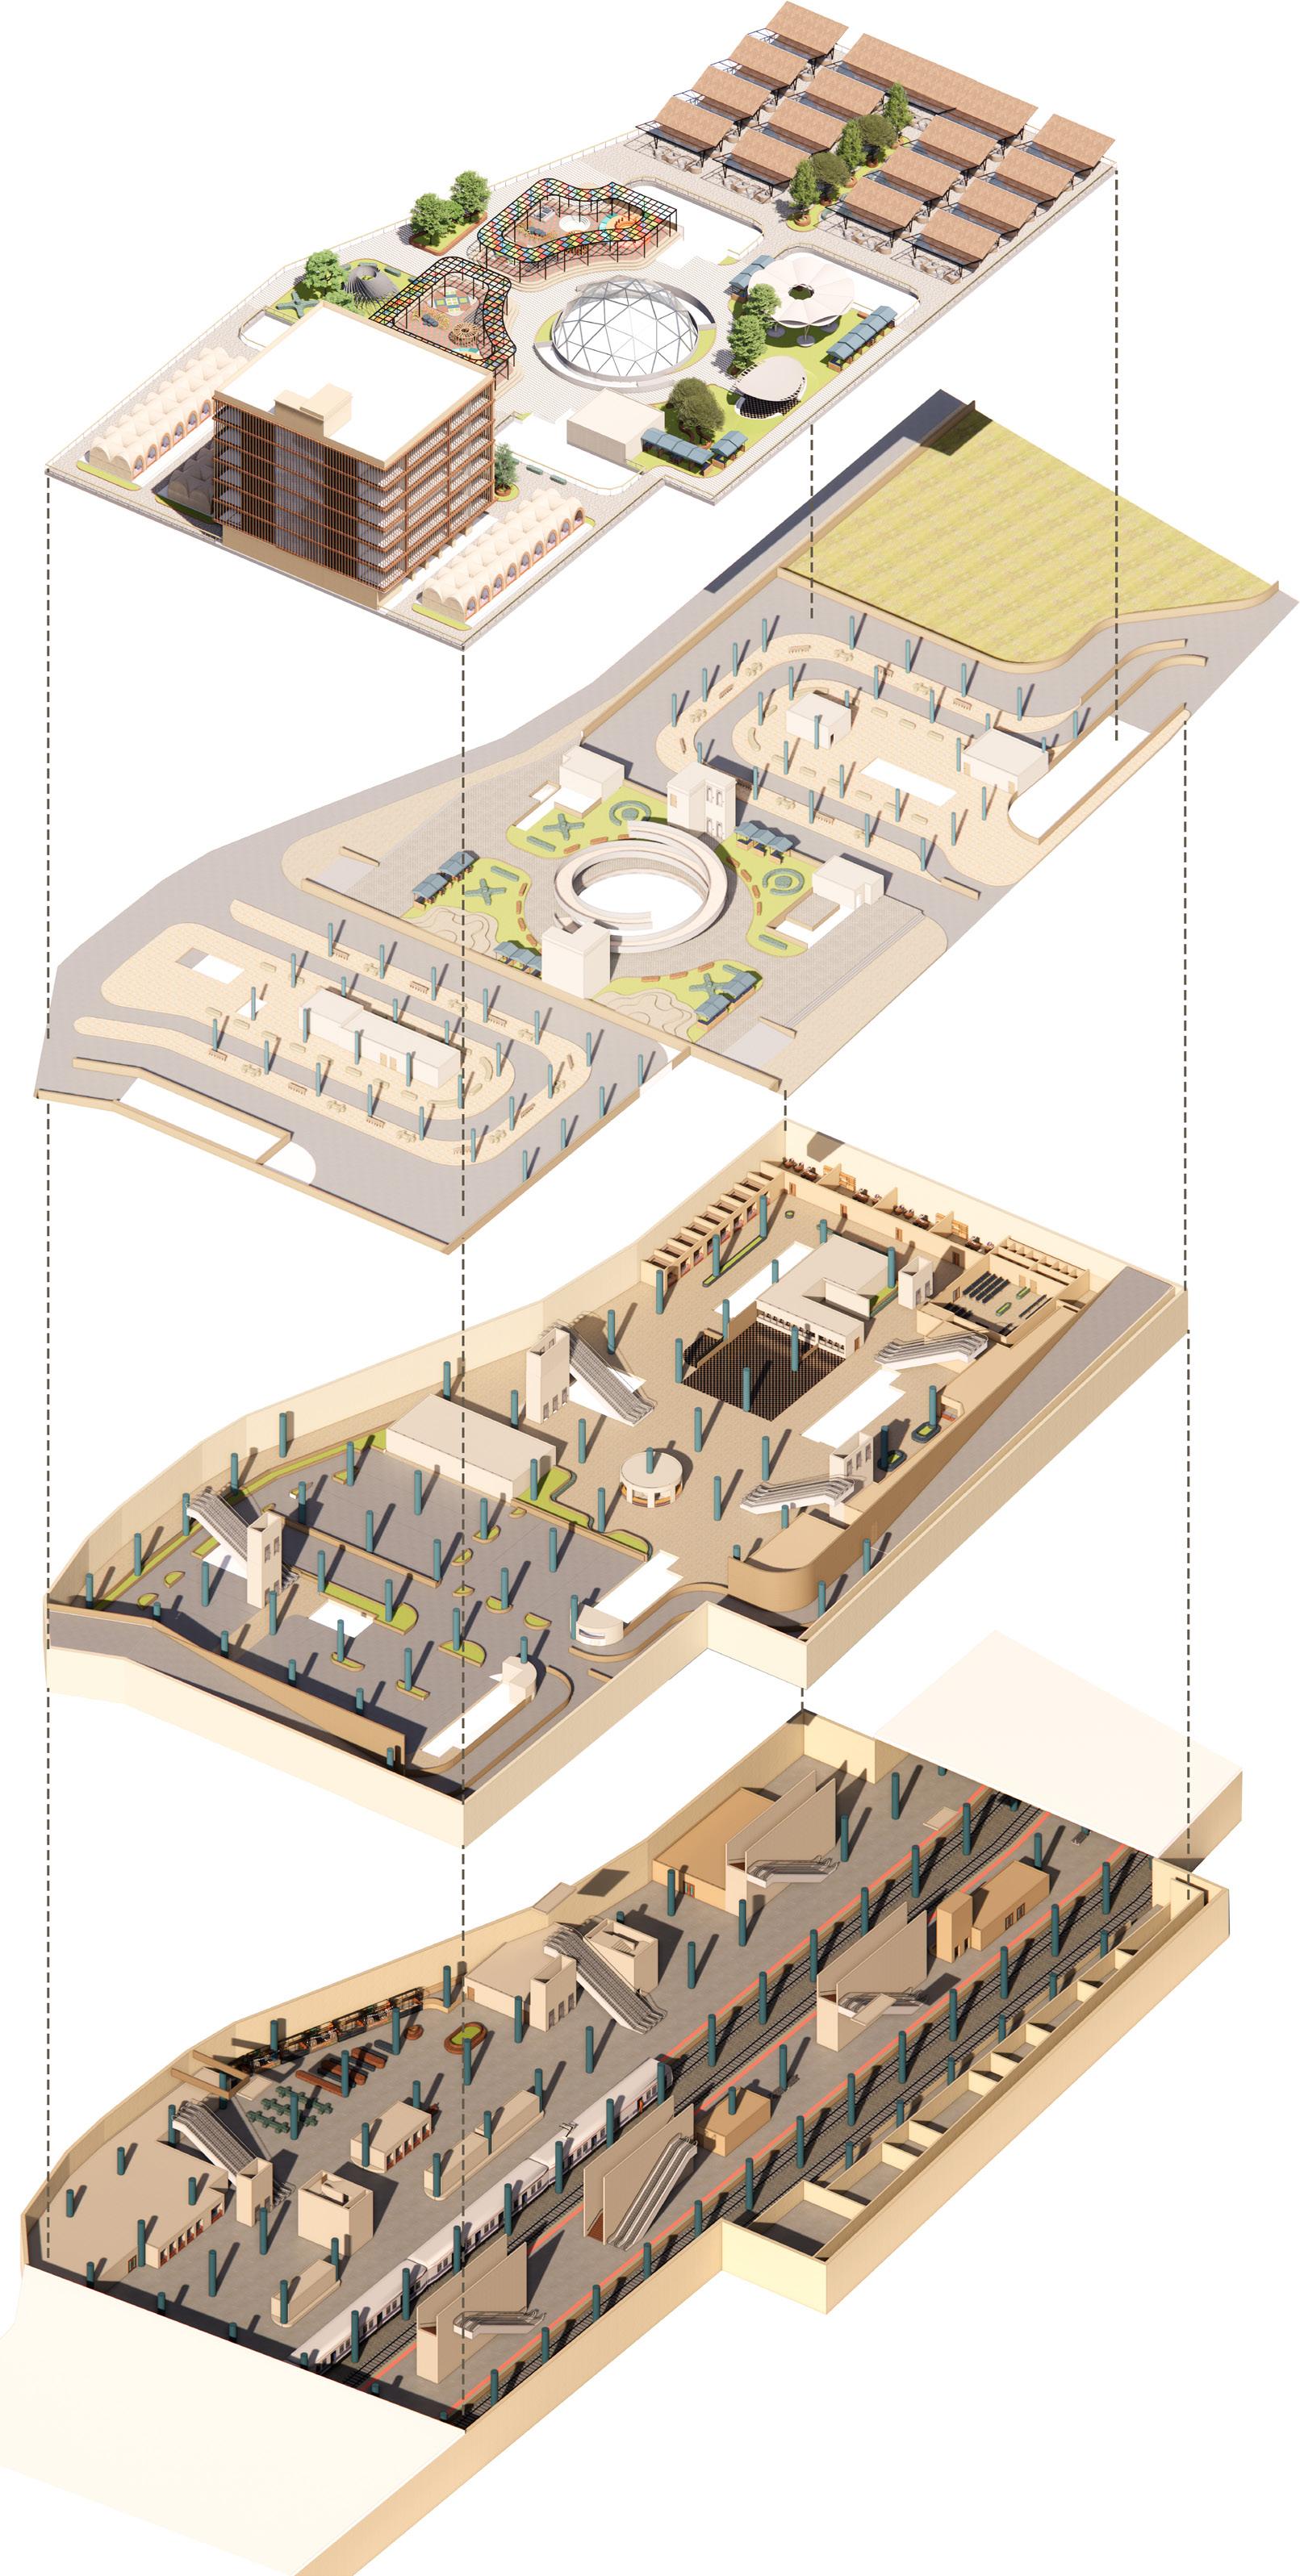
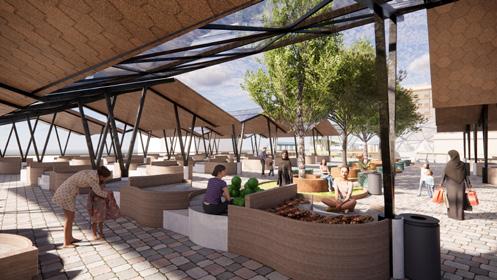

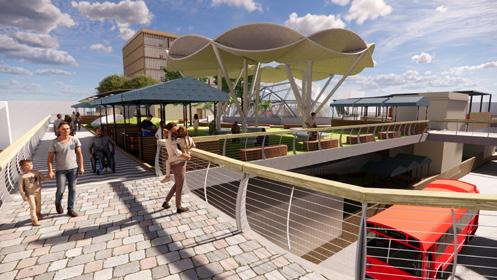
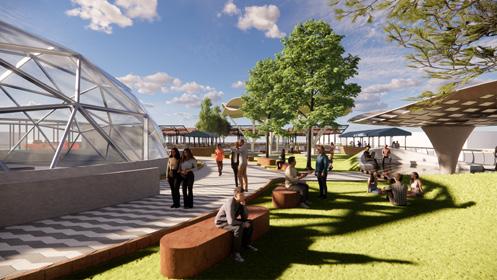
GRADE LEVEL
CONCOURSE LEVEL
PLATFORM LEVEL
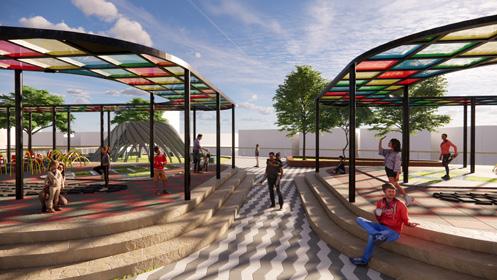
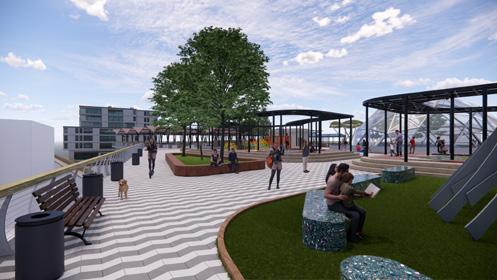
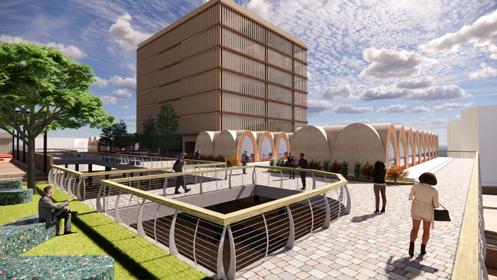
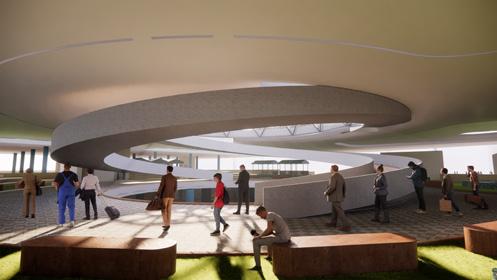
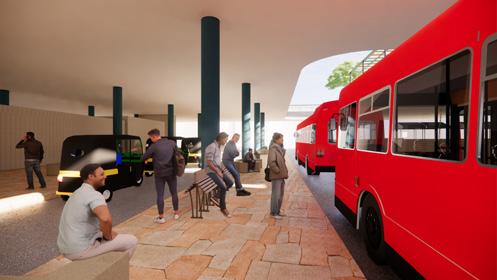
I Hussain Lakdawala I Sem IX - X I Design Dissertation I Rizvi 126
AXONOMETRIC
EXPLODED
VIEW
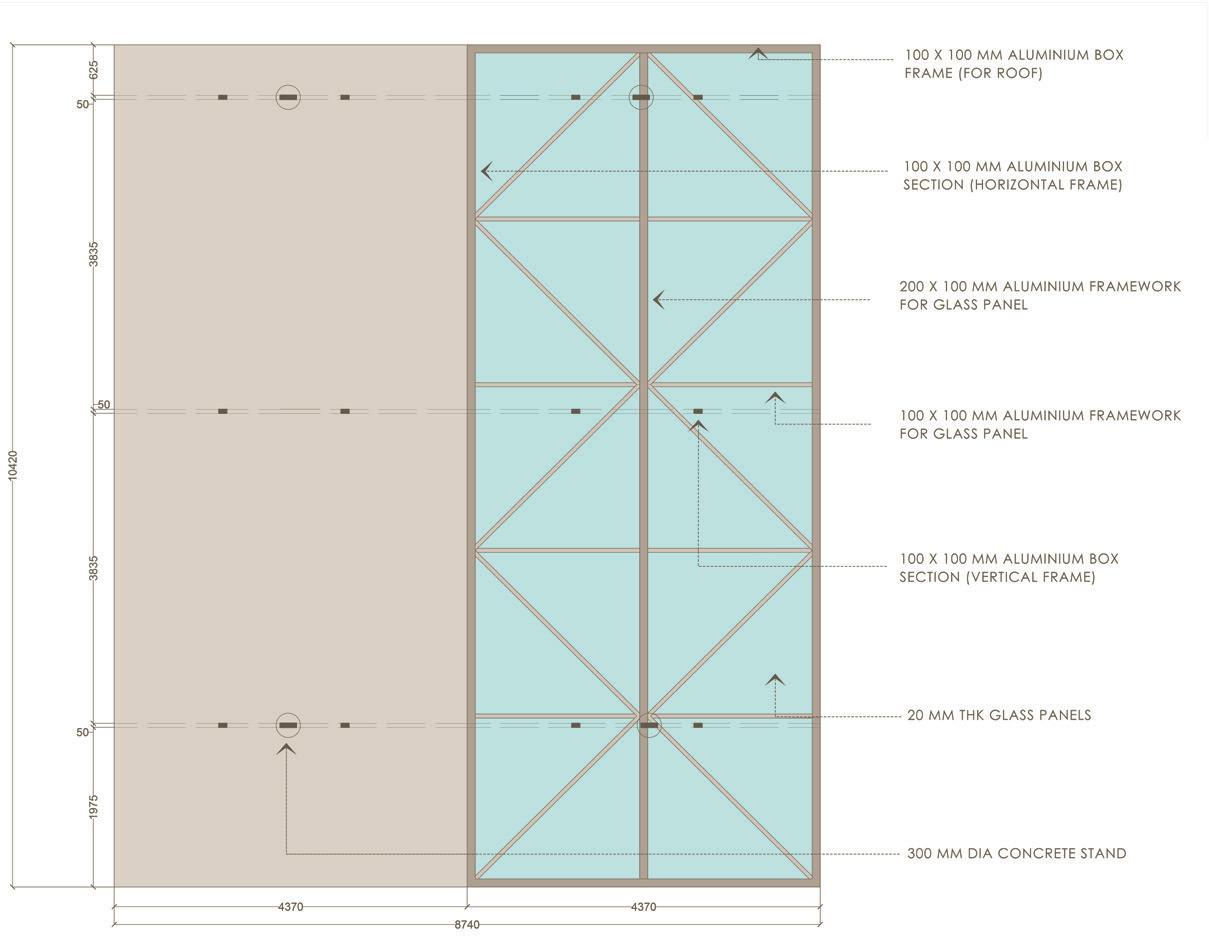
PLAN
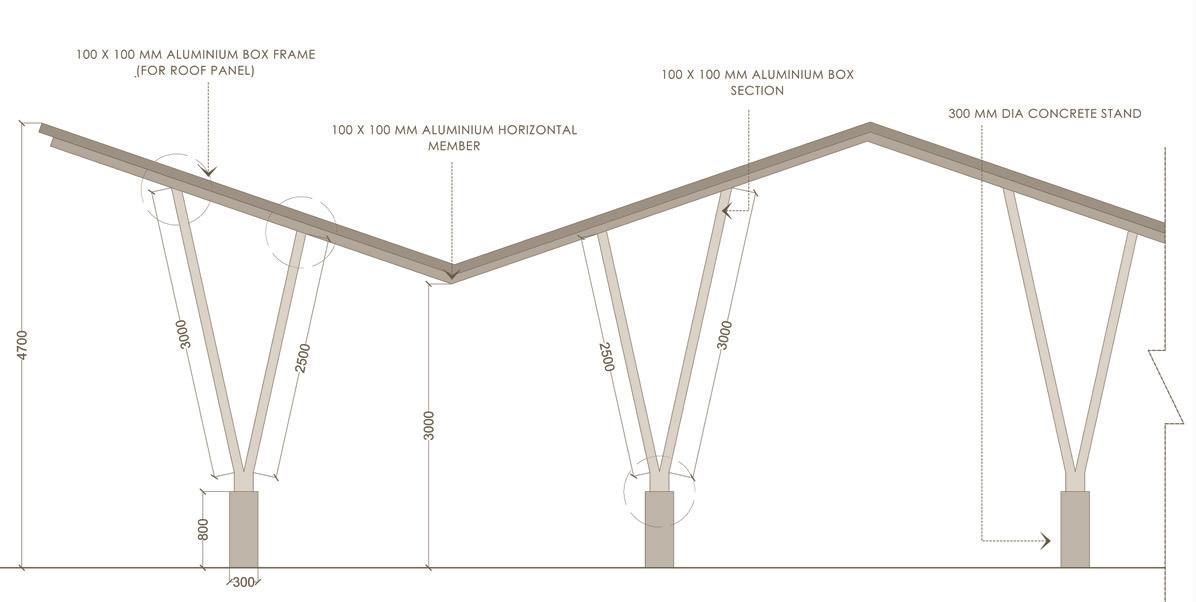
ELEVATION
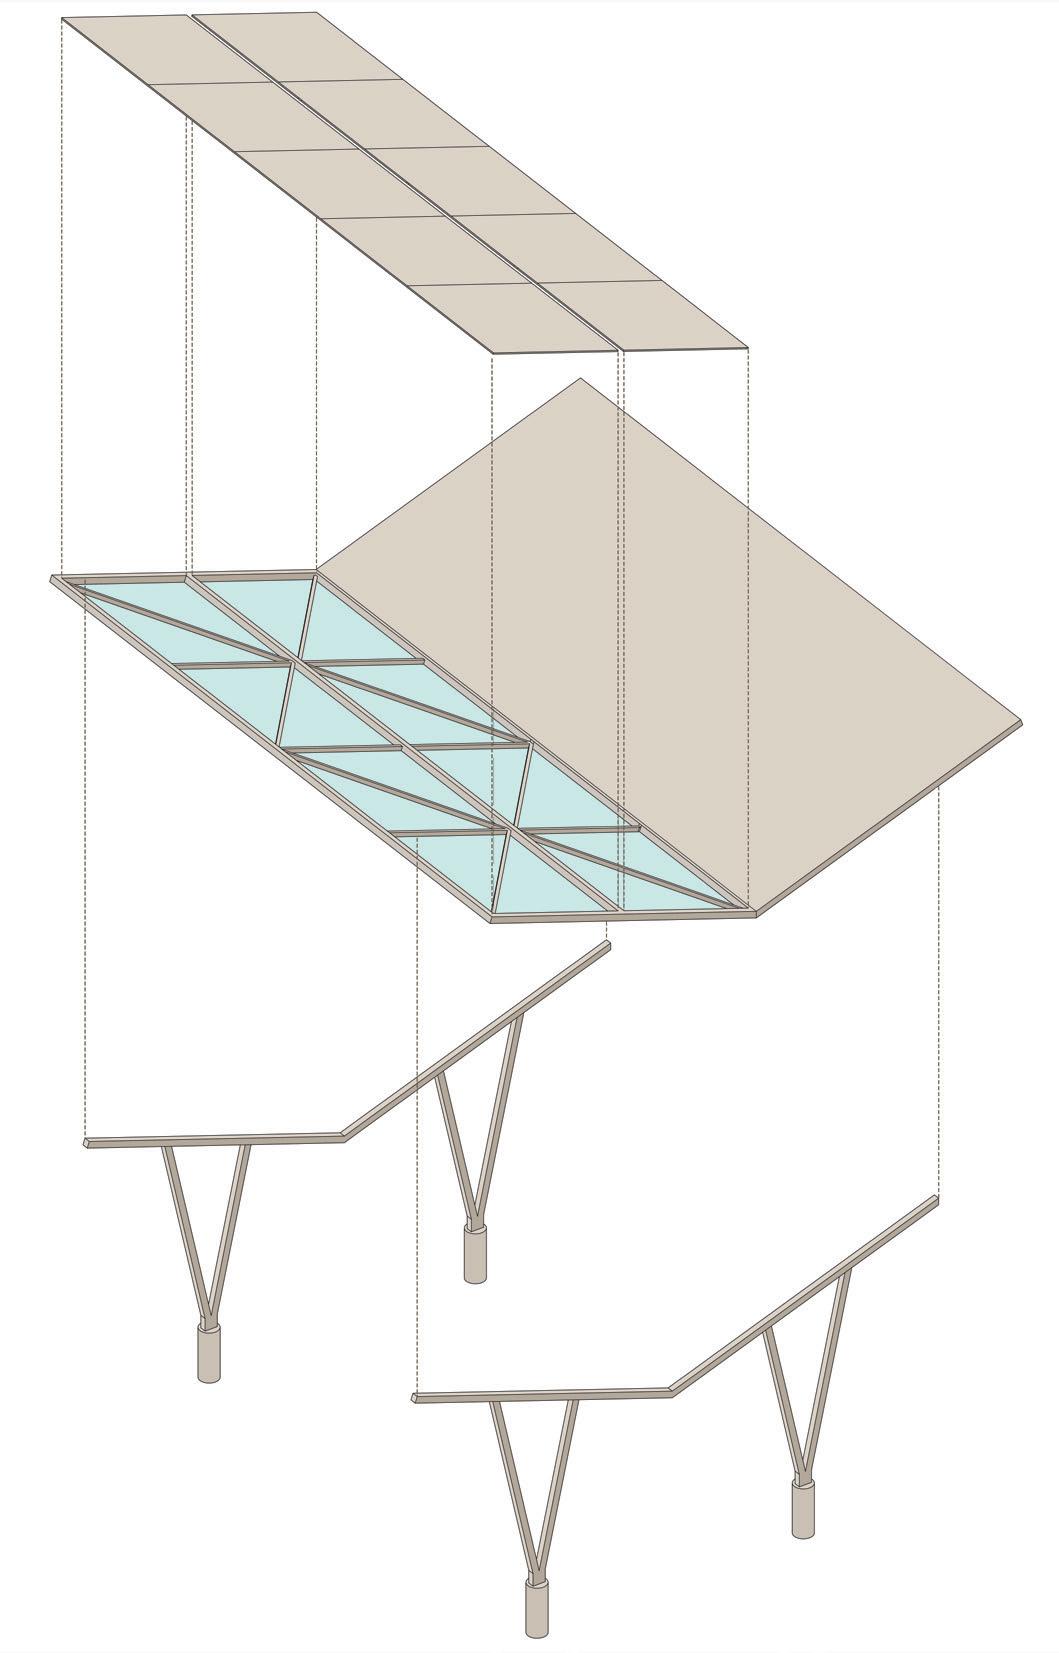
EXPLODED AXO
SCHEMATIC PLAN FOR RWH
LEGEND ROOF LINE
ROOF AREA USED FOR RAIN WATER COLLECTION
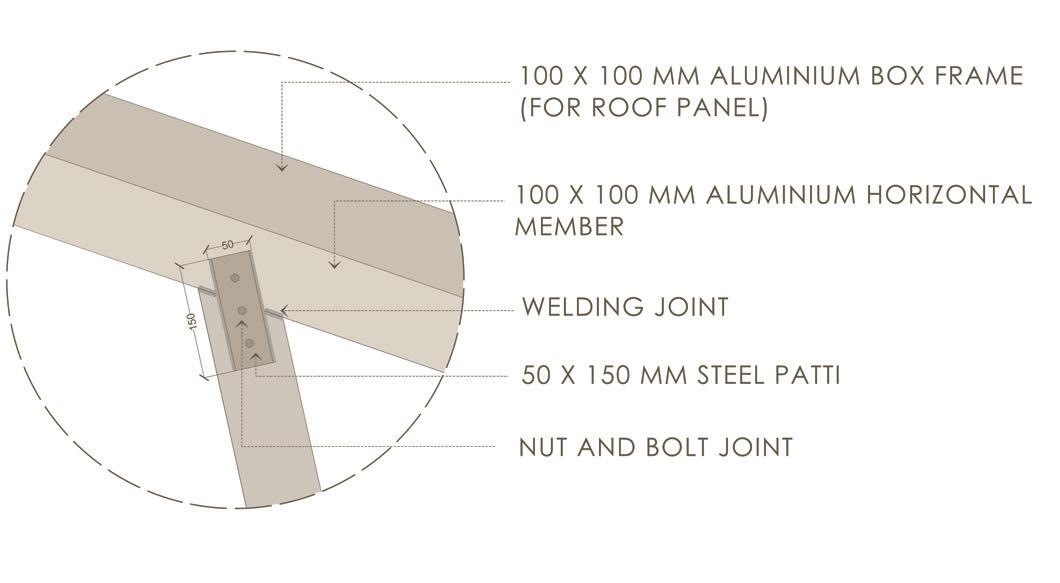
DETAIL ‘A’
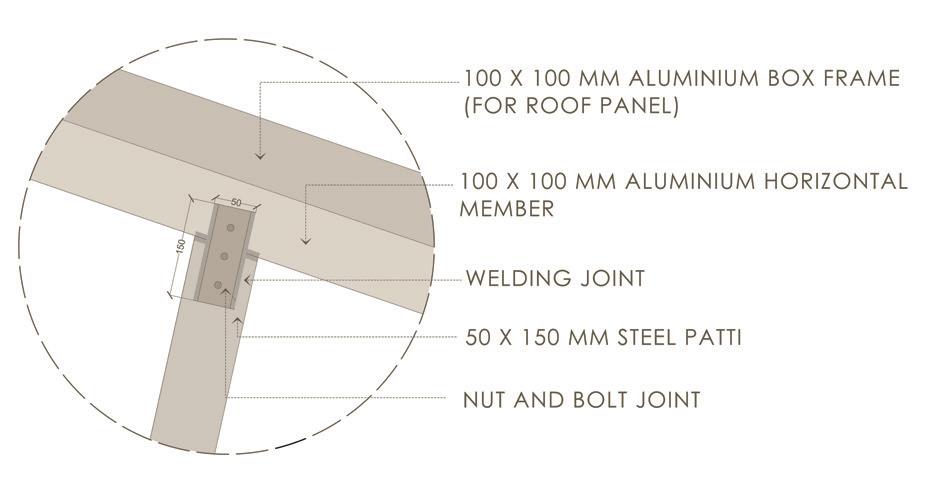
DETAIL ‘B’
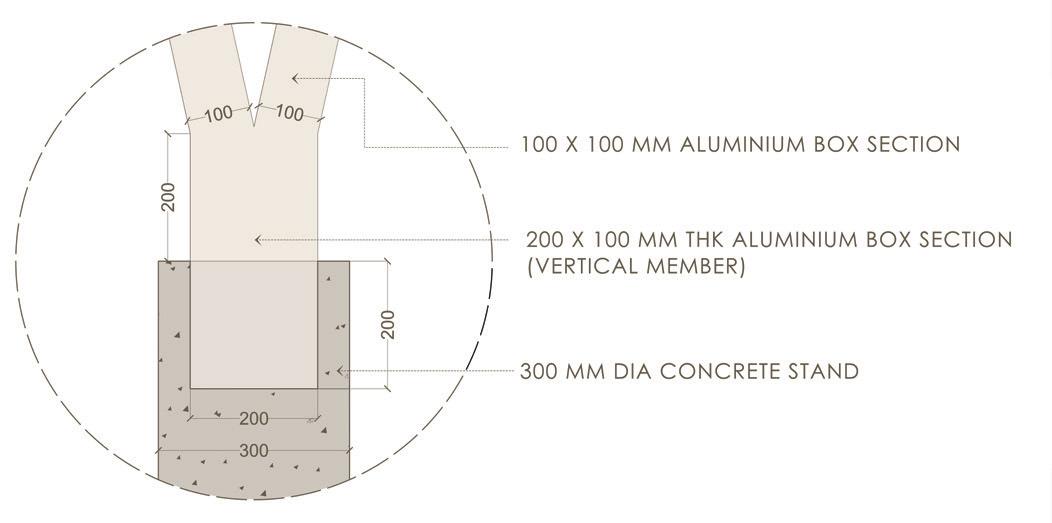
DETAIL ‘C’
I Hussain Lakdawala I Sem IX - X I Design Dissertation I Rizvi 127
MARKET ROOF DETAILS
LEGEND
MAIN SEWAGE LINE
TOILETS TO STP TANK CONNECTION
STP TANK
STP TANK TO U.G.T
STP TANK TO MAIN SEWER LINE
SLUICE VALVE
* Lets consider calculation for 2500 people (10 % of total floating population on site)
* Average usage of water per person = 45 litres / day.
* Total water consumption per day = 2500 x 45 = 22500 litres.
* Lets consider detention period as 3 days ( It should retain water for atleast 3 days).
* Therefore, 3 x 22500 = 6,75,000 litres = 7,00,000 litres.
* Sludge settle down per litre = 30 litres / person / year.
* = 30 x 2500 = 150000 litres sludge.
* lets, assume sludge removal every 1 year.
* Total tank capacity = 7,00,000 + 1,50,000 litres = 8,50,000 litres.
* Now, 1 CUM = 1000 litres.
Therefore, 8,50,000 litres = 850 CUM.
Now,depth of an STP tank is 3 metres.
850 / 3 = 284 sq.m.
Now, l x b = 2:1 ratio so b x b = 284 sq.m b = 12 m
U.G.T


RAIN WATER HARVESTING CALCULATION :
LEGEND
MAIN WATER SUPPLY LINE
U.G.T TO RWH TANK
WATER METER
NON RETURN VALVE
MANHOLE
SLUICE VALVE
*Formula: Roof area x Annual rainfall x Runoff co-effecient = collected water.
* Runoff co-effecient for flat slab = 0.75
* 2200 x 2300 x 0.75 = 3,79,500 litres.
* 3,79,500 litres = 380 CUM.
* 380 = L X B X H
* 380 / 4 = LXB
L X B = 95
* Total are of tanks = 100 sq.m (Two tanks of 50 sq.m) Two tanks of 10 x 5 x 4 m.
I Hussain Lakdawala I Sem IX - X I Design Dissertation I Rizvi 128 M Surveillance M M Meter M M M storage M storage M N M RWH U.G.T Plenum M M M M M M M M N M
STP CALCULATION :


M M M M M M M M M

FLAT SLAB DETAILS


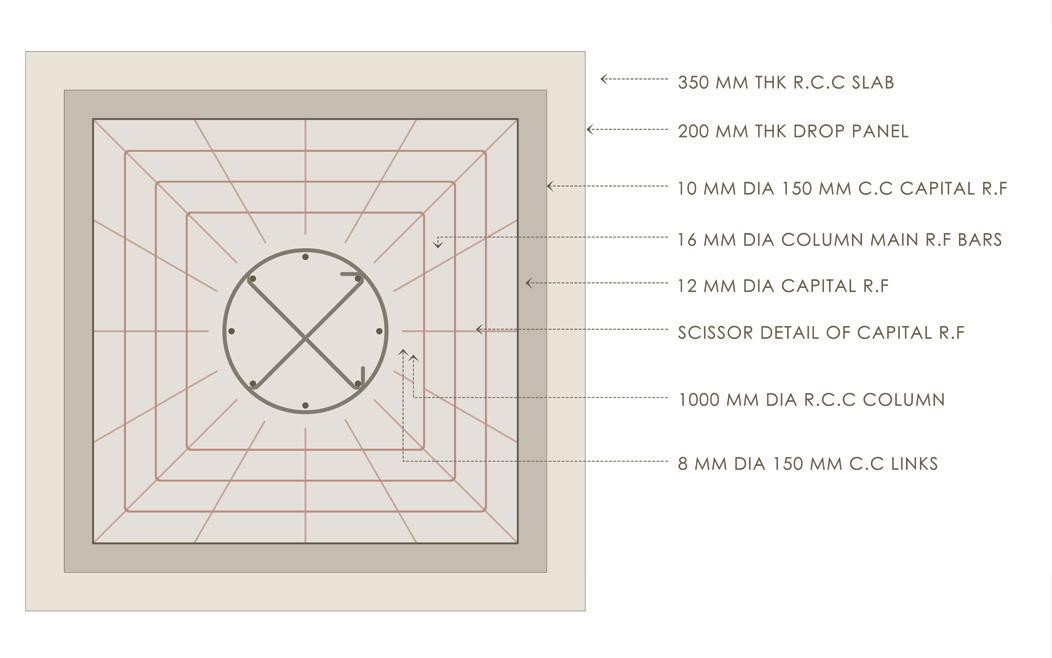
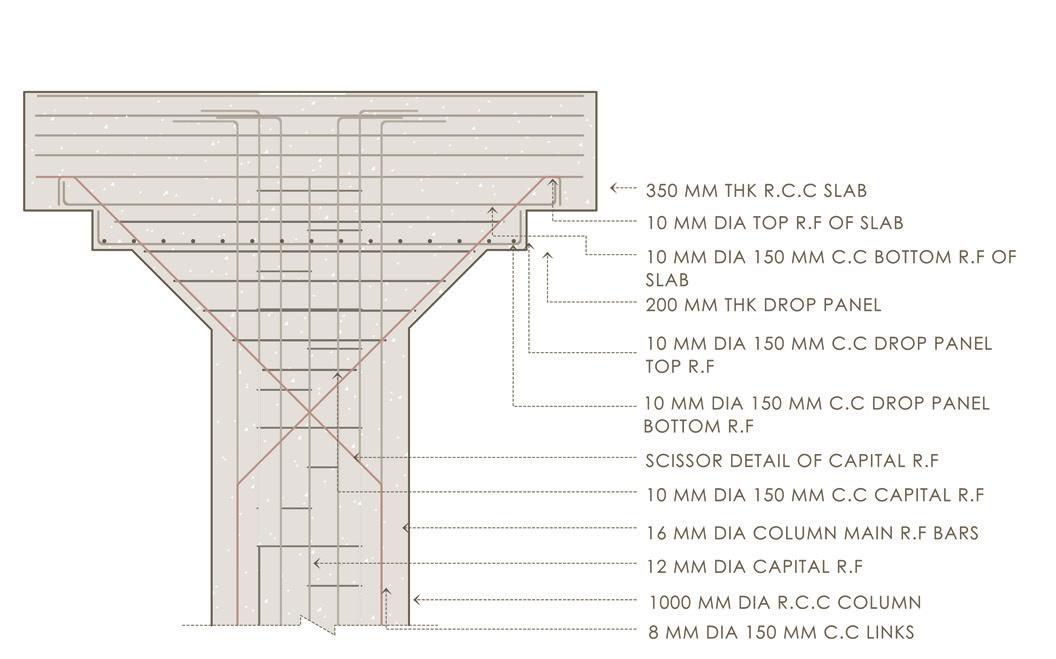
LEGEND
PLENUM ROOM
EXHAUST ROOM
PLENUM DUCTING
EXHAUST DUCTING
GRID
SEATER DETAILS
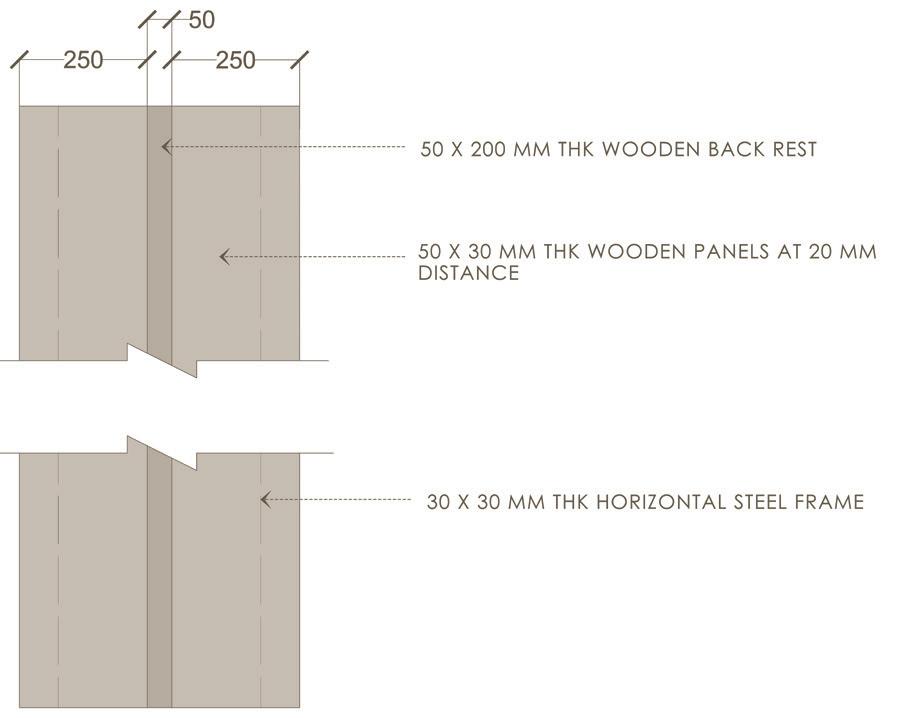

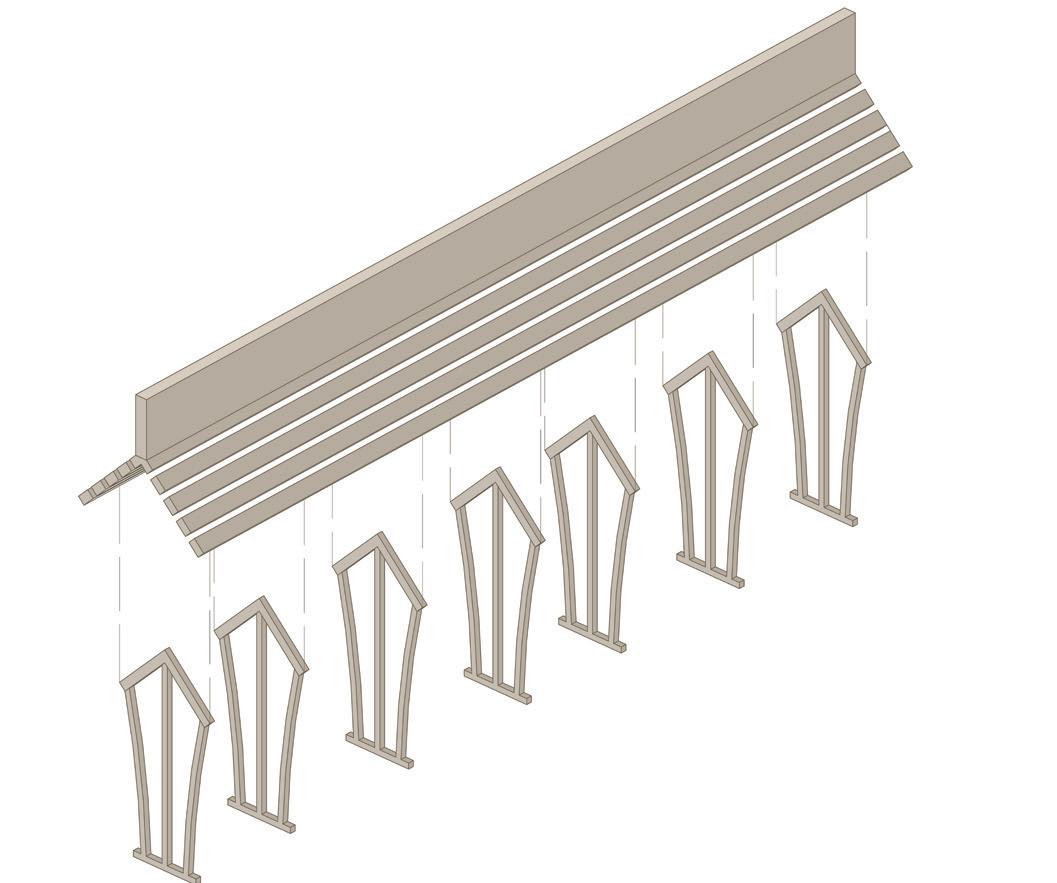
I Hussain Lakdawala I Sem IX - X I Design Dissertation I Rizvi 129 MECHANICAL VENTIALTIONS PLAN
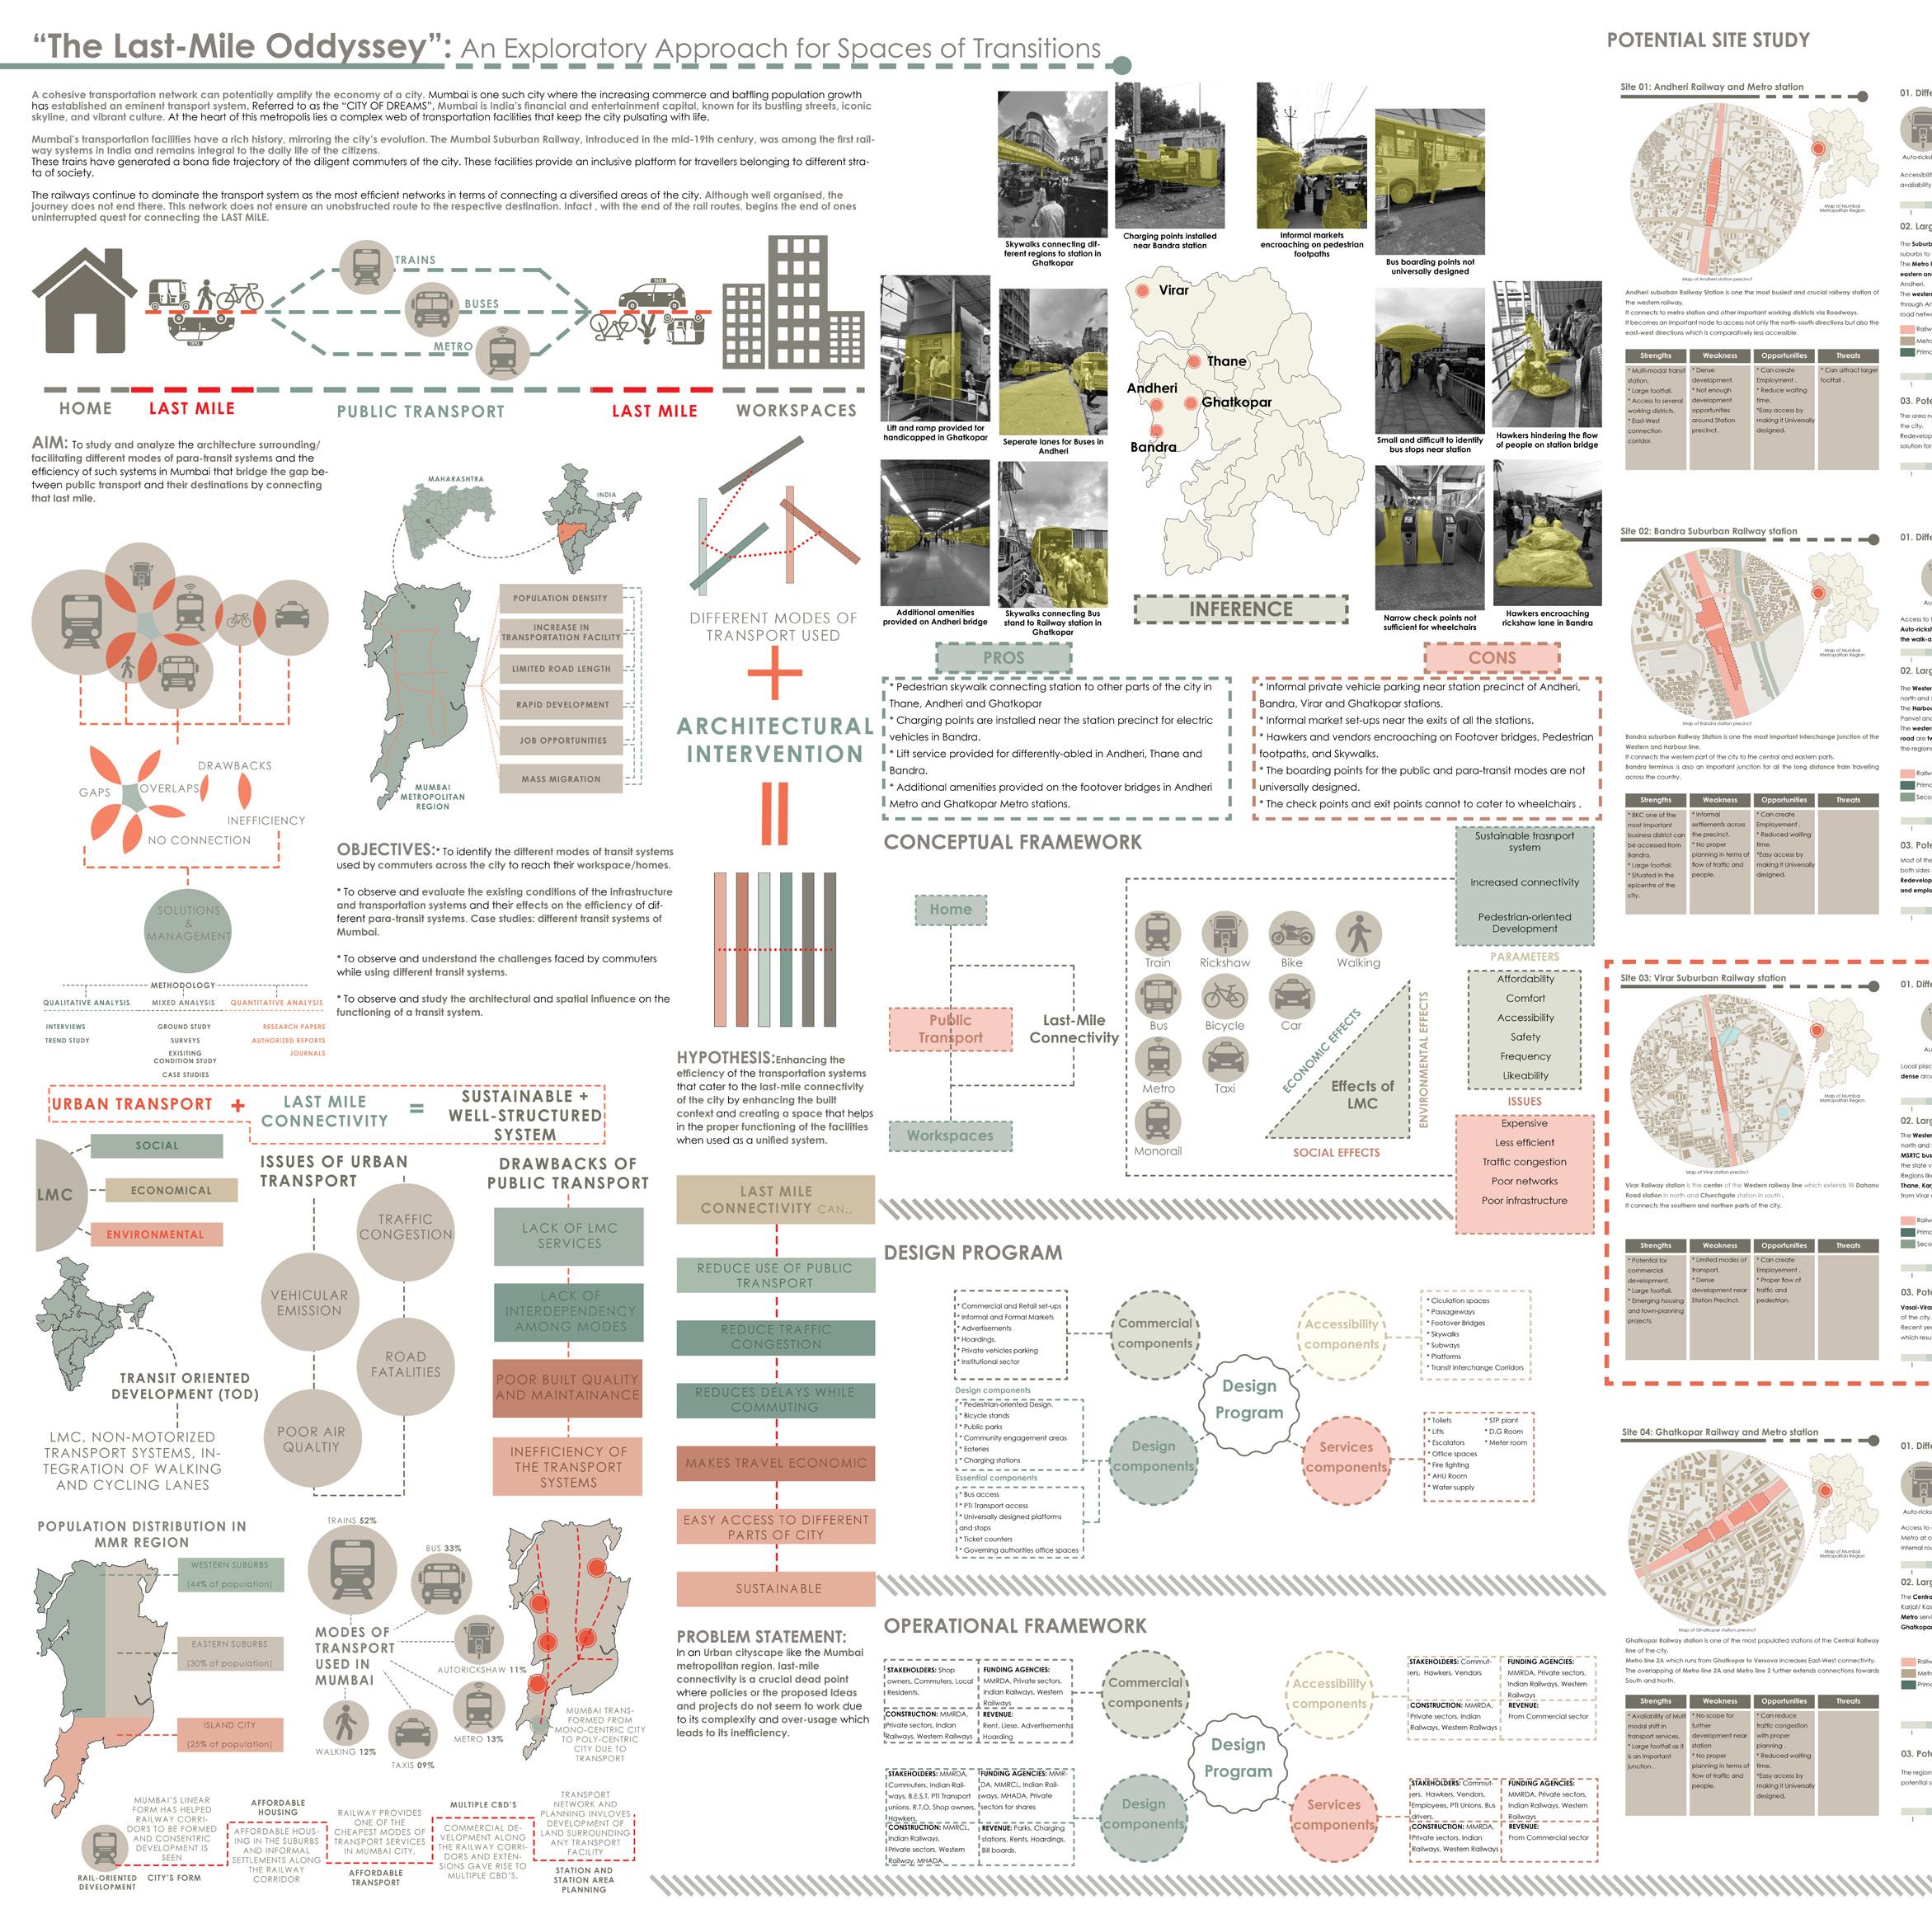
I Hussain Lakdawala I Sem IX - X I Design Dissertation I Rizvi 130
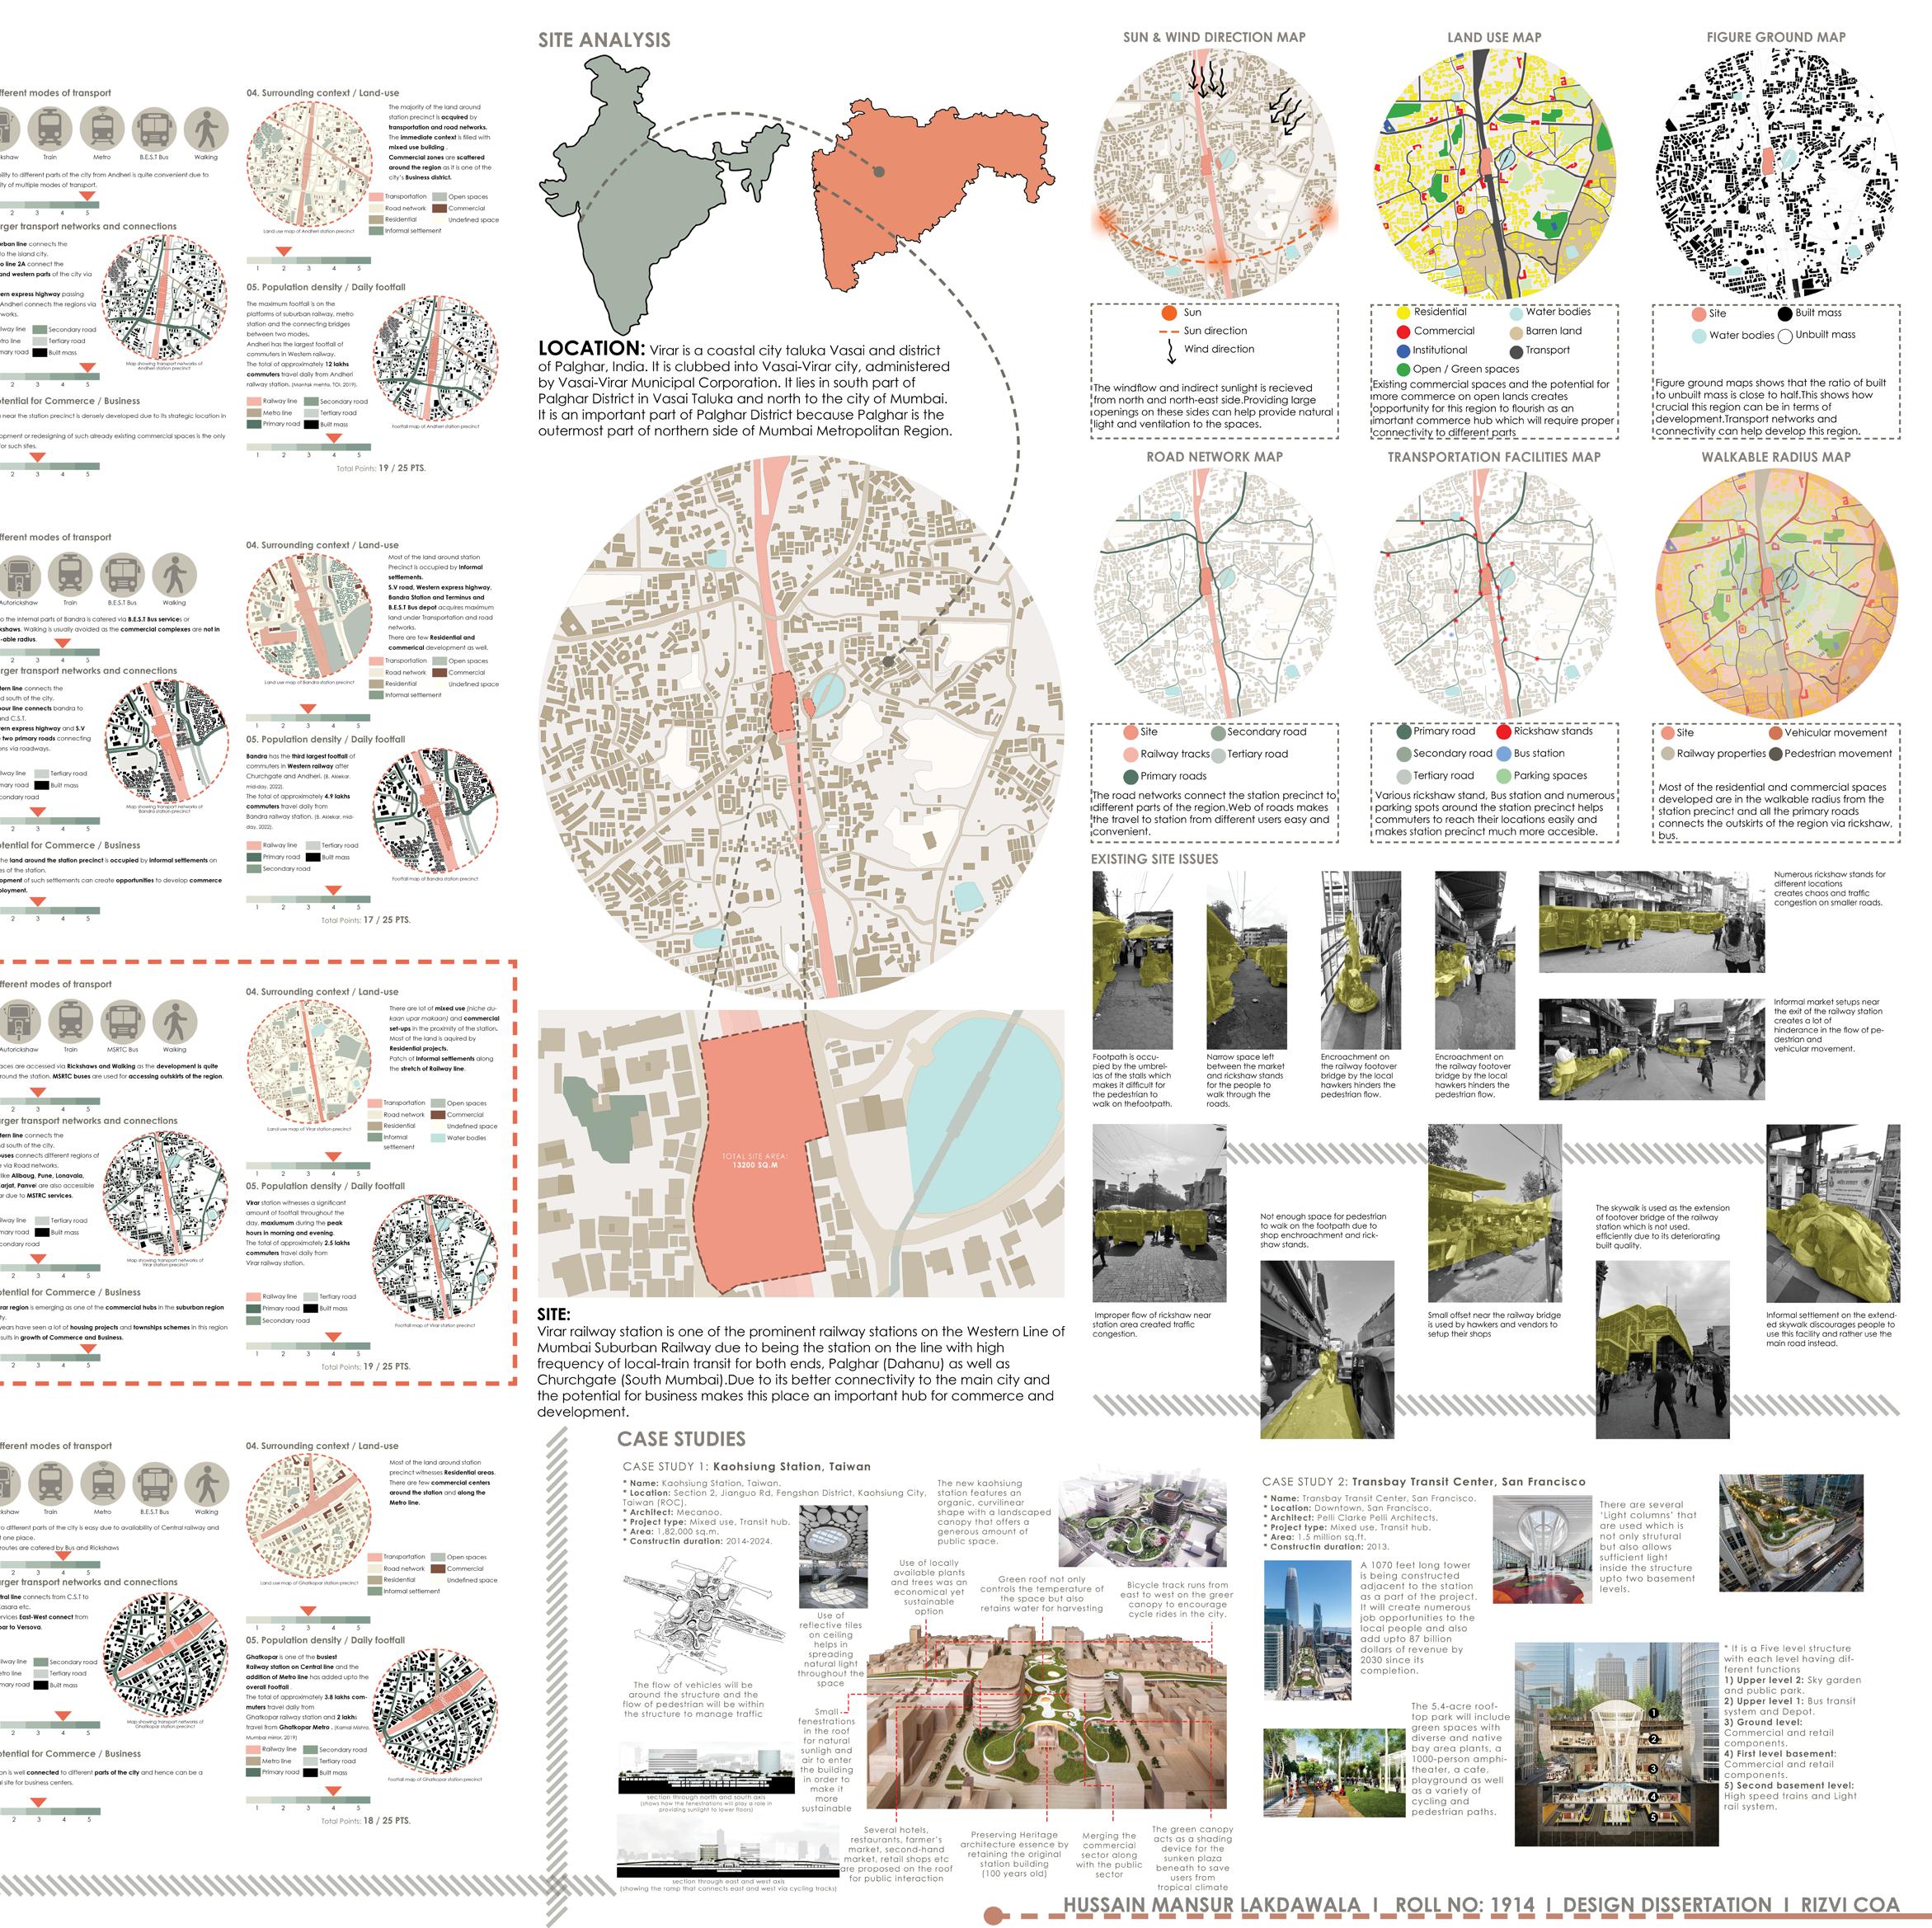
I Hussain Lakdawala I Sem IX - X I Design Dissertation I Rizvi 131
DD PANEL 1
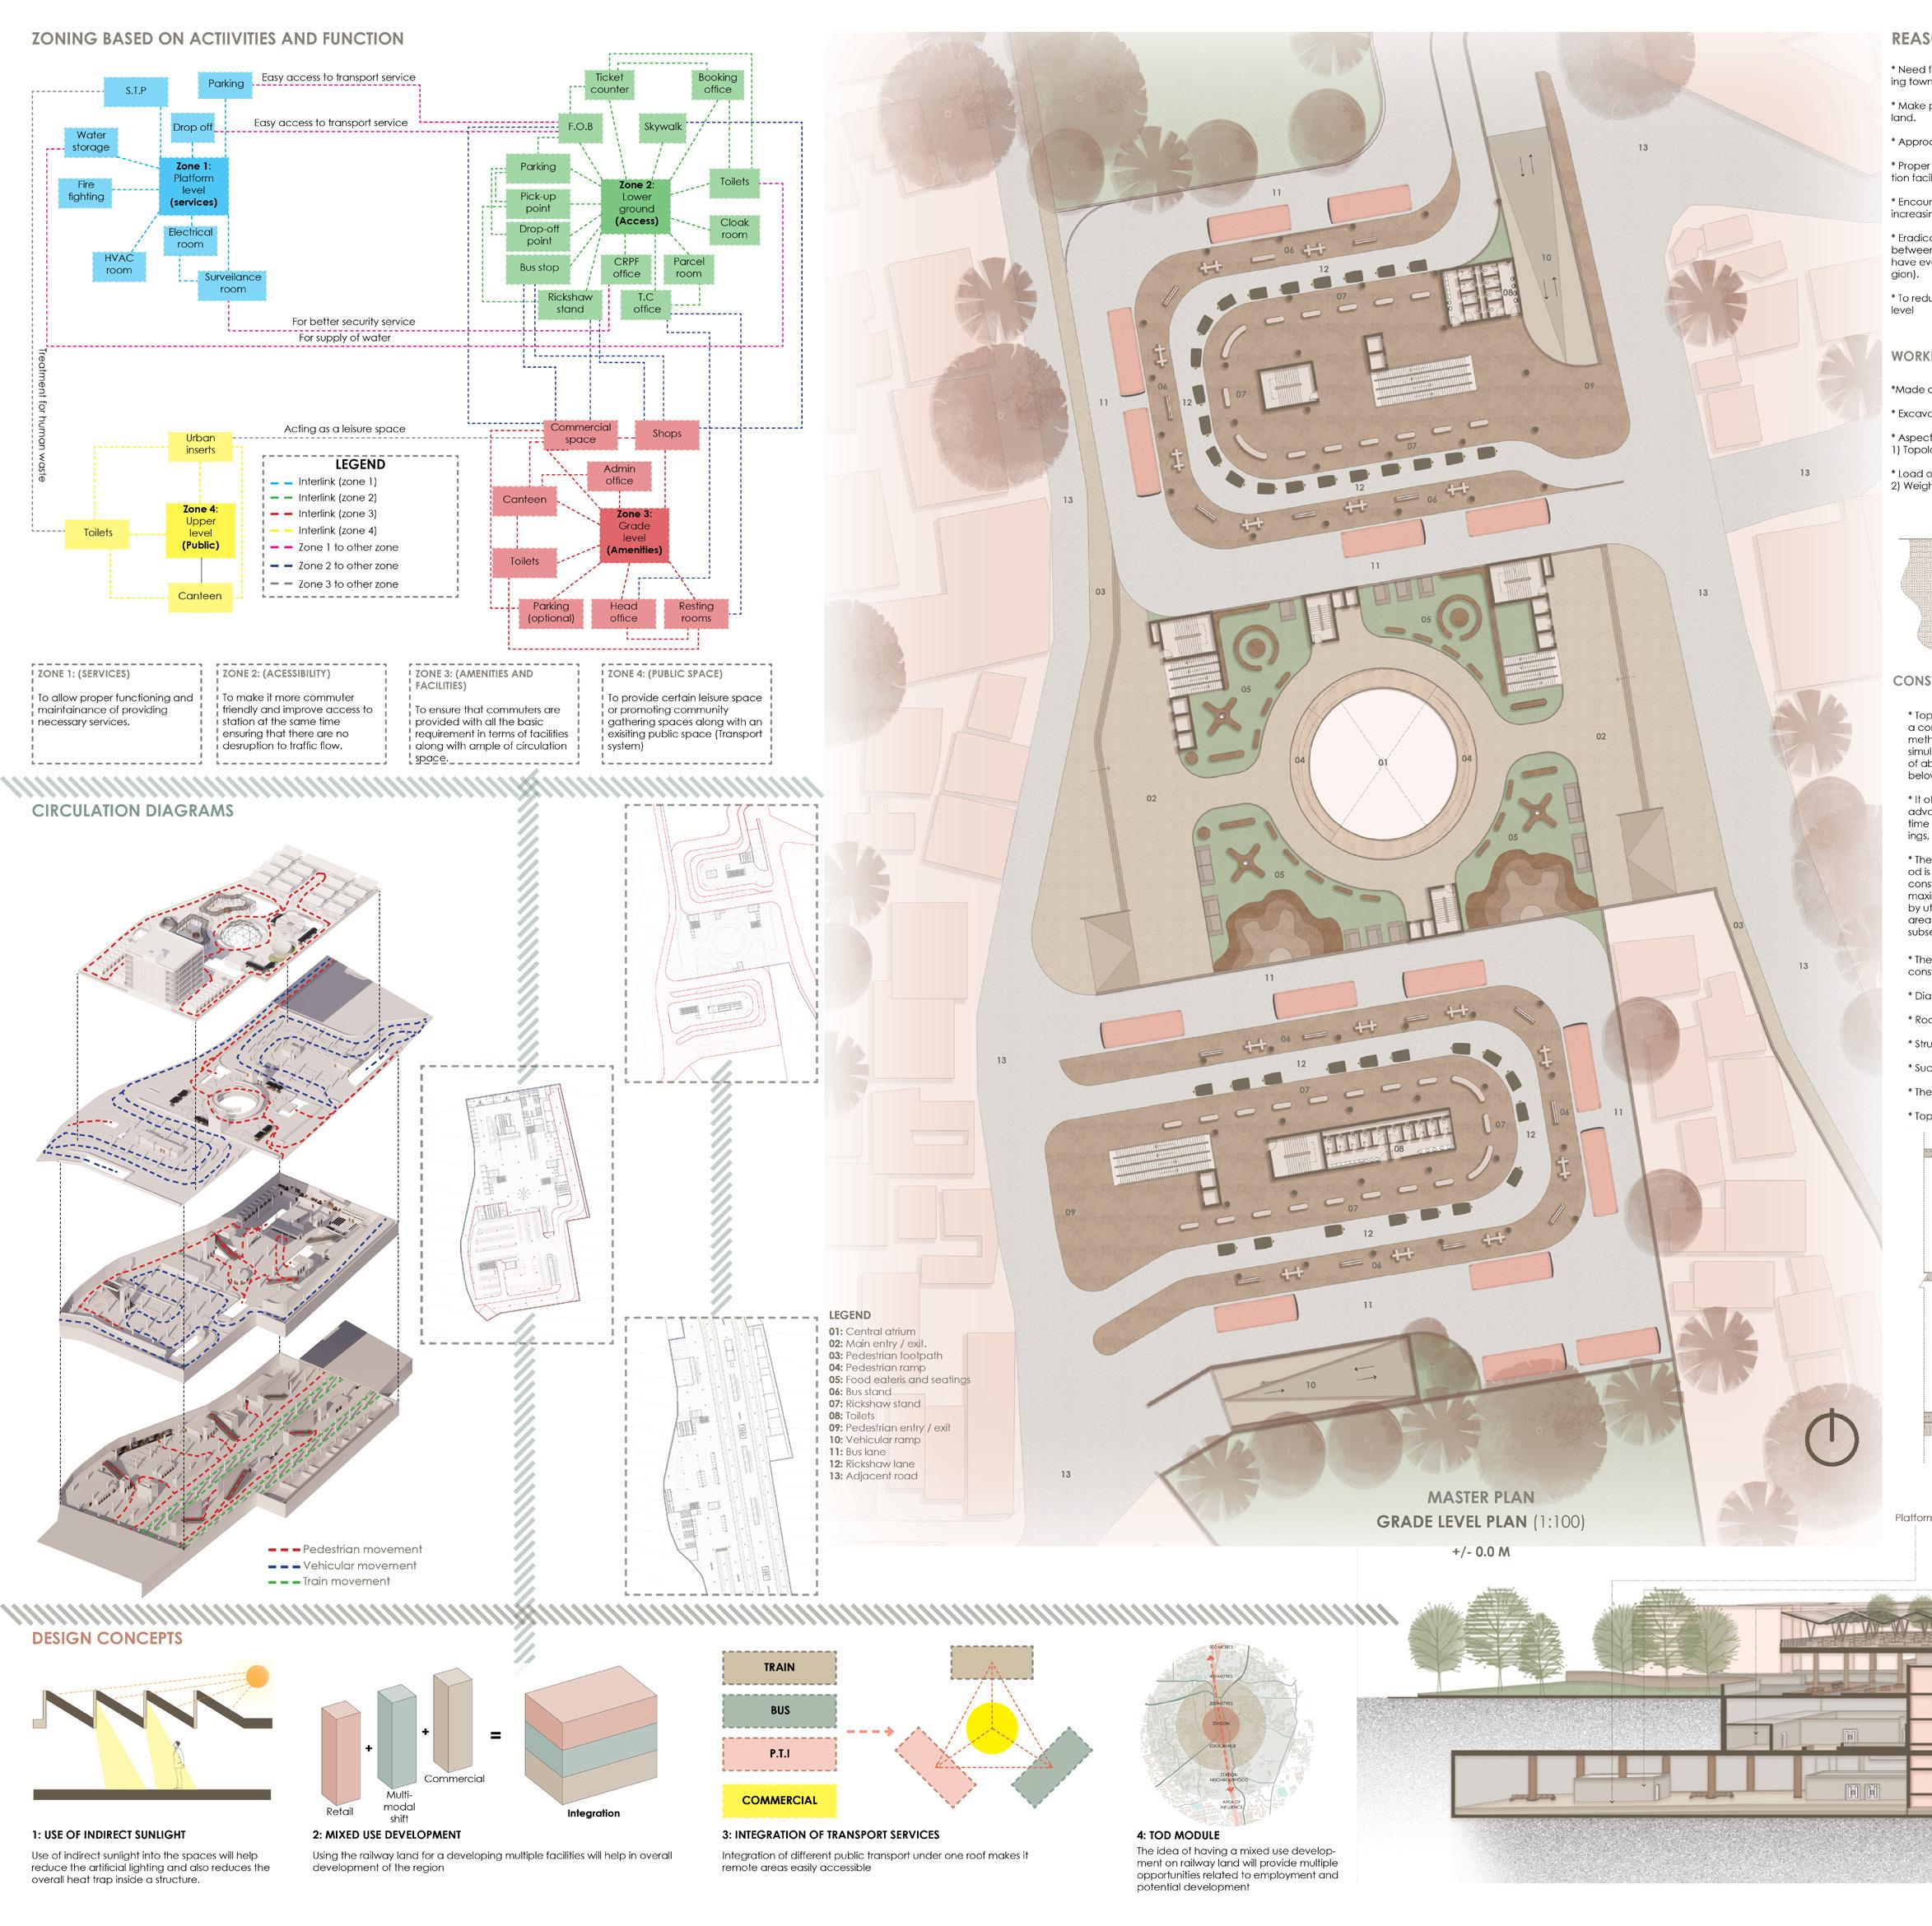
I Hussain Lakdawala I Sem IX - X I Design Dissertation I Rizvi 132
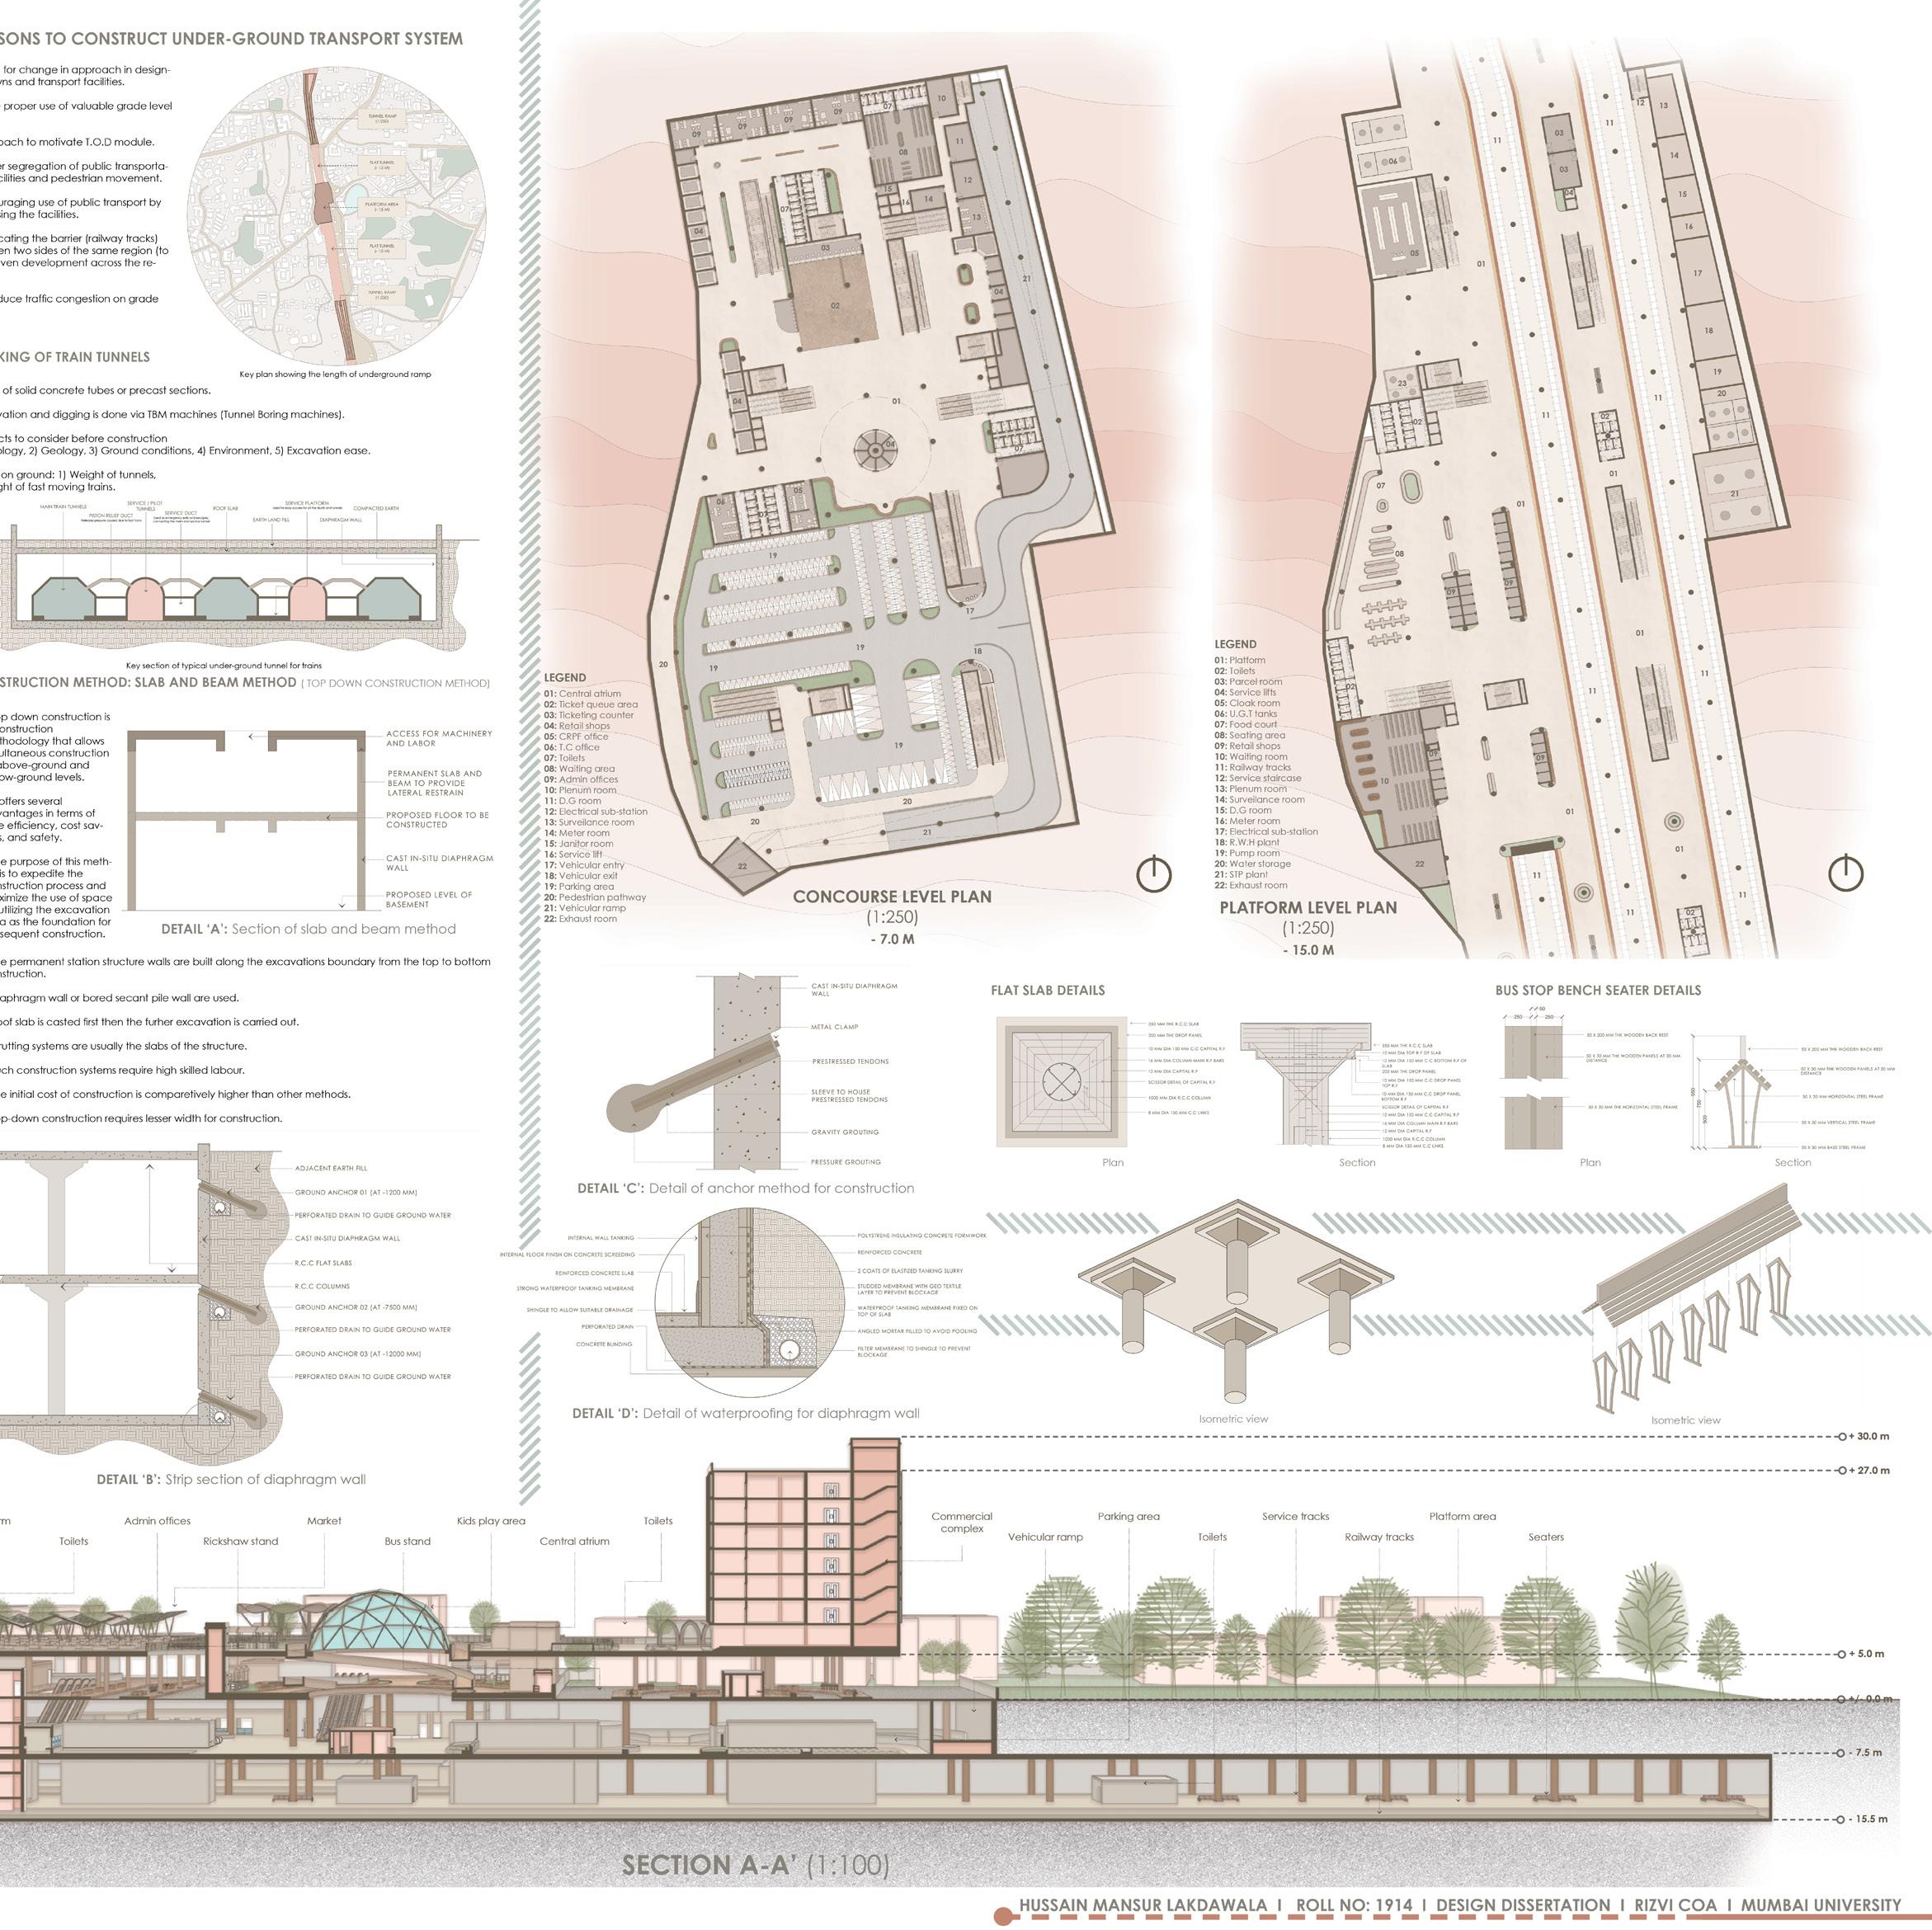
I Hussain Lakdawala I Sem IX - X I Design Dissertation I Rizvi 133
DD PANEL 2
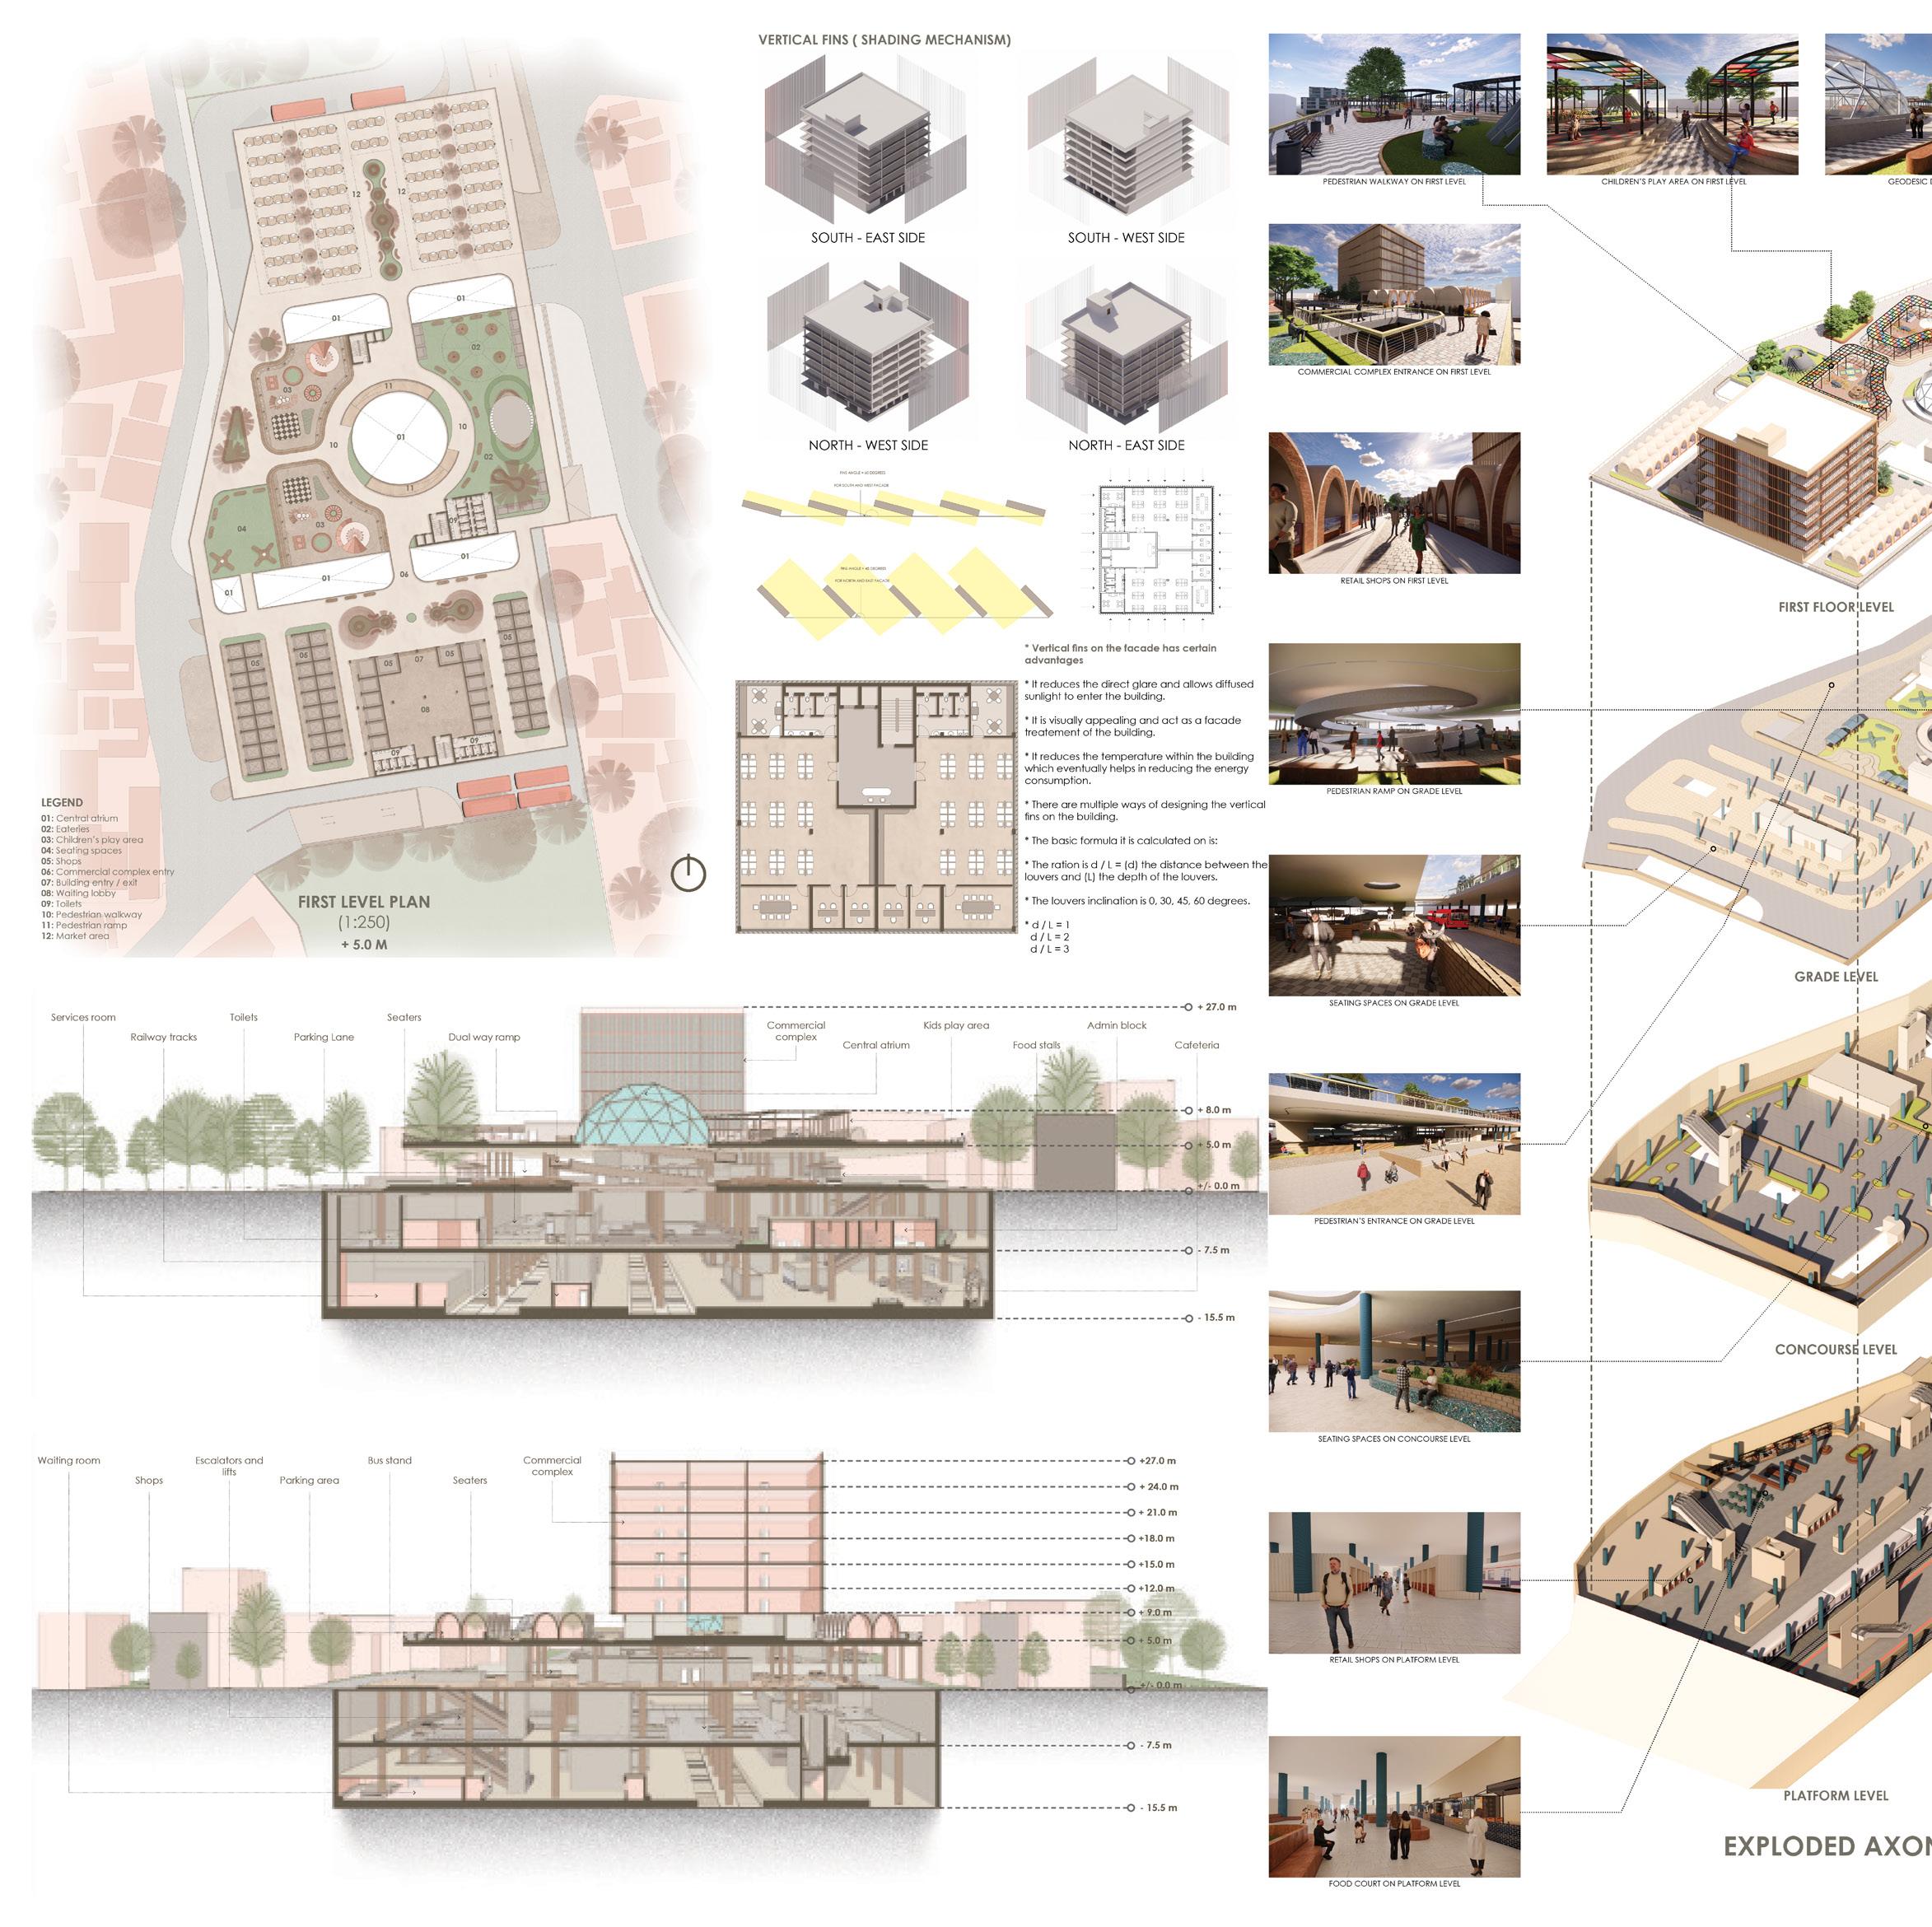
I Hussain Lakdawala I Sem IX - X I Design Dissertation I Rizvi 134
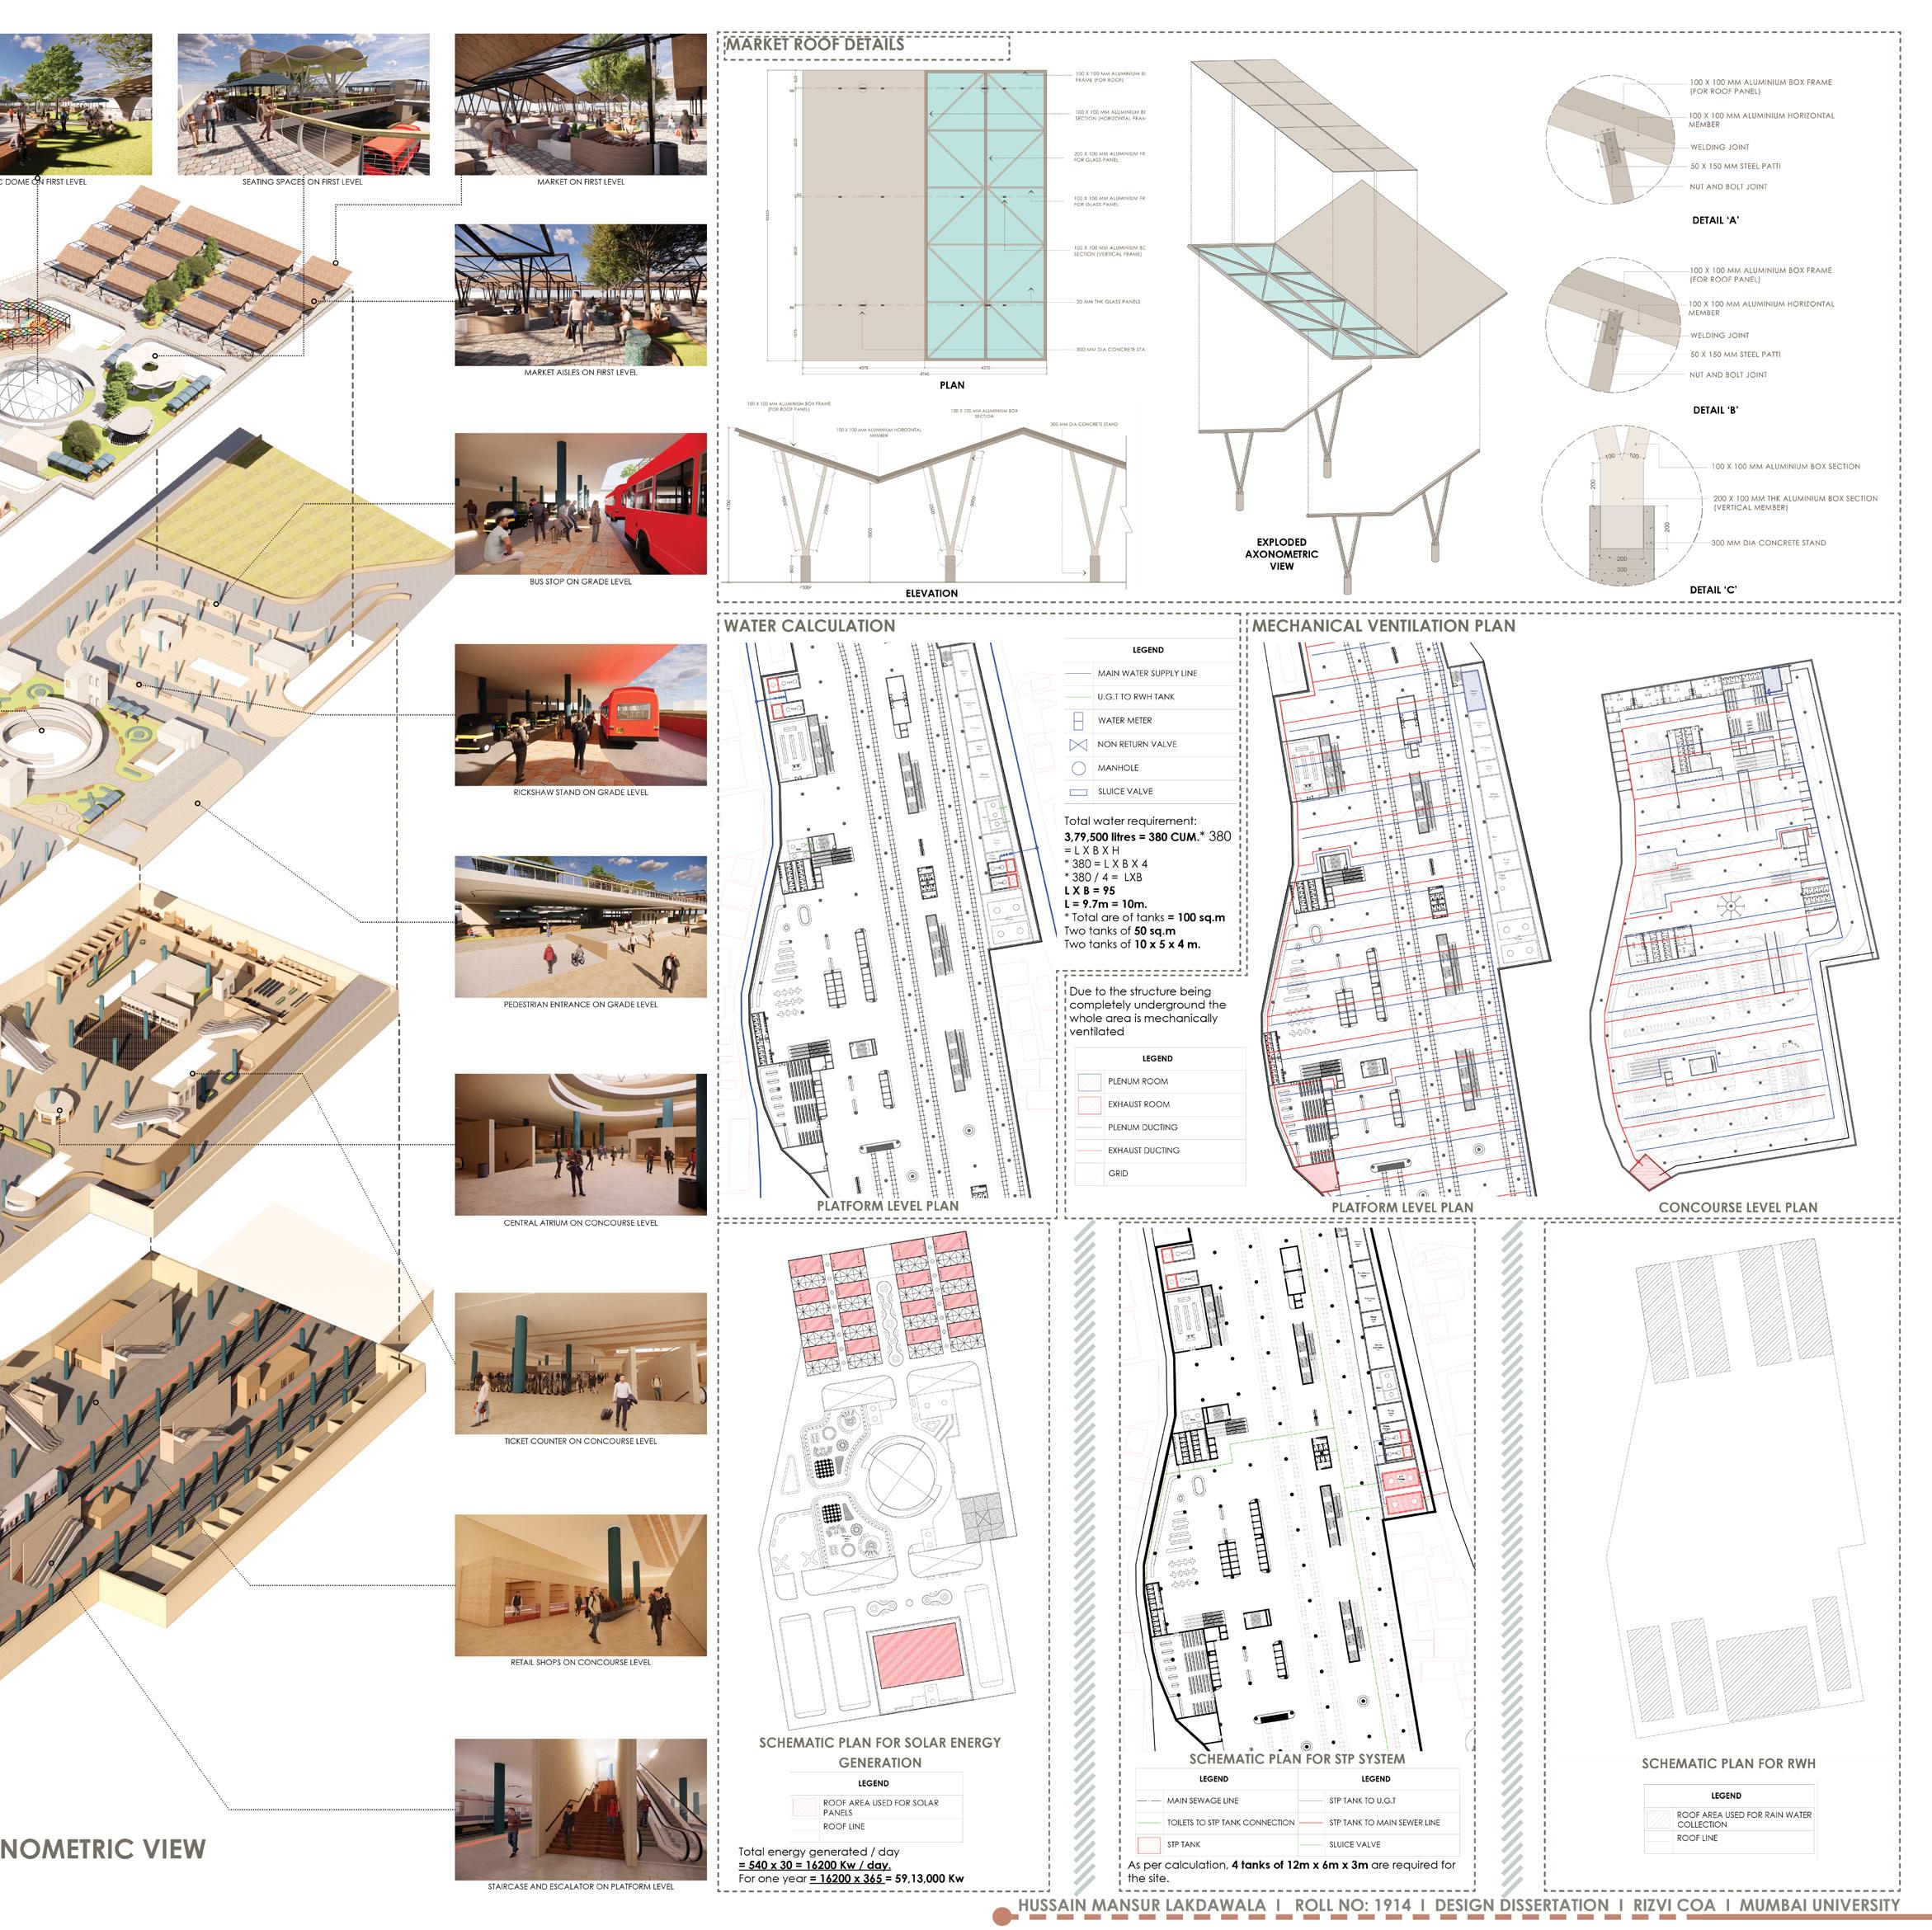
I Hussain Lakdawala I Sem IX - X I Design Dissertation I Rizvi 135
DD PANEL 3


