
March 2024
Most agents know what’s happening.
Good agents understand what’s happening. Great agents can explain what’s happening.


Mortgage Rates
What Determines the Mortgage Rate?
The 10-Year Yield and the Spread Above It
Spread (Difference Between the Mortgage Rate and the 10-Year Yield)
10-Year Treasury Yield
4.21 2.89 Actual Rate Friday, 3/1/2024
Source: Freddie Mac and CNBC
Mortgage Rate 7.1%

A primary driver of the increase in the yield over 2023 was inflation expectations.
. . .
So the higher the current rate of inflation and, more importantly, the higher the expected future rates of inflation, the higher the yield on the 10-year as investors demand to be compensated for that inflation risk into the future.
- Mark Fleming, Chief Economist, First American
CPI History Pausing Rate Cuts Today
Source: The Fed
Core Price Index Challenges in
Late 1970s Causing Concerns Today -4.0 -2.0 0.0 2.0 4.0 6.0 8.0 10.0 12.0 14.0 16.0 1970 1980 1990 Today 2010 2000
the
Consumer Price Index Pausing Rate Cuts
Source: The Fed
Challenges Over the Last Few Months Causing Concerns Today 2.0 3.0 4.0 5.0 6.0 7.0 8.0 9.0 10.0 June 2022 June 2023 Today
Policymakers now risk committing another policy error, this time by waiting too long to begin cutting interest rates. It is unclear why Fed officials feel it necessary to take this risk. After all, they’ve all but achieved their dual mandates of a full-employment economy and low and stable inflation.
- Mark Zandi, Chief Economist, Moody’s Analytics
Mortgage Rate Projections
Fannie Mae
Quarter December 2023 February 2024 2024 Q1 7.0% 6.5% 2024 Q2 6.8% 6.3% 2024 Q3 6.6% 6.1% 2024 Q4 6.5% 5.9%

“A leader is one who knows the way, goes the way, and shows the way.”
- John Maxwell

The Economy
More Economists Now See “Soft Landing”
Percent of Economists Seeing a Recession in the Next 12 Months
January 2023
61%
39%
January 2024
39%
61%
No on Recession in Next 12 Months
Yes on Recession in Next 12 Months
No on Recession in Next 12 Months
Yes on Recession in Next 12 Months
Source: Wall Street Journal
Source: Wall Street Journal Unemployment Expected To Stay Below 5% Economists Projections for Unemployment Rates 4.11% 4.30% 4.22% 4.13% 4.04% 3.99% June 2024 December 2024 June 2025 December 2025 June 2026 December 2026

At least right now, the fundamentals of the economy, despite some hiccups, are doing pretty good. While things are far from perfect, the economy is probably doing better than people want to give it credit for.
- Jacob Channel, Senior Economist, LendingTree

Foreclosures
-2.2%*
-17.2%
Source: Black Knight
All Foreclosure Metrics Are Down Each Metric Shows December Compared to Previous Year
Inventory Foreclosure
-17.9% Active Foreclosure
Sales Foreclosure Starts
* 25% below prepandemic levels
U.S. Foreclosure Activity Increases From 2022 But Still Below Pre-Pandemic Levels
Source: ATTOM
U.S. Properties with Foreclosure Filings 533K 718K 1.3M 2.3M 2.8M 2.9M 1.9M 1.8M 1.4M 1.1M 1.1M 933K 677K 624K 493K 214K 151K 324K 357K 2005 2006 2007 2008 2009 2010 2011 2012 2013 2014 2015 2016 2017 2018 2019 2020 2021 2022 2023
1,450,749
676,535 624,753 493,066 214,323 151,153 324,237 357,062 2017 2018 2019 2020 2021 2022 2023 Short 383,795 Foreclosures Short 446,965 Foreclosures Short 241,056 Foreclosures Short 105,052 Short 273,881 Foreclosures Source: ATTOM
1M Fewer Foreclosures in
Properties with Foreclosure Filings
(Average: 2017 – 2019)
Over
Last 5 Years U.S.
598,118
Fewer Foreclosures in Last 5 Years
The prospect of any kind of nearterm surge in foreclosure activity remains low, with start volumes still nearly 40% below prepandemic levels.
- Black Knight, December 2023, Mortgage Monitor

Equity
Americans Sitting on Tremendous Equity
67.4% Have Paid off Their Mortgage or Have at Least 50% Equity
28.7%
38.7% Mortgage Homes w/ > 50% Equity
Own the Home Free and Clear
33.0%
Mortgage Homes w/ < 50% Equity
Source: Census, ATTOM


Home Prices Final 2023 Home Price Appreciation & A Peek Ahead To 2024
Consumer Confidence in Home Prices
Source: Fannie Mae
0% 5% 10% 15% 20% 25% 30% 35% 40% Jan '15 Jan '16 Jan '17 Jan '18 Jan '19 Jan '20 Jan '21 Jan '22 Jan '23 Jan '24
Percent Who Believe Home Prices Will Go Down in the Next 12 Months
Pandemic
Talk of Repeat of 2008 Crash


> 1 of 5 Still Believe Prices Will Depreciate


Case-Shiller: Prices
Month-Over-Month Percent Change in Home Values (Seasonally Adjusted)
-0.2 0.2 0.4 0.5 0.7 0.7 0.6 0.9 0.7 0.6 0.2 0.2 Jan '23 Feb Mar Apr May Jun Jul Aug Sep Oct Nov Dec
Final 2023 Home Price Appreciation Rates
December 2022 – December 2023 Price Change
Case-Shiller 5.5%
CoreLogic 5.5%
Black Knight 5.6%
Freddie Mac 7.0%
FHFA 6.6%
%
Entity
Increase
Source: Case-Shiller
Final 2023 Percent Appreciation in the SA Case-Shiller 20-City Index Metro % Change Metro % Change Atlanta 6.3% Miami 7.8% Boston 7.2% Minneapolis 2.9% Charlotte 8.0% New York 7.6% Chicago 8.1% Phoenix 3.8% Cleveland 7.4% Portland 0.3% Dallas 2.1% San Diego 8.8% Denver 2.3% San Francisco 3.2% Detroit 8.3% Seattle 3.0% Las Vegas 4.2% Tampa 4.1% Los Angeles 8.3% Washington, D.C. 5.1% U.S. National: 5.5%
Case-Shiller 2023 Home Price Appreciation
Looking back at the year, 2023 appears to have exceeded average annual home price gains over the past 35 years . . . While we are not experiencing the double-digit gains seen in the previous two years, above trend growth should be well received considering the rising costs of financing home mortgages.
- Brian D. Luke, Head of Commodities, S&P Dow Jones Indices
Percent of Annual Home Appreciation
Source: Freddie Mac
-15% -10% -5% 0% 5% 10% 15% 20% 1980 1990 2000 2010 2023 Each December as compared to previous December 4.86% 43-Year Average
1980–2023, Seasonally Adjusted, Rounded To Nearest Full Number
FHFA: Prices
Month-Over-Month Percent Change in Home Values (Seasonally Adjusted)
0.1 0.5 0.6 0.8 0.8 0.5 0.8 0.7 0.6 0.3 0.3 0.1 Jan '23 Feb Mar Apr May Jun Jul Aug Sep Oct Nov Dec
House prices rose in 49 states between Q4 of 2022 and Q4 2023 . . . (Hawaii, -3.4%) . . .
House prices rose in 96 of the top 100 largest metropolitan areas over the last four quarters . . .
All nine census divisions had positive house price changes year-over-year.
- FHFA Home Price Index
Percent Change in Home Prices
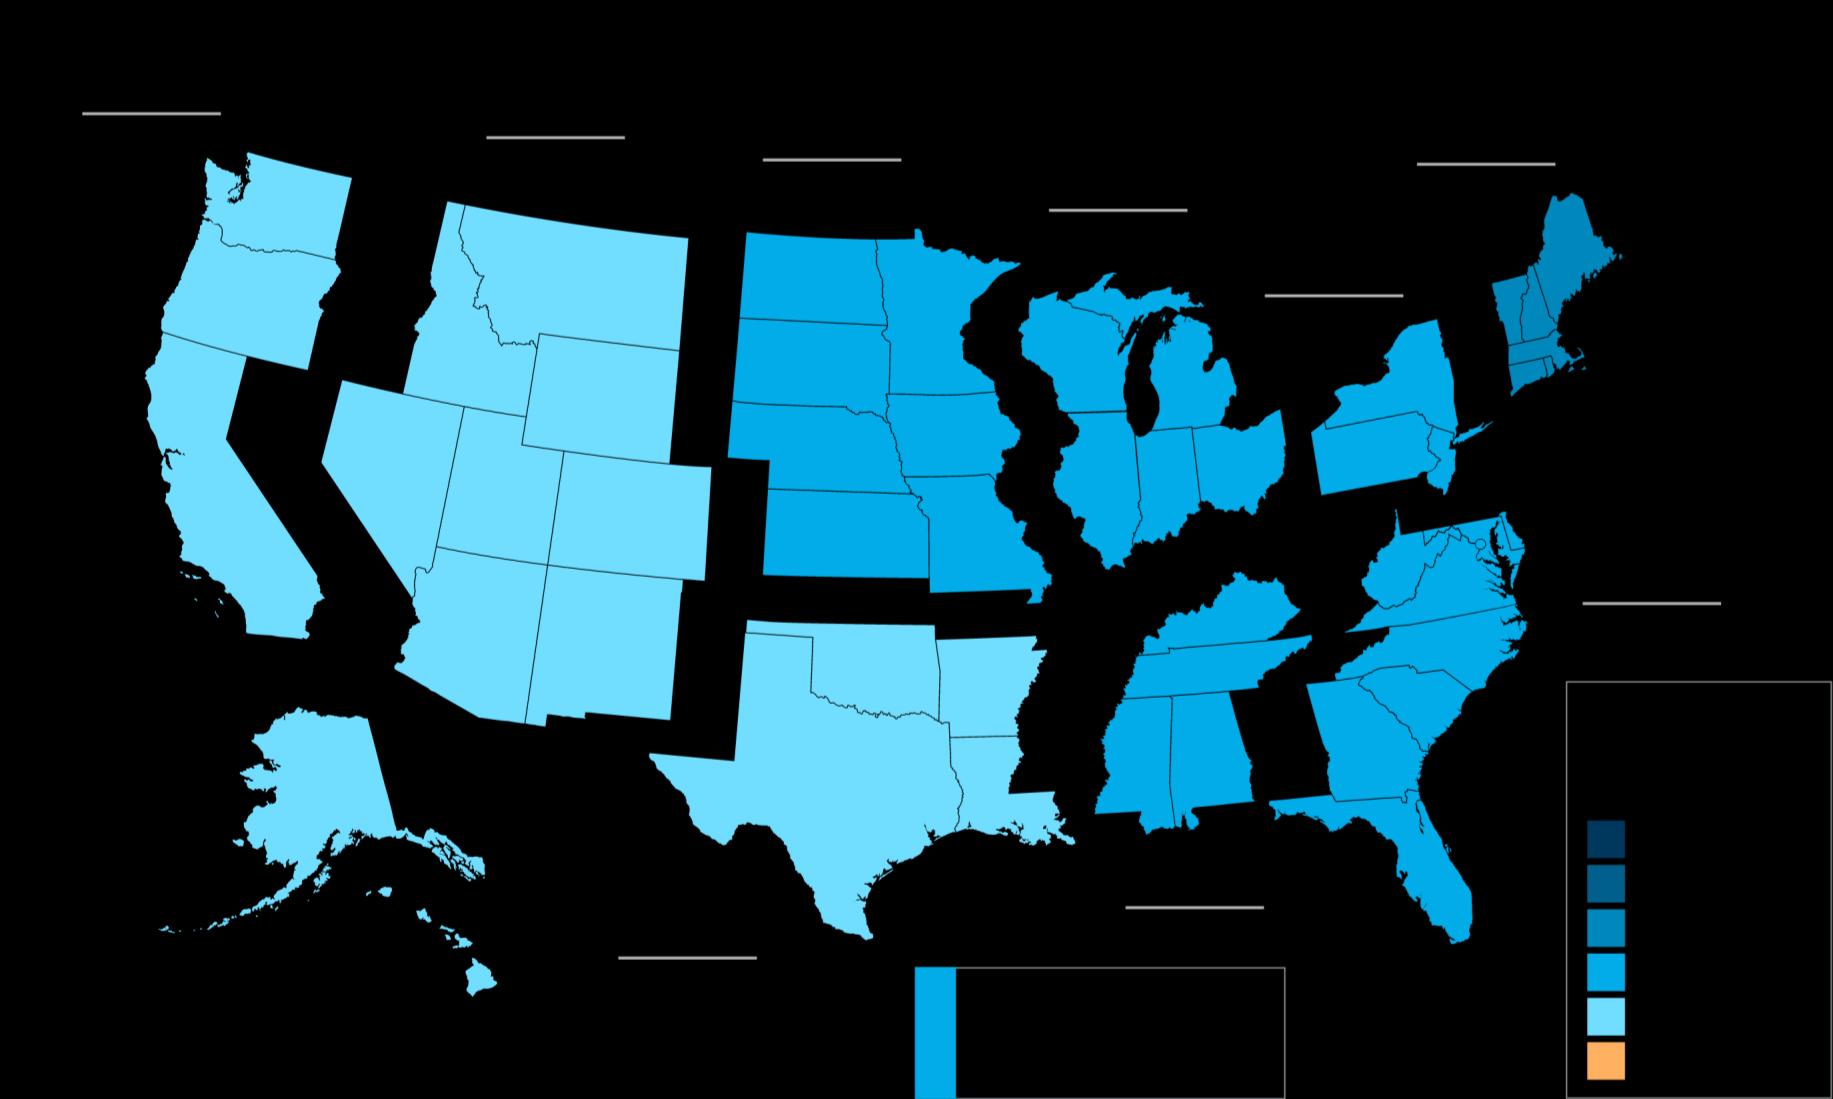
Source: FHFA
Year-Over-Year, Q3 2023
Percent Change in Home Prices

Source: FHFA
Year-Over-Year, Q4 2023
Percent Change in Home Values
-0.2 0.2 0.4 0.5 0.7 0.7 0.6 0.9 0.7 0.6 0.2 0.2 Case-Shiller 0.1 0.5 0.6 0.8 0.8 0.5 0.8 0.7 0.6 0.3 0.3 0.1 Jan '23 Feb Mar Apr May Jun Jul Aug Sep Oct Nov Dec
FHFA Month-Over-Month

Home Prices Going Forward


As mortgage rates continue to hover in the 7% range, it will be difficult to convince existing homeowners to move at the current time. Nevertheless, as recent surge in mortgage application data has shown, following a drop in rates, buyers are anxiously waiting to jump into the market. That means that 2024 is likely to show another year of home price highs.
- Selma Hepp, Chief Economist, CoreLogic
2024 Home Price Forecasts
Percent Appreciation/Depreciation as of 2/26/2024 3.2 5.5 4.1 3.5 3.2 2.6 2.4 1.4 Average of All 7 Goldman Sachs MBA Zillow Fannie Mae Freddie Mac HPES NAR
2024 Home Price Forecasts
Forecasts from 11/2023 vs. Current Forecasts
Entity Original Forecast Current Forecast Goldman Sachs 1.9% 5.5% Mortgage BankersAssociation 1.1% 4.1% Zillow 0.2% 3.5% Fannie Mae 2.8% 3.2% Freddie Mac 2.6% 2.6% Home Price Expectation Survey 2.2% 2.4% National Association of Realtors 0.7% 1.4%


Home Price Expectation Survey
A nationwide panel of over one hundred economists, real estate experts and investment & market strategists.

Estimated Home Price Performance
Pre-Bubble Bubble Bust Recovery To Date 3.78% 3.36% 3.87% 4.18% 4.11% 2024 2025 2026 2027 2028 Source: HPES
December – December, as Forecast in Q1 2024
Potential growth in household wealth over the next 5 years based solely on increased home equity if you purchase a $400K home in January 2024 Pre-Bubble
Based on price appreciation projected by the Home Price Expectation Survey
Source: HPES
Bubble Bust Recovery To Date $400,000 $415,120 $429,068 $445,673 $464,302 $483,385 2024 2025 2026 2027 2028 2029
$83,385
90-Day Work Plan
▪ Stay on Top of Mortgage Rates
▪ Be Able To Speak to the Economy
▪ Understand the Foreclosure Numbers
▪ Promote Home Price Stability
▪ Work!
DEEP DIVE THE

4
5
6
7
8
9
https://www.cnbc.com/quotes/US10Y
https://www.freddiemac.com/home
https://blog.firstam.com/reconomy-podcast/is-the-housingmarket-poised-to-rebound-in-2024
https://fred.stlouisfed.org/graph/?g=rocU#0
https://fred.stlouisfed.org/graph/?g=rocU#0
https://www.inquirer.com/economy/federal-reserve-waitingto-cut-rates-recession-unemployment-housing-costs20240222.html
https://www.fanniemae.com/media/49866/display
https://www.fanniemae.com/media/50406/display 12
https://www.wsj.com/economy/economic-forecastingsurvey-archive-11617814998
Resources Slide(s) Description Link(s)
What Determines Mortgage Rate Graph
Mark Fleming Quote
CPI Rate Cuts Graph
Consumer Price Index Graph
Mark Zandi Quote
Mortgage Rate Projections Table
Economists See Soft Landing Pie Charts
13
https://www.wsj.com/economy/economic-forecastingsurvey-archive-11617814998
14
https://www.builderonline.com/data-analysis/how-theelection-and-unemployment-could-impact-the-2024housing-market_c 16
https://www.blackknightinc.com/wpcontent/uploads/2024/02/ICE_MM_FEB2024_Report.pdf
17-18
https://www.attomdata.com/news/markettrends/foreclosures/attom-2023-year-end-u-s-foreclosuremarket-report/
https://www.blackknightinc.com/wpcontent/uploads/2024/02/ICE_MM_FEB2024_Report.pdf
https://data.census.gov/cedsci/all?q=mortgage
https://www.attomdata.com/news/market-trends/homesales-prices/attoms-q4-2023-home-equity-and-underwaterreport/
https://www.fhfa.gov/Media/Blog/Pages/HomeownersEquity-Remains-High.aspx
Resources Slide(s) Description Link(s)
Unemployment Below 5% Graph
Jacob Channel
Quote
Foreclosure Metrics Down Graph
ForeclosureActivity Below Pre-Pandemic Levels Graphs
Black Knight Quote
19
Americans Tremendous Equity Pie Chart
21
https://www.fanniemae.com/research-and-insights/surveysindices/national-housing-survey
https://www.spglobal.com/spdji/en/indices/indicators/spcorelogic-case-shiller-us-national-home-price-nsaindex/#news-research
https://www.spglobal.com/spdji/en/documents/indexnews/a nnouncements/20240227-1470765/1470765_cshomepricerelease-0227.pdf
https://www.businesswire.com/news/home/2024022038888 0/en/Peak-National-House-Price-Appreciation-May-beBehind-Us-According-to-First-American-Data-AnalyticsMonthly-Home-Price-Index-Report
https://www.corelogic.com/category/intelligence/reports/ho me-price-insights/
https://www.blackknightinc.com/wpcontent/uploads/2024/02/ICE_MM_FEB2024_Report.pdf
https://www.freddiemac.com/research/indices/house-priceindex
https://www.spglobal.com/spdji/en/documents/indexnews/a nnouncements/20240227-1470765/1470765_cshomepricerelease-0227.pdf
Slide(s) Description Link(s)
Consumer Confidence in Prices Graph
Resources
23
25 Case-Shiller: Prices Graph
26 2023 Final Appreciation Rates Table
27 Case-Shiller 2023 Appreciation Table
https://www.spglobal.com/spdji/en/documents/indexnews/a nnouncements/20240227-1470765/1470765_cshomepricerelease-0227.pdf
29
https://www.freddiemac.com/research/indices/house-priceindex 30
https://www.fhfa.gov/DataTools/Downloads/Pages/HousePrice-Index.aspx
https://www.fhfa.gov/AboutUs/Reports/ReportDocuments/H PI_2023Q4.pdf
32-33
https://www.fhfa.gov/DataTools/Tools/Pages/House-PriceIndex-(HPI).aspx 34
https://www.spglobal.com/spdji/en/indices/indicators/spcorelogic-case-shiller-us-national-home-price-nsaindex/#news-research
https://www.fhfa.gov/DataTools/Downloads/Pages/HousePrice-Index.aspx 36
https://www.corelogic.com/intelligence/us-corelogic-caseshiller-index-continues-strengthen-with-annual-gaindecember/
Resources Slide(s) Description Link(s)
Brian Luke Quote
28
Home Appreciation Graph
FHFA: Prices Graph
FHFA Home Price Index Quote
31
FHFA Maps
Home Values Graph
Selma Hepp Quote
37-38
40-41
https://twitter.com/NewsLambert/status/1762144404448461 232
https://www.mba.org/news-and-research/forecasts-andcommentary/mortgage-finance-forecast-archives
https://www.zillow.com/research/2024-housing-predictions33447/
https://www.fanniemae.com/media/50406/display
https://www.freddiemac.com/research/forecast/20240226us-economy-defied-expectations
https://pulsenomics.com/surveys/
https://cdn.nar.realtor//sites/default/files/documents/forecast -q1-2024-us-economic-outlook-01-26-2024.pdf
https://pulsenomics.com/surveys/#home-price-expectations
Resources Slide(s) Description Link(s)
2024 Home Price Forecasts Graph & Table
Estimated Home Price Performance Graphs

Updates
53
54-56, 63, 65, 66, 73-76
57-59
60
61-62
https://www.nar.realtor/research-and-statistics/researchreports/realtors-confidence-index
https://www.nar.realtor/topics/existing-home-sales
http://www.census.gov/construction/nrs/pdf/newressales.pdf
http://www.census.gov/newhomesales
http://www.census.gov/construction/nrs/pdf/newressales.pdf
https://www.nar.realtor/topics/existing-home-sales
https://www.nar.realtor/research-and-statistics/housingstatistics/pending-home-sales
67-69
https://www.spglobal.com/spdji/en/indices/indicators/spcorelogic-case-shiller-20-city-composite-home-price-nsaindex/#news-research 70
https://www.corelogic.com/intelligence/u-s-home-priceinsights/
Description Link(s)
Resources Slide(s)
Confidence Index
Existing Home Sales
New
Home Sales
Total Home Sales
Pending Home Sales
Case Shiller
CoreLogic Price Forecast
72-78 Inventory
80 Showing Activity
82, 83, 85, 86 Mortgage Rates
84 Mortgage Rate Projections
https://www.nar.realtor/topics/existing-home-sales
http://www.census.gov/construction/nrs/pdf/newressales.pdf
https://www.realtor.com/research/data/
https://www.showingtime.com/blog/
http://www.freddiemac.com/pmms/pmms_archives.html
http://www.freddiemac.com/research/forecast/
https://www.mba.org/news-research-andresources/research-and-economics/forecasts-andcommentary
http://www.fanniemae.com/portal/researchinsights/forecast.html
https://www.mba.org/news-research-andresources/research-and-economics/forecasts-andcommentary
https://www.nar.realtor/research-and-statistics
88, 89 Mortgage Credit Availability
https://www.mba.org/news-research-andresources/newsroom
https://www.mba.org/news-research-andresources/research-and-economics/single-familyresearch/mortgage-credit-availability-index
Description
Resources Slide(s)
Link(s)

Home Sales
41 41 36 29 27 26 24 22 22 21 21 21 21 20 18 17 17 17 17 17 17 18 18 19 19 18 17 17 16 14 14 16 19 24 26 33 34 29 22 18 18 20 20 21 23 25 29 36 Jan-20 Feb Mar Apr May June July Aug Sept Oct Nov Dec Jan-21 Feb Mar Apr May June July Aug Sept Oct Nov Dec Jan-22 Feb Mar Apr May June July Aug Sept Nov Dec Jan-23 Feb Mar Apr May June July Aug Sept Oct Nov Dec Jan-24 Source: NAR Average Days on the Market
January 2024
Existing Home Sales
Source: NAR
Since January 2014 3,800,000 4,300,000 4,800,000 5,300,000 5,800,000 6,300,000 6,800,000 Jan 2014 Jan 2015 Jan 2016 Jan 2017 Jan 2018 Jan 2019 Jan 2020 Jan 2021 Jan 2022 Jan 2023 Jan 2024
Existing Home Sales
Year-Over-Year, by Region
Source: NAR
-1.7% -5.9% -3.1% -1.6% 4.3% U.S. Northeast Midwest South West West
Existing Home Sales
Source: NAR
In Thousands 0 100 200 300 400 500 600 January February March April May June July August September October November December 2022 2023 2024
New Home Sales
Source: Census
Annualized in Thousands 360 460 560 660 760 860 960 1060 jun-14 Jan15 Jan16 Jan17 Jan18 Jan19 Jan20 Jan21 Jan22 Jan23 Jan24
New Home Sales
Percent
Source: Census
500 Units or Less
0.5 Percent 0% 8% 17% 11% 12% 8% Under $150K $150-$199K $200-299K $300-$399K $400-$499K $500-$749K Over $750K * 1%
of Distribution by Price Range * Less Than
Than
New Homes Selling Fast
Source: Census
Median Months from Completion to Sold 3.2 3.6 3.6 3.4 3.5 3.6 3.4 3.2 3.5 3.1 3.2 3.0 3.4 3.4 3.4 3.3 3.6 4.2 4.3 4.5 4.5 4.2 4.0 3.6 3.2 3.7 5.1 4.9 4.5 4.1 4.5 3.6 3.1 2.5 2.9 3.2 2.8 2.7 3.5 3.5 2.8 2.9 2.4 1.9 1.5 1.5 1.7 1.9 2.4 2.6 2.7 2.5 2.8 2.6 2.3 2.3 2.3 2.5 2.7 2.5 2.8 Jan-19 Feb Mar Apr May Jun Jul Aug Sept Oct Nov Dec Jan-20 Feb Mar Apr May June July Aug Sept Oct Nov Dec Jan-21 Feb Mar Apr May June July Aug Sept Oct Nov Dec Jan-22 Feb Mar Apr May June July Aug Sept Oct Nov Dec Jan-23 Feb Mar Apr May June July Aug Sept Oct Nov Dec Jan-24
Total Home Sales
Source: Census
In Thousands 422 423 524 517 557 575 495 528 477 419 372 374 286 325 421 397 475 491 432 453 403 383 342 347 291 January February March April May June July August September October November December 2022 2023 2024
Source: NAR
Sales 60 70 80 90 100 110 120 130 140 January 2012 January 2013 January 2014 January 2015 January 2016 January 2017 January 2018 January 2019 January 2020 January 2021 January 2022 January 2023 January 2024 100 = Historically Healthy Level
Pending Home
Pending Home Sales
Year-Over-Year by Region
Source: NAR
100 = Historically Healthy Level -8.8% -5.5% -11.6% -9.0% -7.0% U.S. Northeast Midwest South West
Source: NAR Percentage of Distressed Property Sales Distressed Sales (Foreclosures and Short Sales) Represented 2% of sales in January. 0% 5% 10% 15% 20% 25% 30% 35% Jan 2012 Jan 2013 Jan 2014 Jan 2015 Jan 2016 Jan 2017 Jan 2018 Jan 2019 Jan 2020 Jan 2021 Jan 2022 Jan 2023 Jan 2024 4%

Home Prices
Sales Price of Existing Homes
Year-Over-Year, by Region
5.1% 10.1% 7.6% 4.1% 6.3%
Source: NAR
U.S. Northeast Midwest South West
% Change in Sales
Year-Over-Year, by Price Range
Source: NAR
$0-100K $100-250K $250-500K $500-750K $750K-1M $1M+ % change in sales -13.1% -7.9% 4.6% 11.4% 22.5% 27.1% -13.1% -7.9% 4.6% 11.4% 22.5% 27.1%
Change
Home Prices
Source: S&P Case-Shiller
in
Year-Over-Year -3% 2% 7% 12% 17% 22% Jan 2013 Jan 2014 Jan 2015 Jan 2016 Jan 2017 Jan 2018 Jan 2019 Jan 2020 Jan 2021 Jan 2022 Jan 2023
Source: S&P Case-Shiller -3% 2% 7% 12% 17% 22% Jan 2015 Feb Mar Apr May Jun Jul Aug Sept Oct Nov Dec Jan 2016 Feb Mar Apr May Jun Jul Aug Sept Oct Nov Dec Jan 2017 Feb Mar Apr May Jun Jul Aug Sept Oct Nov Dec Jan 2018 Feb Mar Apr May Jun Jul Aug Sept Oct Nov Dec Jan 2019 Feb Mar Apr May Jun Jul Aug Sept Oct Nov Dec Jan 2020 Feb Mar Apr May Jun Jul Aug Sept Oct Nov Dec Jan 2021 Feb Mar Apr May June July Aug Sept Oct Nov Dec Jan 2022 Feb Mar Apr May June July Aug Sept Oct Nov Dec Jan 2023 Feb Mar Apr May June July August Sept Oct Nov Dec Change in Home Prices Year-Over-Year, 20 City Composite
Change in Home Prices
Source: S&P Case-Shiller
Year-Over-Year, 20 City Composite 18.9% 20.3% 21.1%21.2% 20.5% 18.7% 16.0% 13.1% 10.4% 8.6% 6.8% 4.6% 2.6% 1.0% 1.6% 1.7% 1.5% 0.9% 0.6% 0.4% 0.2% 0.1% -0.2%-0.3% Jan 2022 Feb Mar Apr May Jun Jul Aug Sept Oct Nov Dec Jan 2023 Feb Mar Apr May Jun Jul Aug Sept Oct Nov Dec
Source: CoreLogic
% Change in Price US Home Price Insights – December 2023 5.5% 2.8%
Forecast
Year-Over-Year
Current

Housing Inventory
Change in Inventory

Source: Realtor.com
Month-Over-Month, January 2024
Source: NAR Months Inventory of Homes for Sale 2011 - Today 1.5 2.5 3.5 4.5 5.5 6.5 7.5 8.5 9.5 January 2011 January 2012 January 2013 January 2014 January 2015 January 2016 January 2017 January 2018 January 2019 January 2020 January 2021 January 2022 January 2023 January 2024
Months Inventory of Homes for Sale
Since 2019
Source: NAR
3.8 3.6 3.8 4.2 4.3 4.3 4.2 4.0 4.0 3.9 3.7 3.0 3.1 3.1 3.3 4.0 4.6 3.9 3.1 3.0 2.7 2.5 2.3 1.9 1.9 2.0 2.1 2.3 2.5 2.5 2.6 2.6 2.4 2.4 2.1 1.7 1.6 1.7 1.9 2.2 2.6 2.9 3.2 3.2 3.2 3.3 3.3 2.9 2.9 2.6 2.6 2.9 3.0 3.1 3.3 3.3 3.4 3.6 3.5 3.1 3.0 1.5 2.0 2.5 3.0 3.5 4.0 4.5 5.0 5.5 6.0
Year-Over-Year Inventory Levels
Source: NAR
-30% -20% -10% 0% 10% 20% 30% January 2014 January 2015 January 2016 January 2017 January 2018 January 2019 January 2020 January 2021 January 2022 January 2023 January 2024
Year-Over-Year Inventory Levels
Last 12 Months
Source: NAR
15.3% 5.4% 1.0% -6.1% -13.6% -14.6% -14.1% -8.1% -5.7% 0.9% 4.2% 3.1% Feb Mar Apr Jan-24 July May June Aug Sept Oct Nov Dec
New Home Monthly Inventory
Seasonally Adjusted, Last 13 Months
Source: Census
8.5 8.1 8.4 8.1 7.6 7.2 7.5 7.1 7.9 7.5 7.9 8.9 8.3 8.3 Dec Jan 23 Feb Mar Apr May June July Aug Sept Oct Nov Dec Jan 24
New Home Monthly Inventory
Source: Census
7.9 7.6 6.9 7 6.3 7.5 7.2 8.4 8 8.9 10.9 9.2 8.1 Jan Feb Mar Apr May June July Aug Sept Oct Nov Dec 2023 2024
Non-Seasonally Adjusted

Buyer Demand
Showing Index Still Remain Above Pre-pandemic Levels
Source: ShowingTime
Showing Index over Last 7 Januarys 141.1 127.6 152.5 235.8 252.1 189.9 173.5 2018 2019 2020 2021 2022 2023 2024

Mortgage Rates
2.0 2.5 3.0 3.5 4.0 4.5 5.0 5.5 6.0 6.5 7.0 7.5 8.0 1/3/2019 1/24/2019 2/14/2019 3/7/2019 3/28/2019 4/18/2019 5/9/2019 5/30/2019 6/20/2019 7/11/2019 8/1/2019 8/22/2019 9/12/2019 10/3/2019 10/24/2019 11/14/2019 12/5/2019 12/26/2019 1/16/2020 2/6/2020 2/27/2020 3/19/2020 4/9/2020 4/30/2020 5/21/2020 6/11/2020 7/2/2020 7/23/2020 8/13/2020 9/3/2020 9/24/2020 10/15/2020 11/5/2020 11/25/2020 12/17/2020 1/7/2021 1/28/2021 2/18/2021 3/11/2021 4/1/2021 4/22/2021 5/13/2021 6/3/2021 6/24/2021 7/15/2021 8/5/2021 8/26/2021 9/16/2021 10/7/2021 10/28/2021 11/18/2021 12/9/2021 12/30/2021 1/20/2022 2/10/2022 3/3/2022 3/24/2022 4/14/2022 5/5/2022 5/26/2022 6/16/2022 7/7/2022 7/28/2022 8/18/2022 9/8/2022 9/29/2022 10/20/2022 11/10/2022 12/1/2022 12/22/2022 1/12/2023 2/2/2023 2/23/2023 3/16/2023 4/6/2023 4/27/2023 5/18/2023 6/8/2023 6/29/2023 7/20/2023 8/10/2023 8/31/2023 9/21/2023 10/12/2023 11/02/2023 11/22/2023 12/14/2023 1/4/2024 1/25/2024 2/15/2024 Source: Freddie Mac Mortgage Rates 30-Year Fixed Rate, January 2018–Today 6.94%
2.0 2.5 3.0 3.5 4.0 4.5 5.0 5.5 6.0 6.5 7.0 7.5 8.0 Source: Freddie Mac Mortgage Rates 30-Year Fixed Rate, January 2016–Today 6.94%
Mortgage Rate Projections
Quarter Fannie Mae MBA NAR Average of All Three 2024 Q1 6.50% 6.90% 6.80% 6.73% 2024 Q2 6.30% 6.60% 6.60% 6.50% 2024 Q3 6.10% 6.30% 6.30% 6.23% 2024 Q4 5.90% 6.10% 6.10% 6.03%
January 2023
2.0 3.0 4.0 5.0 6.0 7.0 8.0 2019 1/31 3/7 4/4 5/2 6/6 7/3 8/1 9/5 10/3 11/7 12/5 2020 2/6 3/5 4/2 5/7 6/4 7/2 8/6 9/3 10/1 11/5 12/3 2021 2/4 3/4 4/1 5/6 6/3 7/1 8/5 9/2 10/7 11/4 12/2 2022 2/3 3/3 4/7 5/5 6/2 7/7 8/4 9/1 10/6 11/3 12/1 1/5 2/2 3/2 4/6 5/4 6/1 7/6 8/3 9/710/5 11/9 12/7 1/4 2/8 6.6 6.3 6.3 6.1 2024 Q1 2024 Q2 2024 Q3 2024 Q4 Source: Freddie Mac, MBA Mortgage Rates 30-Year Fixed Rate January 2019 – Today Actual Interest Rates Where Are They Going?
Mortgage Rates
Source: MBA
30-Year Fixed Rate 2018 Q1 2018 Q2 2018 Q3 2018 Q4 2019 Q1 2019 Q2 2019 Q3 2019 Q4 2020 Q1 2020 Q2 2020 Q3 2020 Q4 2021 Q1 2021 Q2 2021 Q3 2021 Q4 2022 Q1 2022 Q2 2022 Q3 2022 Q4 2023 Q1 2023 Q2 2023 Q3 2023 Q4 2024 Q1 2024 Q2 2024 Q3 2024 Q4 2025 Q1 2025 Q2 2025 Q3 2025 Q4 Rate 4.3 4.5 4.6 4.8 4.4 4 3.7 3.7 3.5 3.2 3.0 2.8 2.9 3.0 2.9 3.1 3.9 5.3 5.7 6.6 6.4 6.5 7.0 7.3 6.9 6.6 6.3 6.1 5.9 5.8 5.7 5.5 2.5 3 3.5 4 4.5 5 5.5 6 6.5 7 7.5 - Actual - Projected 2018 2019 2020 2021 2022 2024 2023 2025

Mortgage Credit Availability
Mortgage Credit Availability Index (MCAI)
Source: MBA
January 2024 90 100 110 120 130 140 150 160 170 180 190 Apr 2013 Jan 2014 Jan 2015 Jan 2016 Jan 2017 Jan 2018 Jan 2019 Jan 2020 Jan 2021 Jan 2022 Jan 2023 Jan 2024
Lending Standards Still Under Control
Source: MBA
Historic Data for the Mortgage Credit Availability Index (MCAI) 0 100 200 300 400 500 600 700 800 900 June 2004 June 2006 June 2008 June 2010 June 2012 June 2014 June 2016 June 2018 June 2020 June 2022 January 2024 Housing Bubble: 868.7 92.7
