

DATA OPENS DOORS
We are publishing Housing Navigator MA Report: Affordable + Accessible Rentals (2024) with mixed emotions. On the one hand, we are pleased to be able to provide fresh information about the distribution of this critical resource across our state. We are excited that it can raise awareness about fundamental details–affordability and type of unit (BR mix, age-restriction)-that can inform the housing we want to create.
Information on affordable, accessible rental housing has never been available at this level. It is the result of over three years of collecting information almost entirely from scratch from cooperating property owners. We are grateful for every team member who took the extra time to get this information and every owner/manager who took the time to supply it.
On the other hand, we are saddened and frustrated that we cannot spotlight a complete inventory in this release.
Our many partners in the community of people with disabilities called on us to release this data regardless of its full completeness. Their constant message was “It’s better than what we have now.” Their lived experience also consistently confirmed what the data shows: uneven distribution and a lack of deeply affordable units of more than one bedroom. The latter is particularly important because even single persons with disabilities may need extra space for an attendant or equipment to address their disability. A few patterns are emerging:
● Supply, while not abundant anywhere, is even more limited outside Greater Boston.
● Deep affordability, where rent adjusts to a household income and households on fixed incomes like SSI are eligible, is not present for much of the inventory overall.
● This lack of deep affordability is even more the case for 2BR+ units which fit both families and single people with disabilities needing equipment or attendants
There are many important questions policy makers should address around matching the supply and affordability of this inventory to the community it is intended to serve. The patterns already apparent in this release should be a sound starting place. We provide a very rough metric: ADA mobility units per renter households with incomes under 80% AMI. We hope others will come forward with ways to more fully assess needs and address questions. What are the demographics and housing preferences of people who need ADA accessibility features? How do we build better to match those needs and preferences?
We hope this report will also be a call to action toward more consistent tracking going forward. We will keep working to address our data gaps. For owners who have not yet supplied details, we welcome your partnership.

Jennifer Gilbert, Executive Director/Founder Housing Navigator Massachusetts
WHAT’S INCLUDED
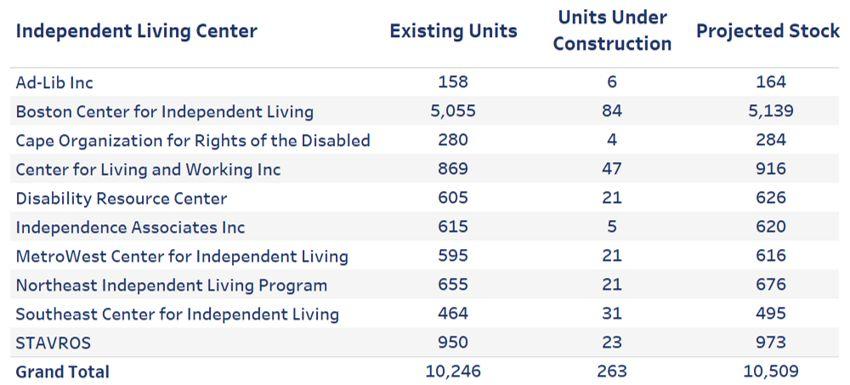
Our data covers all affordable (income restricted) housing in Massachusetts. The dataset here covers 1,652 buildings for which we have some information on ADA Mobility units current as of May 24, 2024. We pulled information on the pipeline on May 24, 2024.
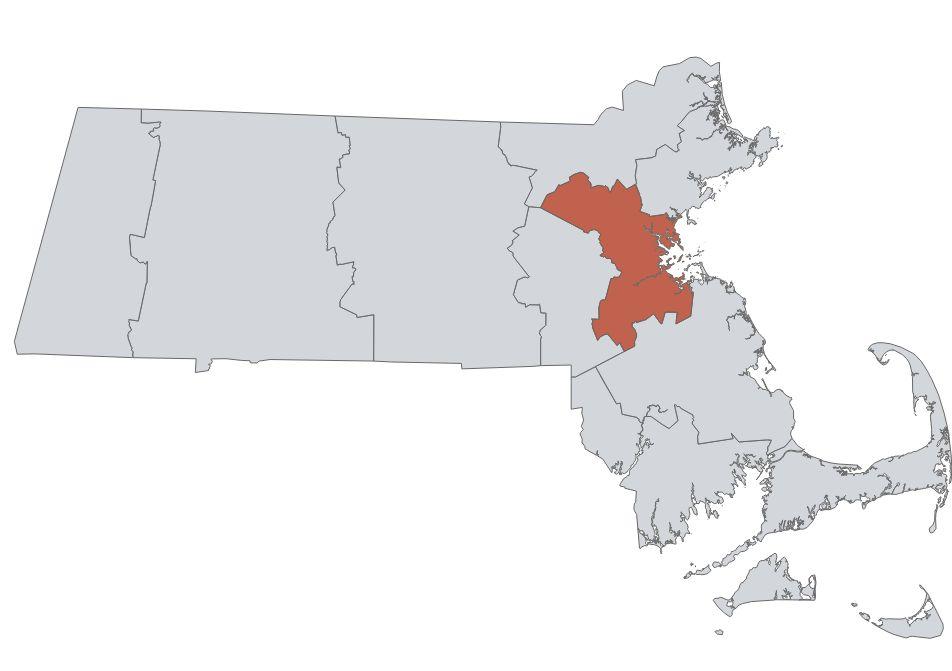
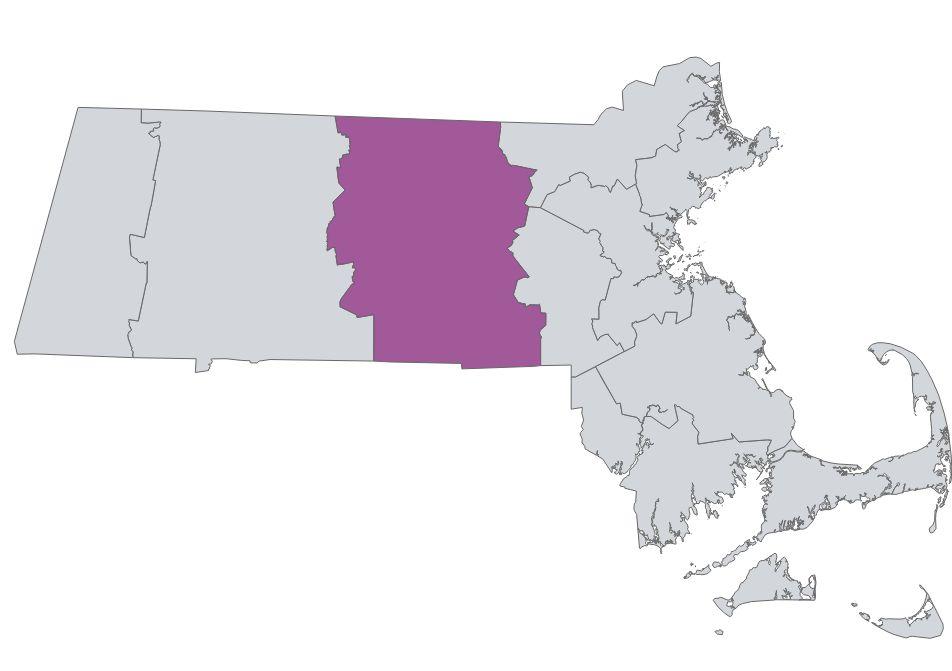
WHY WE USE ILC REGIONS
As noted, our data has varying levels of completeness, which can vary even more widely by town. To provide some understanding of the geographic spread of units, we grouped data by the Independent Living Center regions. Independent Living Centers (ILCs) are private, nonprofit, consumer-controlled organizations providing services and advocacy by and for people with all types of disabilities across Massachusetts. They have also been our partners, increasing our understanding of community needs and priorities.
Information presented here comes from property owners, except for state public housing, which relies on public agency information.We cannot verify that accessible units in our inventory are fully accessible or meet current accessibility standards. We make clear to owners that that is our definition of accessible, and have no reason to doubt the accuracy of the information they provide.
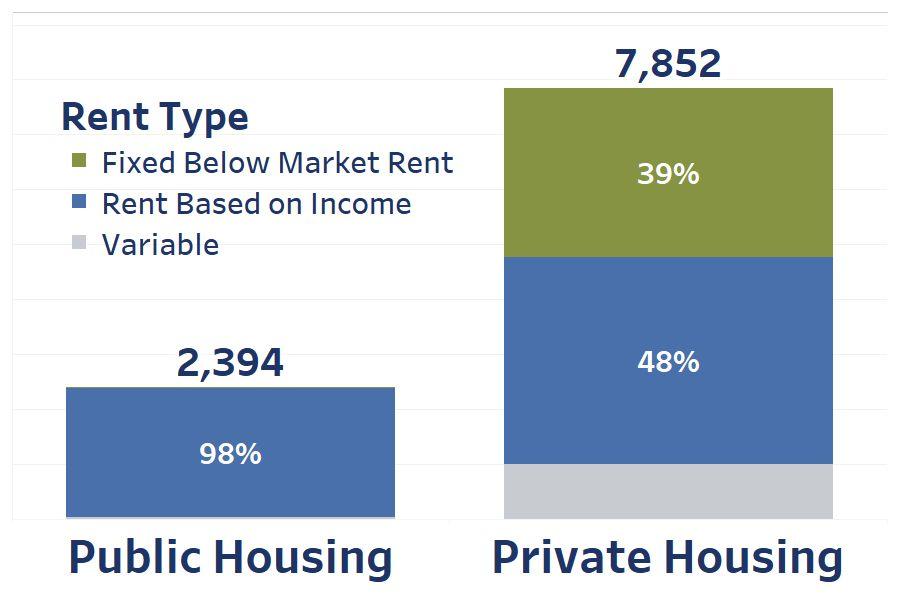
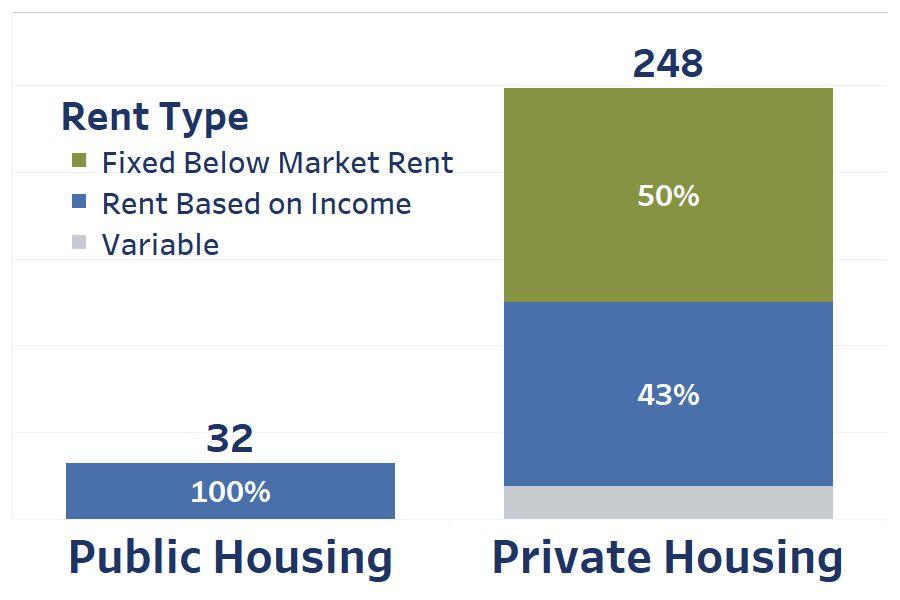
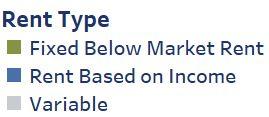
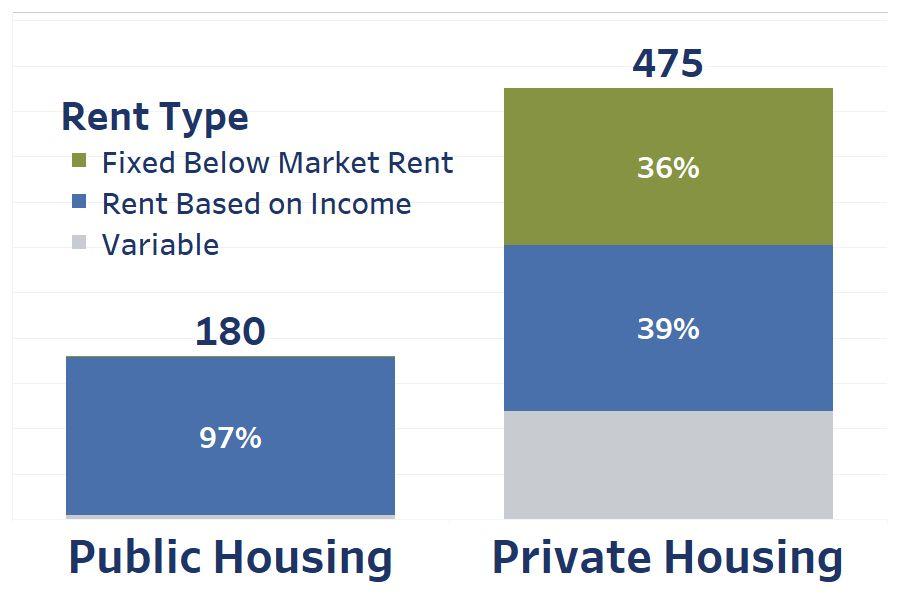
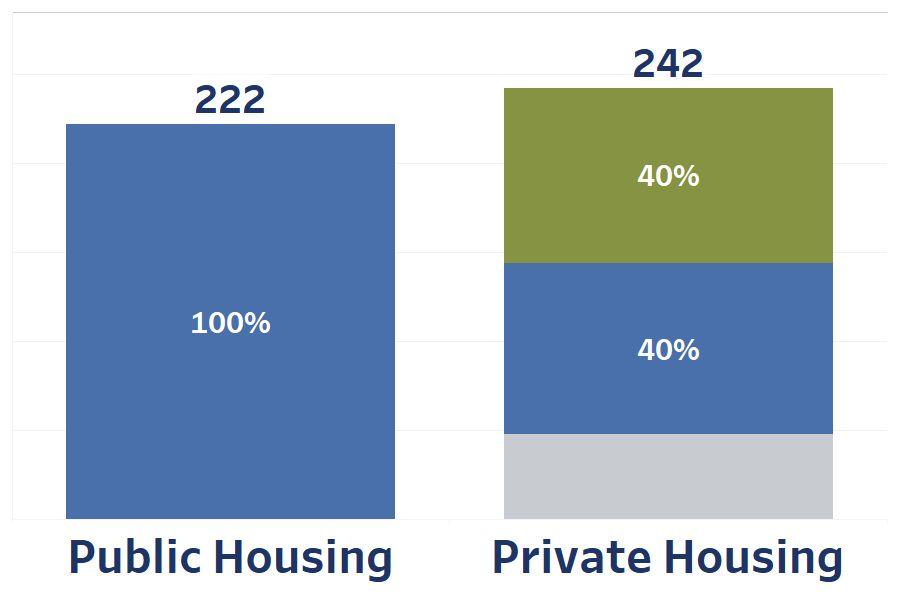
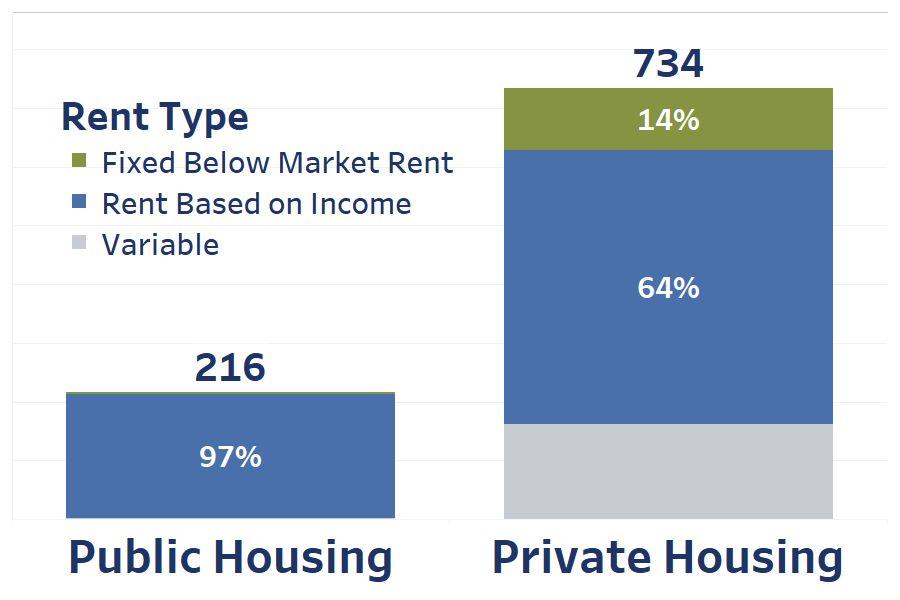
RENT TYPE
We use rent type as an indicator of affordability from a renter perspective.
● Fixed Below Market Rent - Rent is set below the market rate at an amount affordable for the area but does not adjust to the particular household’s income.
● Rent Based on Income - Rent is set based on a percentage of the household’s income (usually 30%). Because of this sliding formula, these units are often able to offer deeper affordability.
● Variable Rent - A small subset of units where rent type and income restriction may vary.
To Learn More: Please refer to the Our Data page on our website and the glossary for more details.
WHAT’S OUT THERE?
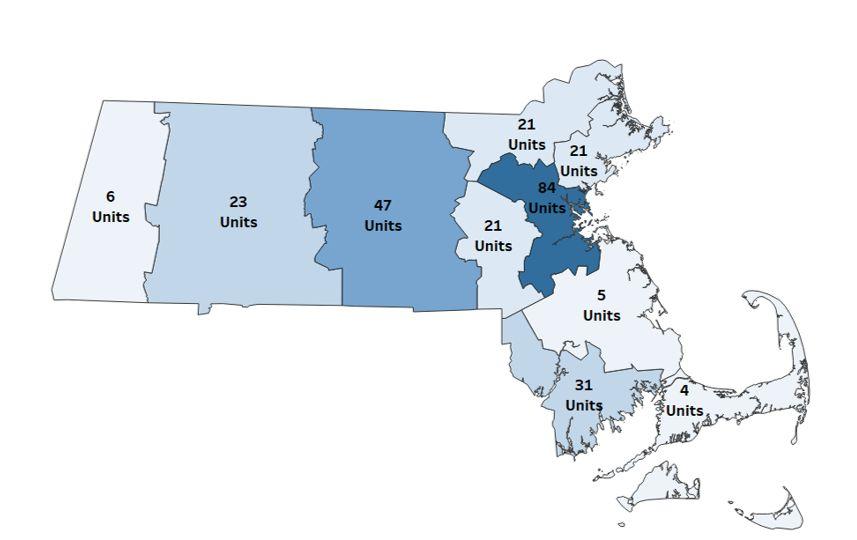
Distribution of Affordable + Accessible Rental Units Across ILC Service Areas
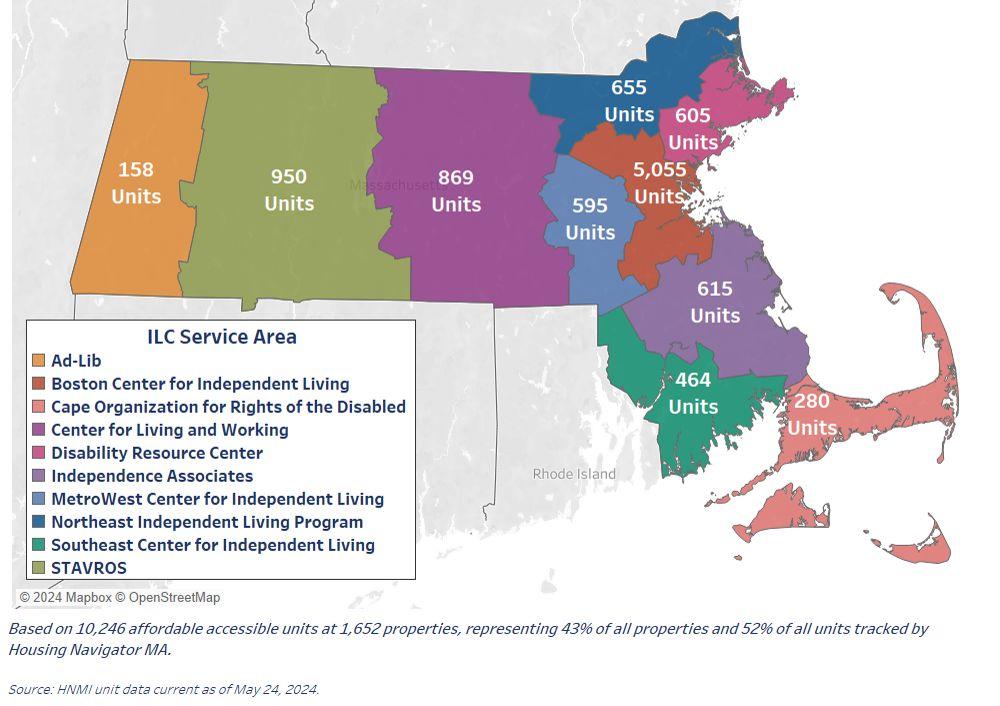
Labels represent count of Mobility Accessible Affordable Rental Units in ILC Service area.
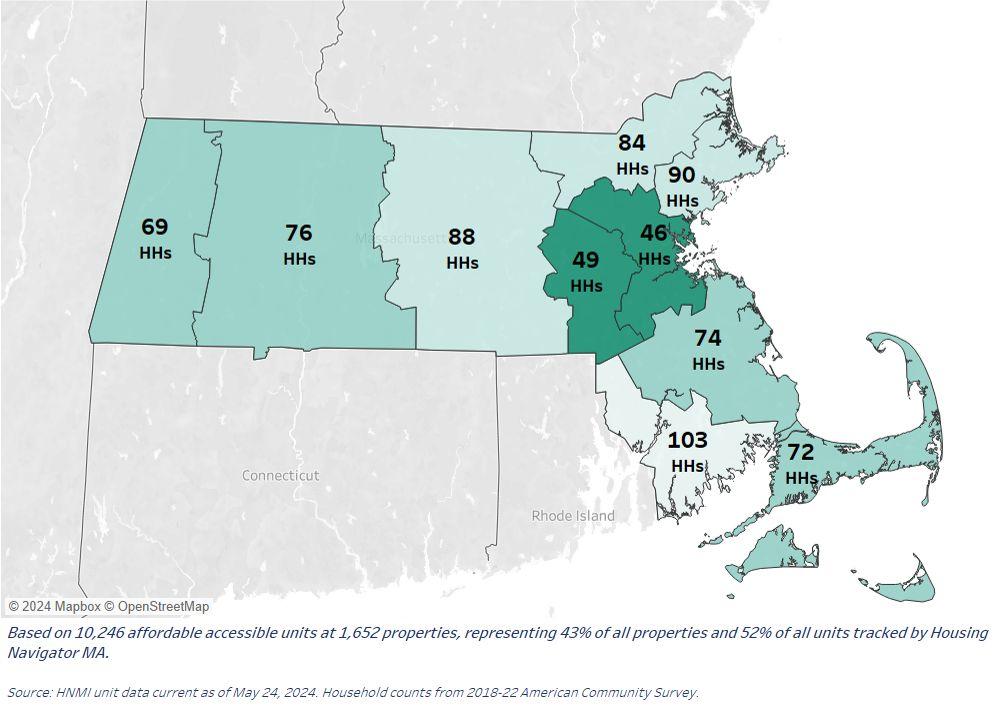
IS IT MATCHING NEED?
An Estimate of Demand for Every Affordable + Accessible Unit, by ILC Region
Accessible Units
Per Household
Accessible Units
Per Household
The graph above uses “renter households earning less than 80% AMI” as a metric of demand. For example, the map below shows that the Boston Center for Living and Working, Inc. region has 46 renter households earning less than 80% AMI for every affordable accessible unit.
WHAT’S COMING?
Affordable + Accessible Rental Units Under Construction by ILC Region
Housing Navigator MA collects information for all state-funded income-restricted properties as they start construction. The data below represents properties under construction. These properties have not been included in other totals in this document.
Commonwealth of Massachusetts
Snapshot of the Region
● The state includes 10,246 reported accessible affordable rental units
● There is one such unit for every 63 renters earning 80% or less of AMI.
● For 60%, or 6,124 of these units, renters pay rent based on income.
Sample Regional Rents: 2-Bedroom in Boston
• A household in a Fixed Below Market Rent tax credit unit will pay close to $2,203.
• A household paying Rent Based on Income will typically pay 30% of their income

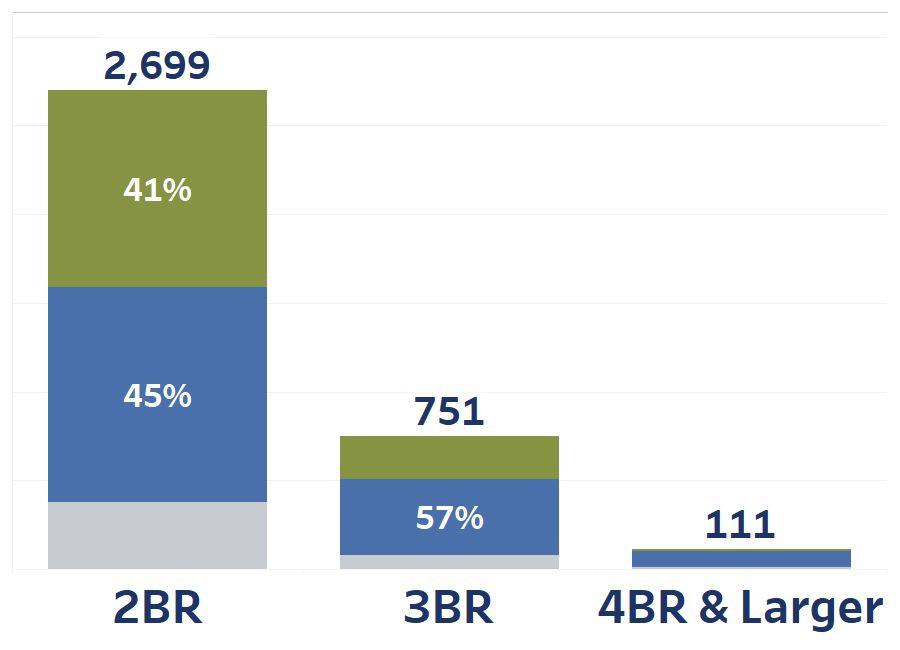
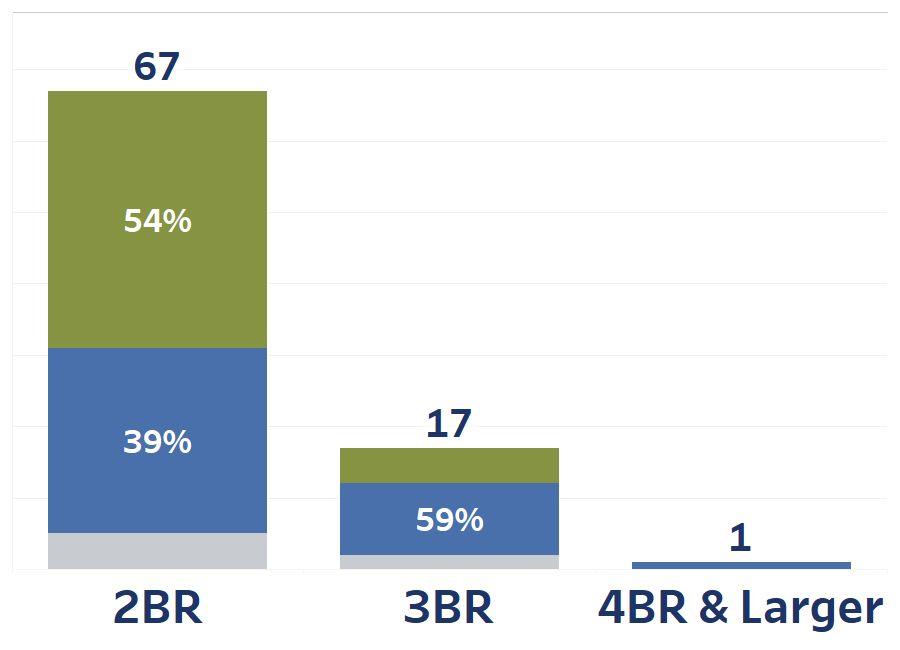
A Closer Look Larger Units
• 2BR and larger units comprise 35% of the region’s accessible affordable rental stock, or 3,561 units.
• For 49%, or 1,728 larger units, renters pay rent based on income.
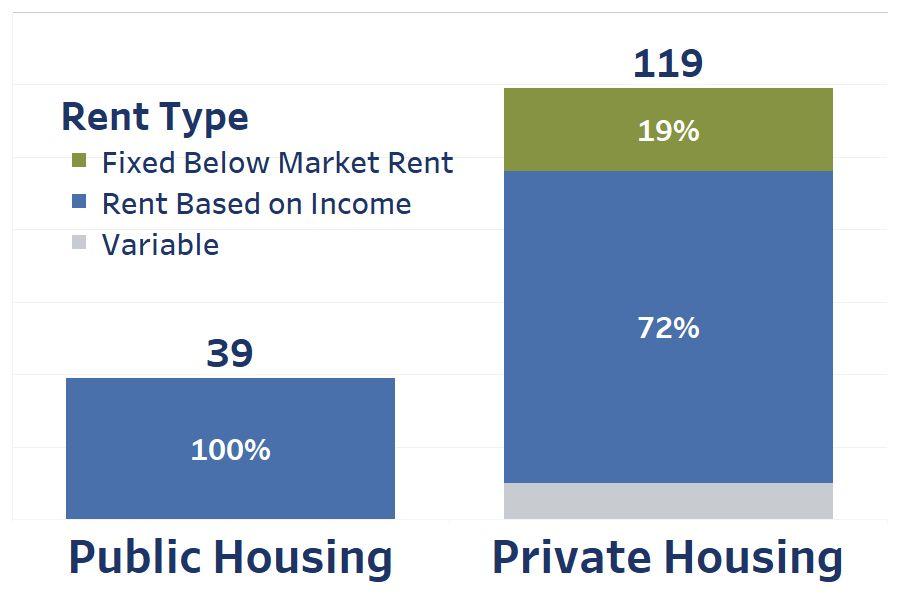
AD-Lib, Inc.
Snapshot of the Region
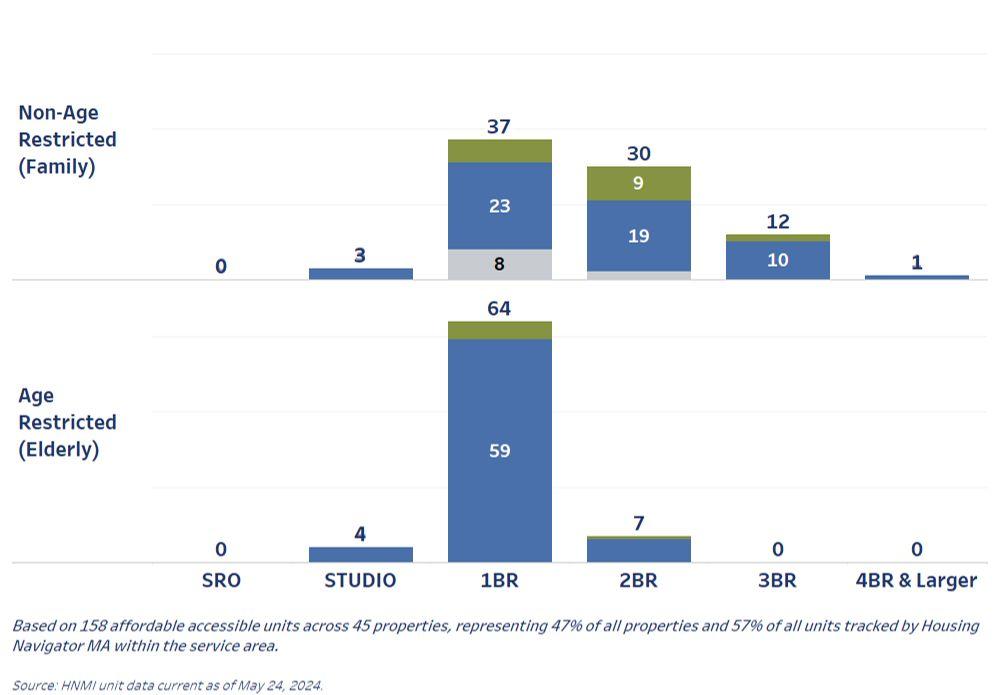
● The region includes 158 reported accessible affordable rental units
● There is one such unit for every 69 renters earning 80% or less of AMI.
● For 79%, or 125 of these units, renters pay rent based on income.
Sample Regional Rents: 2-Bedroom in Pittsfield
• A household in a Fixed Below Market Rent tax credit unit will pay close to $1,519.
• A household paying Rent Based on Income will typically pay 30% of their income
https://www.adlibcil.org/
Largest Communities: Pittsfield, North Adams, Adams

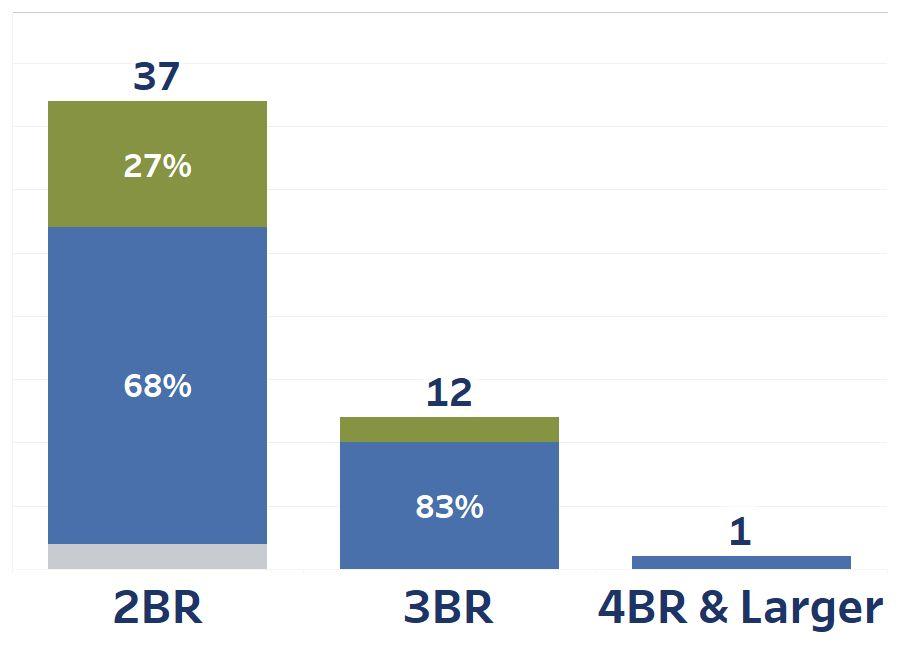
A Closer Look Larger Units
• 2BR and larger units comprise 32% of the region’s accessible affordable rental stock, or 50 units.
• For 72%, or 36 larger units, renters pay rent based on income.
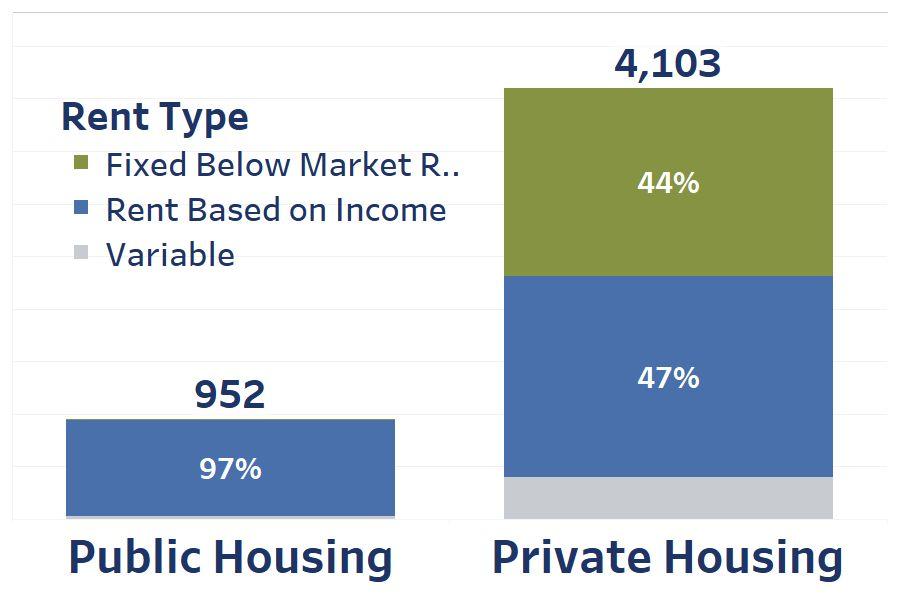
Boston Center for Independent Living
Snapshot of the Region
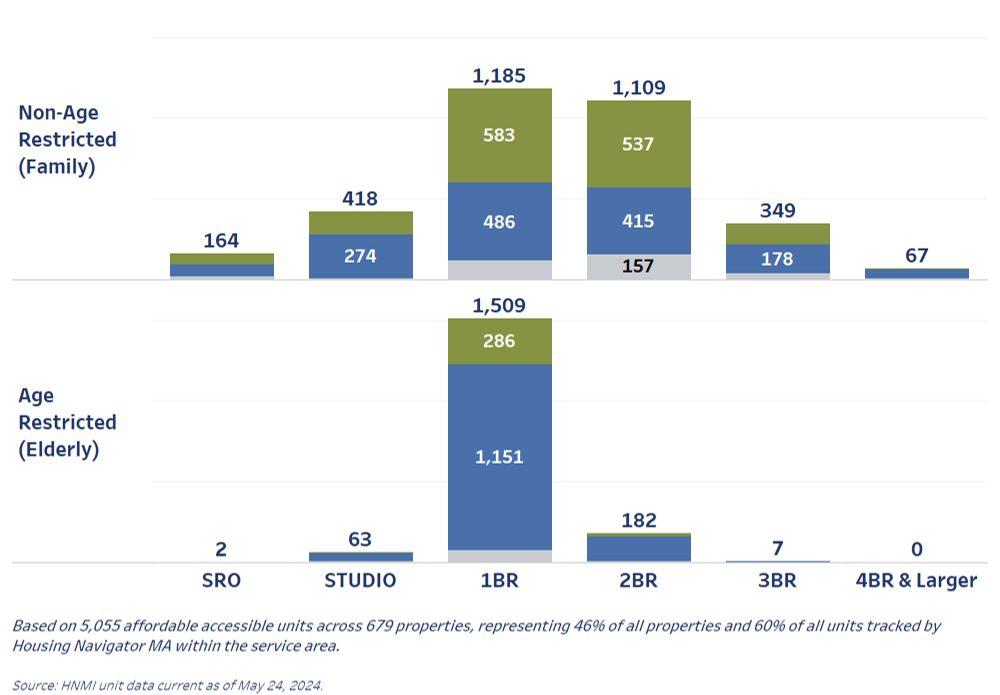
● The region includes 5,055 reported accessible affordable rental units
● There is one such unit for every 47 renters earning 80% or less of AMI.
● For 56%, or 2,837 of these units, renters pay rent based on income.
Sample Regional Rents: 2-Bedroom in Boston
• A household in a Fixed Below Market Rent tax credit unit will pay close to $2,203.
• A household paying Rent Based on Income will typically pay 30% of their income
A Closer Look Larger Units
• 2BR and larger units comprise 34% of the region’s accessible affordable rental stock, or 1,714 units.
• For 47%, or 804 larger units, renters pay rent based on income.

5,055
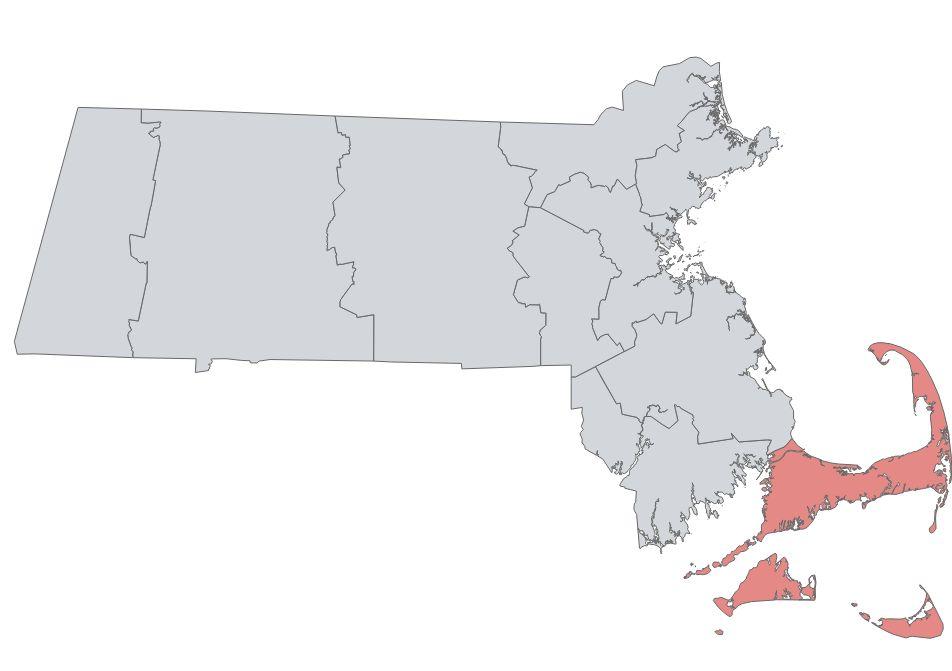
Cape Organization for Right of the Disabled
Snapshot of the Region
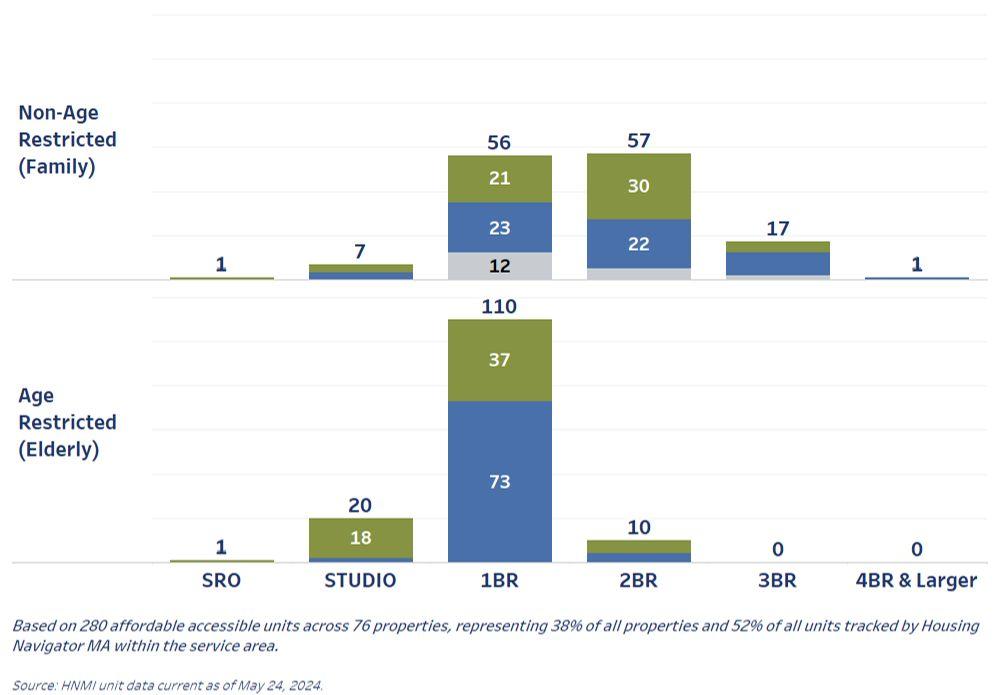
● The region includes 208 reported accessible affordable rental units
● There is one such unit for every 56 renters earning 80% or less of AMI.
● For 49%, or 138 of these units, renters pay rent based on income.
Sample Regional Rents: 2-Bedroom in Barnstable
• A household in a Fixed Below Market Rent tax credit unit will pay close to $1,708.
• A household paying Rent Based on Income will typically pay 30% of their income
https://cordcapecod.org/
A Closer Look Larger Units
• 2BR and larger units comprise 30% of the region’s accessible affordable rental stock, or 85 units.
• For 44%, or 37 larger units, renters pay rent based on income.
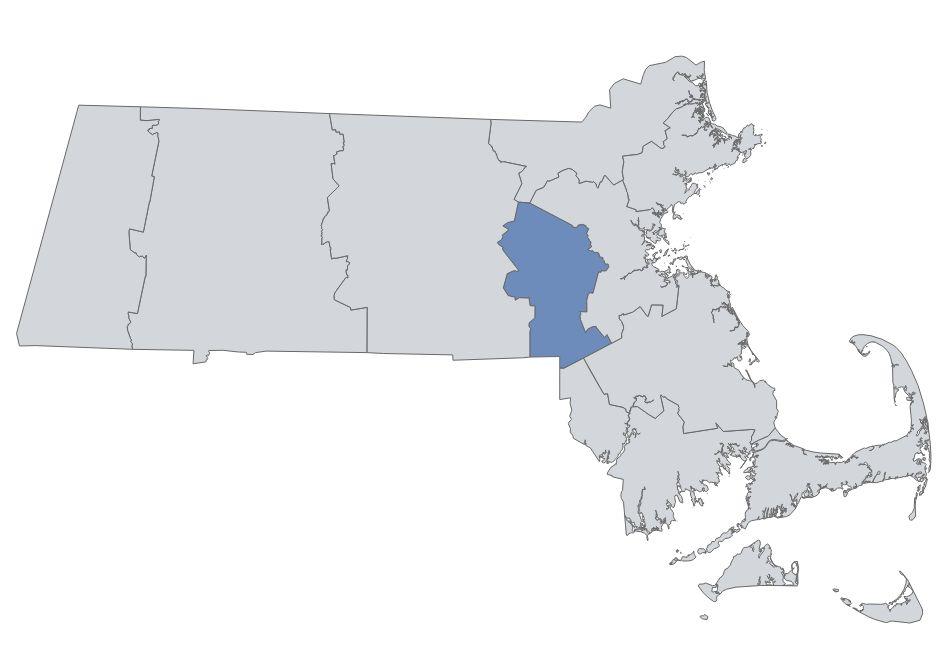
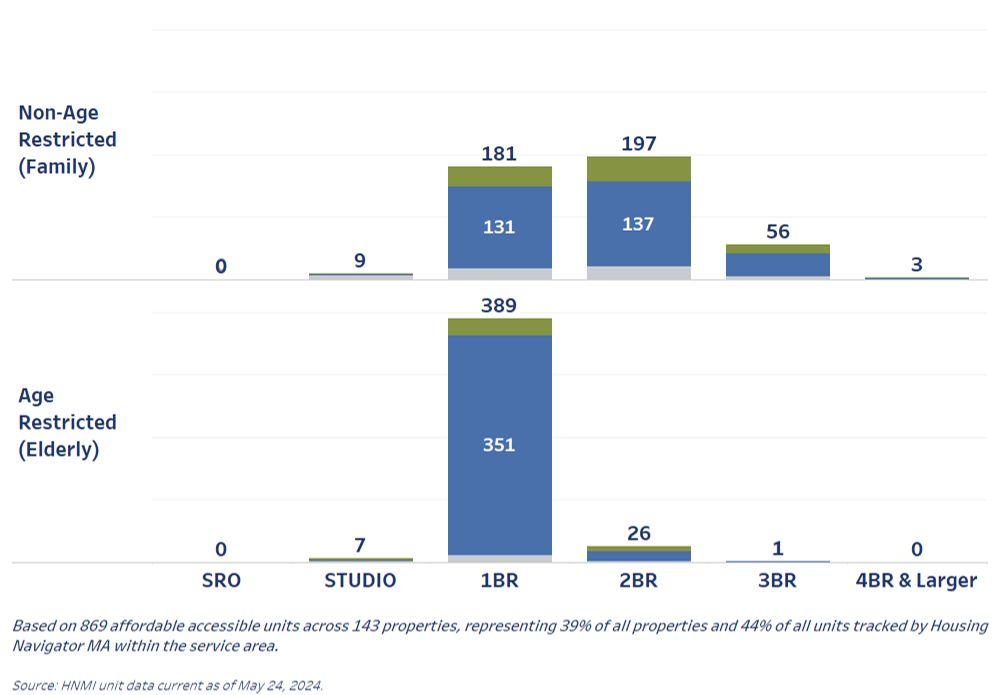
Center for Living and Working, Inc.
Snapshot of the Region
● The region includes 869 reported accessible affordable rental units
● There is one such unit for every 90 renters earning 80% or less of AMI.
● For 78%, or 678 of these units, renters pay rent based on income.
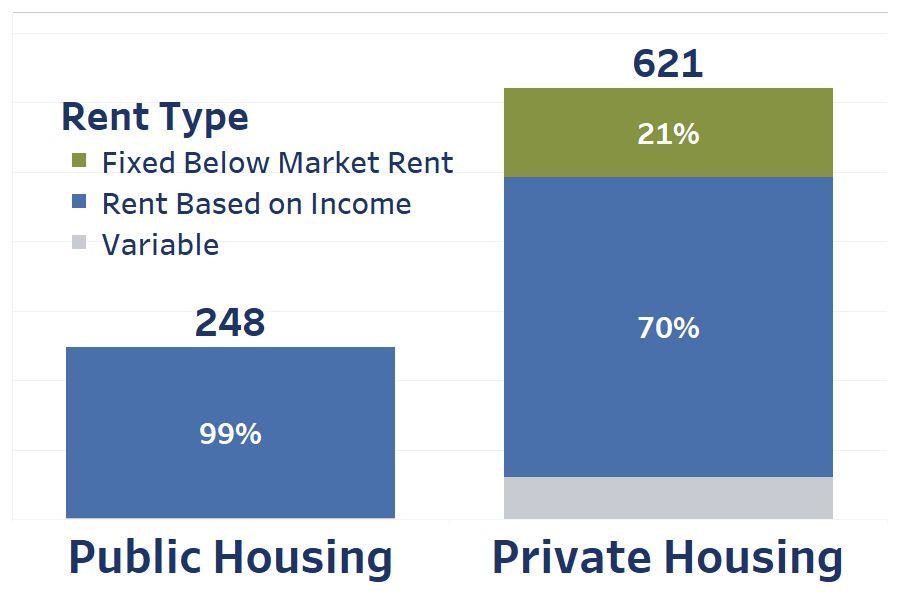
Sample Regional Rents: 2-Bedroom in Worcester
• A household in a Fixed Below Market Rent tax credit unit will pay close to $1,737.
• A household paying Rent Based on Income will typically pay 30% of their income
https://www.centerlw.org/
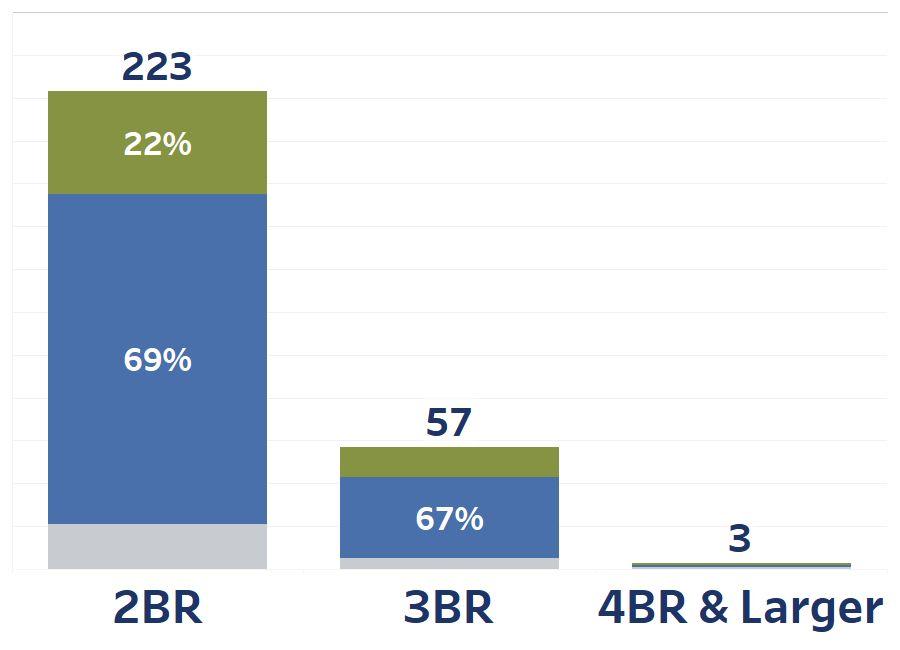
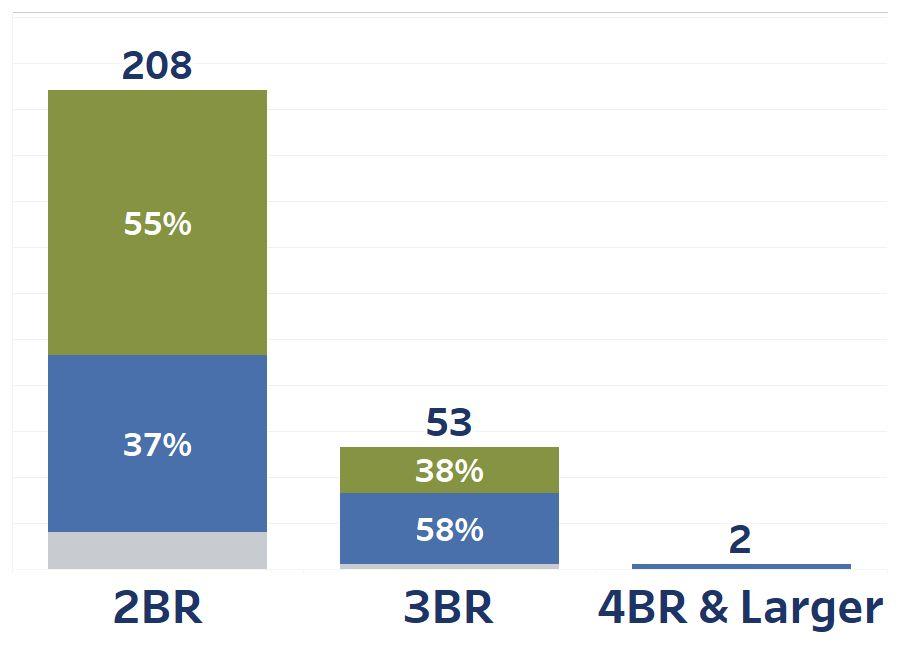
A Closer Look Larger Units
• 2BR and larger units comprise 33% of the region’s accessible affordable rental stock, or 283 units.
• For 68%, or 193 larger units, renters pay rent based on income.
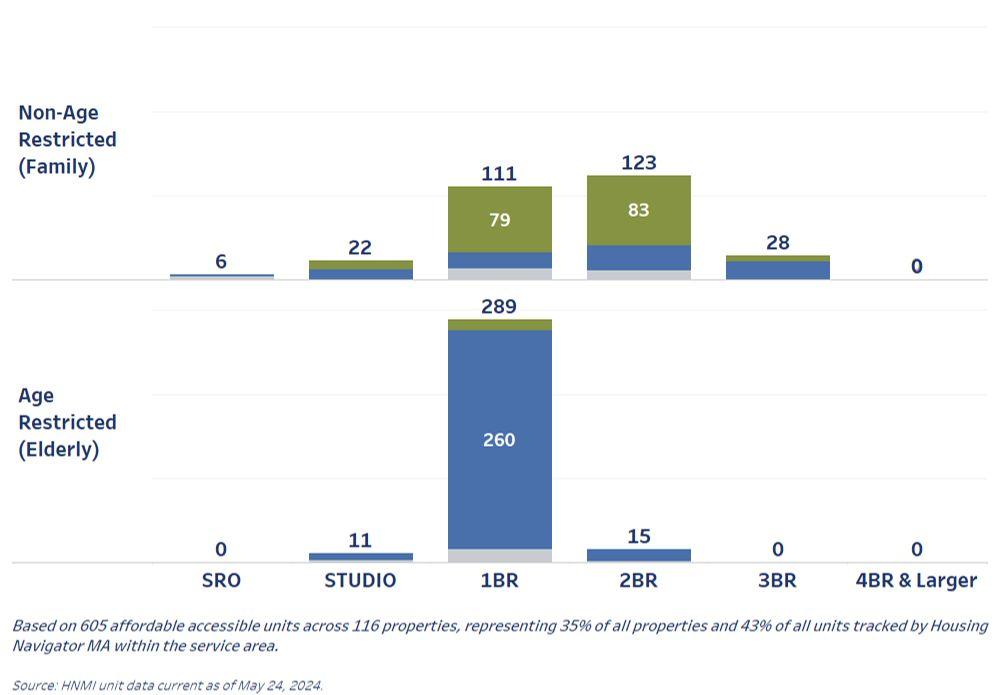
Disability Resource Center
Snapshot of the Region
● The region includes 605 reported accessible affordable rental units
● There is one such unit for every 88 renters earning 80% or less of AMI.
● For 60%, or 366 of these units, renters pay rent based on income.
Sample Regional Rents: 2-Bedroom in Lynn
• A household in a Fixed Below Market Rent tax credit unit will pay close to $2,203.
• A household paying Rent Based on Income will typically pay 30% of their income
A Closer Look Larger Units
• 2BR and larger units comprise 27% of the region’s accessible affordable rental stock, or 166 units.
• For 39%, or 64 larger units, renters pay rent based on income.
AFFORDABLE +
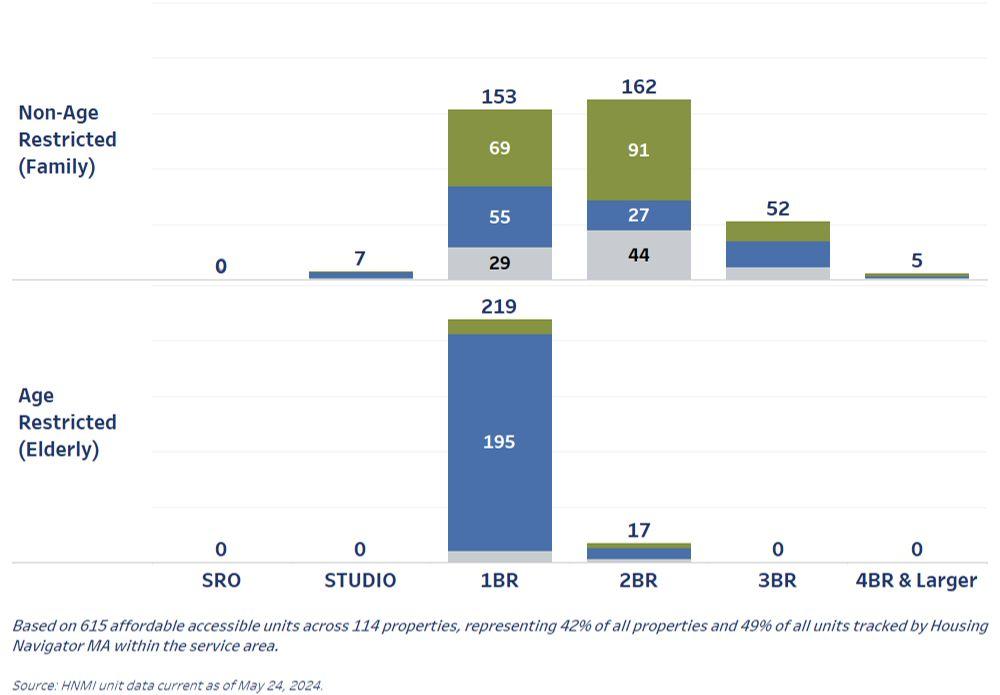
Independent Associates, Inc.
Snapshot of the Region
● The region includes 615 reported accessible affordable rental units
● There is one such unit for every 68 renters earning 80% or less of AMI.
● For 52%, or 317 of these units, renters pay rent based on income.
Sample Regional Rents: 2-Bedroom in Brockton
• A household in a Fixed Below Market Rent tax credit unit will pay close to $1,756.
• A household paying Rent Based on Income will typically pay 30% of their income
A Closer Look Larger Units
• 2BR and larger units comprise 38% of the region’s accessible affordable rental stock, or 236 units.
• For 26%, or 62 larger units, renters pay rent based on income.
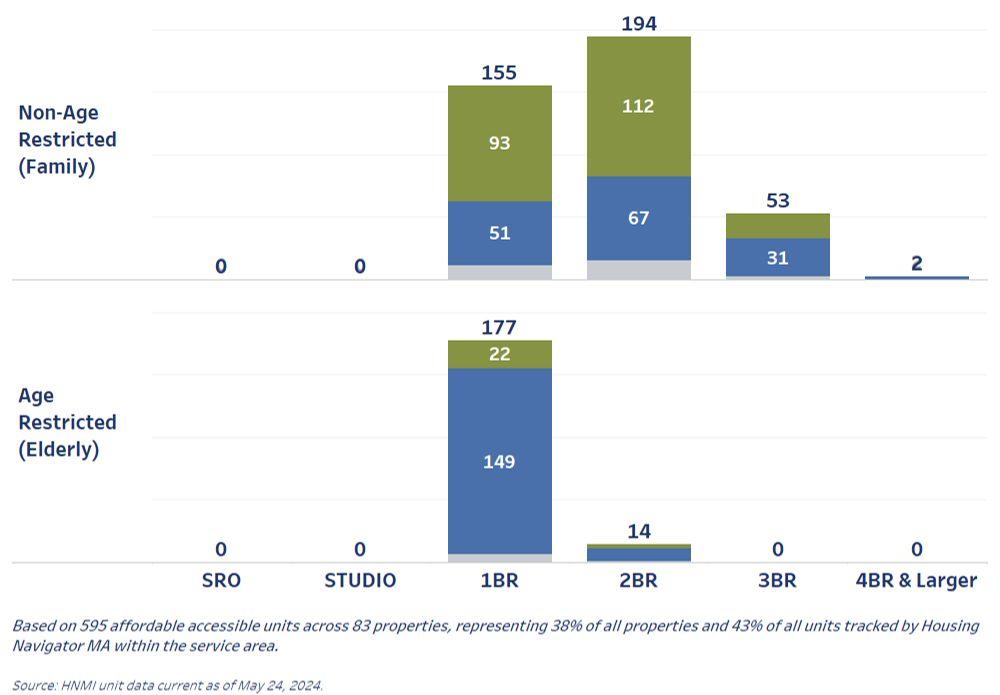
MetroWest Center for Independent Living
Snapshot of the Region
● The region includes 595 reported accessible affordable rental units
● There is one such unit for every 49 renters earning 80% or less of AMI.
● For 52%, or 310 of these units, renters pay rent based on income.
Sample Regional Rents: 2-Bedroom in Framingham
• A household in a Fixed Below Market Rent tax credit unit will pay close to $2,203.
• A household paying Rent Based on Income will typically pay 30% of their income
https://www.mwcil.org/
A Closer Look Larger Units
• 2BR and larger units comprise 44% of the region’s accessible affordable rental stock, or 263 units.
• For 42%, or 110 larger units, renters pay rent based on income.
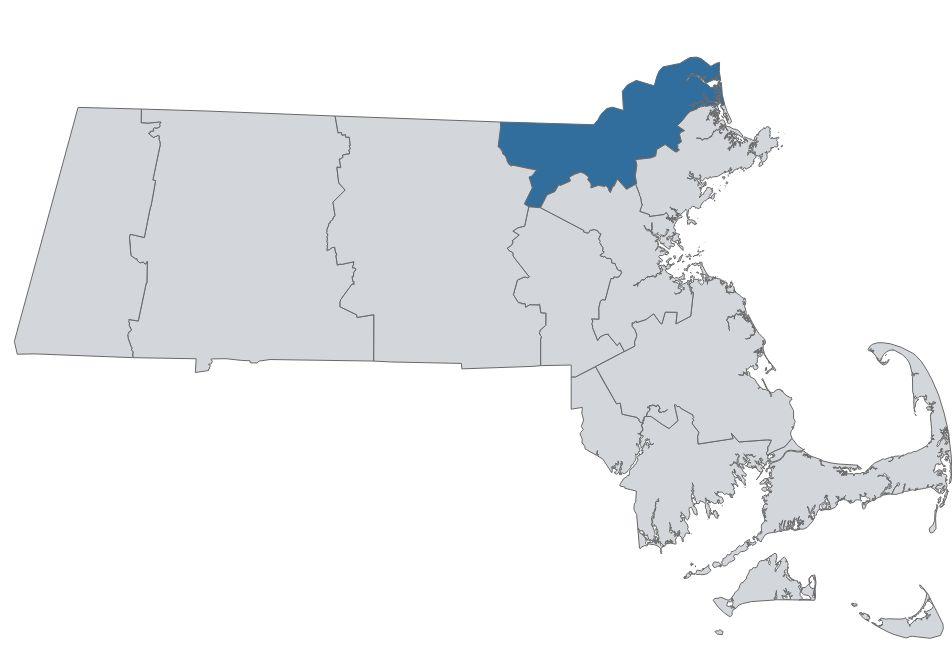
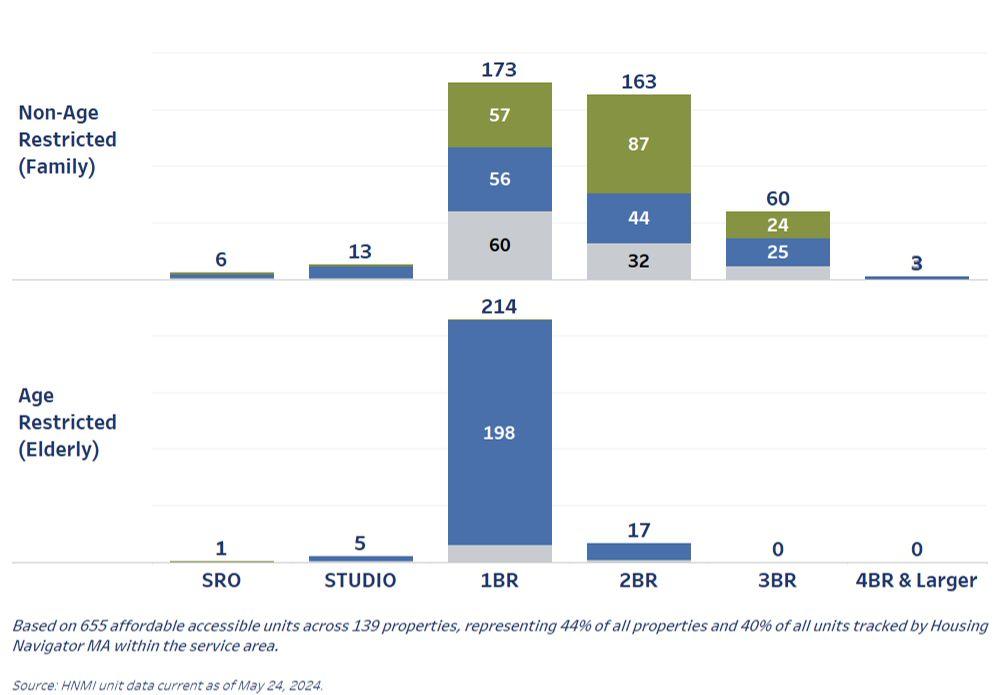
Northeast Independent Living Program
Snapshot of the Region
● The region includes 655 reported accessible affordable rental units
● There is one such unit for every 89 renters earning 80% or less of AMI.
● For 55%, or 358 of these units, renters pay rent based on income.
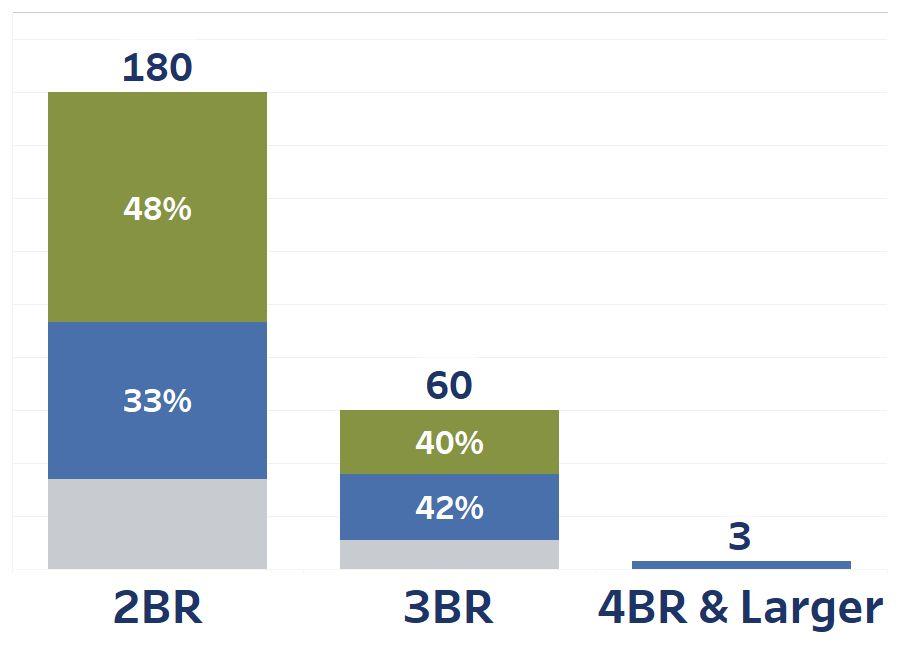
A Closer Look Larger Units
• 2BR and larger units comprise 37% of the region’s accessible affordable rental stock, or 243 units.
• For 36%, or 87 larger units, renters pay rent based on income.
Sample Regional Rents: 2-Bedroom in Lowell
• A household in a Fixed Below Market Rent tax credit unit will pay close to $1,857.
• A household paying Rent Based on Income will typically pay 30% of their income
https://www.nilp.org/
Largest Communities: Lowell, Lawrence Haverhill
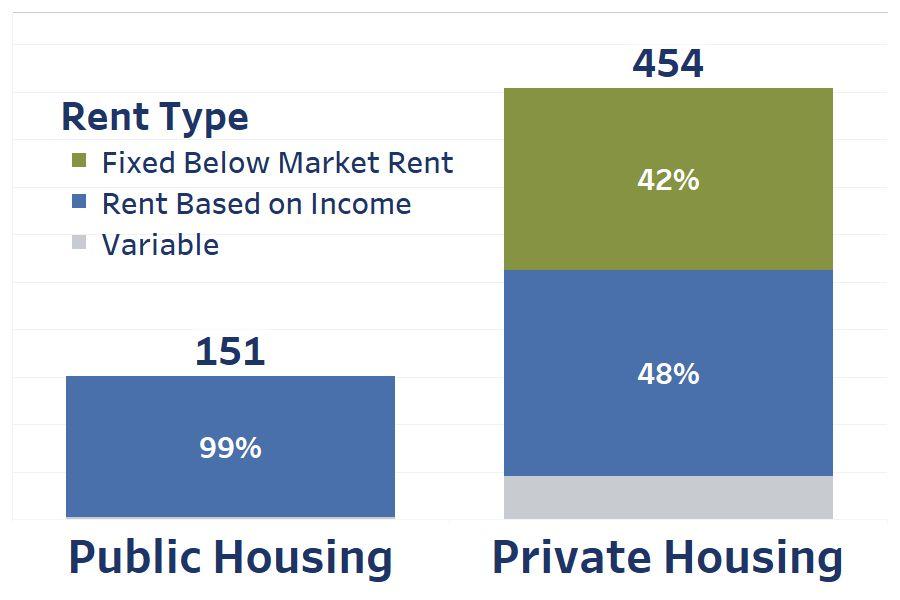
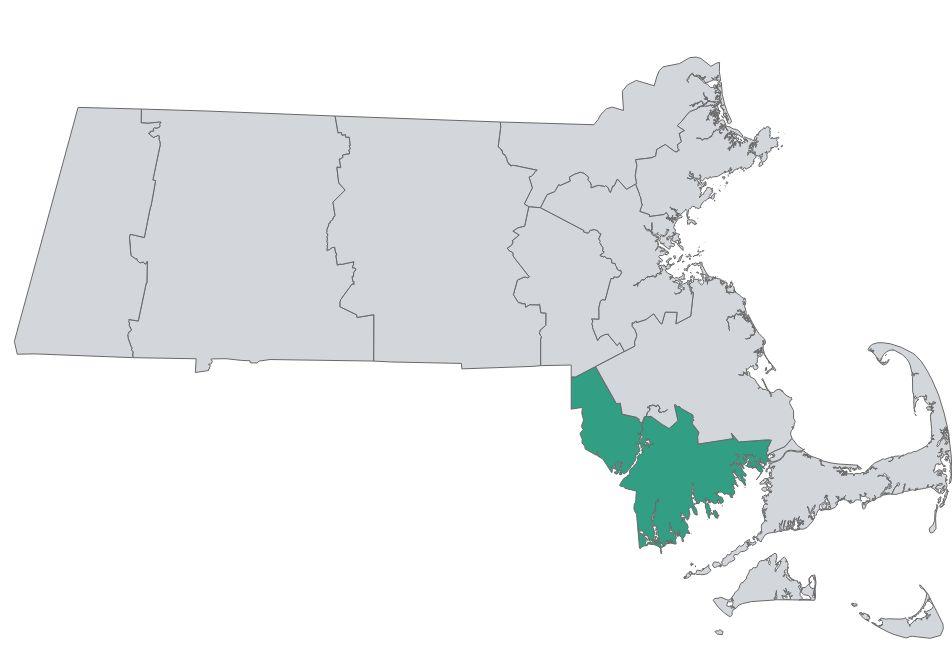
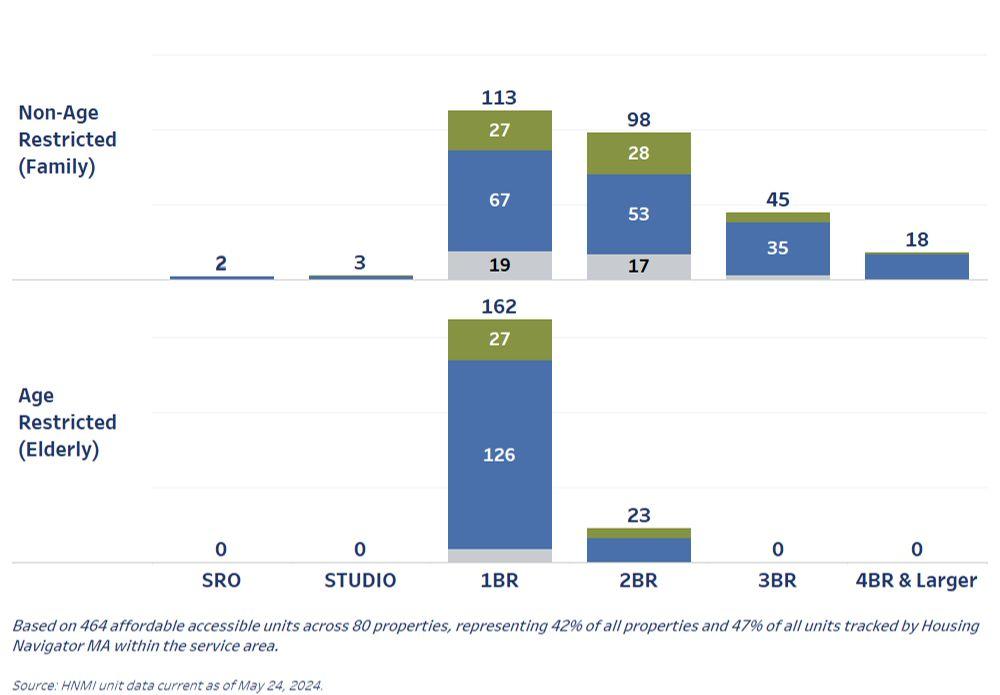
Southeast Center for Independent Living
Snapshot of the Region
● The region includes 464 reported accessible affordable rental units
● There is one such unit for every 103 renters earning 80% or less of AMI.
● For 69%, or 318 of these units, renters pay rent based on income.
Sample Regional Rents: 2-Bedroom in New Bedford
• A household in a Fixed Below Market Rent tax credit unit will pay close to $1,479.
• A household paying Rent Based on Income will typically pay 30% of their income
A Closer Look Larger Units
• 2BR and larger units comprise 40% of the region’s accessible affordable rental stock, or 184 units.
• For 66%, or 121 larger units, renters pay rent based on income.

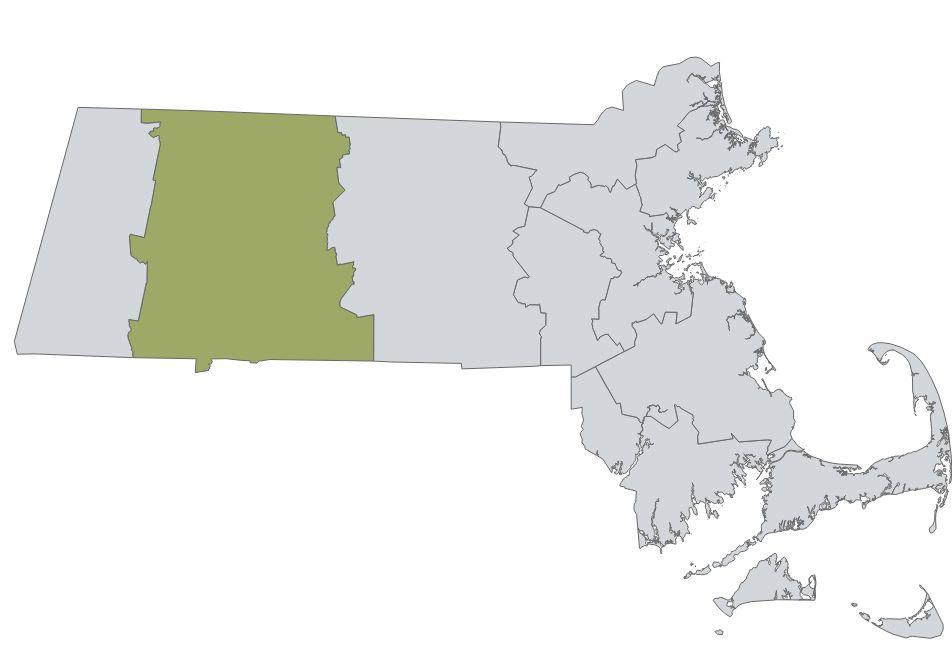
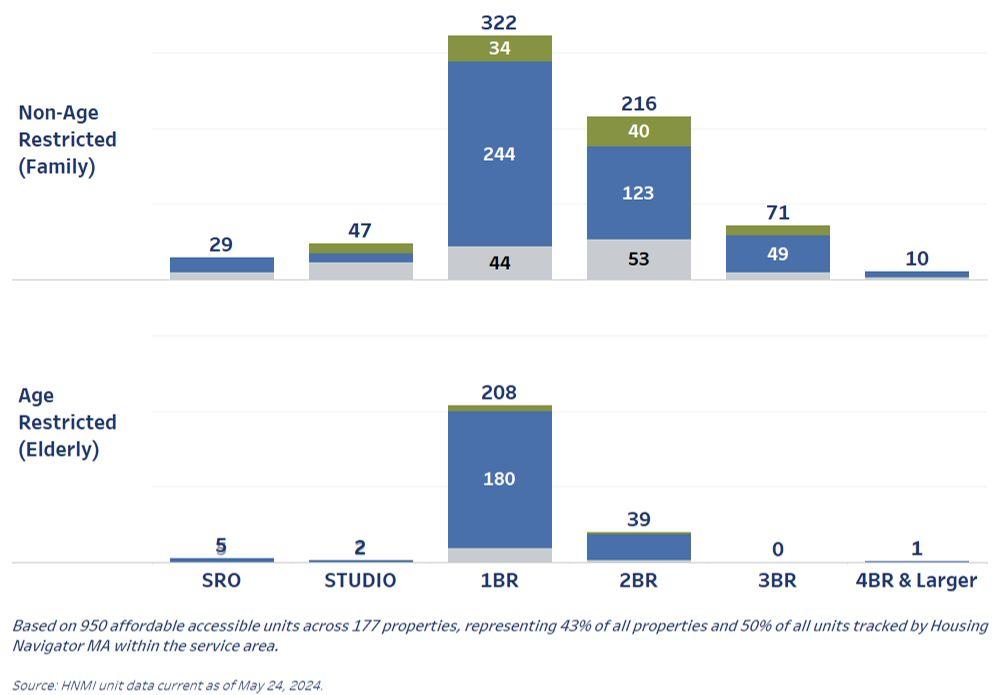
Snapshot of the Region
● The region includes 950 reported accessible affordable rental units
● There is one such unit for every 75 renters earning 80% or less of AMI.
● For 71%, or 677 of these units, renters pay rent based on income.
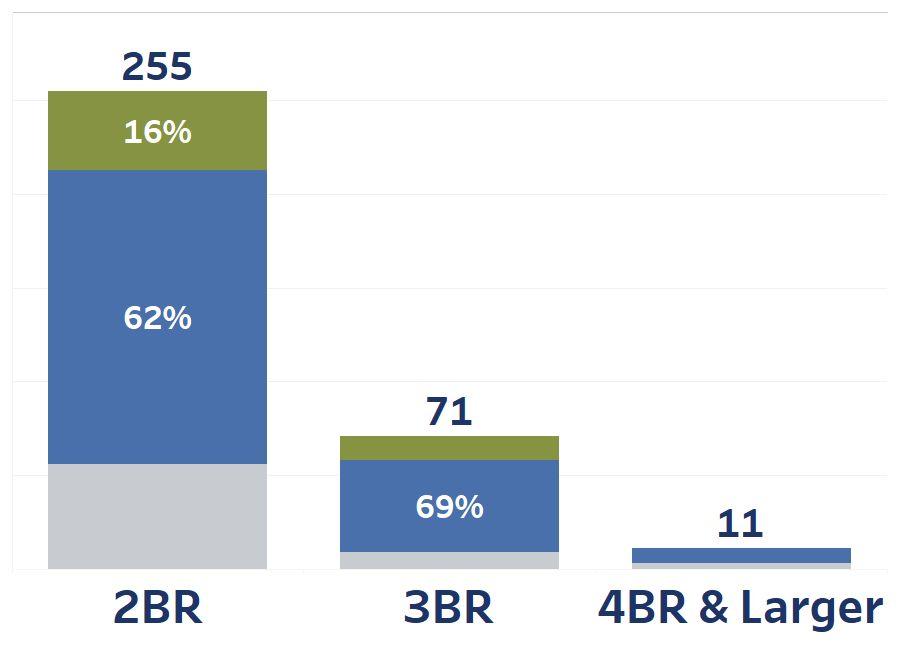
A Closer Look Larger Units
• 2BR and larger units comprise 35% of the region’s accessible affordable rental stock, or 337 units.
• For 64%, or 214 larger units, renters pay rent based on income.
Sample Regional Rents: 2-Bedroom in Springfield
• A household in a Fixed Below Market Rent tax credit unit will pay close to $1,479.
• A household paying Rent Based on Income will typically pay 30% of their income
Commonwealth of Massachusetts
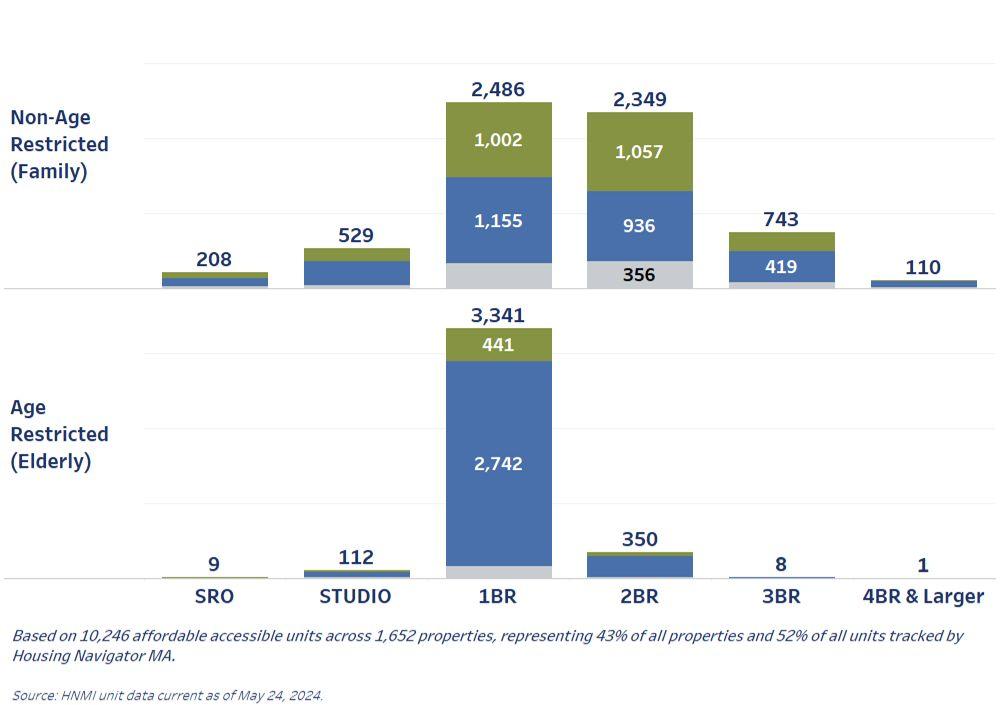
Total Accessible Units Reported - 10,246 Ad-Lib, Inc.
Total Accessible Units Reported - 158
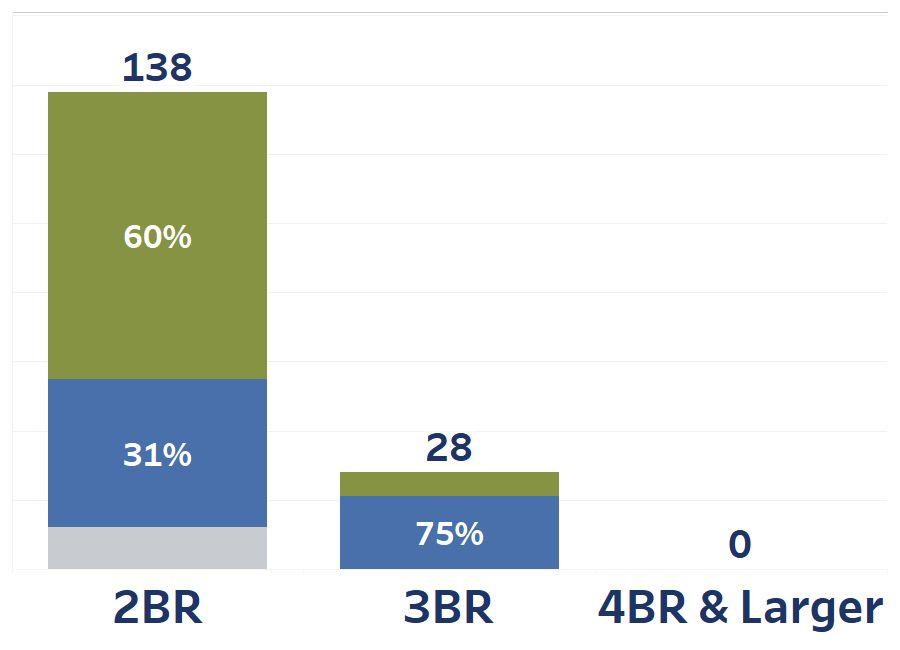
Affordable + Accessible Untic Characteristics by ILC
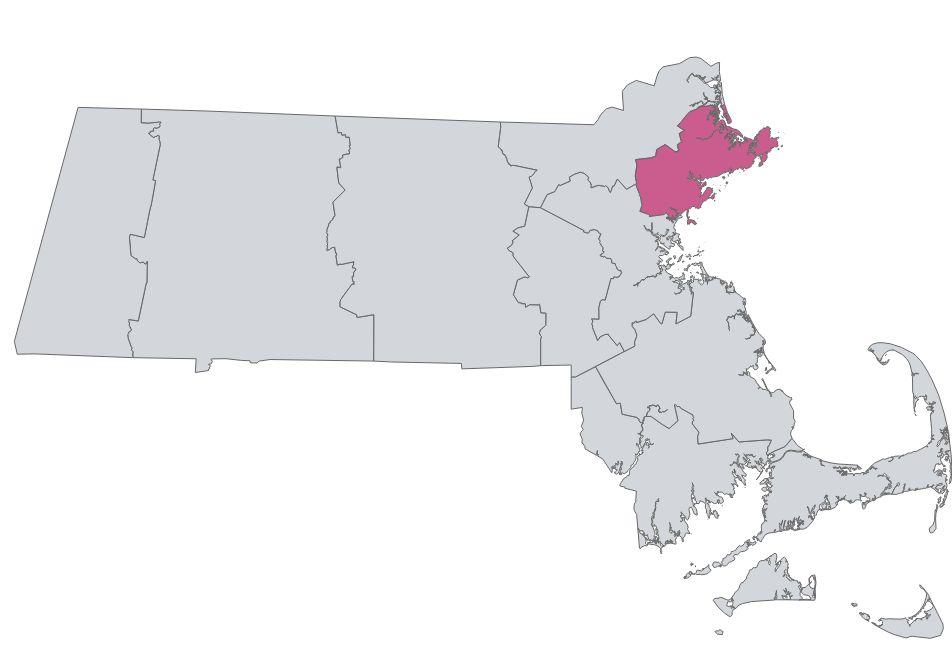
Boston Center for Independent Living
Total Accessible Units Reported - 5,055
Cape Organization for the Rights of the Disabled
Total Accessible Units Reported - 280
Affordable + Accessible Untic Characteristics by ILC
Center for Living and Working, Inc.
Total Accessible Units Reported - 869
Disability Resource Center
Total Accessible Units Reported - 605
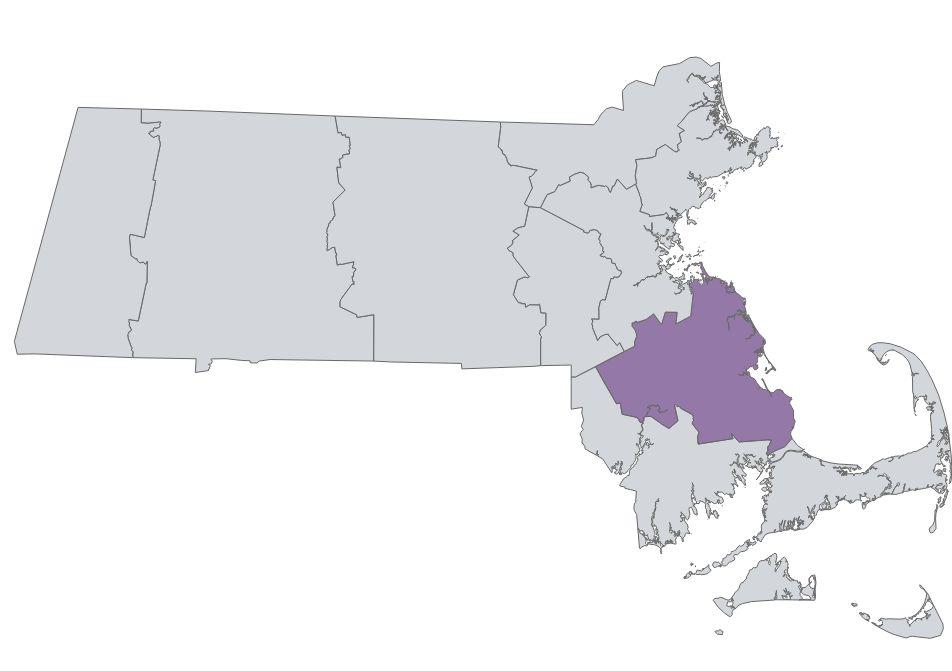
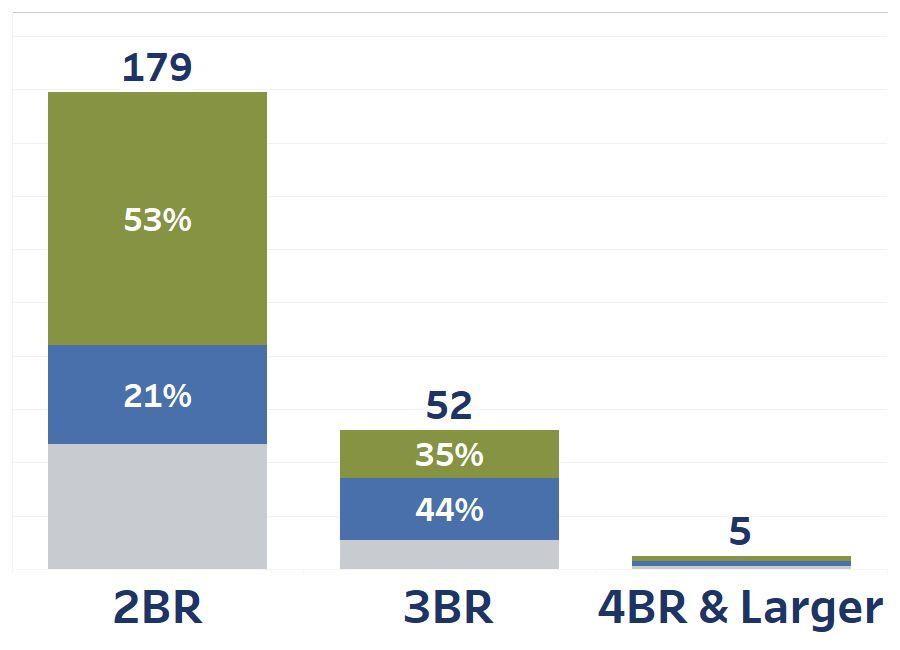
Independence Associates, Inc.
Total Accessible Units Reported - 615
MetroWest Center for Independent Living
Total Accessible Units Reported - 595
Affordable + Accessible Untic Characteristics by ILC
Northeast Independent Living Program
Total Accessible Units Reported - 655
Southeast Center for Independent Living
Total Accessible Units Reported - 464
STAVROS
Total Accessible Units Reported - 950
APPENDIX B
List of Municipalities by ILC
Ad-Lib, Inc.: Adams, Alford, Becket, Cheshire, Clarksburg, Dalton, Egremont, Florida, Great Barrington, Hancock, Hinsdale, Lanesborough, Lee, Lenox, Monterey, Mount Washington, New Ashford, New Marlborough, North Adams, Otis, Peru, Pittsfield, Richmond, Sandisfield, Savoy, Sheffield, Stockbridge, Tyringham, Washington, West Stockbridge, Williamstown, Windsor
Boston Center for Independent Living: Acton, Arlington, Bedford, Belmont, Boston, Braintree, Brookline, Burlington, Cambridge, Canton, Carlisle, Chelsea, Concord, Dedham, Everett, Lexington, Lincoln, Malden, Medford, Milton, Newton, Norwood, Quincy, Randolph, Revere, Sharon, Somerville, Walpole, Waltham, Watertown, Westwood, Weymouth, Winchester, Winthrop, Woburn
Cape Organization for Rights of the Disabled: Aquinnah, Barnstable, Bourne, Brewster, Chatham, Chilmark, Dennis, Eastham, Edgartown, Falmouth, Gosnold, Harwich, Mashpee, Nantucket, Oak Bluffs, Orleans, Provincetown, Sandwich, Tisbury, Truro, Wellfleet, West Tisbury, Yarmouth
Center for Living and Working, Inc.: Ashburnham, Ashby, Athol, Auburn, Ayer, Barre, Berlin, Blackstone, Bolton, Boylston, Brookfield, Charlton, Clinton, Douglas, Dudley, East Brookfield, Fitchburg, Gardner, Grafton, Hardwick, Harvard, Holden, Hopedale, Hubbardston, Lancaster, Leicester, Leominster, Lunenburg, Mendon, Milford, Millbury, Millville, New Braintree, North Brookfield, Northborough, Northbridge, Oakham, Oxford, Paxton, Petersham, Phillipston, Princeton, Royalston, Rutland, Shirley, Shrewsbury, Southbridge, Spencer, Sterling, Sturbridge, Sutton, Templeton, Townsend, Upton, Uxbridge, Warren, Webster, West Boylston, West Brookfield, Westborough, Westminster, Winchendon, Worcester
Disability Resource Center: Beverly, Danvers, Essex, Gloucester, Hamilton, Ipswich, Lynn, Lynnfield, Manchester-by-the-Sea, Marblehead, Melrose, Middleton, Nahant, North Reading, Peabody, Reading, Rockport, Rowley, Salem, Saugus, Stoneham, Swampscott, Topsfield, Wakefield, Wenham
Independence Associates, Inc.: Abington, Avon, Bridgewater, Brockton, Carver, Cohasset, Duxbury, East Bridgewater, Easton, Halifax, Hanover, Hanson, Hingham, Holbrook, Hull, Kingston, Mansfield, Marshfield, Middleborough, Norton, Norwell, Pembroke, Plymouth, Plympton, Raynham, Rockland, Scituate, Stoughton, Taunton, West Bridgewater, Whitman
MetroWest Center for Independent Living: Ashland, Bellingham, Dover, Foxborough, Framingham, Franklin, Holliston, Hopkinton, Hudson, Marlborough, Maynard, Medfield, Medway, Millis, Natick, Needham, Norfolk, Plainville, Sherborn, Southborough, Stow, Sudbury, Wayland, Wellesley, Weston, Wrentham
Northeast Independent Living Program: Amesbury, Andover, Billerica, Boxborough, Boxford, Chelmsford, Dracut, Dunstable, Georgetown, Groton, Groveland, Haverhill, Lawrence, Littleton, Lowell, Merrimac, Methuen, Newbury, Newburyport, North Andover, Pepperell, Salisbury, Tewksbury, Tyngsborough, West Newbury, Westford, Wilmington
List of Municipalities by ILC
Southeast Center for Independent Living: Acushnet, Attleboro, Berkley, Dartmouth, Dighton, Fairhaven, Fall River, Freetown, Lakeville, Marion, Mattapoisett, New Bedford, North Attleborough, Rehoboth, Rochester, Seekonk, Somerset, Swansea, Wareham, Westport
STAVROS: Agawam, Amherst, Ashfield, Belchertown, Bernardston, Blandford, Brimfield, Buckland, Charlemont, Chester, Chesterfield, Chicopee, Colrain, Conway, Cummington, Deerfield, East Longmeadow, Easthampton, Erving, Gill, Goshen, Granby, Granville, Greenfield, Hadley, Hampden, Hatfield, Hawley, Heath, Holland, Holyoke, Huntington, Leverett, Leyden, Longmeadow, Ludlow, Middlefield, Monroe, Monson, Montague, Montgomery, New Salem, Northampton, Northfield, Orange, Palmer, Pelham, Plainfield, Rowe, Russell, Shelburne, Shutesbury, South Hadley, Southampton, Southwick, Springfield, Sunderland, Tolland, Wales, Ware, Warwick, Wendell, West Springfield, Westfield, Westhampton, Whately, Wilbraham, Williamsburg, Worthington
Credits
Contributors to this report:
Housing Navigator MA team:
Jennifer Gilbert
April Ognibene
Abby Werner
Emma Rial
Consultant to Housing Navigator MA: Cliff Cook
Many thanks to our owner partners who supplied the data for this report as well as the MA Executive Office of Housing and Livable Communities.
Additional thanks to our partners in the ILC community with special thanks to Angelina Ramirez and Jordan Stocker for their guidance.
Support for our data work is provided by the Kuehn Charitable Foundation. A full list of our supporters can be found here. Thanks to each for making this report and our search tool possible.