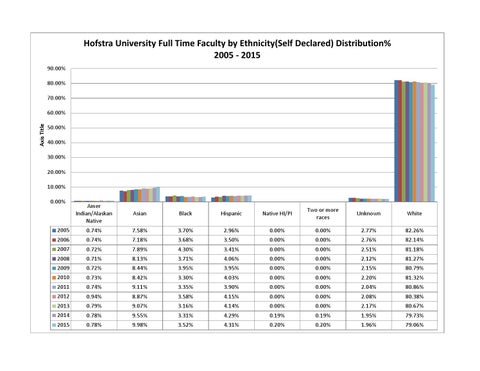
Hofstra University Full Time Faculty by Ethnicity(Self Declared) Distribution% 2005 - 2015 90.00% 80.00% 70.00%
Axis Title
60.00% 50.00% 40.00% 30.00% 20.00% 10.00% 0.00%
Amer Indian/Alaskan Native
Asian
Black
Hispanic
Native HI/PI
Two or more races
Unknown
White
2005
0.74%
7.58%
3.70%
2.96%
0.00%
0.00%
2.77%
82.26%
2006
0.74%
7.18%
3.68%
3.50%
0.00%
0.00%
2.76%
82.14%
2007
0.72%
7.89%
4.30%
3.41%
0.00%
0.00%
2.51%
81.18%
2008
0.71%
8.13%
3.71%
4.06%
0.00%
0.00%
2.12%
81.27%
2009
0.72%
8.44%
3.95%
3.95%
0.00%
0.00%
2.15%
80.79%
2010
0.73%
8.42%
3.30%
4.03%
0.00%
0.00%
2.20%
81.32%
2011
0.74%
9.11%
3.35%
3.90%
0.00%
0.00%
2.04%
80.86%
2012
0.94%
8.87%
3.58%
4.15%
0.00%
0.00%
2.08%
80.38%
2013
0.79%
9.07%
3.16%
4.14%
0.00%
0.00%
2.17%
80.67%
2014
0.78%
9.55%
3.31%
4.29%
0.19%
0.19%
1.95%
79.73%
2015
0.78%
9.98%
3.52%
4.31%
0.20%
0.20%
1.96%
79.06%