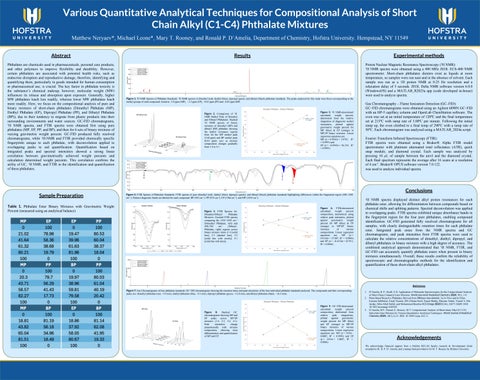

Various Quantitative Analytical Techniques for Compositional Analysis of Short Chain Alkyl (C1-C4) Phthalate Mixtures
Ronald
Abstract
Phthalatesarechemicalsusedinpharmaceuticals,personalcareproducts, and other polymers to improve flexibility and durability. However, certain phthalates are associated with potential health risks, such as endocrine disruption and reproductive damage, therefore, identifying and quantifying them, particularly in goods intended for human consumption or pharmaceutical use, is crucial. The key factor in phthalate toxicity is the substance’s chemical makeup; however, molecular weight (MW) influences its release and absorption upon exposure. Generally, higher MW phthalates leach less readily, whereas lower MW phthalates leach more readily. Here, we focus on the compositional analysis of pure and binary mixtures of short-chain phthalates (Dimethyl Phthalate (MP), Diethyl Phthalate (EP), Dipropyl Phthalate (PP), and Dibutyl Phthalate (BP)), due to their tendency to migrate from plastic products into their surrounding environments and water sources. GC-FID chromatograms, ¹H NMR spectra, and FTIR spectra were obtained first using pure phthalates(MP,EP,PP,andBP),andthenfor6setsofbinarymixturesof varying gravimetric weight percent. GC-FID produced fully resolved chromatograms, while ¹H-NMR and FTIR provided chemically specific fingerprints unique to each phthalate, with deconvolution applied to overlapping peaks to aid quantification. Quantification based on integrated peaks and spectral intensities showed a strong linear correlation between gravimetrically achieved weight percents and calculation determined weight percents. This correlation confirms the utility of GC, ¹HNMR, and FTIR in the identification and quantification ofthesephthalates.
Sample Preparation
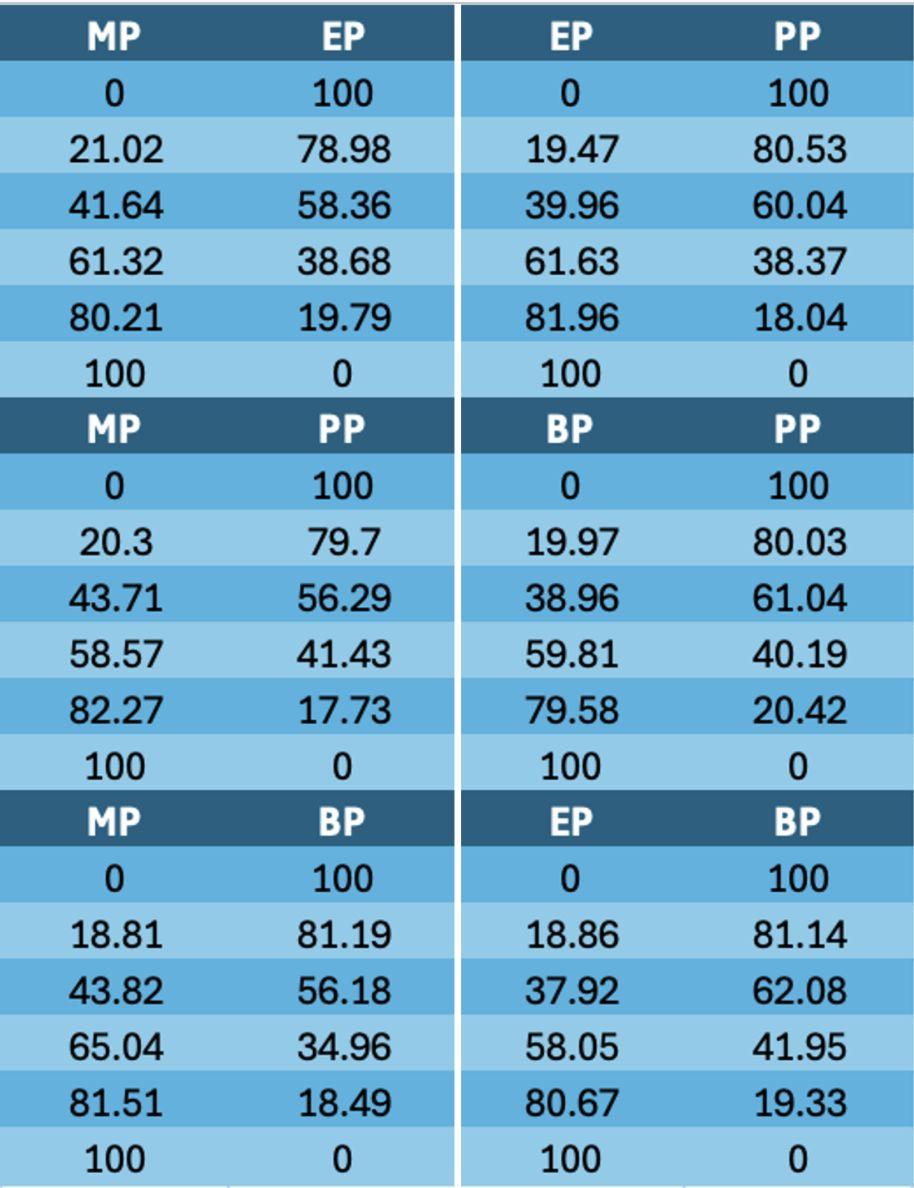
Table 1. Phthalate Ester Binary Mixtures with Gravimetric Weight Percent(measuredusingananalyticalbalance)
Results
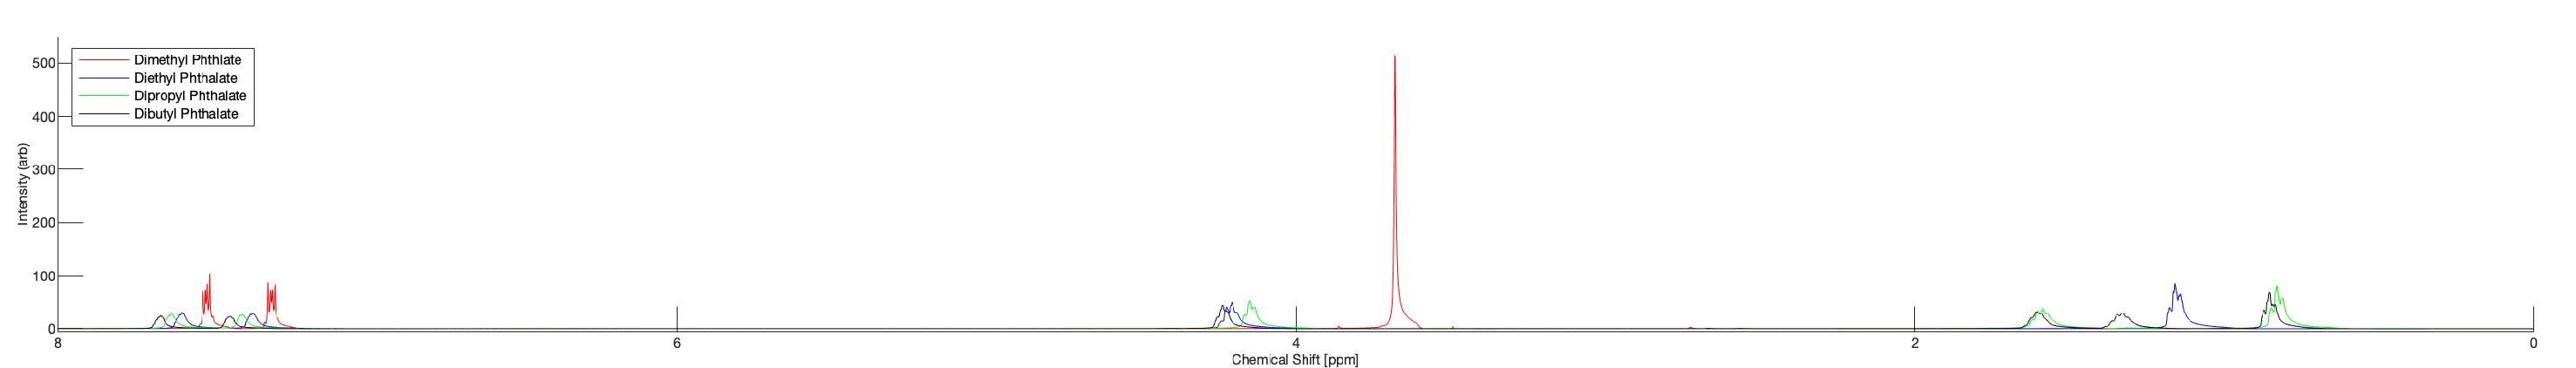
Figure1. ¹HNMRSpectraofPhthalateStandards:¹HNMRspectraofdimethyl(red),diethyl(blue),dipropyl(green,anddibutyl(black)phthalatestandards.Thepeaksanalyzedforthisstudywerethosecorrespondingtothe methylgroupsofeachcompound,foundat~3.8ppm(MP), ~1.2ppm(EP),~0.83ppm(PP)and~0.85ppm(BP)
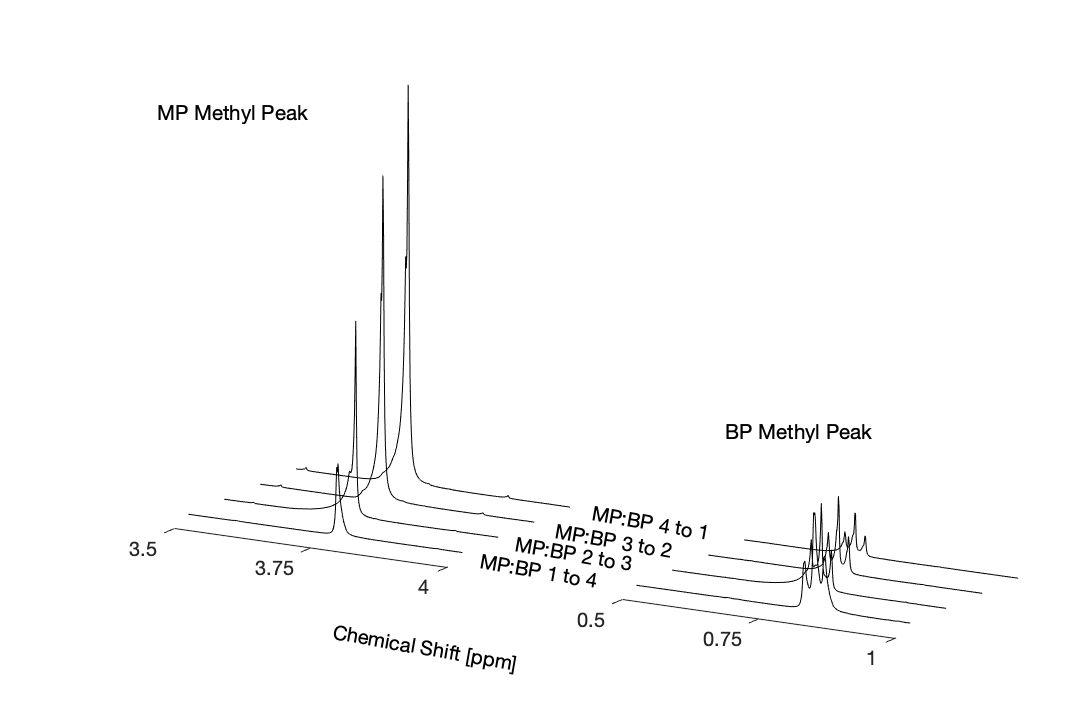
Figure 2. Comparison of ¹H NMR Methyl Peak of Dimethyl and Dibutyl Phthalates: Stacked ¹H NMR spectra of binary mixtures of dimethyl (MP) and dibutyl (BP) phthalate showing the methyl resonance regions from for the MP methyl peak (3.68 ppm) and BP methyl peak (0.83 ppm) vary as mixture composition changes gradually from1:4to4:1
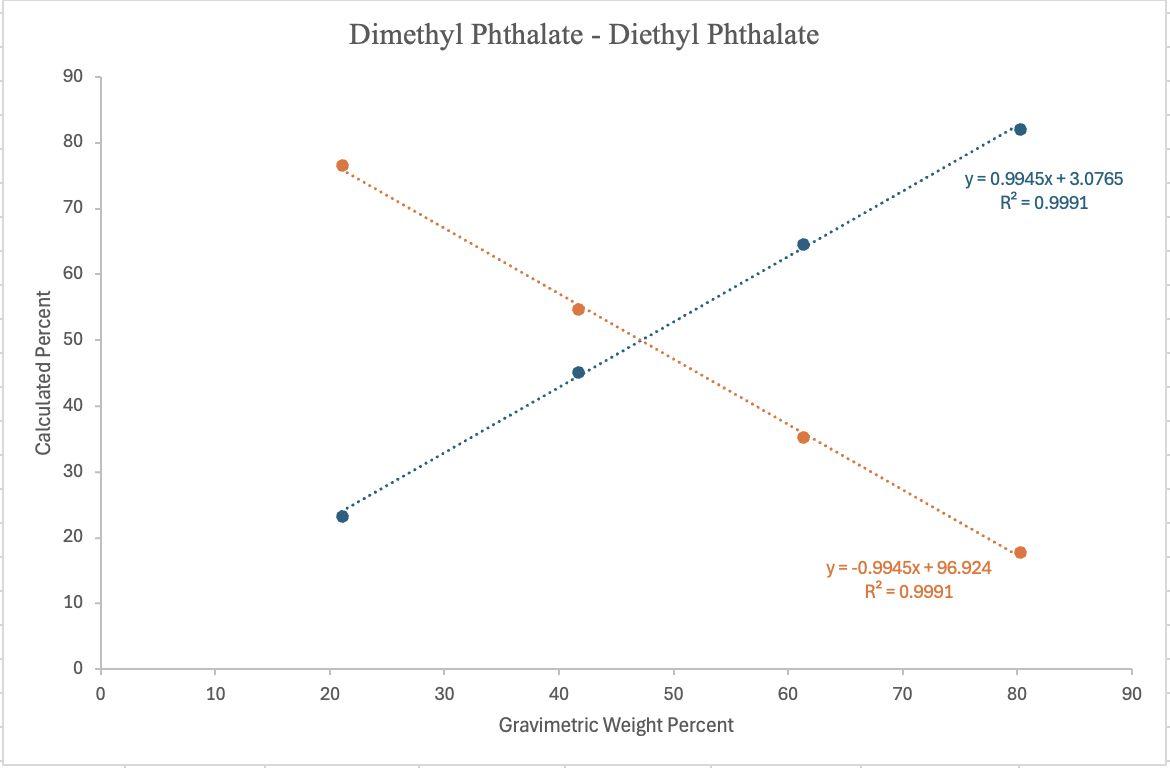
Figure3. ¹H NMR-determined calculated weight percent, determined from the relative integration of diagnostic methyl resonances, plotted against gravimetric weight percent for MP (blue) & EP (orange) in MP:EP binary mixtures. Linear regressionequationsare:
MP (y = 0.9945x + 3.0765, R² =0.9991)and
EP (y = –0.9945x + 96.324, R² =0.9991)
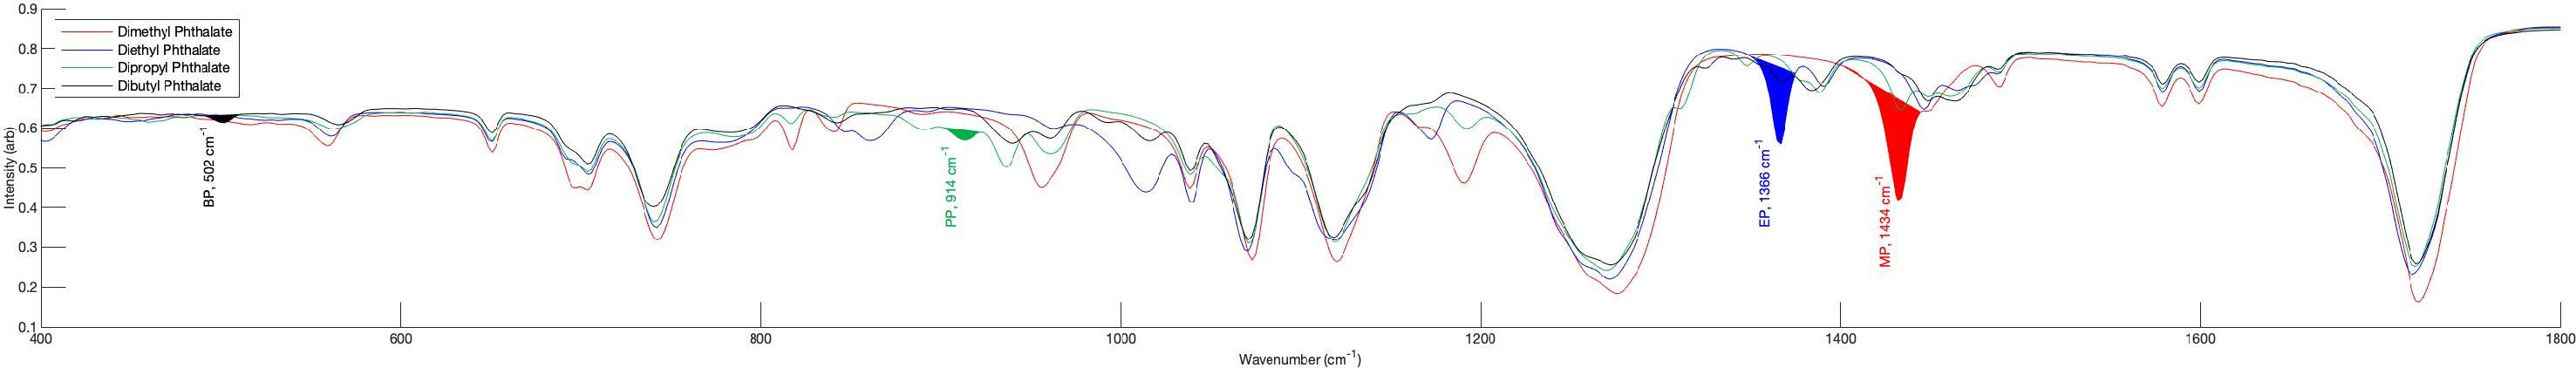
Figure4. FTIRSpectraofPhthalateStandards:FTIRspectraofpuredimethyl(red),diethyl(blue),dipropyl(green),anddibutyl(black)phthalatestandardshighlightingdifferenceswithinthefingerprintregion(400–1500 cm¹).Distinctdiagnosticbandsarelabeledforeachcompound:BP(502cm¹),PP(914cm¹),EP(1366cm¹),andMP(1434cm¹).
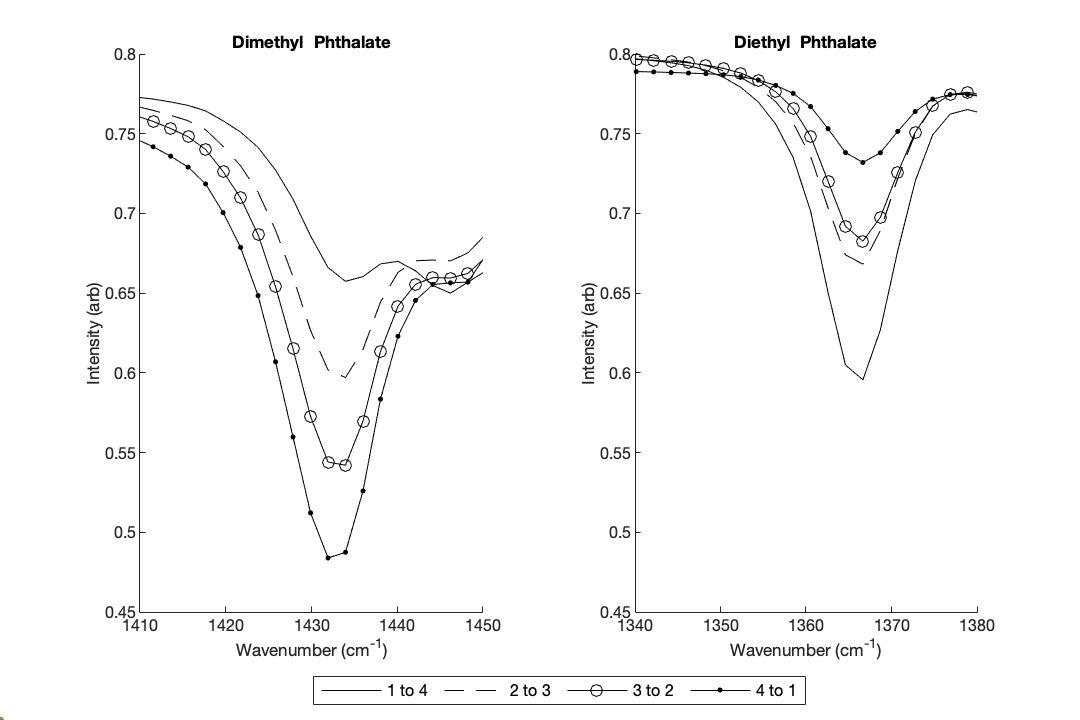
Figure 5. FTIR Spectra for Dimethyl-Dibutyl Phthalate Mixtures: Zoomed FTIR spectra comparing the 1410–1450 cm¹ (Dimethyl Phthalate, left) and 490–530 cm¹ (Dibutyl Phthalate, right) regions across binary mixture ratios (1:4 [solid line], 2:3 [dashed line], 3:2 [solid line with circles], 4:1 [solidlinewithdots]).
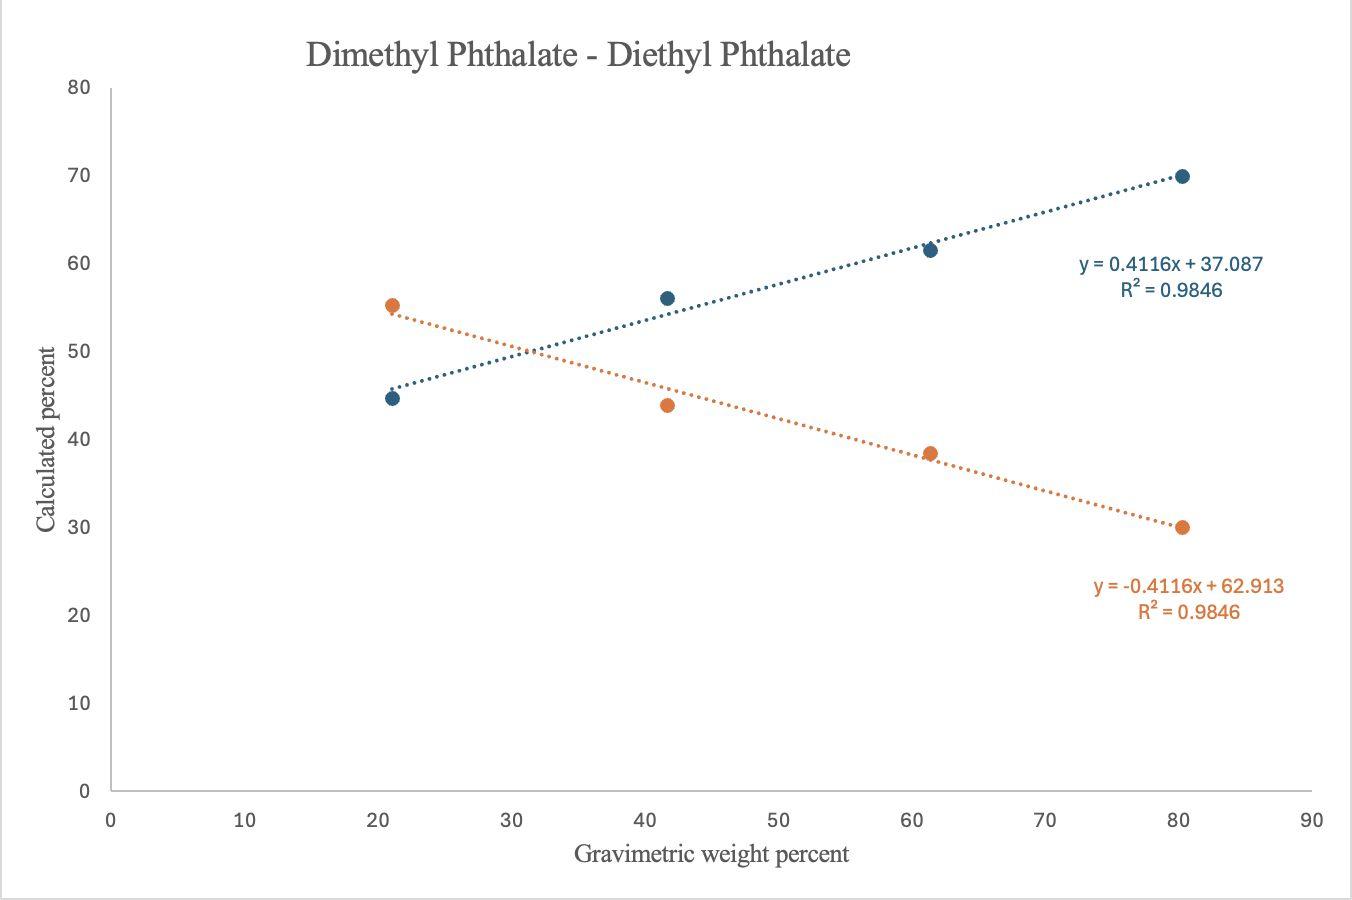
Figure 6. FTIR-determined calculated weight percent composition, determined using relative peak intensities, plotted against gravimetric weight percent for MP (blue) & EP (orange) in MP:EP binary mixtures of various compositions. Linear regression equations are: MP (y = 0.4116x + 37.087, R² = 0.9846) and EP (y = –0.4116x + 62.913, R²=0.9846)
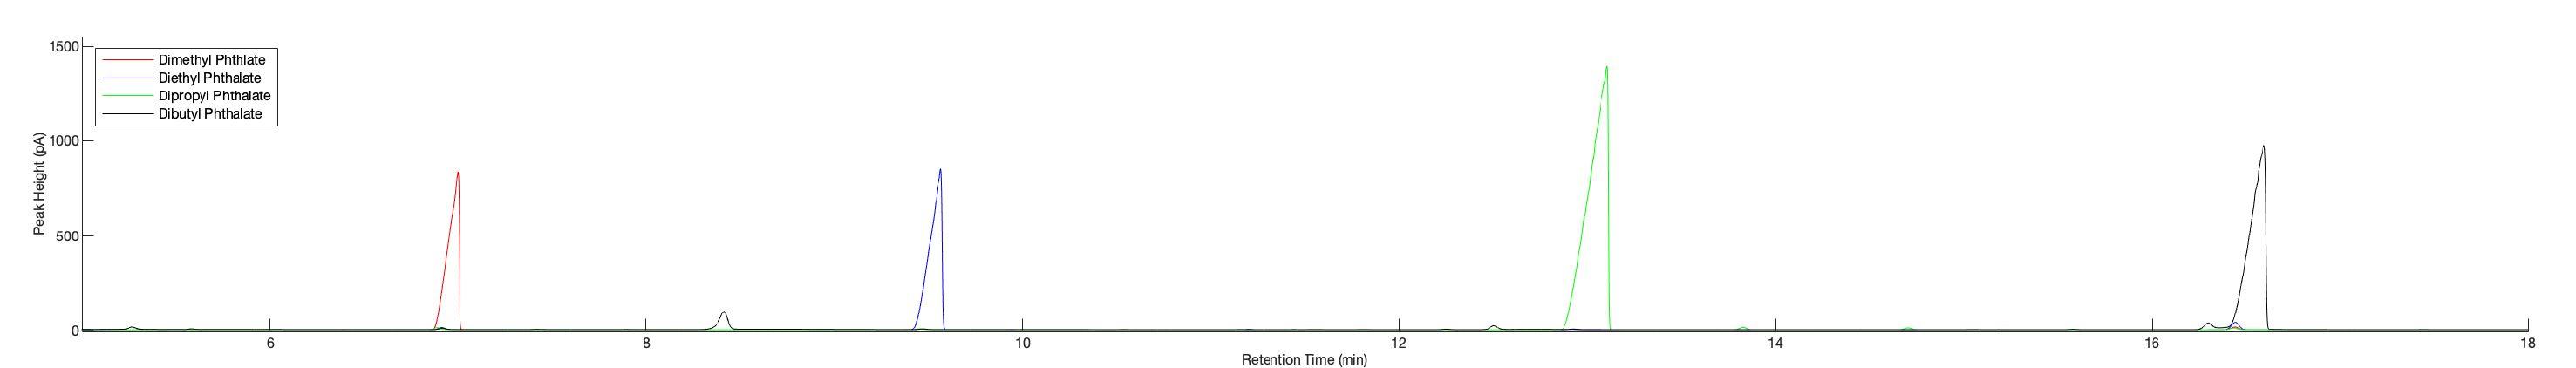
Figure7: GasChromatogramsoffourphthalatestandards:GC–FIDchromatogramshowingtheretentiontimesandpeakintensitiesofthefourindividualphthalatestandardsanalyzed.Thecompoundsandtheircorresponding peaksare:dimethylphthalate(red,~7.0min),diethylphthalate(blue,~9.3min),dipropylphthalate(green,~12.8min),anddibutylphthalate(black,~16.2min).
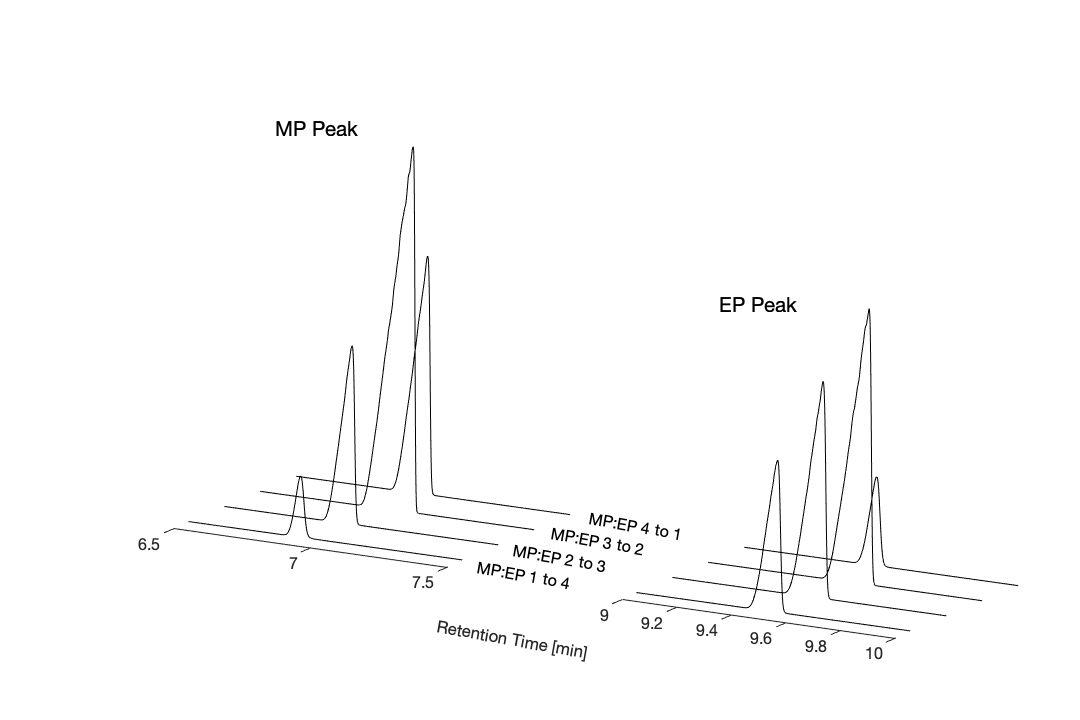
Figure 8. Stacked GC chromatogramsshowingMPand EP peaks across MP:EP mixtures (1:4, 2:3, 3:2, 4:1). Peak intensities change proportionally with mixture composition, allowing clear differentiationandquantification ofMPandEP.
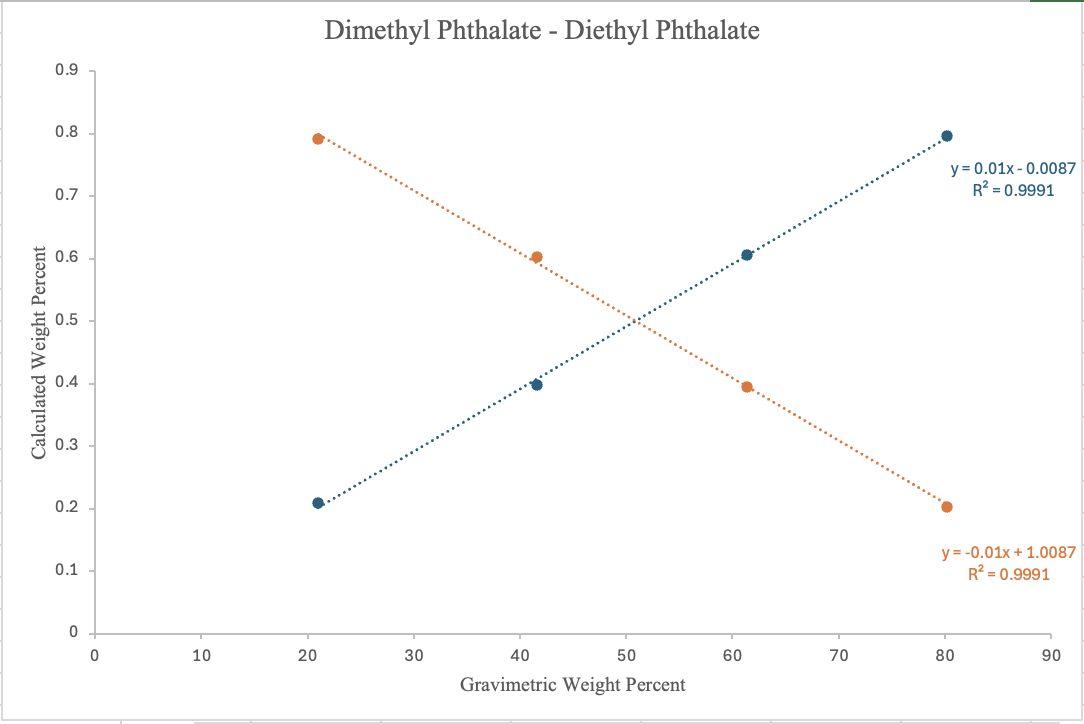
Figure 9. GC–FID-determined calculated weight percent composition, determined from relative peak integrations, plotted against gravimetric weight percent for MP (blue) and EP (orange) in MP:EP binary mixtures of various compositions. Linear regression equations are: MP (y = 0.01x 0.0087, R² = 0.9991) and EP (y = -0.01x + 1.0087, R² = 0.9846)

Experimental methods
ProtonNuclearMagneticResonanceSpectroscopy(¹HNMR): ¹H NMR spectra were obtained using a 400 MHz JEOL ECS-400 NMR spectrometer. Short-chain phthalates diesters exist as liquids at room temperature,sosampleswererunneatandintheabsenceofsolvent.Each sample was run as a 1D proton NMR at 0.25 Hz resolution and a relaxation delay of 5 seconds. JEOL Delta NMR software version 6.0.0 (WindowsOS) and a MATLAB_R2025a app (code developed in-house) wereusedtoanalyzespectra.
GasChromatography–FlameIonizationDetection(GC–FID): GC–FIDchromatogramswereobtainedusinganAgilent6890NGC–FID with an HP-5 capillary column and OpenLab ChemStation software. The oven was set at an initial temperature of 120ºC and the final temperature set at 215ºC with ramp rate of 5.00ºC per minute. Following the initial ramp up, the oven climbed to a final temp of 290ºC with a ramp rate of 50ºC.EachchromatogramwasanalyzedusingaMATLAB_2024ascript.
Fourier-TransformInfraredSpectroscopy(FTIR):
FTIR spectra were obtained using a Bruker® Alpha FTIR model spectrometer with platinum attenuated total reflectance (ATR), quick snap module, and diamond crystal. Each sample was analyzed by pressing 10 ��L of sample between the anvil and the diamond crystal, Each final spectrum represents the average after 16 scans at a resolution of4cm-1.Bruker®OPUSsoftwareversion7.0.122. wasusedtoanalyzeindividualspectra
Conclusions
¹H NMR spectra displayed distinct alkyl proton resonances for each phthalate ester, allowing for differentiation between compounds based on chemical shifts and splitting patterns. Spectral deconvolution was applied to overlapping peaks. FTIR spectra exhibited unique absorbance bands in the fingerprint region for the four pure phthalates, enabling compound identification. GC-FID generated fully resolved chromatograms for all samples, with clearly distinguishable retention times for each phthalate ester. Integrated peak areas from the NMR spectra and GC chromatograms, and peak intensities from FTIR spectra were used to calculate the relative concentrations of dimethyl, diethyl, dipropyl, and dibutyl phthalates in binary mixtures with a high degree of accuracy. The combined analytical approach demonstrated that ¹H NMR, FTIR, and GC-FID can accurately quantify phthalate esters when present in binary mixtures simultaneously. Overall, these results confirm the reliability of spectroscopic and chromatographic methods for the identification and quantificationoftheseshort-chainalkylphthalates.
References
1. D’Amelia,R.P.;Kreth,E.H.ApplicationofMolecularSpectroscopiesfortheCompositionalAnalysis ofShortChainCinnamylEsterMixtures. World Journal of Analytical Chemistry 2024, 9(1),1-9.
2. Plant-BasedBioactivePhthalatesDerivedfrom Hibiscus rosa-sinensis AsInVitroandInSilico EnzymeInhibition,FarahYasmin,Zill-i-HumaNazli,NusratShafiq,MaryamAslam,YousefA.Bin Jardan,Hiba-AllahNafidi,andMohammedBourhia ACS Omega 2023 8 (36),32677-32689.DOI: 10.1021/acsomega.3c03342
3. D’Amelia,R.P.;Prasad,S.;Rooney,M.T.CompositionalAnalysisofShort-chainAlkyl(C1-C4) SalicylateEsterMixturesbyVariousQuantitativeAnalyticalTechniques. World Journal of Analytical Chemistry 2025 10(1),6-15.DOI:10.12691/wjac-10-1-2
Acknowledgements
We acknowledge financial support from a Hofstra HCLAS faculty research & Development Grant awardedtoDr.R.P.D’Amelia,andastartupfundprovidedtoDrM.T.RooneybyHofstraUniversity.
MatthewNeryaev*,MichaelLeone*,MaryT.Rooney,and
P.D’Amelia,DepartmentofChemistry,HofstraUniversity.Hempstead,NY11549