DATA FILE
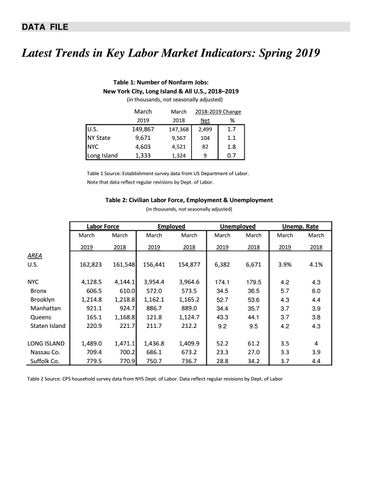
Latest Trends in Key Labor Market Indicators: Spring 2019 Table 1: Number of Nonfarm Jobs: New York City, Long Island & All U.S., 2018–2019 (in thousands, not seasonally adjusted)
March
March 2018 147,368 9,567 4,521 1,324
2019
U.S. NY State NYC Long Island
149,867 9,671 4,603 1,333
2018-2019 Change Net % 1.7 2,499 1.1 104 82 1.8 9 0.7
Table 1 Source: Establishment survey data from US Department of Labor. Note that data reflect regular revisions by Dept. of Labor.
Table 2: Civilian Labor Force, Employment & Unemployment (in thousands, not seasonally adjusted)
Labor Force
Employed
Unemployed
Unemp. Rate
March
March
March
March
March
March
March
March
2019
2018
2019
2018
2019
2018
2019
2018
AREA U.S.
162,823
161,548
156,441
154,877
6,382
6,671
3.9%
4.1%
NYC Bronx Brooklyn Manhattan Queens Staten Island
4,128.5 606.5 1,214.8 921.1 165.1 220.9
4,144.1 610.0 1,218.8 924.7 1,168.8 221.7
3,954.4 572.0 1,162.1 886.7 121.8 211.7
3,964.6 573.5 1,165.2 889.0 1,124.7 212.2
174.1 34.5 52.7 34.4 43.3 9.2
179.5 36.5 53.6 35.7 44.1 9.5
4.2 5.7 4.3 3.7 3.7 4.2
4.3 6.0 4.4 3.9 3.8 4.3
LONG ISLAND Nassau Co. Suffolk Co.
1,489.0 709.4 779.5
1,471.1 700.2 770.9
1,436.8 686.1 750.7
1,409.9 673.2 736.7
52.2 23.3 28.8
61.2 27.0 34.2
3.5 3.3 3.7
4 3.9 4.4
Table 2 Source: CPS household survey data from NYS Dept. of Labor. Data reflect regular revisions by Dept. of Labor