DATA FILE
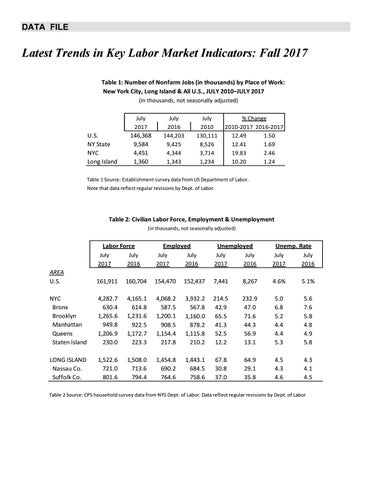
Latest Trends in Key Labor Market Indicators: Fall 2017 Table 1: Number of Nonfarm Jobs (in thousands) by Place of Work: New York City, Long Island & All U.S., JULY 2010–JULY 2017 (in thousands, not seasonally adjusted) July 2017
U.S. NY State NYC Long Island
146,368 9,584 4,451 1,360
July 2016 144,203 9,425 4,344 1,343
July 2010 130,111 8,526 3,714 1,234
% Change 2010‐2017 2016‐2017 12.49 1.50 12.41 1.69 19.83 2.46 10.20 1.24
Table 1 Source: Establishment survey data from US Department of Labor. Note that data reflect regular revisions by Dept. of Labor.
Table 2: Civilian Labor Force, Employment & Unemployment (in thousands, not seasonally adjusted)
Labor Force
Employed
Unemployed
Unemp. Rate
July 2017
July 2016
July 2017
July 2016
July 2017
July 2016
July 2017
July 2016
AREA U.S.
161,911
160,704
154,470
152,437
7,441
8,267
4.6%
5.1%
NYC Bronx Brooklyn Manhattan Queens Staten Island
4,282.7 630.4 1,265.6 949.8 1,206.9 230.0
4,165.1 614.8 1,231.6 922.5 1,172.7 223.3
4,068.2 587.5 1,200.1 908.5 1,154.4 217.8
3,932.2 567.8 1,160.0 878.2 1,115.8 210.2
214.5 42.9 65.5 41.3 52.5 12.2
232.9 47.0 71.6 44.3 56.9 13.1
5.0 6.8 5.2 4.4 4.4 5.3
5.6 7.6 5.8 4.8 4.9 5.8
LONG ISLAND Nassau Co. Suffolk Co.
1,522.6 721.0 801.6
1,508.0 713.6 794.4
1,454.8 690.2 764.6
1,443.1 684.5 758.6
67.8 30.8 37.0
64.9 29.1 35.8
4.5 4.3 4.6
4.3 4.1 4.5
Table 2 Source: CPS household survey data from NYS Dept. of Labor. Data reflect regular revisions by Dept. of Labor