LOCAL LABOR MARKET CONDITIONS
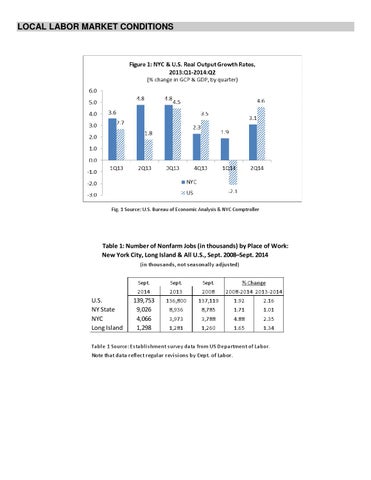
Fig. 1 Source: U.S. Bureau of Economic Analysis & NYC Comptroller
Table 1: Number of Nonfarm Jobs (in thousands) by Place of Work: New York City, Long Island & All U.S., Sept. 2008–Sept. 2014 (in thousands, not seasonally adjusted) Sept.
U.S. NY State NYC Long Island
Sept.
Sept.
% Change 2008-2014 2013-2014
2014
2013
2008
139,753 9,026 4,066 1,298
136,800
137,119
1.92
2.16
8,936
8,785
1.71
1.01
3,973
3,788
4.88
2.35
1,281
1,260
1.65
1.34
Tabl e 1 Source: Es ta bl i s hment s urvey data from US Depa rtment of Labor.
Note that data reflect regular revisions by Dept. of Labor.