DATA FILE
Regional Labor Review
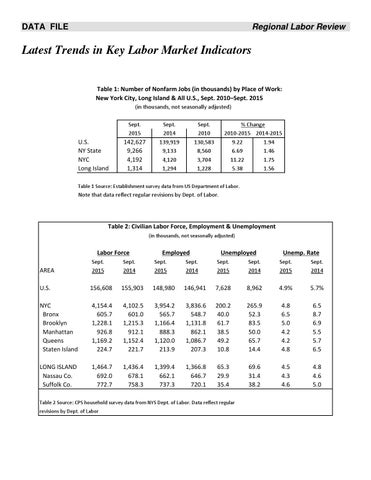
Latest Trends in Key Labor Market Indicators Table 1: Number of Nonfarm Jobs (in thousands) by Place of Work: New York City, Long Island & All U.S., Sept. 2010–Sept. 2015 (in thousands, not seasonally adjusted) Sept. 2015
U.S. NY State NYC Long Island
142,627 9,266 4,192 1,314
Sept. 2014 139,919 9,133 4,120 1,294
% Change 2010‐2015 2014‐2015 9.22 1.94 6.69 1.46 11.22 1.75 5.38 1.56
Sept. 2010 130,583 8,560 3,704 1,228
Table 1 Source: Establishment survey data from US Department of Labor.
Note that data reflect regular revisions by Dept. of Labor.
Table 2: Civilian Labor Force, Employment & Unemployment (in thousands, not seasonally adjusted)
Labor Force
Employed
Unemployed
Unemp. Rate
AREA
Sept. 2015
Sept. 2014
Sept. 2015
Sept. 2014
Sept. 2015
Sept. 2014
Sept. 2015
Sept. 2014
U.S.
156,608
155,903
148,980
146,941
7,628
8,962
4.9%
5.7%
NYC Bronx Brooklyn Manhattan Queens Staten Island
4,154.4 605.7 1,228.1 926.8 1,169.2 224.7
4,102.5 601.0 1,215.3 912.1 1,152.4 221.7
3,954.2 565.7 1,166.4 888.3 1,120.0 213.9
3,836.6 548.7 1,131.8 862.1 1,086.7 207.3
200.2 40.0 61.7 38.5 49.2 10.8
265.9 52.3 83.5 50.0 65.7 14.4
4.8 6.5 5.0 4.2 4.2 4.8
6.5 8.7 6.9 5.5 5.7 6.5
LONG ISLAND Nassau Co. Suffolk Co.
1,464.7 692.0 772.7
1,436.4 678.1 758.3
1,399.4 662.1 737.3
1,366.8 646.7 720.1
65.3 29.9 35.4
69.6 31.4 38.2
4.5 4.3 4.6
4.8 4.6 5.0
Table 2 Source: CPS household survey data from NYS Dept. of Labor. Data reflect regular revisions by Dept. of Labor