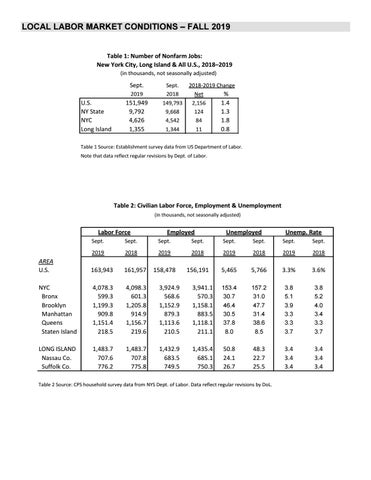
LOCAL LABOR MARKET CONDITIONS – FALL 2019 Table 1: Number of Nonfarm Jobs: New York City, Long Island & All U.S., 2018–2019 (in thousands, not seasonally adjusted)
Sept. 2019
U.S. NY State NYC Long Island
151,949 9,792 4,626 1,355
Sept. 2018 149,793 9,668 4,542 1,344
2018-2019 Change % Net 2,156 1.4 124 1.3 84 1.8 11 0.8
Table 1 Source: Establishment survey data from US Department of Labor. Note that data reflect regular revisions by Dept. of Labor.
Table 2: Civilian Labor Force, Employment & Unemployment (in thousands, not seasonally adjusted)
Labor Force
Employed
Unemployed
Unemp. Rate
Sept.
Sept.
Sept.
Sept.
Sept.
Sept.
Sept.
Sept.
2019
2018
2019
2018
2019
2018
2019
2018
AREA U.S.
163,943
161,957
158,478
156,191
5,465
5,766
3.3%
3.6%
NYC Bronx Brooklyn Manhattan Queens Staten Island
4,078.3 599.3 1,199.3 909.8 1,151.4 218.5
4,098.3 601.3 1,205.8 914.9 1,156.7 219.6
3,924.9 568.6 1,152.9 879.3 1,113.6 210.5
3,941.1 570.3 1,158.1 883.5 1,118.1 211.1
153.4 30.7 46.4 30.5 37.8 8.0
157.2 31.0 47.7 31.4 38.6 8.5
3.8 5.1 3.9 3.3 3.3 3.7
3.8 5.2 4.0 3.4 3.3 3.7
LONG ISLAND Nassau Co. Suffolk Co.
1,483.7 707.6 776.2
1,483.7 707.8 775.8
1,432.9 683.5 749.5
1,435.4 685.1 750.3
50.8 24.1 26.7
48.3 22.7 25.5
3.4 3.4 3.4
3.4 3.4 3.4
Table 2 Source: CPS household survey data from NYS Dept. of Labor. Data reflect regular revisions by DoL.