LOCAL LABOR MARKET CONDITIONS
Spring 2014
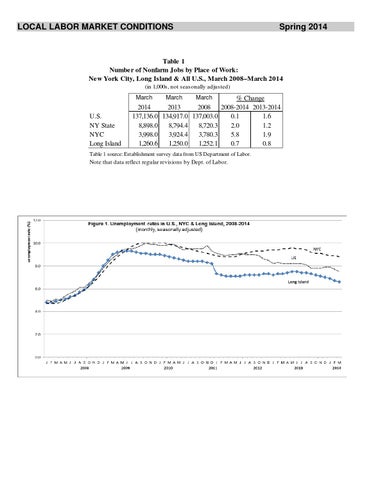
Table 1 Number of Nonfarm Jobs by Place of Work: New York City, Long Island & All U.S., March 2008–March 2014 (in 1,000s, not seasonally adjusted) March
U.S. NY State NYC Long Island
March
March
2014 2013 2008 137,136.0 134,917.0 137,003.0 8,898.0 8,794.4 8,720.3 3,998.0 3,924.4 3,780.3 1,260.6 1,250.0 1,252.1
% Change 2008-2014 2013-2014 0.1 1.6 2.0 1.2 5.8 1.9 0.7 0.8
Table 1 source: Establishment survey data from US Department of Labor.
Note that data reflect regular revisions by Dept. of Labor.