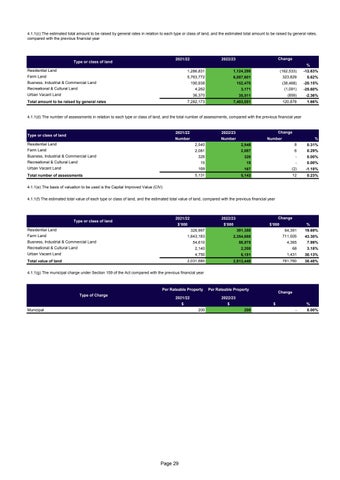
4.1.1(c) The estimated total amount to be raised by general rates in relation to each type or class of land, and the estimated total amount to be raised by general rates, compared with the previous financial year
2021/22
Type or class of land
Change
2022/23
%
Residential Land
1,286,831
1,124,298
Farm Land
5,763,772
6,087,601
323,829
5.62%
190,938
152,470
(38,468)
-20.15%
Busness, Industrial & Commercial Land Recreational & Cultural Land
-12.63%
4,262
3,171
(1,091)
-25.60%
36,370
35,511
(859)
-2.36%
7,282,173
7,403,051
120,878
1.66%
Urban Vacant Land Total amount to be raised by general rates
(162,533)
4.1.1(d) The number of assessments in relation to each type or class of land, and the total number of assessments, compared with the previous financial year
Type or class of land
2021/22
2022/23
Number
Number
Change Number
%
Residential Land
2,540
2,548
8
0.31%
Farm Land
2,081
2,087
6
0.29%
326
326
-
0.00%
15
15
-
0.00%
169
167
(2)
-1.18%
5,131
5,143
12
0.23%
Busness, Industrial & Commercial Land Recreational & Cultural Land Urban Vacant Land Total number of assessments 4.1.1(e) The basis of valuation to be used is the Capital Improved Value (CIV)
4.1.1(f) The estimated total value of each type or class of land, and the estimated total value of land, compared with the previous financial year
Type or class of land
2021/22
2022/23
$’000
$’000
Residential Land
Change $’000
%
326,997
391,388
64,391
19.69%
1,643,183
2,354,688
711,505
43.30%
54,610
58,975
4,365
7.99%
Recreational & Cultural Land
2,140
2,208
68
3.18%
Urban Vacant Land
4,750
6,181
1,431
30.13%
Total value of land
2,031,680
2,813,440
781,760
38.48%
Farm Land Busness, Industrial & Commercial Land
4.1.1(g) The municipal charge under Section 159 of the Act compared with the previous financial year
Type of Charge
Per Rateable Property
Per Rateable Property
2021/22
2022/23
$ Municipal
$ 200
Page 29
Change $
200
% -
0.00%


