

Serving the communities of Highlands Ranch and Solstice. 20 23 Water Quality Report
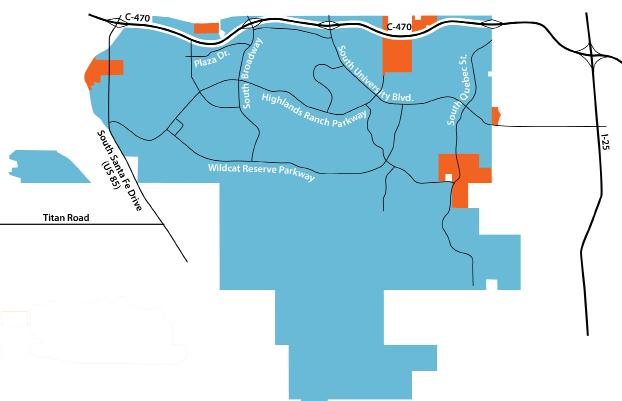
Centennial Water and Sanitation District is the water and wastewater provider for the communities of Highlands Ranch and Solstice. The district has provided water and wastewater services to residential and commercial customers for nearly four decades. Centennial Water provides high quality water through the Joseph B. Blake Water Treatment Plant located in Highlands Ranch. Wastewater is treated at the Marcy Gulch Wastewater Treatment Plant to meet stringent water quality standards before it is returned to the South Platte River.
Over the past 25 years, approximately 90 percent of the water supplied has come from renewable river supplies.
This annual Water Quality Report is produced each spring. The document is a requirement of the Environmental Protection Agency to provide water quality data to our customers.
Centennial Water & Sanitation District
Northern Douglas County Water & Sanitation District
Customer Quick Facts
30,800
7,550 950
single family homes
multi-family units commercial customers
Table of Contents
2
Centennial Water and Sanitation District Terms and Abbreviations East Cherry Creek Valley Denver Water City of Aurora 2-7 8 9-12 13-19 20-23
We are pleased to present you this year’s water quality report. Centennial Water & Sanitation District is committed to providing a safe and dependable supply of high-quality drinking water. Last year, as in years past, your tap water met all U.S. Environmental Protection Agency (EPA) and state drinking water health standards. Please contact Nick Marusin at 303-791-2185 with any questions or for public participation opportunities that may affect water quality. Please see the water quality data from our wholesale system(s) (included in this report) for additional information about your drinking water. A portion of Centennial Water’s surface water supply is through leases with other water providers therefore their water quality reports are contained within this report.
General Information
All drinking water, including bottled water, may reasonably be expected to contain at least small amounts of some contaminants. The presence of contaminants does not necessarily indicate the water poses a health risk. More information about contaminants and potential health effects can be obtained by calling the Environmental Protection Agency’s Safe Drinking Water Hotline (1-800-4264791) or by visiting epa.gov/ground-water-and-drinking-water.
Some people may be more vulnerable to contaminants in drinking water than the general population. Immunocompromised persons such as persons with cancer undergoing chemotherapy, persons who have undergone organ transplants, people with HIV-AIDS or other immune system disorders, some elderly, and infants can be particularly at risk of infections. These people should seek advice about drinking water from their healthcare providers. For more information about contaminants and potential health effects, or to receive a copy of the U.S. Environmental Protection Agency (EPA) and the U.S. Centers for Disease Control (CDC) guidelines on appropriate means to lessen the risk of infection by Cryptosporidium and microbiological contaminants, call the EPA Safe Drinking Water Hotline at (1-800-426-4791).
The sources of drinking water (both tap water and bottled water) include rivers, lakes, streams, ponds, reservoirs, springs and wells. As water travels over the surface of the land or through the ground, it dissolves naturally occurring minerals and, in some cases, radioactive material, and can pick up substances resulting from the presence of animals or from human activity. Contaminants that may be present in source water include:
● Microbial contaminants: viruses and bacteria that may come from sewage treatment plants, septic systems, agricultural livestock operations, and wildlife.
● Inorganic contaminants: salts and metals, which can be naturally-occurring or result from urban stormwater runoff, industrial or domestic wastewater discharges, oil and gas production, mining, or farming.
● Pesticides and herbicides: may come from a variety of sources, such as agriculture, urban stormwater runoff, and residential uses.
● Radioactive contaminants: can be naturally occurring or be the result of oil and gas production and mining activities.
● Organic chemical contaminants: including synthetic and volatile organic chemicals, which are byproducts of industrial processes and petroleum production, and also may come from gas stations, urban stormwater runoff and septic systems.
In order to ensure tap water is safe to drink, the Colorado Department of Public Health and Environment prescribes regulations limiting the amount of certain contaminants in water provided by public water systems. The Food and Drug Administration regulations establish limits for contaminants in bottled water that must provide the same protection for public health.
Lead in Drinking Water
If present, elevated levels of lead can cause serious health problems (especially for pregnant women and young children). It is possible lead levels at your home may be higher than other homes in the community as a result of materials used in your home’s plumbing. If you are concerned about lead in your water, you may wish to have your water tested. When your water has been sitting for several hours, you can minimize the potential for lead exposure by flushing your tap for 30 seconds to two minutes before using water for drinking or cooking. Additional information on lead in drinking water, testing methods, and steps you can take to minimize exposure is available from the Safe DrinkingWater Hotline (1-800-426-4791) or at epa.gov/safewater/lead
Centennial Water & Sanitation District’s 2023 Drinking Water Quality Report PWSID: CO 0118015
3
Source Water Assessment and Protection
(SWAP)
The Colorado Department of Public Health and Environment has provided us with a Source Water Assessment Report for our water supply. For general information or to obtain a copy of the report please visit wqcdcompliance.com/ccr. The report is located under “Guidance: Source Water Assessment Reports.” Search the table using 118015, CENTENNIAL WSD, or by contacting Nick Marusin at 303-791-2185. The Source Water Assessment Report provides a screening-level evaluation of potential contamination that could occur. It does not mean the contamination has or will occur. We can use this information to evaluate the need to improve our current water treatment capabilities and prepare for future contamination threats. This can help us ensure quality finished water is delivered to your homes. In addition, the source water assessment results provide a starting point for developing a source water protection plan. Potential sources of contamination in our source water area are listed below. Please contact us to learn more about what you can do to help protect your drinking water sources, any questions about the Drinking Water Quality Report, to learn more about our system, or to attend scheduled public meetings. We want you, our valued customers, to be informed about the services we provide and the quality water we deliver to you every day.
Potential Source(s) of Contamination:
EPA Abandoned Contaminated Sites, EPA Hazardous Waste Generators, EPA Chemical Inventory/Storage Sites, Permitted Wastewater Discharge Sites, Aboveground, Underground and Leaking Storage Tank Sites, Solid Waste Sites, Existing/ Abandoned Mine Sites, Other Facilities, Commercial/Industrial/Transportation, High Intensity Residential, Low Intensity Residential, Row Crops, Fallow, Pasture / Hay, Evergreen Forest, Septic Systems, Road Miles
PURCHASED FROM CO0116001
(Surface Water-Consecutive Connection)
WELL D9 (Groundwater-Well)
WELL TD4 (Groundwater-Well)
WELL TD5 (Groundwater-Well)
WELL TD6 (Groundwater-Well)
WELL TD12 (Groundwater-Well)
WELL A6R (Groundwater-Well)
WELL A12R (Groundwater-Well)
WELL D1 (Groundwater-Well)
WELL D12R (Groundwater-Well)
WELL LFH2 (Groundwater-Well)
WELL LFH7 (Groundwater-Well)
WELL LFH8R (Groundwater-Well)
WELL LFH9 (Groundwater-Well)
WELL LFH10R (Groundwater-Well)
WELL LFH11 (Groundwater-Well)
WELL LFH13 (Groundwater-Well)
WELL LFH14R (Groundwater-Well)
WELL LFH15 (Groundwater-Well)
WELL SP-9 (Groundwater UDI Surface Water-Well)
WELL SP-10 (Groundwater UDI Surface Water-Well)
WELL SP-11 (Groundwater UDI Surface Water-Well)
WELL SP-12 (Groundwater UDI Surface Water-Well)
SOUTH PLATTE RESERVIOIR (Surface Water-Reservoir)
ENGLEWOOD CITY DITCH (Surface Water-Intake)
PURCHASED WATER WISE
CO0103843 (Surface WaterConsecutive Connection)
WELL D10A (Groundwater-Well)
MCLELLAN RESERVOIR (Surface Water-Intake)
WELL LFH4R (Groundwater-Well)
WELL D7 (Groundwater-Well)
WELL A5R (Groundwater-Well)
WELL A7R (Groundwater-Well)
WELL A11R (Groundwater-Well)
PA-7S REDRILL (Groundwater-Well)
WELL A8 (Groundwater-Well)
WELL D5 (Groundwater-Well)
WELL D11 (Groundwater-Well)
WELL D13 (Groundwater-Well)
WELL D15 (Groundwater-Well)
WELL D19 (Groundwater-Well)
WELL A9R (Groundwater-Well)
WELL A10R (Groundwater-Well)
WELL A13R (Groundwater-Well)
WELL D14 (Groundwater-Well)
WELL D16 (Groundwater-Well)
WELL D17 (Groundwater-Well)
WELL D18 (Groundwater-Well)
WELL D20 (Groundwater-Well)
WELL TD7 (Groundwater-Well)
WELL TD8 (Groundwater-Well)
WELL TD9 (Groundwater-Well)
WELL A1 (Groundwater-Well)
WELL TD10 (Groundwater-Well)
WELL LFH3 (Groundwater-Well)
WELL A2 (Groundwater-Well)
WELL A3 (Groundwater-Well)
WELL A4 (Groundwater-Well)
Questions about your water quality? View the FAQs on our website at centennialwater.org/waterquality to learn more.
4 Centennial Water & Sanitation District’s 2023 Drinking Water Quality Report PWSID: CO 0118015
Sources (water type - source type)
Centennial Water & Sanitation District’s 2023 Drinking Water Quality Report PWSID: CO 0118015
Detected Contaminants
Centennial Water routinely monitors for contaminants in your drinking water according to Federal and State laws. The following table(s) show all detections found in the period of January 1 to December 31, 2022 unless otherwise noted. The State of Colorado requires us to monitor for certain contaminants less than once per year because the concentrations of these contaminants are not expected to vary significantly from year to year, or the system is not considered vulnerable to this type of contamination. Therefore, some of our data, though representative, may be more than one year old. Violations and Formal Enforcement Actions, if any, are reported in the next section of this report.
Note: Only detected contaminants sampled within the last five years appear in this report. If no tables appear in this section then no contaminants were detected in the last round of monitoring.
*If minimum ratio not met and no violation identified then the system achieved compliance using alternative criteria.
5 Range Sample MCL Name Year Average Low-High Size MCL MCLG Violation Typical Sources Total Haloacetic 2022 9.07 0-14 32 60 N/A No Byproduct of drinking water Acids (HAA5) (ppb) disinfection Total Trihalomethanes 2022 22.75 0-38.4 32 80 N/A No Byproduct of drinking water (TTHM) (ppb) disinfection
Contaminant Range Sample TT Minimum TT Name Year Average Low-High Size Ratio Violation Typical Sources Total Organic 2022 2.5 1.74-3.66 20 1.00 No Naturally present in the environment Carbon Ratio Disinfectant Time Number of Samples Sample TT Name Period Results Below Level SizeSource Violation MRDL Chloramine December Lowest period % of 0 106 No 4.0 ppm 2022 samples meeting TT requirement: 100% Disinfectants Sampled in the Distribution System TT Requirement: Atleast 95% of samples per period (month or quarter) must be at least 0.2 ppm OR if sample size is less than 40 no more than 1 sample is below 0.2 ppm. Typical Sources: Water additive used to control microbes Contaminant Time 90th Sample 90th Sample Sites 90th Percentile Name Period Percentile Size Percentile AL Above AL AL Exceedance Typical Sources Copper (ppm) 1/10/22-6/28/22 0.54 100 1.3 0 No Corrosion of household plumbing systems; erosion of natural deposits Lead and Copper Sampled in the Distribution System Lead (ppb) 8/1/22-12/6/22 2 100 15 1 No Corrosion of household plumbing systems; erosion of natural deposits Copper (ppm) 8/1/22-12/6/22 .26 100 1.3 0 No Corrosion of household plumbing systems; erosion of natural deposits Lead (ppb) 1/10/22-6/28/22 3 100 15 0 No Corrosion of household plumbing systems; erosion of natural deposits
Disinfection Byproducts Sampled in the Distribution System
Total Organic Carbon (Disinfection Byproducts Precursor) Removal Ratio of Raw and Finished Water
*The MCL for Gross Beta Particle Activity is 4 mrem/year. Since there is no simple conversion between mrem/year and pCi/L, EPA considers 50 pCi/L to be the level of concern for Gross Beta Particle Activity.

Contaminant Sample Level Typical Name Date Found TT Requirement TT Violation Sources Turbidity Aug. Highest single measurement: Maximum 1 NTU for any No Soil runoff 0.11 NTU single measurement Turbidity Dec. Lowest monthly percentage of In any month, at least 95% of No Soil runoff samples meeting TT requirement samples must be less than 0.3 NTU for our technology: 100%
Contaminant Range Sample MCL Name Year Average Low-High Size MCL MCLG Violation Typical Source Combined Uranium (ppb) 2020 0.67 0-1 3 30 0 No Erosion of natural deposits
Summary of Turbidity Sampled at the Entry Point to the Distribution System
Radionuclides Sampled at the Entry Point to the Distribution System Gross Alpha (pCi/L) 2020 1.62 0-3.73 3 15 0 No Erosion of natural deposits Combined Radium (pCi/L) 2020 1.97 0.5-3.7 3 5 0 No Erosion of natural deposits Gross Beta 2020 1.8 0-5.4 3 50 0 No Decay of natural and Particle Activity (pCi/L*) man-made deposits 4
Centennial Water & Sanitation District’s 2023 Drinking Water Quality Report PWSID: CO 0118015
**Secondary standards are non-enforceable guidelines for contaminants that may cause cosmetic effects (such as skin or tooth discoloration) or aesthetic effects (such as taste, odor or color) in drinking water.
Unregulated Contaminants***
EPA has implemented the Unregulated Contaminant Monitoring Rule (UCMR) to collect data for contaminants suspected to be present in drinking water and do not have health-based standards set under the Safe Drinking Water Act. EPA uses results of UCMR monitoring to learn about the occurrence of unregulated contaminants in drinking water and to decide whether or not these comtaminants will be regulated in the future. We performed monitoring and reported analytical results to EPA in accordance with its UCMR. Once EPA reviews results, results are made available in the EPA’s National Contaminant Occurrence Database (NCOD) (epa.gov/dwucmr/national-contaminant-occurrence-database-ncod). Consumers can review results by accessing the NCOD. Contaminants detected during UCMR sampling and corresponding analytical results are provided below.
None reported.
***More information about the contaminants that were included in UCMR monitoring can be found at: drinktap.org/Water-Info/Whats-in-My-Water/UnregulatedContaminant-Monitoring-Rule-UCMR. Learn more about the EPA UCMR at: epa.gov/dwucmr/learn-about-unregulated-contaminant/monitoring-rule or contact the Safe Drinking Water Hotline at (800) 426-4791 or epa.gov/ground-water-and-drinking-water.
Violations, Significant Deficiencies and Formal Enforcement Actions
No Violations or Formal Enforcement Actions
7
Contaminant Range Sample Name Year Average Low-High Size Secondary Standard Sodium (ppm) 2022 67.53 45.4-81.2 3 N/A Total Dissolved Solids (ppm) 2022 306 91-689 149 500 Secondary Contaminants**
Arsenic (ppb) 2022 1.17 0-2.2 3 10 0 No Erosion of natural deposits; runoff from orchards; runoff from glass and electronics production wastes Inorganic Contaminants Sampled at the Entry Point to the Distribution System Contaminant Range Sample MCL Name Year Average Low-High Size MCL MCLG Violation Typical Source Barium (ppm) 2022 0.07 0.06-0.07 3 2 2 No Discharge of drilling wastes; discharge from metal refineries; erosion of natural deposits Fluoride (ppm) 2022 1.06 0.77-1.3 3 4 4 No Erosion of natural deposits; water additive which promotes strong teeth; discharge from fertilizer and aluminum factories Nitrate (ppm) 2022 0.09 0.07-0.12 3 10 10 No Runoff from fertilizer use; leaching from septic tanks, sewage; erosion of natural deposits Selenium (ppb) 2022 0.5 0-1.5 3 50 50 No Discharge from petroleum and metal refineries; erosion of natural; deposits; discharge from mines
Centennial Water & Sanitation District’s 2023 Drinking Water Quality Report PWSID: CO 0118015
Action Level (AL): The concentration of a contaminant which, if exceeded, triggers treatment or other requirements.
Average (x-bar): Typical value.
Below Reporting Level (BRL): Below the reportable level for an analysis or below the lowest reliable level that can be measured.
Compliance Value (No Abbreviation): Single or calculated value used to determine if regulatory contaminant level (e.g. MCL) is met. Examples of calculated values are the 90th percentile, running annual average (RAA) and locational running annual average (LRAA).
Contaminant: A potentially harmful biological, chemical or radiological substance.
Formal Enforcement Action (No Abbreviation): Escalated action taken by the State (due to the risk to public health, or number or severity of violations) to bring a non-compliant water system back into compliance.
Gross Alpha (No Abbreviation): Gross alpha particle activity compliance value. It includes radium-226, but excludes radon 222 and uranium.
Health-Based: A violation of either a MCL or TT.
Level 1 Assessment: A study of the water system to identify potential problems and determine (if possible) why total coliform bacteria have been found in our water system.
Level 2 Assessment: A very detailed study of the water system to identify potential problems and determine (if possible) why an E. coli MCL violation has occurred and/or why total coliform bacteria have been found in our water system on multiple occasions.
Locational Running Annual Average (LRAA): The average of sample results for samples collected at a particular monitoring location during the most recent four calendar quarters.
Maximum Contaminant Level (MCL): The highest level of a contaminant allowed in drinking water.
Maximum Contaminant Level Goal (MCLG): The level of a contaminant in drinking water, below which there is no known or expected risk to health. MCLGs allow for a margin of safety.
Maximum Residual Disinfectant Level (MRDL): The highest level of a disinfectant allowed in drinking water. There is convincing evidence that addition of a disinfectant is necessary for control of microbial contaminants.
Maximum Residual Disinfectant Level Goal (MRDLG): The level of a drinking water disinfectant, below which there is no known or expected risk to health. MRDLGs do not reflect the benefits of the use of disinfectants to control microbial contaminants.
Nephelometric Turbidity Unit (NTU): Measure of the clarity or cloudiness of water. Turbidity in excess of 5 NTU is just noticeable to the typical person.
Non-Health-Based: A violation that is not a MCL or TT.
Not Applicable (N/A): Does not apply or not available.
Parts per billion = Microorgams per liter (ppb = ug/L): One part per billion corresponds to one minute in 2,000 years, or a single penny in $10,000,000.
Parts per million = Milligrams per liter (ppm = mg/L): One part per million corresponds to one minute in two years, or a single penny in $10,000.
Picocuries per liter (pCi/L): Measure of radioactivity in water.
Range (R): Lowest value to the highest value.
Running Annual Average (RAA): The average of sample results for samples collected during the most recent four calendar quarters.
Sample Size (n): Number or count of values (i.e. number of water samples collected).
Secondary Maximum Contaminant Level (SMCL): Non-enforceable, recommended limits for substances that may affect the taste, odor, color or other aesthetic qualities of drinking water.
Treatment Technique (TT): A required process intended to reduce the level of a contaminant in drinking water.
Variance and Exemptions (V/E): Department permission not to meet a MCL or treatment technique under certain conditions.
Violation (No Abbreviation): Failure to meet a Colorado Primary Drinking Water Regulation.

8 Terms and Abbreviations
We are pleased to present to you this year’s water quality report for East Cherry Creek Valley WSD (ECCV). Our constant goal is to provide you with a safe and dependable supply of drinking water. Please contact Sara Brewer at 303-693-3800 with any questions or for public participation opportunities that may affect water quality in the ECCV service area. Please see the water quality data from the wholesale system(s) (either attached or included in this report) for additional information about your drinking water.
General Information
All drinking water, including bottled water, may reasonably be expected to contain at least small amounts of some contaminants. The presence of contaminants does not necessarily indicate that the water poses a health risk. More information about contaminants and potential health effects can be obtained by calling the Environmental Protection Agency’s Safe Drinking Water Hotline (1-800-426-4791) or by visiting epa.gov/ground-water-and-drinking-water
Some people may be more vulnerable to contaminants in drinking water than the general population. Immunocompromised persons such as persons with cancer undergoing chemotherapy, persons who have undergone organ transplants, people with HIVAIDS or other immune system disorders, some elderly, and infants can be particularly at risk of infections. These people should seek advice about drinking water from their health care providers. For more information about contaminants and potential health effects, or to receive a copy of the U.S. Environmental Protection Agency (EPA) and the U.S. Centers for Disease Control (CDC) guidelines on appropriate means to lessen the risk of infection by Cryptosporidium and microbiological contaminants call the EPA Safe Drinking Water Hotline at (1-800-426-4791).
The sources of drinking water (both tap water and bottled water) include rivers, lakes, streams, ponds, reservoirs, springs, and wells. As water travels over the surface of the land or through the ground, it dissolves naturally occurring minerals and, in some cases, radioactive material, and can pick up substances resulting from the presence of animals or from human activity. Contaminants that may be present in source water include:
● Microbial contaminants: viruses and bacteria that may come from sewage treatment plants, septic systems, agricultural livestock operations, and wildlife.
● Inorganic contaminants: salts and metals, which can be naturally-occurring or result from urban stormwater runoff, industrial or domestic wastewater discharges, oil and gas production, mining, or farming.

● Pesticides and herbicides: may come from a variety of sources, such as agriculture, urban stormwater runoff and residential uses.
● Radioactive contaminants: can be naturally occurring or be the result of oil and gas production and mining activities.
● Organic chemical contaminants: including synthetic and volatile organic chemicals, which are byproducts of industrial processes and petroleum production, and also may come from gas stations, urban stormwater runoff, and septic systems.
In order to ensure tap water is safe to drink, the Colorado Department of Public Health and Environment prescribes regulations limiting the amount of certain contaminants in water provided by public water systems. The Food and Drug Administration regulations establish limits for contaminants in bottled water that must provide the same protection for public health.
9
East Cherry Creek Valley WSD 2023 Drinking Water Quality Report PWSID: CO 0103035
Lead in Drinking Water
If present, elevated levels of lead can cause serious health problems (especially for pregnant women and young children). It is possible that lead levels at your home may be higher than other homes in the community as a result of materials used in your home’s plumbing. If you are concerned about lead in your water, you may wish to have your water tested. When your water has been sitting for several hours, you can minimize the potential for lead exposure by flushing your tap for 30 seconds to two minutes before using water for drinking or cooking. Additional information on lead in drinking water, testing methods, and steps you can take to minimize exposure is available from the Safe Drinking Water Hotline (1-800-426-4791) or at epa.gov/safewater/lead
Source Water Assessment and Protection (SWAP)
The Colorado Department of Public Health and Environment may have provided us with a Source Water Assessment Report for the ECCV water supply. For general information or to obtain a copy of the report please visit wqcdcompliance.com/ccr. The report is located under “Guidance: Source Water Assessment Reports.” Search the table using 103035, EAST CHERRY CREEK VALLEY WSD, or by contacting Sara Brewer at 303-693-3800. The Source Water Assessment Report provides a screening-level evaluation of potential contamination that could occur. It does not mean that the contamination has or will occur. We can use this information to evaluate the need to improve our current water treatment capabilities and prepare for future contamination threats. This can help us ensure quality finished water is delivered to your homes. In addition, the source water assessment results provide a starting point for developing a source water protection plan. Potential sources of contamination in our source water area are listed on the next page.
Please contact us to learn more about what you can do to help protect your drinking water sources, any questions about the Drinking Water Quality Report, to learn more about our system, or to attend scheduled public meetings.
Sources (water type - source type)
WPA 6R WELL (Groundwater-Well)
P2 WELL (Groundwater-Well)
P3 WELL (Groundwater-Well)
P4 WELL (Groundwater-Well)
P5 WELL (Groundwater-Well)
P15 WELL (Groundwater-Well)
P18 WELL (Groundwater-Well)
A10 WELL (Groundwater-Well)
L9 WELL (Groundwater-Well)
A13 WELL (Groundwater-Well)
L12 WELL (Groundwater-Well)
A16 WELL (Groundwater-Well)
L15 WELL (Groundwater-Well)
SA1 WELL (Groundwater-Well)
SL1 WELL (Groundwater-Well)
SA10 WELL (Groundwater-Well)
SL10 WELL (Groundwater-Well)
DA5 WELL (Groundwater-Well)
SAU9 WELL (Groundwater-Well)
SAL9 WELL (Groundwater-Well)
SL9 WELL (Groundwater-Well)
SSA5 WELL (Groundwater-Well)
SSL5 WELL (Groundwater-Well)
SSA6 WELL (Groundwater-Well)
WA4 WELL (Groundwater-Well)
WA5A WELL (Groundwater-Well)
WA6A WELL (Groundwater-Well)
WFH3 WELL (Groundwater-Well)
WPA8 WELL (Groundwater-Well)
WCA1R WELL (Groundwater-Well)
P6 WELL (Groundwater-Well)
E7A WELL (Groundwater-Well)
P8 WELL (Groundwater-Well)
P11 WELL (Groundwater-Well)
P12 WELL (Groundwater-Well)
WFH4 WELL (Groundwater-Well)
WA5R WELL (Groundwater-Well)
WA1A WELL (Groundwater-Well)
WA1B WELL (Groundwater-Well)
P13 WELL (Groundwater-Well)
PURCHASED FROM AURORA 3 ZONE 1 (Surface Water-Consecutive Connection)
PURCHASED FROM AURORA 5 ZONE 2 (Surface Water-Consecutive Connection)
PURCHASED FROM DENVER NORTH (Surface Water-Consecutive Connection)
PURCHASED FROM DENVER WEST (Surface Water-Consecutive Connection)
PURCHASED FROM AURORA 2 ZONE 1 (Surface Water-Consecutive Connection)
PURCHASED FROM AURORA 4 ZONE 2 (Surface Water-Consecutive Connection)
WPA 1R WELL (Groundwater-Well)
WELL E1 (Groundwater-Well)
WELL P14 (Groundwater-Well)
WELL P19 (Groundwater-Well)
WELL P20 (Groundwater-Well)
WELL P21 (Groundwater-Well)
PURCHASED FROM AURORA 1 ZONE 2 (Surface Water-Consecutive Connection)
WPA3 WELL (Groundwater-Well)
DA12 WELL (Groundwater-Well)
A7R WELL (Groundwater-Well)
A8 WELL (Groundwater-Well)
A11 WELL (Groundwater-Well)
A12 WELL (Groundwater-Well)
A14 WELL (Groundwater-Well)
A15 WELL (Groundwater-Well)
A17 WELL (Groundwater-Well)
A18 WELL (Groundwater-Well)
SA7 WELL (Groundwater-Well)
DA13 WELL (Groundwater-Well)
L6 WELL (Groundwater-Well)
L7 WELL (Groundwater-Well)
L8 WELL (Groundwater-Well)
L10 WELL (Groundwater-Well)
L13 WELL (Groundwater-Well)
L18 WELL (Groundwater-Well)
SL6 WELL (Groundwater-Well)
SL7 WELL (Groundwater-Well)
SA4 WELL (Groundwater-Well)
A1 WELL (Groundwater-Well)
L4 WELL (Groundwater-Well)
SA2 WELL (Groundwater-Well)
SL2 WELL (Groundwater-Well)
SA3 WELL (Groundwater-Well)
SL3 WELL (Groundwater-Well)
A2R WELL (Groundwater-Well)
L11 WELL (Groundwater-Well)
SA5 WELL (Groundwater-Well)
SL5 WELL (Groundwater-Well)
SA8 WELL (Groundwater-Well)
SL8 WELL (Groundwater-Well)
A9 WELL (Groundwater-Well)
A19 WELL (Groundwater-Well)
A3 WELL (Groundwater-Well)
L19 WELL (Groundwater-Well)
A4 WELL (Groundwater-Well)
A5R WELL (Groundwater-Well)
A6 WELL (Groundwater-Well)
PURCHASED FROM WISE CO0103843 (Surface Water-Consecutive Connection)
East Cherry Creek Valley WSD 2023 Drinking Water Quality Report PWSID: CO 0103035
10
Potential Source(s) of Contamination:
EPA Hazardous Waste Generators, EPA Chemical Inventory/Storage Sites, Aboveground, Underground and Leaking Storage Tank Sites, Other Facilities, Commercial/Industrial/Transportation, High Intensity Residential, Low Intensity Residential, Urban Recreational Grasses, Fallow, Small Grains, Pasture / Hay, Evergreen Forest, Septic Systems, Road Miles
Detected Contaminants
EAST CHERRY CREEK VALLEY WSD routinely monitors for contaminants in your drinking water according to Federal and State laws. The following table(s) show all detections found in the period of January 1 to December 31, 2022 unless otherwise noted. The State of Colorado requires us to monitor for certain contaminants less than once per year because the concentrations of these contaminants are not expected to vary significantly from year to year, or the system is not considered vulnerable to this type of contamination. Therefore, some of our data, though representative, may be more than one year old. Violations and Formal Enforcement Actions, if any, are reported in the next section of this report.
Note: Only detected contaminants sampled within the last five years appear in this report. If no tables appear in this section then no contaminants were detected in the last round of monitoring.
Disinfectants Sampled in the Distribution System TT Requirement: Atleast 95% of samples per period (month or quarter) must be at least 0.2 ppm OR if sample size is less than 40 no more than 1 sample is below 0.2 ppm. Typical Sources: Water additive used to control microbes
Byproducts Sampled in the Distribution System
11
Disinfectant Time Number of Samples Sample TT Name Period Results Below Level SizeSource Violation MRDL Chloramine December Lowest period % of 0 77 No 4.0 ppm 2022 samples meeting TT requirement: 100%
Contaminant Time 90th Sample 90th Sample Sites 90th Percentile Name Period Percentile Size Percentile AL Above AL AL Exceedance Typical Sources Copper (ppm) 1/10/22-4/11/2022 0.07 61 1.3 0 No Corrosion of household plumbing systems; erosion of natural deposits Lead and Copper Sampled in
Lead (ppb) 7/14/2022-11/15/2022 2 61 15 3 No Corrosion of household plumbing systems; erosion of natural deposits Copper (ppm) 7/14/2022-11/15/2022 0.09 61 1.3 0 No Corrosion of household plumbing systems; erosion of natural deposits Lead (ppb) 1/10/22-4/11/2022 1 61 15 0 No Corrosion of household plumbing systems; erosion of natural deposits Range Sample MCL Name Year Average Low-High Size MCL MCLG Violation Typical Sources Total Haloacetic 2022 9.31 0-19 32 60 N/A No Byproduct of drinking water Acids (HAA5) (ppb) disinfection Total Trihalomethanes 2022 32.16 0-72.2 32 80 N/A No Byproduct of drinking water (TTHM) (ppb) disinfection
East Cherry Creek Valley WSD 2023 Drinking Water Quality Report PWSID: CO 0103035 Get to know Centennial Water Scan the QR code to visit our website
the Distribution System
Disinfection
**Secondary standards are non-enforceable guidelines for contaminants that may cause cosmetic effects (such as skin or tooth discoloration) or aesthetic effects (such as taste, odor or color) in drinking water.
EPA has implemented the Unregulated Contaminant Monitoring Rule (UCMR) to collect data for contaminants suspected to be present in drinking water and do not have health-based standards set under the Safe Drinking Water Act. EPA uses results of UCMR monitoring to learn about the occurrence of unregulated contaminants in drinking water and to decide whether or not these comtaminants will be regulated in the future. We performed monitoring and reported analytical results to EPA in accordance with its UCMR. Once EPA reviews results, results are made available in the EPA’s National Contaminant Occurrence Database (NCOD) (epa.gov/dwucmr/national-contaminant-occurrence-database-ncod). Consumers can review results by accessing the NCOD. Contaminants detected during UCMR sampling and corresponding analytical results are provided below.
None reported.
***More information about the contaminants that were included in UCMR monitoring can be found at: drinktap.org/Water-Info/Whats-in-My-Water/UnregulatedContaminant-Monitoring-Rule-UCMR. Learn more about the EPA UCMR at: epa.gov/dwucmr/learn-about-unregulated-contaminant/monitoring-rule or contact the Safe Drinking Water Hotline at (800) 426-4791 or epa.gov/ground-water-and-drinking-water.
Violations, Significant Deficiencies and Formal Enforcement Actions
No Violations or Formal Enforcement Actions
Gross Alpha (pCi/L) 2021 1.68 0-5.32 8 15 0 No Erosion of natural deposits Contaminant Range Sample MCL Name Year Average Low-High Size MCL MCLG Violation Typical Sources Combined Radium (pCi/L) 2022 1.1 0.2-2 4 5 0 No Erosion of natural deposits Combined Uranium (ppb) 2021 3.5 3-4 8 30 0 No Erosion of natural deposits Radionuclides Sampled at the Entry Point
Distribution
Contaminant Range Sample MCL Name Year Average Low-High Size MCL MCLG Violation Typical Sources Barium (ppm) 2021 0.02 0.01-0.03 8 2 2 No Discharge of drilling wastes; discharge from metal refineries; erosion of natural deposits Chromium (ppb) 2021 0.88 0-2 8 100 100 No Discharge from steel and pulp mills; erosion of natural deposits Fluoride (ppm) 2021 0.44 0.37-0.55 8 4 4 No Erosion of natural deposits; water additive which promotes strong teeth; discharge from fertilizer and aluminum factories Nitrate (ppm) 2022 0.18 0-1 11 10 10 No Runoff from fertilizer use; leaching from septic tanks, sewage, erosion of natural deposits Selenium (ppb) 2021 2.13 2-3 8 50 50 No Discharge from petroleum and metal refineries; erosion of natural deposits; discharge from mines
Sodium (ppm) 2021 61.2 51.4-67.3 8 N/A Contaminant Name Year Average Range Low-High Sample Size Secondary Standard
to the
System
Inorganic Contaminants Sampled at the Entry Point to the Distribution System
Secondary Contaminants**
Unregulated Contaminants***
12
East Cherry Creek Valley WSD 2023 Drinking Water Quality Report PWSID: CO 0103035
We are pleased to present to you this year’s water quality report for the Denver Water service area. Our constant goal is to provide you with a safe and dependable supply of drinking water. Please contact Nicole Poncelet-Johnson at 303-628-5977; 303-628-6039 with any questions or for public participation opportunities that may affect Denver Water’s water quality. Please see the water quality data from wholesale system(s) (either attached or included in this report) for additional information about your drinking water.
General Information
All drinking water, including bottled water, may reasonably be expected to contain at least small amounts of some contaminants. The presence of contaminants does not necessarily indicate that the water poses a health risk. More information about contaminants and potential health effects can be obtained by calling the Environmental Protection Agency’s Safe Drinking Water Hotline (1-800-426-4791) or by visiting epa.gov/ground-water-and-drinking-water.
Some people may be more vulnerable to contaminants in drinking water than the general population. Immunocompromised persons such as persons with cancer undergoing chemotherapy, persons who have undergone organ transplants, people with HIV-AIDS or other immune system disorders, some elderly, and infants can be particularly at risk of infections. These people should seek advice about drinking water from their health care providers. For more information about contaminants and potential health effects, or to receive a copy of the U.S. Environmental Protection Agency (EPA) and the U.S. Centers for Disease Control (CDC) guidelines on appropriate means to lessen the risk of infection by Cryptosporidium and microbiological contaminants call the EPA Safe Drinking Water Hotline at (1-800-426-4791).
The sources of drinking water (both tap water and bottled water) include rivers, lakes, streams, ponds, reservoirs, springs, and wells. As water travels over the surface of the land or through the ground, it dissolves naturally occurring minerals and, in some cases, radioactive material, and can pick up substances resulting from the presence of animals or from human activity. Contaminants that may be present in source water include:
● Microbial contaminants: viruses and bacteria that may come from sewage treatment plants, septic systems, agricultural livestock operations, and wildlife.
● Inorganic contaminants: salts and metals, which can be naturally-occurring or result from urban stormwater runoff, industrial or domestic wastewater discharges, oil and gas production, mining, or farming.
● Pesticides and herbicides: may come from a variety of sources, such as agriculture, urban stormwater runoff, and residential uses.
● Radioactive contaminants: can be naturally occurring or be the result of oil and gas production and mining activities.
● Organic chemical contaminants: including synthetic and volatile organic chemicals, which are byproducts of industrial processes and petroleum production, and also may come from gas stations, urban stormwater runoff and septic systems.
In order to ensure tap water is safe to drink, the Colorado Department of Public Health and Environment prescribes regulations limiting the amount of certain contaminants in water provided by public water systems. The Food and Drug Administration regulations establish limits for contaminants in bottled water that must provide the same protection for public health.
Lead in Drinking Water
Lead can cause serious health problems, especially for pregnant women and young children. Lead in drinking water is primarily from materials and components associated with service lines and home plumbing. We are responsible for providing high quality drinking water and removing lead pipes, but cannot control the variety of materials used in plumbing components in your home. You share the responsibility for protecting yourself and your family from the lead in your home plumbing. You can take responsibility by identifying and removing lead materials within your home plumbing and taking steps to reduce your family’s risk. Before drinking tap water, flush your pipes for several minutes by running your tap, taking a shower, doing laundry or a load of dishes. You can also use a filter certified by an American National Standards Institute accredited certifier to reduce lead in drinking water. If you are concerned about lead in your water and wish to have your water tested, contact Nicole Poncelet-Johnson at 303-628-5977; 303-628-6039. Information on lead in drinking water, testing methods, and steps you can take to minimize exposure is available at epa.gov/safewater/lead
Denver Water Board 2023 Drinking Water Quality Report PWSID: CO 0116001
13
Source Water Assessment and Protection (SWAP)
The Colorado Department of Public Health and Environment may have provided us with a Source Water Assessment Report for the Denver Water water supply. For general information or to obtain a copy of the report please visit wqcdcompliance.com/ccr. The report is located under “Guidance: Source Water Assessment Reports.” Search the table using 116001, DENVER WATER BOARD, or by contacting Nicole Poncelet-Johnson at 303-628-5977; 303-628-6039. The Source Water Assessment Report provides a screening-level evaluation of potential contamination that could occur. It does not mean that the contamination has or will occur. We can use this information to evaluate the need to improve our current water treatment capabilities and prepare for future contamination threats. This can help us ensure quality finished water is delivered to your homes. In addition, the source water assessment results provide a starting point for developing a source water protection plan. Potential sources of contamination in our source water area are listed to the right.
Please contact us to learn more about what you can do to help protect your drinking water sources, any questions about the Drinking Water Quality Report, to learn more about our system, or to attend scheduled public meetings. We want you, our valued customers, to be informed about the services we provide and the quality water we deliver to you every day.
Potential Source(s) of Contamination:
Sources (water type - source type)
MARSTON FOREBAY (Surface Water-Intake)
STRONTIA SPRINGS RES INTAKE (Surface Water-Intake)
RALSTON RESERVOIR INTAKE (Surface Water-Intake)
S PLATTE DIVERSION CONDUIT 20 (Surface Water-Intake)
EPA Abandoned Contaminated Sites, EPA Hazardous Waste Generators, EPA Chemical Inventory/Storage Sites, EPA Toxic Release Inventory Sites, Permitted Wastewater Discharge Sites, Aboveground, Underground and Leaking Storage Tank Sites, Solid Waste Sites, Existing/Abandoned Mine Sites, Other Facilities, Commercial/Industrial/Transportation, High Intensity
Residential, Low Intensity Residential, Urban Recreational Grasses, Quarries / Strip Mines / Gravel Pits, Row Crops, Fallow, Pasture / Hay, Deciduous Forest, Evergreen Forest, Mixed Forest, Septic Systems, Oil / Gas Wells, Road Miles
Detected Contaminants
DENVER WATER BOARD routinely monitors for contaminants in your drinking water according to Federal and State laws. The following table(s) show all detections found in the period of January 1 to December 31, 2022 unless otherwise noted. The State of Colorado requires us to monitor for certain contaminants less than once per year because the concentrations of these contaminants are not expected to vary significantly from year to year, or the system is not considered vulnerable to this type of contamination. Therefore, some of our data, though representative, may be more than one year old. Violations and Formal Enforcement Actions, if any, are reported in the next section of this report.
Note: Only detected contaminants sampled within the last five years appear in this report. If no tables appear in this section then no contaminants were detected in the last round of monitoring.
Total Organic Carbon (Disinfection Byproducts Precursor) Removal Ratio of Raw and Finished Water*
Total Organic Carbon Ratio 2022 Twice per **Denver Water uses enhanced treatment to remove the No Naturally present in the environment month required amount of natural organic material and/or demonstrates compliance with alternative criteria
*Total organic carbon (TOC) has no health effects. However, total organic carbon provides a medium for the formation of disinfection byproducts including trihalomethanes (TTHMs) and haloacetic acids (HAAs). Drinking water containing these byproducts in excess of the MCL may lead to adverse health effects, liver or kidney problems, or nervous system effects, and may lead to an increased risk of getting cancer.
Chemical TT
Parameters Year Frequency TT Requirement Violation Sources
Typical
Denver Water Board 2023 Drinking Water Quality Report PWSID: CO 0116001 14 Combined Radium 2021-2022 6-9 yrs 0.88 BRL-2.1 pC/L 5 0 No Erosion of natural deposits, Mine drainage, industrial (Ra-226 and Ra-228) or manufacturing discharges Chemical Sampling Unit of MCL Typical Parameters Year Frequency Average Range Measure MCL MCLG Violation Sources Radiologicals Samples at the Entry Point to the Distribution System Gross Alpha 2021-2022 6-9 yrs 0.6 BRL-1 pC/L 15 0 No Erosion of natural deposits, Mine drainage, industrial (exclusing Uranium) or manufacturing discharges
Secondary Contaminants**
*Secondary standards are non-enforceable guidelines for contaminants that may cause cosmetic effects (such as skin or tooth discoloration) or aesthetic effects (such as taste, odor or color) in drinking water.
15 Sodium (ppb) 2022 Monthly 19900 7900-29200 N/A N/A No Naturally occurring Contaminant Sampling Range MCL Name Year Frequency Average Low-High MCL MCLG Violation Typical Sources
Total Coliform (T. coli) 2022 Daily No more than 0 Present/ 0.78% 5 out of 4,660 No Naturally present in 5% positive/month Absent (present T.coli), total samples (.11%) the environment July 2022 0 E.coli positive samples Contaminant Sampling Unit of Highest Number of MCL Name Year Frequency MCL MCLG Measure Monthly % Positives Violation Typical Sources Microbial Contaminants Regulated in the Distribution System Contaminant Year/ Level TT Typical Name Frequency Found TT Requirement Violation Sources Turbidity (NTU) 2022 Highest single measurement: 0.276 Maximum 1 NTU for any No Soil runoff Daily NTU (Aug, Moffat Treatment Plant) single measurement. Turbidity (NTU) 2022 Lowest monthly percentage of In any month, at least 95% of samples No Soil runoff Daily samples meeting TT requirement must be less than 0.3 NTU for our technology: 100% Summary of Turbidity Sampled at the Entry Point to the Distribution System Contaminant Time 90th Sample 90th Sample Sites 90th Percentile Name Period Percentile Size Percentile AL Above AL AL Exceedance Typical Sources Copper (ppb) 1/1/2022-6/30/2022 60 395 1300 0 No Corrosion of household plumbing systems; erosion of natural deposits Lead and Copper Sampled in the Distribution System Lead (ppb) 1/2/2022-6/30/2022 3.9 395 15 7 No Corrosion of household plumbing systems; erosion of natural deposits Copper (ppb) 7/1/2022-12/31/2022 50 234 1300 0 No Corrosion of household plumbing systems; erosion of natural deposits Lead (ppb) 7/1/2022-12/31/2022 3.8 329 15 1 No Corrosion of household plumbing systems; erosion of natural deposits Sampling Highest Name Year Frequency Locational RAA Range MCL MCLG Violation Typical Sources Haloacetic 2022 Quarterly 18.65 8.1-30.4 60 N/A No Byproduct of drinking water Acids (HAA5) (ppb) disinfection Total Trihalomethanes 2022 Quarterly 30.55 14.9-46.9 80 N/A No Byproduct of drinking water (TTHM) (ppb) disinfection Disinfection Byproducts Sampled in the Distribution System
CO 0116001 Disinfectant as Total C12 2022 Lowest period percentage of 0 Daily No 4.0 ppm Naturally occurring samples above 0.2 ppm: 100% Contaminant Number of Samples TT Name Year Results Below Level Frequency Violation MRDL Typical Sources *Treatment technique requirement: at least 95% of samples per period (month or quarter) mus be at least 0.2 ppm.
Denver Water Board 2023 Drinking Water Quality Report PWSID:
Disinfectants Sampled in the Distribution System*
Denver Water Board 2023 Drinking Water Quality Report PWSID: CO 0116001

The Water Environment Federation and U.S. Environmental Protection Agency recognized Centennial Water with an NSmart award in 2022.
Centennial Water received the award for its nitrogen and phosphorous nutrient removal program at the Marcy Gulch Wastewater Treatment Plant.
Inorganic Contaminants Sampled at the Entry Point
to the Distribution System
16 Chemical Parameters Year Sampling Frequency Average Range MCL MCLG MCL Violation Typical Sources Antimony (ppb) 2022 Monthly BRL BRL 6 6 No Discharge from petroleum refineries, fire retardants, ceramics, electronics, solar Arsenic (ppb) 2022 Monthly BRL BRL 10 0 No Erosion of natural deposits, runoff from orchards, runoff from glass and electronics, solder Barium (ppb) 2022 Monthly 33.9 16.9-46.3 2000 2000 No Erosion of natural deposits, discharge of drilling wastes Berylium (ppb) 2022 Monthly BRL BRL 4 4 No Discharge from metal refineries and coal-burning factories; discharge from electrical, aerospace and defense industries Cadmium (ppb) 2022 Monthly 0.003 BRL-0.1 5 5 No Corosion of galvanized pipes, erosion of natural deposits, discharge from metal refineries, runoff from waste batteries and paints Chromium (ppb) 2022 Monthly 0.19 BRL-1.4 100 100 No Discharge from steel and pulp mills, erosion of natural deposits Mercury (ppb) 2022 Monthly BRL BRL 2 2 No Erosion of natural deposits, discharge from refineries and factories; runoff from landfills and croplands Selenium (ppb) 2022 Monthly BRL BRL 50 50 No Discharge from petroleum and metal refineries; erosion of natural deposits; discharge from mines Thalium (ppb) 2022 Monthly BRL BRL 2 0.5 No Erosion of natural deposits; discharge from refineries and factories; runoff from landfills and croplands Uranium (ppb) 2022 Monthly 0.006 BRL-0.2 30 0 No Erosion of natural deposits, mine drainage Fluoride (ppb) 2022 Monthly 630 550-780 4000(2000 IS SMCL) 4000 No Erosion of natural deposits, water additive that promotes strong teeth, discharge from fertilizer and aluminum factories Nitrate as N (ppb) 2022 Monthly 46 BRL-160 10,000 10,000 No Runoff from fertilizer use; leaching from septic tanks, sewage; erosion of natural deposits Nitrate as N (ppb) 2022 Monthly BRL BRL 1000 1000 No Runoff from fertilizer use; leaching from septic tanks, sewage; erosion of natural deposits Nickel (ppb) 2022 Monthly 0.18 BRL-1.4 N/A N/A No Discharge from industrial uses such as transportation, chemical industry, electrical equipment and construction 2, 4-D 2022 Annualy BRL BRL ppb 70 70 No Runoff from herbicide used on row crops (Foothills WTP) Chemical Sampling Parameters Year Frequency Average Range Unit of Measure MCL MCLG MCL Violation Typical Sources Organic Contaminants Sampled at Entry Points to the Distribution System
Significant Deficiencies
Public water suppliers are required to notify customers of unresolved deficiencies in design, operation, maintenance, administration, or a failure or malfunction in a system component, including sources, treatment, storage or distribution system that have the potential to cause risks to the reliable delivery of safe drinking water.
What happened?
During a sanitary survey in September 2022, inspectors found deficiencies related to cross-connection, storage tanks, operations and storage conditions. There is no evidence that the water you drink was affected by these deficiencies.
1. Cross-connection: Denver Water is working with the state health department to install more crossconnetion devices at Foothills, Moffat and Marston treatment plants.
2. Storage tanks: State inspectors noted deficiencies in the backwash tanks at Foothills, Moffat and Marston treatment plants. Denver Water is repairing the hatch and vent at all three sites, outlined in the corrective action plan, as well as repairing the vent and overflow at Marston. The repairs will be completed by December 2023.
3. Operations: The turbidity sampling lines at Foothills Treatment Plant were sampling incorrectly. Denver Water is replumbing the individual filter effluent turbidity lines in order to fix the sampling method. This will be fixed by September 2023.
4. Storage conditions: State inspectors found that the hatches on Capitol Hill Tank 3, Capitol Hill Reservoir, Lonetree Reservoir and 56th Avenue Tank were installed incorrectly. Denver Water is repairing the hatches according to the corrective action plan. Repairs will be fixed by December, with the exception of the 56th Avenue tank, which will be completed by April 2024.
How did this impact drinking water quality?
There is no evidence that the water you drink was affected by these deficiencies.
What has been done to correct this situation?
In all instances, Denver Water worked quickly with the state health department to develop a corrective action plan and make necessary repairs.
Water Quality Violations
CROSS-CONNECTION
In 2022, Denver Water received two violations under state drinking water regulations. One violation was for six failed backflow test assemblies that were not quickly addressed by the customers. The other violation was for six crossconnections that required backflow protection. There is no evidence that the water you drink was affected.
What should I do?
Although this situation was not an emergency, as our customers, you have a right to know what happened and what we did to correct this situation. There is nothing you need to do. We do not have any evidence that your drinking water was impacted. All of the devices have been repaired and tested. All of the connections are now controlled. If you have specific health concerns, please contact your health care provider
17 Denver Water Board 2023 Drinking Water Quality Report PWSID: CO 0116001
What happened?
On April 26, 2022, and May 5, 2022, Denver Water notified the state health department that in 2020 and 2021, six backflow assemblies with failed tests and six connections without proper protection were not repaired or protected within the required timeframes. Maintaining and protecting these 12 connections is the responsibility of the property owners, and they failed to provide proper documentation that these connections were protected. Under the state health department’s regulations, Denver Water is required to ensure compliance with these devices.
Backflow prevention assemblies prevent contaminants from a property’s irrigation or fire suppression lines and certain domestic lines from entering the public drinking water supply. There are more than 44,000 backflow prevention assemblies connected to Denver Water’s distribution system. State regulations require property owners who have these connections to have their backflow prevention assemblies inspected and certified annually. Uncontrolled cross-connections can lead to a back pressure or siphonage event that may allow contaminants or disease-causing organisms to enter the drinking water, which can cause diarrhea, nausea, cramps and associated headaches.
For most properties, if the backflow prevention assembly is not meeting requirements, Denver Water will shut off
water service to the property until the backflow prevention device is in compliance. However, the 12 connections that resulted in the violations are owned by “critical customers,” a category that includes schools, public housing facilities, hospitals and local government facilities.
Denver Water makes every effort to avoid shutting off water to these important public service locations. The water quality violations resulted when the 12 connections were not protected within the required timelines and these property owners did not correct the issues.
How did this impact drinking water quality?
Denver Water constantly monitors water quality throughout the Denver metro area, and our records indicate that your drinking water was not impacted as a result of the 12 noncompliant connections.

18
Denver Water Board 2023 Drinking Water Quality Report PWSID: CO 0116001
What has been done to correct this situation?
Denver Water has notified the property owners that their failure to certify these backflow prevention assemblies and control the identified cross-connections triggered violations of Colorado’s drinking water regulations. All of the devices are now working properly, and the crossconnections have been controlled. Denver Water has reviewed its process with all critical customers to ensure this violation does not occur again. In addition to the multiple notifications already provided to these customers, Denver Water increased the frequency with which it reviews customer compliance data, offers cross-connection control services to noncompliant customers and suspends service for those customers that fail to comply prior to the 120-day regulatory deadline.
For more information about Denver Water’s backflow prevention program or these violations, visit denverwater. org/Backflow.
TURBIDITY
On Sept. 4, 2022, a filter monitoring instrument at the Moffat Water Treatment Plant reported the same turbidity (cloudiness) value for 17 hours rather than actual turbidity values. The constant value stemmed from a mechanical failure of the instrument. This constituted a monitoring violation for individual filter effluent turbidity. As a result, Denver Water instituted changes to improve monitoring, programming and training to prevent a repeat of this failure in the future. At no time did turbidity in the finished drinking water exceed regulatory standards. Denver Water identified and reported this violation to the state health department.

19 Denver Water Board 2023 Drinking Water Quality Report PWSID: CO 0116001
McLellan Reservoir
We are pleased to present to you this year’s water quality report for the City of Aurora service area. Our constant goal is to provide you with a safe and dependable supply of drinking water. Please contact Ortilano Bobby Oligo at 303-739-6740 with any questions or for public participation opportunities that may affect the City of Aurora’s water quality. Please see the water quality data from wholesale system(s) (either attached or included in this report) for additional information about your drinking water.
All drinking water, including bottled water, may reasonably be expected to contain at least small amounts of some contaminants. The presence of contaminants does not necessarily indicate that the water poses a health risk. More information about contaminants and potential health effects can be obtained by calling the Environmental Protection Agency’s Safe Drinking Water Hotline (1-800-426-4791) or by visiting epa.gov/ground-water-and-drinking-water
Some people may be more vulnerable to contaminants in drinking water than the general population. Immunocompromised persons such as persons with cancer undergoing chemotherapy, persons who have undergone organ transplants, people with HIV-AIDS or other immune system disorders, some elderly, and infants can be particularly at risk of infections. These people should seek advice about drinking water from their health care providers. For more information about contaminants and potential health effects, or to receive a copy of the U.S. Environmental Protection Agency (EPA) and the U.S. Centers for Disease Control (CDC) guidelines on appropriate means to lessen the risk of infection by Cryptosporidium and microbiological contaminants call the EPA Safe Drinking Water Hotline at (1-800-426-4791).
The sources of drinking water (both tap water and bottled water) include rivers, lakes, streams, ponds, reservoirs, springs, and wells. As water travels over the surface of the land or through the ground, it dissolves naturally occurring minerals and, in some cases, radioactive material, and can pick up substances resulting from the presence of animals or from human activity. Contaminants that may be present in source water include:
● Microbial contaminants: viruses and bacteria that may come from sewage treatment plants, septic systems, agricultural livestock operations, and wildlife.
● Inorganic contaminants: salts and metals, which can be naturally-occurring or result from urban stormwater runoff, industrial or domestic wastewater discharges, oil and gas production, mining, or farming.
● Pesticides and herbicides: may come from a variety of sources, such as agriculture, urban stormwater runoff, and residential uses.
● Radioactive contaminants: can be naturally occurring or be the result of oil and gas production and mining activities.
● Organic chemical contaminants: including synthetic and volatile organic chemicals, which are byproducts of industrial processes and petroleum production, and also may come from gas stations, urban stormwater runoff, and septic systems.
In order to ensure that tap water is safe to drink, the Colorado Department of Public Health and Environment prescribes regulations limiting the amount of certain contaminants in water provided by public water systems. The Food and Drug Administration regulations establish limits for contaminants in bottled water that must provide the same protection for public health.
Lead in Drinking Water
Lead can cause serious health problems, especially for pregnant women and young children. Lead in drinking water is primarily from materials and components associated with service lines and home plumbing. We are responsible for providing high quality drinking water and removing lead pipes, but cannot control the variety of materials used in plumbing components in your home. You share the responsibility for protecting yourself and your family from the lead in your home plumbing. You can take responsibility by identifying and removing lead materials within your home plumbing and taking steps to reduce your family’s risk. Before drinking tap water, flush your pipes for several minutes by running your tap, taking a shower, doing laundry or a load of dishes. You can also use a filter certified by an American National Standards Institute accredited certifier to reduce lead in drinking water. If you are concerned about lead in your water and wish to have your water tested, contact Ortilano Bobby Oligo at 303-739-6740. Information on lead in drinking water, testing methods, and steps you can take to minimize exposure is available at epa.gov/safewater/lead.
City of Aurora 2023 Drinking Water Quality Report PWSID: CO 0103005
20
General Information
Source Water Assessment and Protection (SWAP)
The Colorado Department of Public Health and Environment may have provided us with a Source Water Assessment Report for the ECCV water supply. For general information or to obtain a copy of the report please visit wqcdcompliance.com/ccr. The report is located under “Guidance: Source Water Assessment Reports.” Search the table using 103005, AURORA CITY OF, or by contacting Ortilano Bobby Oligo at 303-739-6740. The Source Water Assessment Report provides a screening-level evaluation of potential contamination that could occur. It does not mean that the contamination has or will occur. We can use this information to evaluate the need to improve our current water treatment capabilities and prepare for future contamination threats. This can help us ensure quality finished water is delivered to your homes. In addition, the source water assessment results provide a starting point for developing a source water protection plan. Potential sources of contamination in our source water area are listed below. Please contact us to learn more about what you can do to help protect your drinking water sources, any questions about the Drinking Water Quality Report, to learn more about our system, or to attend scheduled public meetings. We want you, our valued customers, to be informed about the services we provide and the quality water we deliver to you every day.
Sources (water type - source type)
NC VW10A (Groundwater UDI Surface Water-Well)
NC VW10 (Groundwater UDI Surface Water-Well)
NC VW11 (Groundwater UDI Surface Water-Well)
NC VW12 (Groundwater UDI Surface Water-Well)
NC VW13 (Groundwater UDI Surface Water-Well)
NC VW14 (Groundwater UDI Surface Water-Well)
NC VW15 (Groundwater UDI Surface Water-Well)
NC VW 16 (Groundwater UDI Surface Water-Well)
NC VW18 (Groundwater UDI Surface Water-Well)
NC VW19 (Groundwater UDI Surface Water-Well)
NC VW20 (Groundwater UDI Surface Water-Well)
NC VW21 (Groundwater UDI Surface Water-Well)
NC VW22 (Groundwater UDI Surface Water-Well)
NC VW23 (Groundwater UDI Surface Water-Well)
NC VW24 (Groundwater UDI Surface Water-Well)
NC VW25 (Groundwater UDI Surface Water-Well)
NC VW 26 (Groundwater UDI Surface Water-Well)
CC 1R (Groundwater UDI Surface Water-Well)
CC 2R (Groundwater UDI Surface Water-Well)
Potential Source(s) of Contamination:
CC 4R (Groundwater UDI Surface Water-Well)
CC 5R (Groundwater UDI Surface Water-Well)
CC SA6R (Groundwater UDI Surface Water-Well)
LFH1 (Groundwater-Well)
NC VW 19A (Groundwater UDI Surface Water-Well)
NC VW 10B (Groundwater UDI Surface Water-Well)
NC VW 11A (Groundwater UDI Surface Water-Well)
NC VW 12A (Groundwater UDI Surface Water-Well)
CC 3R (Groundwater UDI Surface Water-Well)
NC VW 18A (Groundwater UDI Surface Water-Well)
RAMPART SOUTH PLATTE RESERVIOR (Surface WaterIntake)
QUINCY RESERVIOR (Surface Water-Intake)
AURORA RESERVIOR (Surface Water-Intake)
DA1 WELL (Groundwater-Well)
DA2 WELL (Groundwater-Well)
DA3 WELL (Groundwater-Well)
NC VW 16A (Groundwater UDI Surface Water-Well)
EPA Abandoned Contaminated Sites, EPA Hazardous Waste Generators, EPA Chemical Inventory/Storage Sites, EPA Toxic Release Inventory Sites, Permitted Wastewater Discharge Sites, Aboveground, Underground and Leaking Storage Tank Sites, Solid Waste Sites, Existing/Abandoned Mine Sites, Other Facilities, Commercial/Industrial/Transportation, High Intensity Residential, Low Intensity Residential, Urban Recreational Grasses, Quarries / Strip Mines / Gravel Pits, Row Crops, Fallow, Small Grains, Pasture / Hay, Deciduous Forest, Evergreen Forest, Mixed Forest, Septic Systems, Oil / Gas Wells, Road Miles
Detected Contaminants
AURORA CITY OF routinely monitors for contaminants in your drinking water according to Federal and State laws. The following table(s) show all detections found in the period of January 1 to December 31, 2022 unless otherwise noted. The State of Colorado requires us to monitor for certain contaminants less than once per year because the concentrations of these contaminants are not expected to vary significantly from year to year, or the system is not considered vulnerable to this type of contamination. Therefore, some of our data, though representative, may be more than one year old. Violations and Formal Enforcement Actions, if any, are reported in the next section of this report. Note: Only detected contaminants sampled within the last five years appear in this report. If no tables appear in this section then no contaminants were detected in the last round of monitoring.
21
City of Aurora 2023 Drinking Water Quality Report PWSID: CO 0103005
**If minimum ratio not met and no violation identified then the system achieved compliance using alternative criteria.
Unregulated Contaminants***
EPA has implemented the Unregulated Contaminant Monitoring Rule (UCMR) to collect data for contaminants suspected to be present in drinking water and do not have health-based standards set under the Safe Drinking Water Act. EPA uses results of UCMR monitoring to learn about the occurrence of unregulated contaminants in drinking water and to decide whether or not these comtaminants will be regulated in the future. We performed monitoring and reported analytical results to EPA in accordance with its UCMR. Once EPA reviews results, results are made available in the EPA’s National Contaminant Occurrence Database (NCOD) (epa.gov/dwucmr/national-contaminant-occurrence-database-ncod). Consumers can review results by accessing the NCOD. Contaminants detected during UCMR sampling and corresponding analytical results are provided below.
None reported.
***More information about the contaminants that were included in UCMR monitoring can be found at: drinktap.org/Water-Info/Whats-in-My-Water/UnregulatedContaminant-Monitoring-Rule-UCMR. Learn more about the EPA UCMR at: epa.gov/dwucmr/learn-about-unregulated-contaminant/monitoring-rule or contact the Safe Drinking Water Hotline at (800) 426-4791 or epa.gov/ground-water-and-drinking-water.
City of Aurora 2022 Drinking Water Quality Report PWSID: CO 0103005 Total Organic Carbon Ratio 2022 2.11 1.22-4.61 31 1.00 No Naturally present in the environment Contaminant Range Sample TT Minimum Typical Name Year Average Low-High Size Ratio TT Violation Sources
Total Organic Carbon (Disinfection Byproducts Precursor) Removal Ratio of Raw and Finished Water Contaminant Sample Level TT Typical Name Date Found TT Requirement Violation Sources Turbidity (NTU) Aug Highest single measurement: Maximum 1 NTU for any No Soil runoff 0.097 NTU single measurement. Turbidity (%) Dec Lowest monthly percentage of In any month, at least 95% of samples No Soil runoff samples meeting TT requirement must be less than 0.3 NTU for our technology: 100% Summary of Turbidity Sampled at the Entry Point to the Distribution System Disinfectant Time Number of Samples Sample TT Name Period Results Below Level SizeSource Violation MRDL Chloramine December Lowest period % of 0 213 No 4.0 ppm 2022 samples meeting TT requirement: 100% Disinfectants
TT Requirement:
ppm
less than 40 no more than 1 sample is below 0.2 ppm. Typical
Contaminant Time 90th Sample 90th Sample Sites 90th Percentile Name Period Percentile Size Percentile AL Above AL AL Exceedance Typical Sources Copper (ppm) 6/9/2021-9/21/2021 0.06 217 1.3 0 No Corrosion of household plumbing systems; erosion of natural deposits Lead and Copper Sampled in the Distribution System Lead (ppb) 6/9/2021-9/21/2021 1.3 217 15 0 No Corrosion of household plumbing systems; erosion of natural deposits Range Sample MCL Name Year Average Low-High Size MCL MCLG Violation Typical Sources Total Haloacetic 2022 15.91 4.11-29. 48 60 N/A No Byproduct of drinking water disinfection Acids (HAA5) (ppb) Total Trihalomethanes 2022 22.61 17-32.3 48 80 N/A No Byproduct of drinking water disinfection (TTHM) (ppb) Chlorite 2022 0.48 0.32-0.62 21 1.0 .8 No Byproduct of drinking water disinfection Disinfection Byproducts Sampled in the Distribution System
Sampled in the Distribution System
Atleast 95% of samples per period (month or quarter) must be at least 0.2
OR if sample size is
Sources: Water additive used to control microbes
City of Aurora 2023 Drinking Water Quality Report PWSID: CO 0103005 22
**Secondary standards are non-enforceable guidelines for contaminants that may cause cosmetic effects (such as skin or tooth discoloration) or aesthetic effects (such as taste, odor or color) in drinking water.
Non-health Based Violations
These violations do not usually mean there was a problem with the water quality. If there had been, we would have notified you immediately. We missed collecting a sample (water quality is unkown), we reported the sample result after the due date, or we did not complete a report/notice by the required date.
Additional Violation Information
Please share this information with all the other people who drink this water, especially those who may not have received this notice directly (for example, people in apartments, nursing homes, schools and businesses). You can do this by posting this notice in a public place or distributing copies by hand or mail.
Describe the steps taken to resolve the violation(s), and the anticipated resolution date:
Our water system violated a drinking water requirement in October of 2022. Although this situation is not a public health risk, as our customers you have a right to know what happened, what you should do, and what we ar edoing to correct the situation. We failed to timely report tampering of hydrants in the system. We notified CDPHE of the tampering, but we did not give the notification by 10 a.m. the next calendar day as required. There is nothing you need to do at this time. It has been determined that the tampering of the hydrants did not endanger public health. If a situation arises where the water is no longer safe to drink you will be notified within 24 hours.
We resolved the problem on Feb. 10, 2023. We have trained our staff to notify CDPHE of any future tampering of the water system by 10 a.m. the next calendar day. For more information, please contact Sherry Scaggiari at 303.739-7390, WaterRegulatory@auroragov.org or 15151 E.Alameda Parkway, Aurora, CO 80012.
Please share this information with all the other people who drink this water, especially those who may not have received this notice directly (for example, people in apartments, nursing homes, schools and businesses). You can do this by posting this notice in a public place or distributing copies by hand or mail.
Contaminant Range Sample MCL Name Year Average Low-High Size MCL MCLG Violation Typical Sources Combined Radium (pCi/L) 2022 0.19 0.19-0.19 1 5 0 No Erosion of natural deposits Radionuclides Sampled at the Entry Point to the Distribution System Contaminant Range Sample MCL Name Year Average Low-High Size MCL MCLG Violation Typical Sources Barium (ppm) 2022 0.04 0.03-0.05 8 2 2 No Discharge of drilling wastes; discharge from metal refineries; erosion of natural deposits Chromium (ppb) 2022 0.07 0-0.58 8 100 100 No Discharge from steel and pulp mills; erosion of natural deposits Fluoride (ppm) 2022 0.68 0.5-0.85 29 4 4 No Erosion of natural deposits; water additive which promotes strong teeth; discharge from fertilizer and aluminum factories Nitrate (ppm) 2022 0.29 0-0.94 29 10 10 No Runoff from fertilizer use; leaching from septic tanks, sewage, erosion of natural deposits Arsenic (ppb) 2022 0.07 0-0.53 8 10 0 No Erosion of natural deposits; runoff from orchards; runoff from glass and electronics production wastes Selenium (ppb) 2022 0.54 0-1.21 8 50 50 No Discharge from petroleum and metal refineries; erosion of natural deposits; discharge from mines Inorganic Contaminants Sampled at the Entry Point to the Distribution System Sodium (ppm) 2022 45.4 20.9-69.2 4 N/A Contaminant Range Sample Secondary Name Year Average Low-High Size Standard
Secondary Contaminants** Violations, Significant Deficiencies and Formal Enforcement Actions Nitrite (ppm) 2022 0.01 0-0.3 29 1 1 No Runoff from fertilizer use; leaching from septic tanks, sewage, erosion of natural deposits Nitrate-Nitrite 2022 0.3 0-1 29 10 10 No Runoff from fertilizer use; leaching from septic tanks, (ppm) sewage, erosion of natural deposits Name Description Time Period
PUBLIC NOTICE FAILURE TO MONITOR AND/OR REPORT 12/1/2022-12/31/2022
23
City of Aurora 2023 Drinking Water Quality Report PWSID: CO 0103005
How can I learn more about my water?

If you have questions about this report or your water services, please contact Centennial Water’s lab at 303-791-2185, ext. 3523. We want you to be informed about your water utility. Attending a board meeting is a great way to learn more about Centennial Water’s water supply. Meetings are held at the Hendrick Office Building, 62 Plaza Dr., Highlands Ranch, CO 80129 or you can attend virtually through the Zoom platform. Visit centennialwater.org for a board meeting schedule and to view agendas and minutes.
Stay Connected Follow Centennial Water on social media. Scan the QR code to get connected.
303-791-0430
info@centennialwater.org |
