Climate Vulnerability Assessment Report: North Tonawanda, NY


A collaberation between the City of North Tonawanda and Students of the University at Buffalo END 450 Studio, Fall 2022

North Tonawanda CVA 2 Table of Contents Executive Summary ................................................................................................................................................... 3 1: Introduction .................................................................................................................................................................. 4 Introduction ............................................................................................................................................................................................................... 4 Demographics......................................................................................................................................................................................................... 6 Age ................................................................................................................................................................................................................................................................ 7 Income...................................................................................................................................................................................................................................................... 8 Race ............................................................................................................................................................................................................................................................ 9 Purpose .......................................................................................................................................................................................................................... 9 Methodology .......................................................................................................................................................................................................... 10 2: Climate Profile ..........................................................................................................................................................12 3: Vulnerable Populations & Assets ............................................................................................................ 16 Introduction ............................................................................................................................................................................................................. 16 Significant Climate Hazards in NT ............................................................................................................................................................................... 16 Define Vulnerability ................................................................................................................................................................................................................... 16 Climate Hazards Analysis ........................................................................................................................................................................... 18 Flooding ................................................................................................................................................................................................................................................ 18 Land/Soil Degradation .......................................................................................................................................................................................................... 20 Invasive Species ........................................................................................................................................................................................................................... 22 Wind ........................................................................................................................................................................................................................................................ 24 Heat Island Effect ........................................................................................................................................................................................................................ 26 Transportation and Related Infrastructure .......................................................................................................................................................... 30 Zoning .................................................................................................................................................................................................................................................... 32 4: Conclusion ................................................................................................................................................................ 34 References ...................................................................................................................................................................... 36
Executive Summary
North Tonawanda (NT) is a city located in Western New York (WNY) within Niagara County. As part of a Climate Smart Community initiative, this Climate Vulnerability Assessment identifies the largest climate hazards affecting North Tonawanda and examines them through a social vulnerability lens in order to identify the most at-risk areas. Climate Smart Communities are registered communities in New York State which work to reduce climate change and related issues that impact residents. An enormous increase in greenhouse gas (GHG) emissions worldwide caused primarily by human activity has driven global temperatures to rise drastically. This has created the global climate crisis we are combating today, with effects such as rising sea levels, droughts, and more frequent extreme weather events. To become climate resilient, action must be taken
in three areas: mitigation, remediation, and protection of socially vulnerable populations. North Tonawanda specifically sees climate issues related to increased precipitation leading to flooding and land degradation, invasive species, intense winds, heat island-related issues, and lifestyle-based emissions related to zoning and transportation. North Tonawanda’s vulnerable populations include low-income and older residents as well as residents without private vehicle access due to the lack of public transportation options. Additionally, initiatives that may help North Tonawanda like the NYS 2100 Commission Report and ClimAID Report are further identified. This report identifies North Tonawanda’s climate vulnerabilities and socially vulnerable populations to prepare the city and its residents to be more climate resilient.
3 Fall 2022
1: Introduction
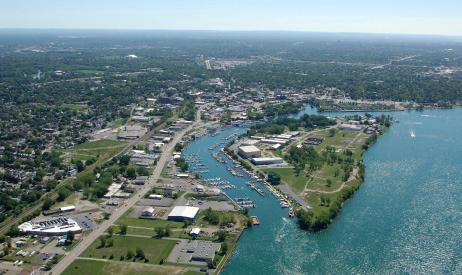
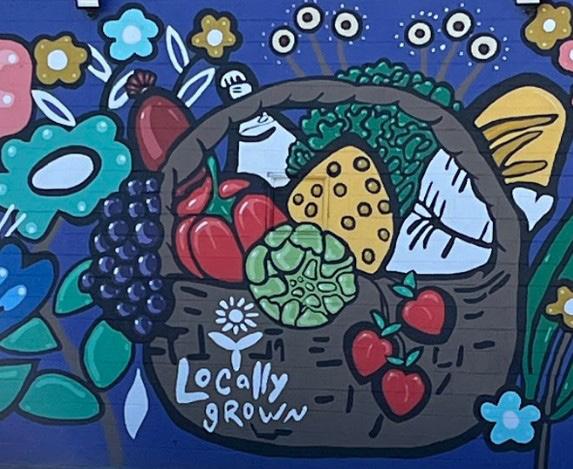
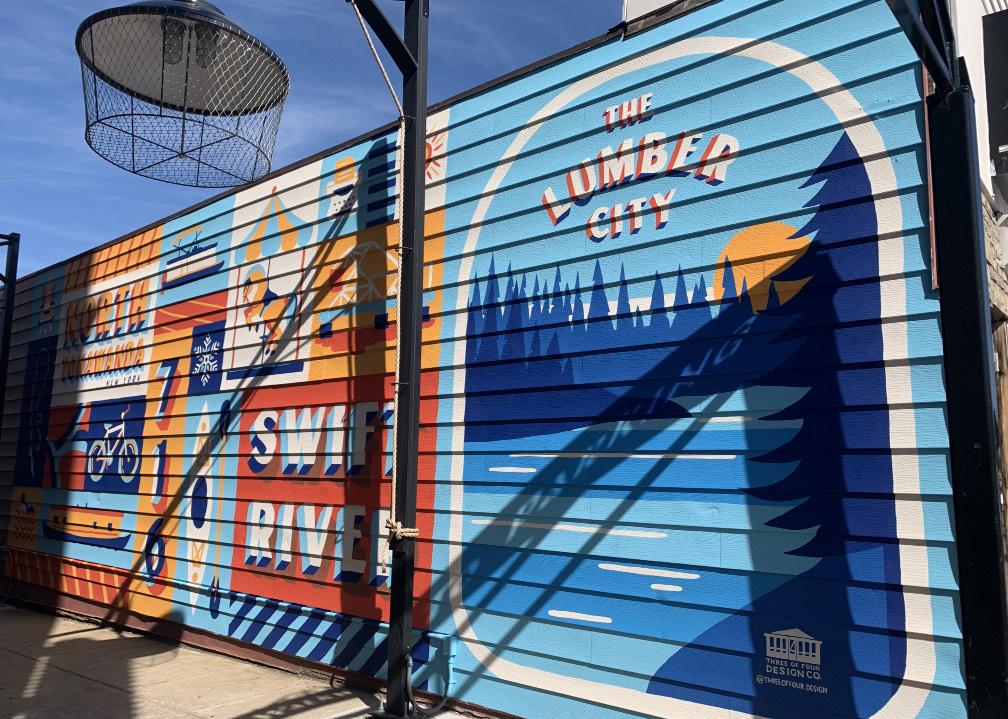
IntroductionThe City of North Tonawanda (NT) is located in Niagara County, New York, and serves as a midway point between the cities of Buffalo and Niagara Falls (Figure 1.1). Situated at the convergence of the Erie Canal and the Niagara River, the city was originally the territory of the Iroquois Indians and was later secured via a treaty with the Seneca Nation. From its founding, the city of North Tonawanda discovered its potential as a main transportation hub in North America, as close proximity to Lake Erie provided access to many waterways. With both a route from the east via the Erie Canal, in combination with the rail system to the midwest, North Tonawanda became a central shipping and logistical location within North America for most of the 19th and early 20th centuries. Coined “The Lumber City”, North Tonawanda was the largest lumber port in the mid-19th century. The city was also known for having “a rich agricultural history, and one of the most vibrant collections of fruit and grape production in the nation”(Bergmann Associates, 2008). North Tonawanda formally split off from Tonawanda in 1897, designating the Erie Canal as its southernmost boundary. Due to the success of the St. Lawrence Seaway System, North Tonawanda’s place within the lumber industry subsided in the mid-20th century paving way for new industries to take over. Since then the city has transformed into a district of living and commerce capitalizing off its lumber jackpot.
Chemical and manufacturing industries took over the already established rail and roadway system starting in the 1940s, reshaping the identity of the city. Due to the increase in industry, the population saw similar growth during that time requiring housing to be built outside of the urban core for the first time. These units were built at a lower density and were much more auto-oriented in design compared to previously developed areas adjacent to the downtown core west of the twin cities highway.
In the 1960s, the population began to suffer from decline, resulting in the loss of industry and manufacturing operations. As a result, the city’s infrastructure and housing stock began to decline as well. The city also saw the contamination of several industrial sites located throughout the downtown and waterfront area.
Residentially, the Erie Canal played a big role in the development of early North Tonawanda. As industry boomed on the waterfront through the 1800s, early settlers took a liking to what is now known as residential North Tonawanda. Being in a location bordering a major part of the canal, this was a prime location for people to work and live. During the industrial revolution at the turn of the century, a major population growth was recorded in the residential areas. Since then, development over time has expanded North Tonowanda’s residential region with housing and recent apartment projects.

4 North Tonawanda CVA
North Tonawanda Location
Niagara Falls
Niagara River North Tonawanda
Grand Island Canada
Sanborn Tonawanda Getzville Buffalo
Figure 1.1
Demographics
In order to decide the best practices to implement Climate Smart Communities (CSC), it is important to understand the demographic makeup of North Tonawanda. Based on in depth research into the socio-economic make up of the city, with the most relevant demographics being shown
in the following sections, these demographics highlight different variables and their respective location within the city, with the goal of displaying vulnerabilities within the current population.
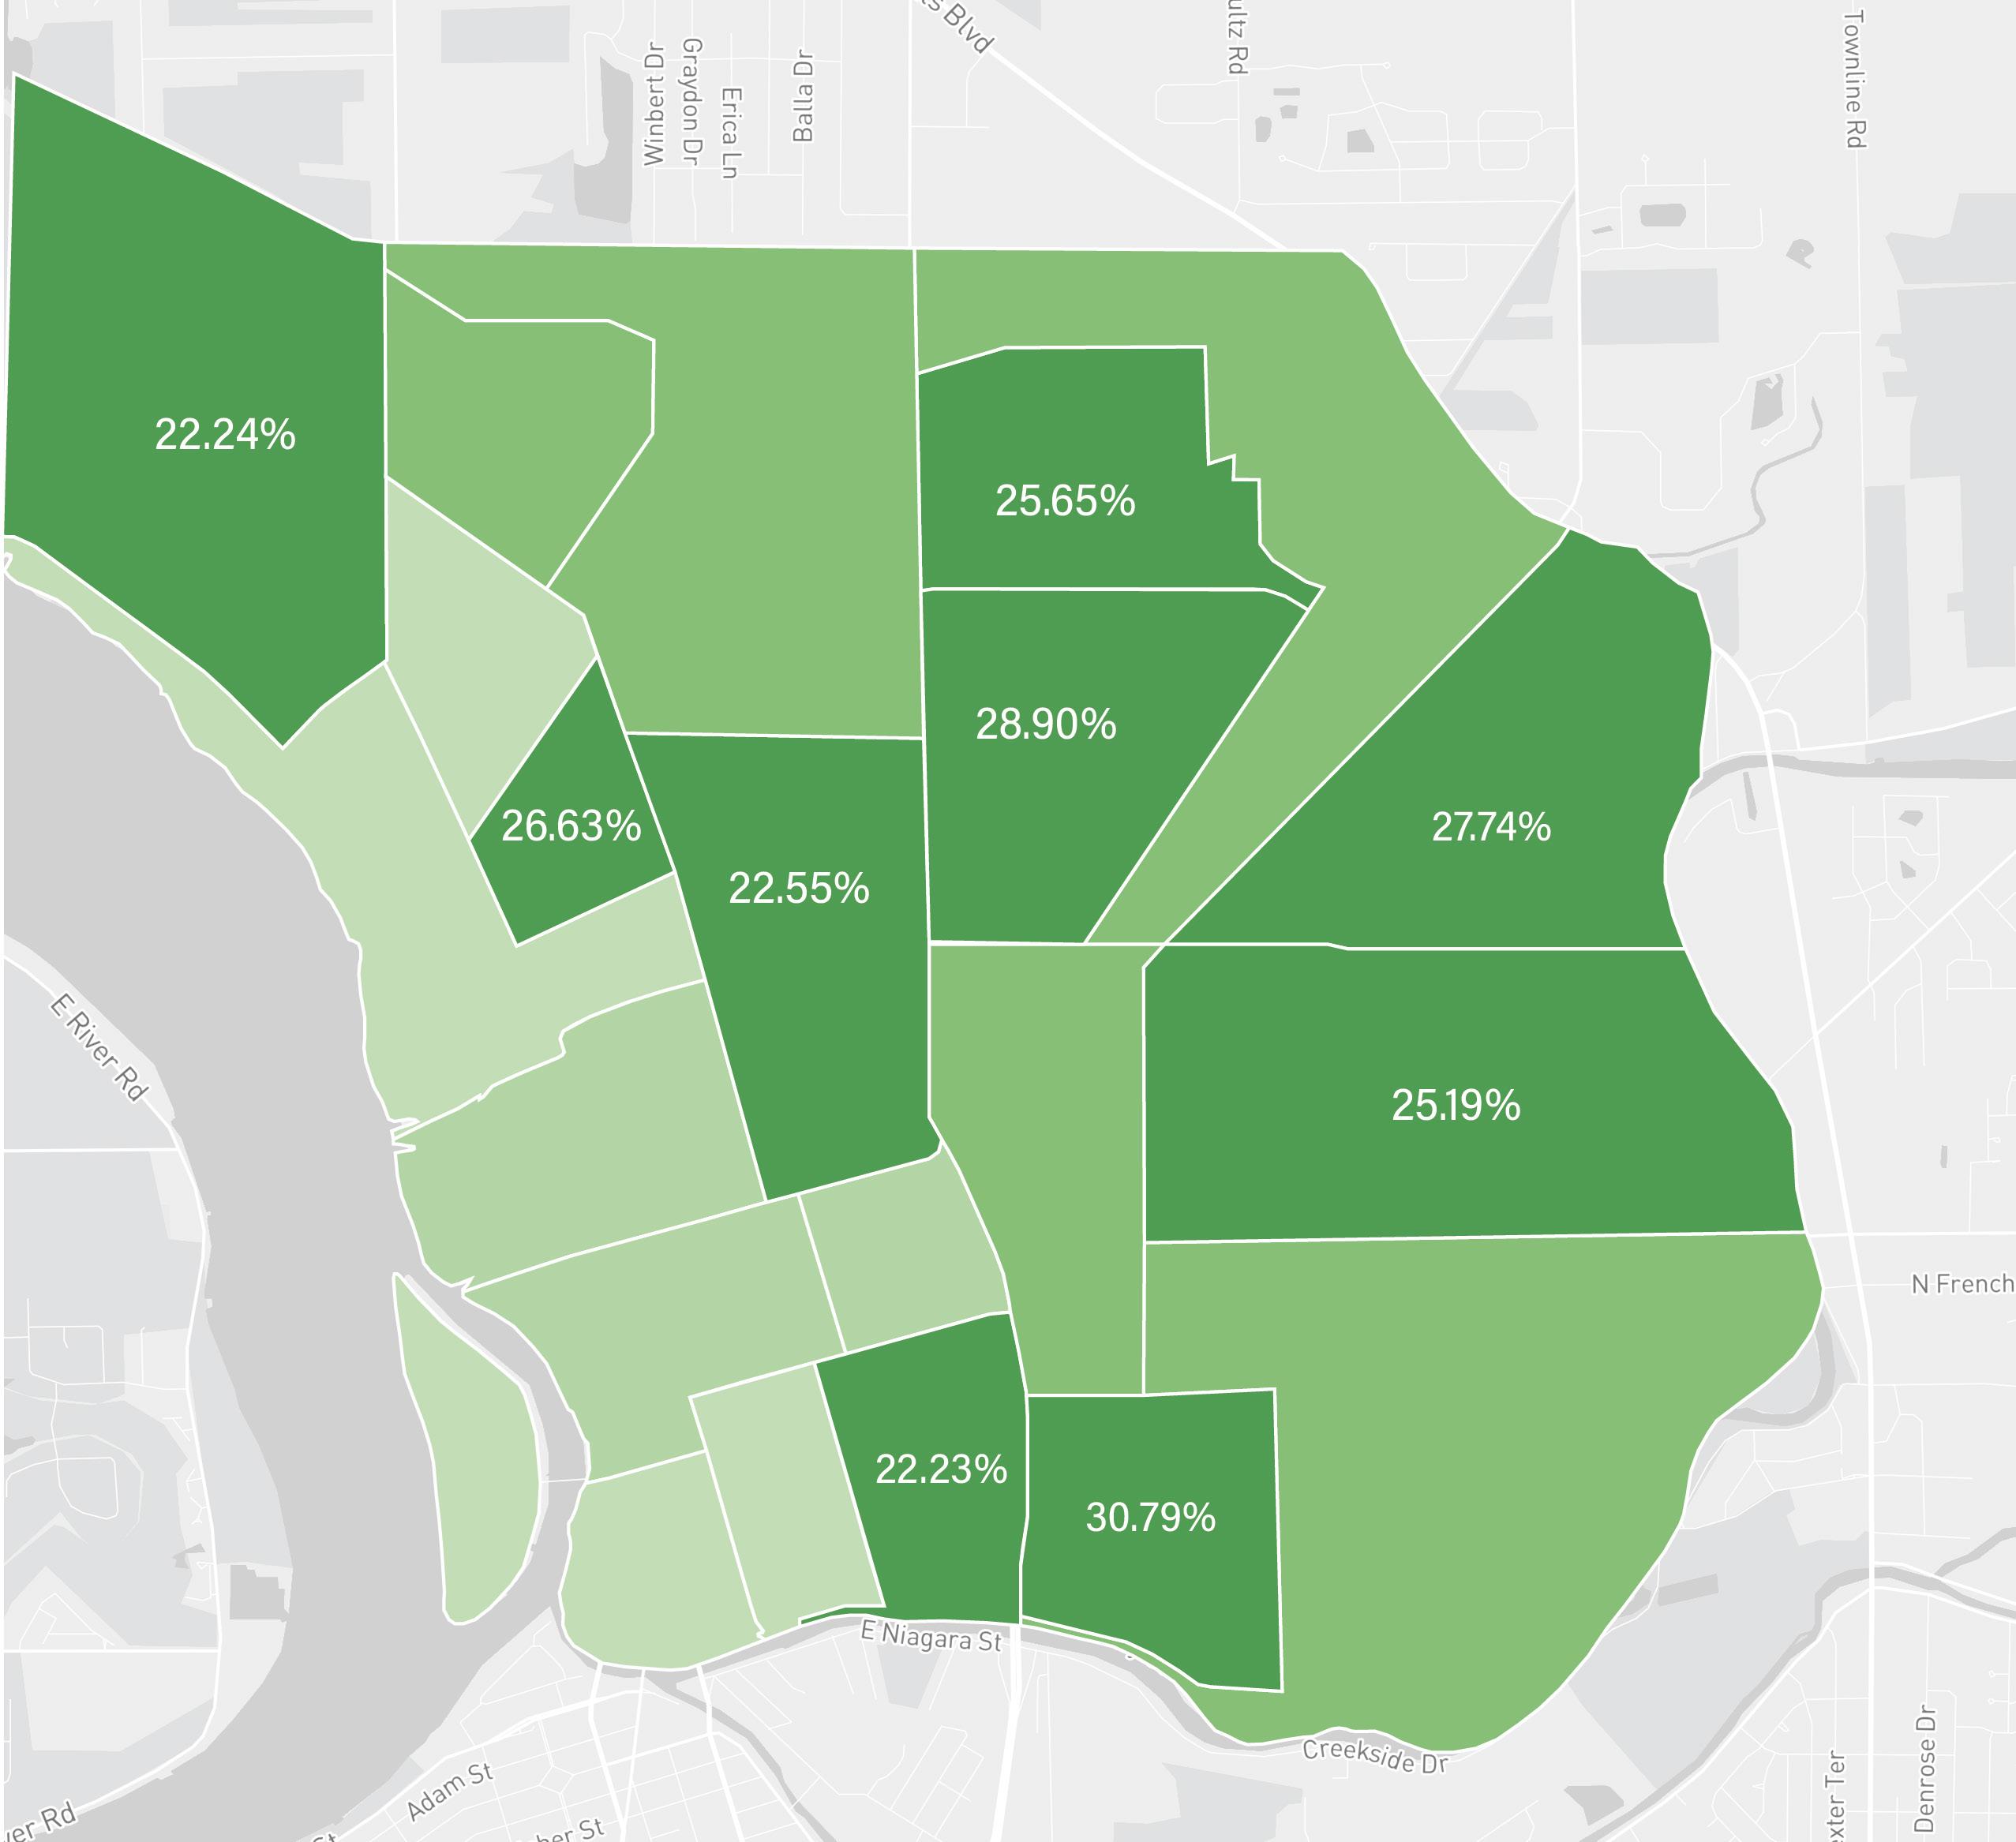
Age 65 and Older
6 North Tonawanda CVA
Figure 1.2
Age

With a total population of 30,496, there is a significant disparity in where older and younger residents reside. In
complexes and duplexes, in which census data shows a higher population of people between the ages of 18 to 34 (figure 1.3). With the recent revitalization in the downtown
Age 18 to 34

Fall 2022
Income
In Figure 1.4, the shade of gold represents the majority income range for that block group. The darkest shade on the map represents the Census block groups that have a majority of households making more than $100,000 a year
Group 2. In the lowest income bracket, making less than $25,000, are four block groups. Two out of these four are located in downtown North Tonawanda: Tract 232 Block Groups 2 and 3. In terms of assessing vulnerability, lower-

Income Ranges in North Tonawanda

North Tonawanda CVA
According to the US Census 2020 ACS 5-year survey, the population of North Tonawanda is predominantly white. White residents make up 95.1% of the city’s total
population. That leaves all other races, including African American, Hispanic, and Asians at either 1% or less of the total population in the city. (Figure 1.5).
Figure 1.5
Purpose
These demographics show where different types of people live and what blocks generate the most income. This data shows a division between the residential and downtown areas of the city, issues that this Climate Vulnerability Assessment aims to fix through Climate Smart Communities. Climate Smart Communities are registered communities which work with their municipalities to bring new, better and efficient systems to reduce climate change and other issues that harm the residents. There are currently 364 registered communities, while registration is free. CSC’s raise greater awareness for themselves as well as beneficial factors such as: reducing greenhouse gas emissions, saving taxpayer dollars, increasing energy security and liability, advancing public health goals, etc. With over 100 actions that a community can choose from, this initiative helps conduct detailed research on direct issues, personalizing the steps and approaches taken. A well-connected driven community is essential to making sure North Tonawanda heads in the best possible direction.
In order to decide the best practices to implement Climate Smart Communities (CSC), it is important to understand the demographic makeup of North Tonawanda. Based on the design solutions, the most relevant demographics have been researched, highlighting different variables
and their respective location in the city. With this rich history in mind, the implementation of a climate-smart community is essential. North Tonawanda has recently focused its economic development in the downtown region with positive community goals in mind. While being beneficial to the city’s tourism and revenue, there are many other areas within North Tonawanda that need that same attention, with climate change being the main priority. North Tonawanda is currently “Bronze Certified” under the current Climate Smart Community program, which means they are already addressing these issues but could do much more. To see further improvement, this report aims to instill values of community, identity, and economy by the implementation of incentive programs, communityled initiatives, redesigning of land use contributing to climate change, and other infrastructural developments.
9 Fall 2022
Race
Methodology
The Climate Vulnerability Assessment will address the core climate issues that affect the residents of North Tonawanda. Climate change in recent years has had a profound impact on waterfront communities such as North Tonawanda, and these changes ultimately impact the community as a whole. Information on temperature, rainfall, and emissions has been collected to decide which climate issues have the biggest impact. Besides demographics, studying the people themselves gives an idea of the general atmosphere of the
North Tonawandas community, what they value, and what initiatives have been successful in the past. Vulnerable fields such as weather, transportation, infrastructure, and land use have also been identified in order to prioritize the most important areas of concern. Data collected on those matters have been used to establish creative solutions to address concerns and benefit the community every way possible. Figure 1.6
10 North Tonawanda CVA
11 Fall 2022
2: Climate Profile
Climate Change in the Global Scale
The Intergovernmental Panel on Climate Change (IPCC) has identified that “Human activities are estimated to have caused approximately 1.0°C of global warming above pre-industrial levels, with a likely range of 0.8°C to 1.2°C. Global warming is likely to reach 1.5°C between 2030 and 2052 if it continues to increase at the current rate” (Headline Statements—Global Warming of 1.5 oC, 2022). The IPCC defines GHGs as “Those gaseous constituents of the atmosphere, both natural and anthropogenic, that absorb and emit radiation at specific wavelengths within the spectrum of thermal infrared radiation emitted by the Earth’s surface, the atmosphere itself, and by clouds” (IPCC DDC Glossary, 2022). This causes a greenhouse effect where these gasses get trapped in the atmosphere. The trapping of these gasses in the atmosphere has caused global temperatures to rise significantly, which has drastic repercussions.
Rising global temperatures affect all aspects of life, but the primary harmful effects relating to human civilization include droughts, water availability, rising sea levels, increased rainfall, food security, vector-borne diseases, more frequent extreme weather events, and an increase in invasive species (Buis NASA’s, 2020). The connections between a warming atmosphere and circulation patterns can result in the increased intensity seen in severe weather events such as hurricanes, droughts, and wildfires.
Climate Change in the Local Scale:
The goal when combating the climate crisis, whether on a global or local level, is resiliency. In order to create resilience, action needs to be taken on three fronts, mitigation, remediation, and protection (Figure 2.1). Mitigation is the focus on lowering emissions, remediation counters the effects of pre-existing emissions, and protection deals with the specific social and contextual elements of climate change. In terms of increased emissions, Western New York (WNY) and North Tonawanda are not especially unique in what drives these emissions (Figure 2.2).
Figure 2.2
A bedroom community is an area where the majority of residents commute elsewhere for work, shopping, and entertainment. It is mostly zoned residential as residents mostly spend their time “sleeping” there. For bedroom communities like North Tonawanda, being conscious of lifestyle-based emissions and community design can help lower impacts (What We Can Do, 2020) and simultaneously create a more inviting community (Galvin & Maassen, 2020). Municipalities can lead by example in being conscious of their energy usage and finding more climate-friendly options when possible. Alterations to zoning codes can yield positive results as well. In terms of remediation, solutions are generally site-specific, though many municipalities are finding creative ways to reuse public spaces for multiple purposes, layering climate solutions with community-focused infrastructure. Being in the northeast, WNY is in an area that is especially
12 North Tonawanda CVA
Figure 2.1
affected by intense heat waves (Figure 2.3), extreme precipitation, and rising sea levels (Jackson, 2022). Being a waterfront city, NT is more susceptible to the negative effects of these problems. Because of this, the most pressing issue for North Tonawanda is flooding, partly due to the Great Lakes’ rising water levels (American Geophysical Union, 2022). The increased rainfall combined with aging wastewater infrastructure presents a particularly urgent issue. Threatened by an increase in intense storms and exceptionally high temperatures, the Great Lakes Region’s coastal environments have faced accelerated erosion, and a greater incidence of flooding, leaving the shoreline vulnerable to a reduction in soil integrity (WNY Stormwater Coalition, 2022). Moreover, worsened storm conditions threaten the region as a whole, overwhelming drainage systems as increasingly heavy rainfall and snowmelt result from an unchecked rise in temperatures. The effects of climate change vary greatly across
different environments. As the IPCC has stressed, climate risks “Depend on the magnitude and rate of warming, geographic location, levels of development and vulnerability, and on the choices and implementation of adaptation and mitigation options” (Headline Statements— Global Warming of 1.5 oC, 2022). In the following section, we will focus on and discuss the most important causes and effects of climate change in North Tonawanda. The most serious issues for NT are being caused by increased precipitation in the area causing flooding and land degradation which manifests most in brownfield areas. These issues are exacerbated as well by more frequent extreme weather events, causing stronger winds in, heat islands, and new invasive species. Increased precipitation and extreme weather, combined with lifestyle-based emissions are the primary topics of concern and will be
Climate Hazards around North Tonawanda


13 Fall 2022
Figure 2.3
3: Vulnerable Populations & Assets

Introduction
Significant Climate Hazards in NT
As a result of climate change and its driving factors, the city of North Tonawanda is most vulnerable to the following climate hazards, increased precipitation, extreme climate events and an increase in lifestyle based emissions. The effects of each of these large scope climate hazards have the ability to serve a detriment to future development and growth within the city. An increased amount of precipitation will likely cause issues related to flooding and land degradation, while extreme climate events relate to an increased presence of invasive species, severe winds, and heat islands. As a by-product of this increasingly hostile environment, increased lifestyle based emissions will continue to create problems due to current zoning and transportation options. This section details some of the potential impacts these climate issues will have on some of the more vulnerable populations in North Tonawanda. environment, increased lifestyle based emissions will continue to create problems in zoning and transportation. This section details some of the potential impacts these climate issues will have on some of the more vulnerable populations in North Tonawanda.
Defining Vulnerability
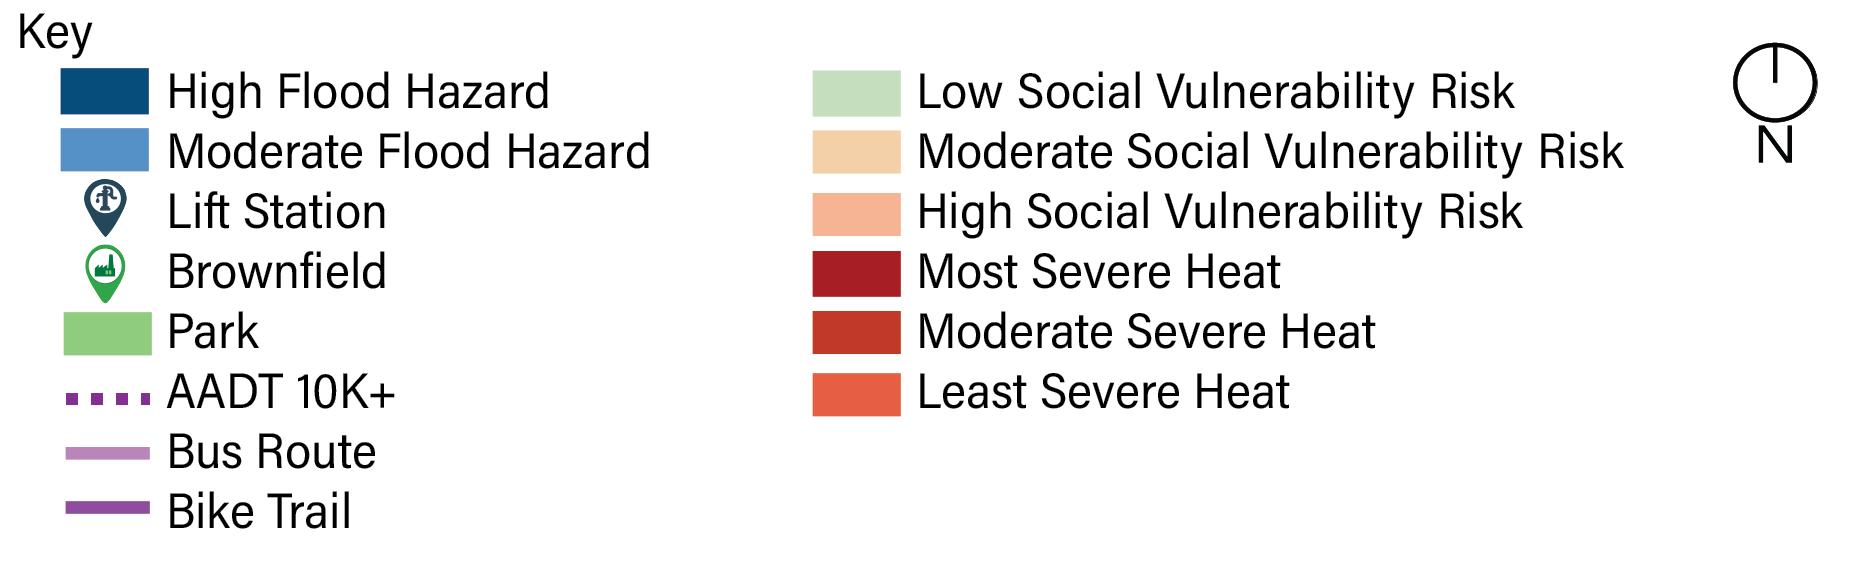
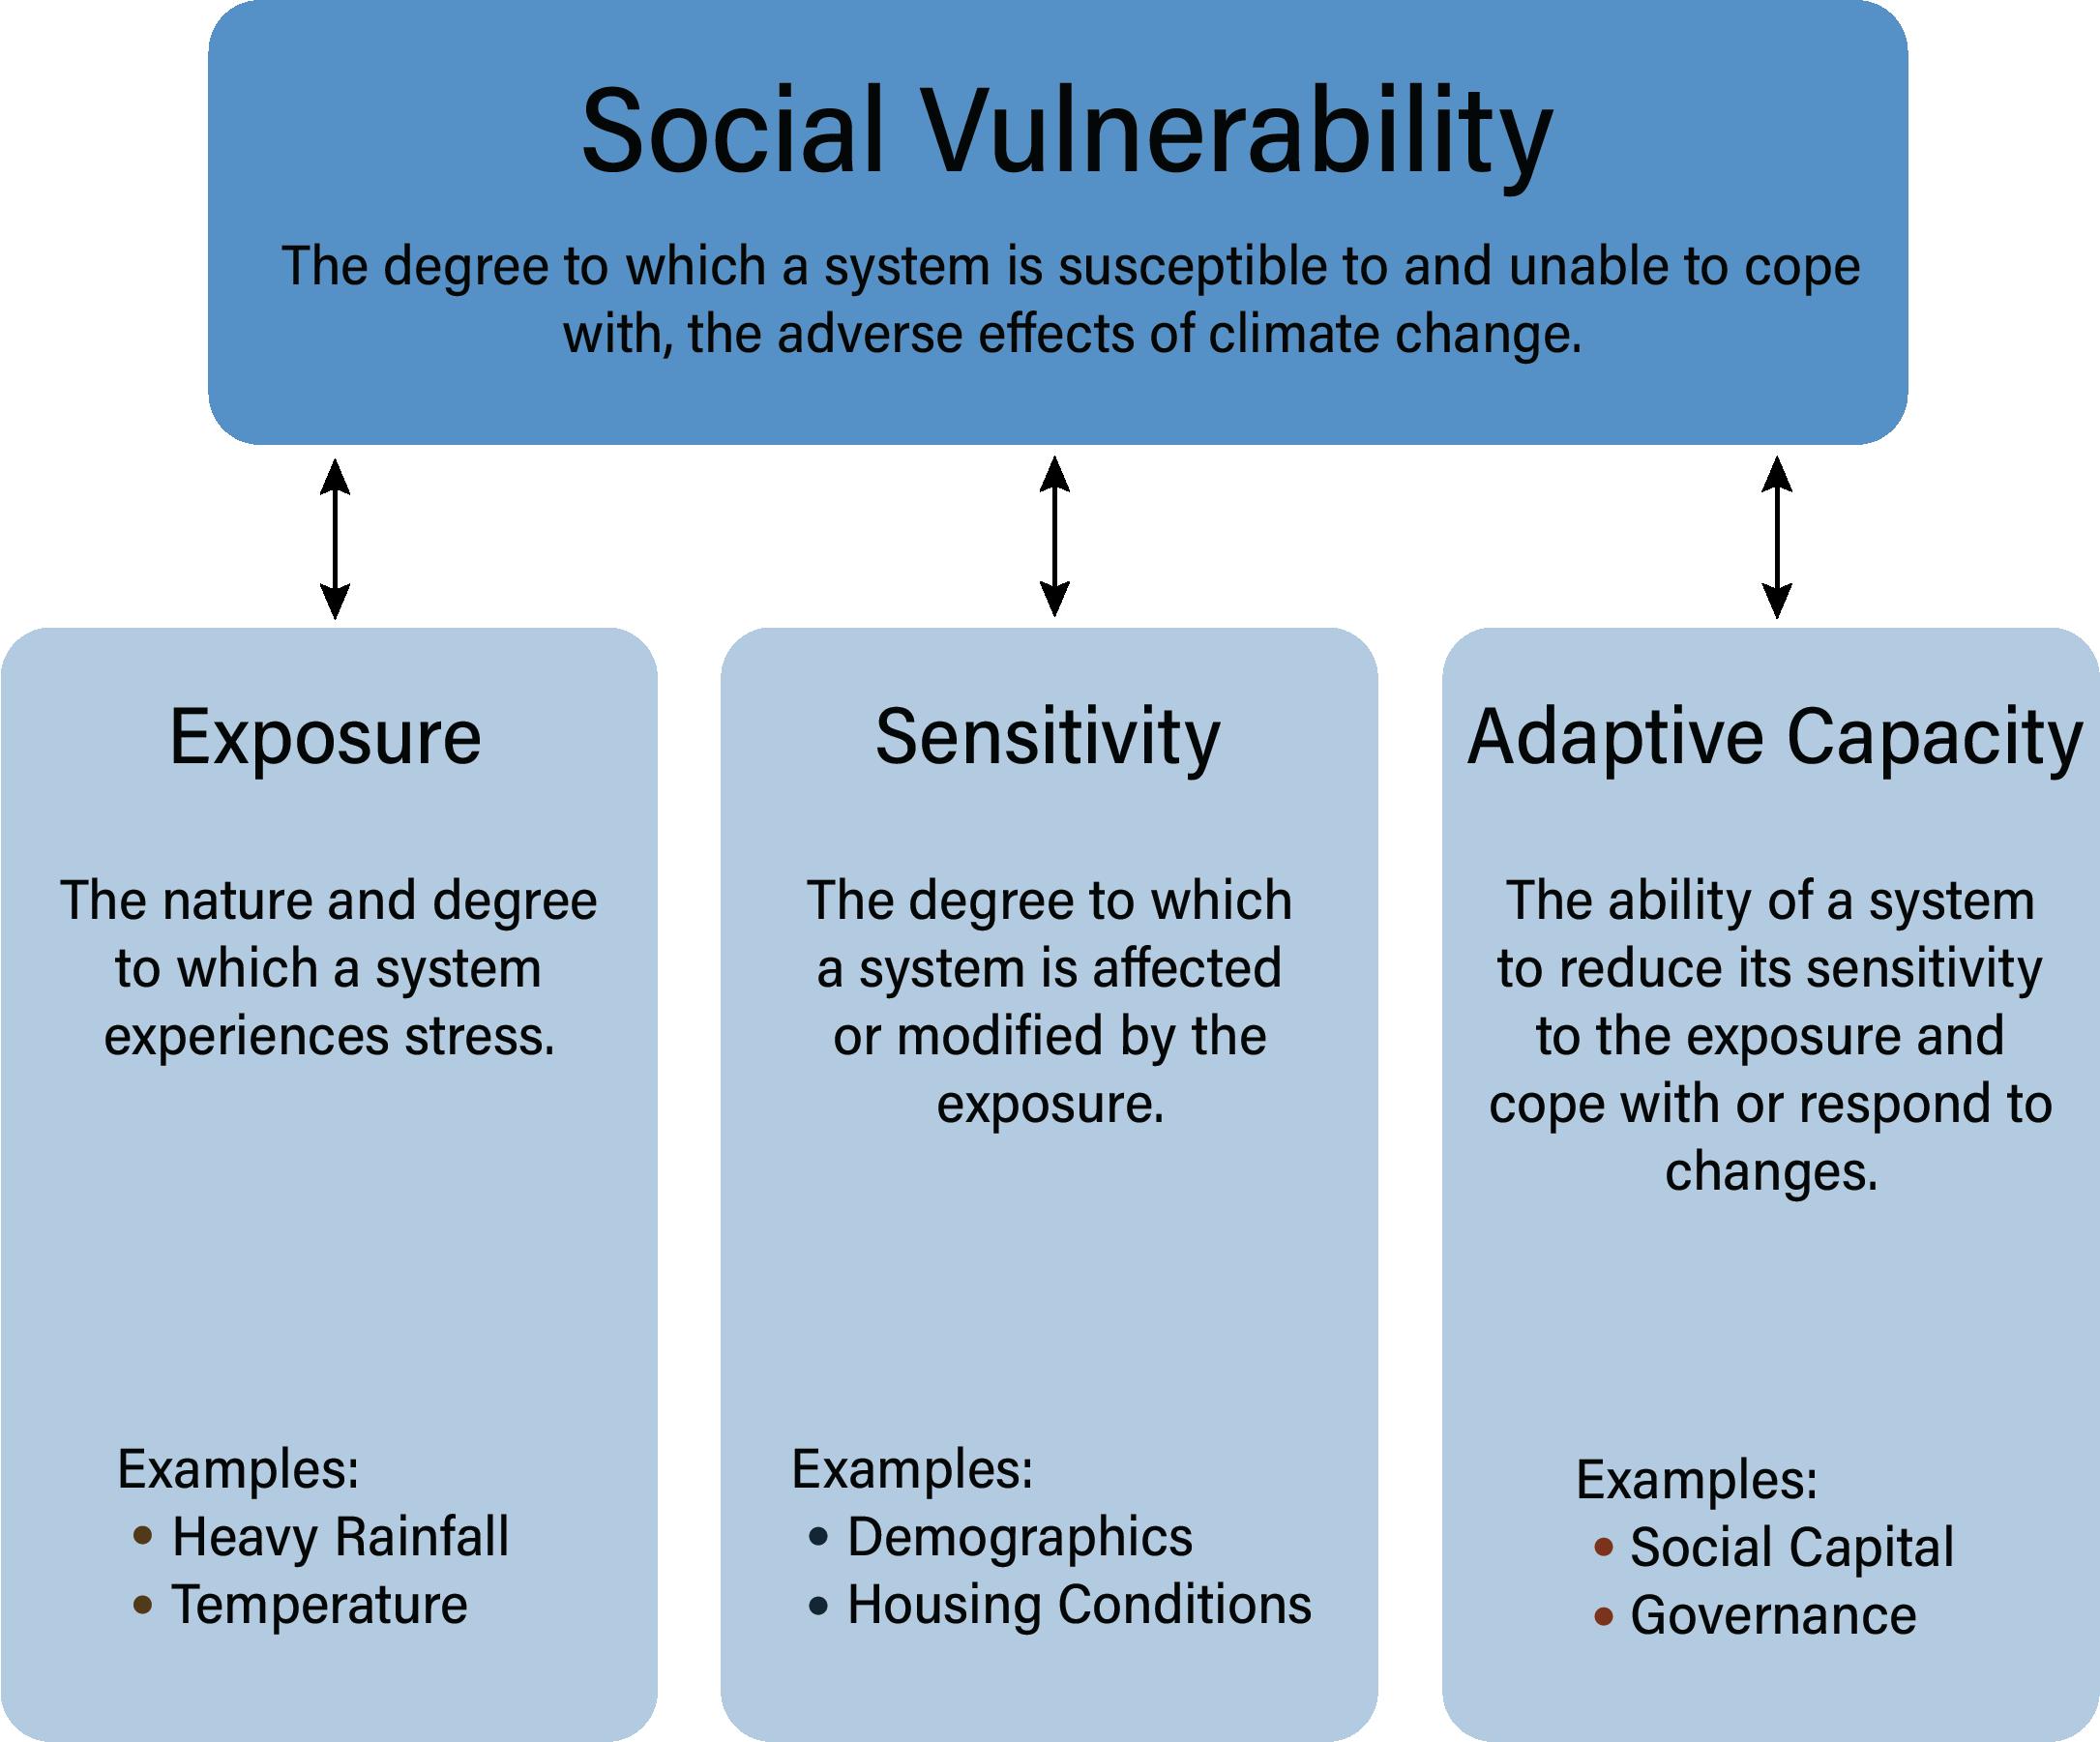
For the purpose of this report, the term vulnerability is defined as a lack of resiliency that a particular individual or individuals has in overcoming and adapting to new or increased adversity. In looking at the communities and assets that are at most risk of becoming vulnerable, data was pulled which looks at how socially vulnerable particular census blocks are to climate hazards and impacts. The CDC identifies the following categories when defining social vulnerability: economic status, household composition and disability, minority status, housing status and transportation. (Figure 3.1)
Economic Status: Examines low income individuals and education level. Vulnerable populations are identified as being below the poverty line.
Household Composition: Examines the number of people within households, their ages and disability status. Vulnerable populations are identified as being older generations (65+) and/or having a disability.
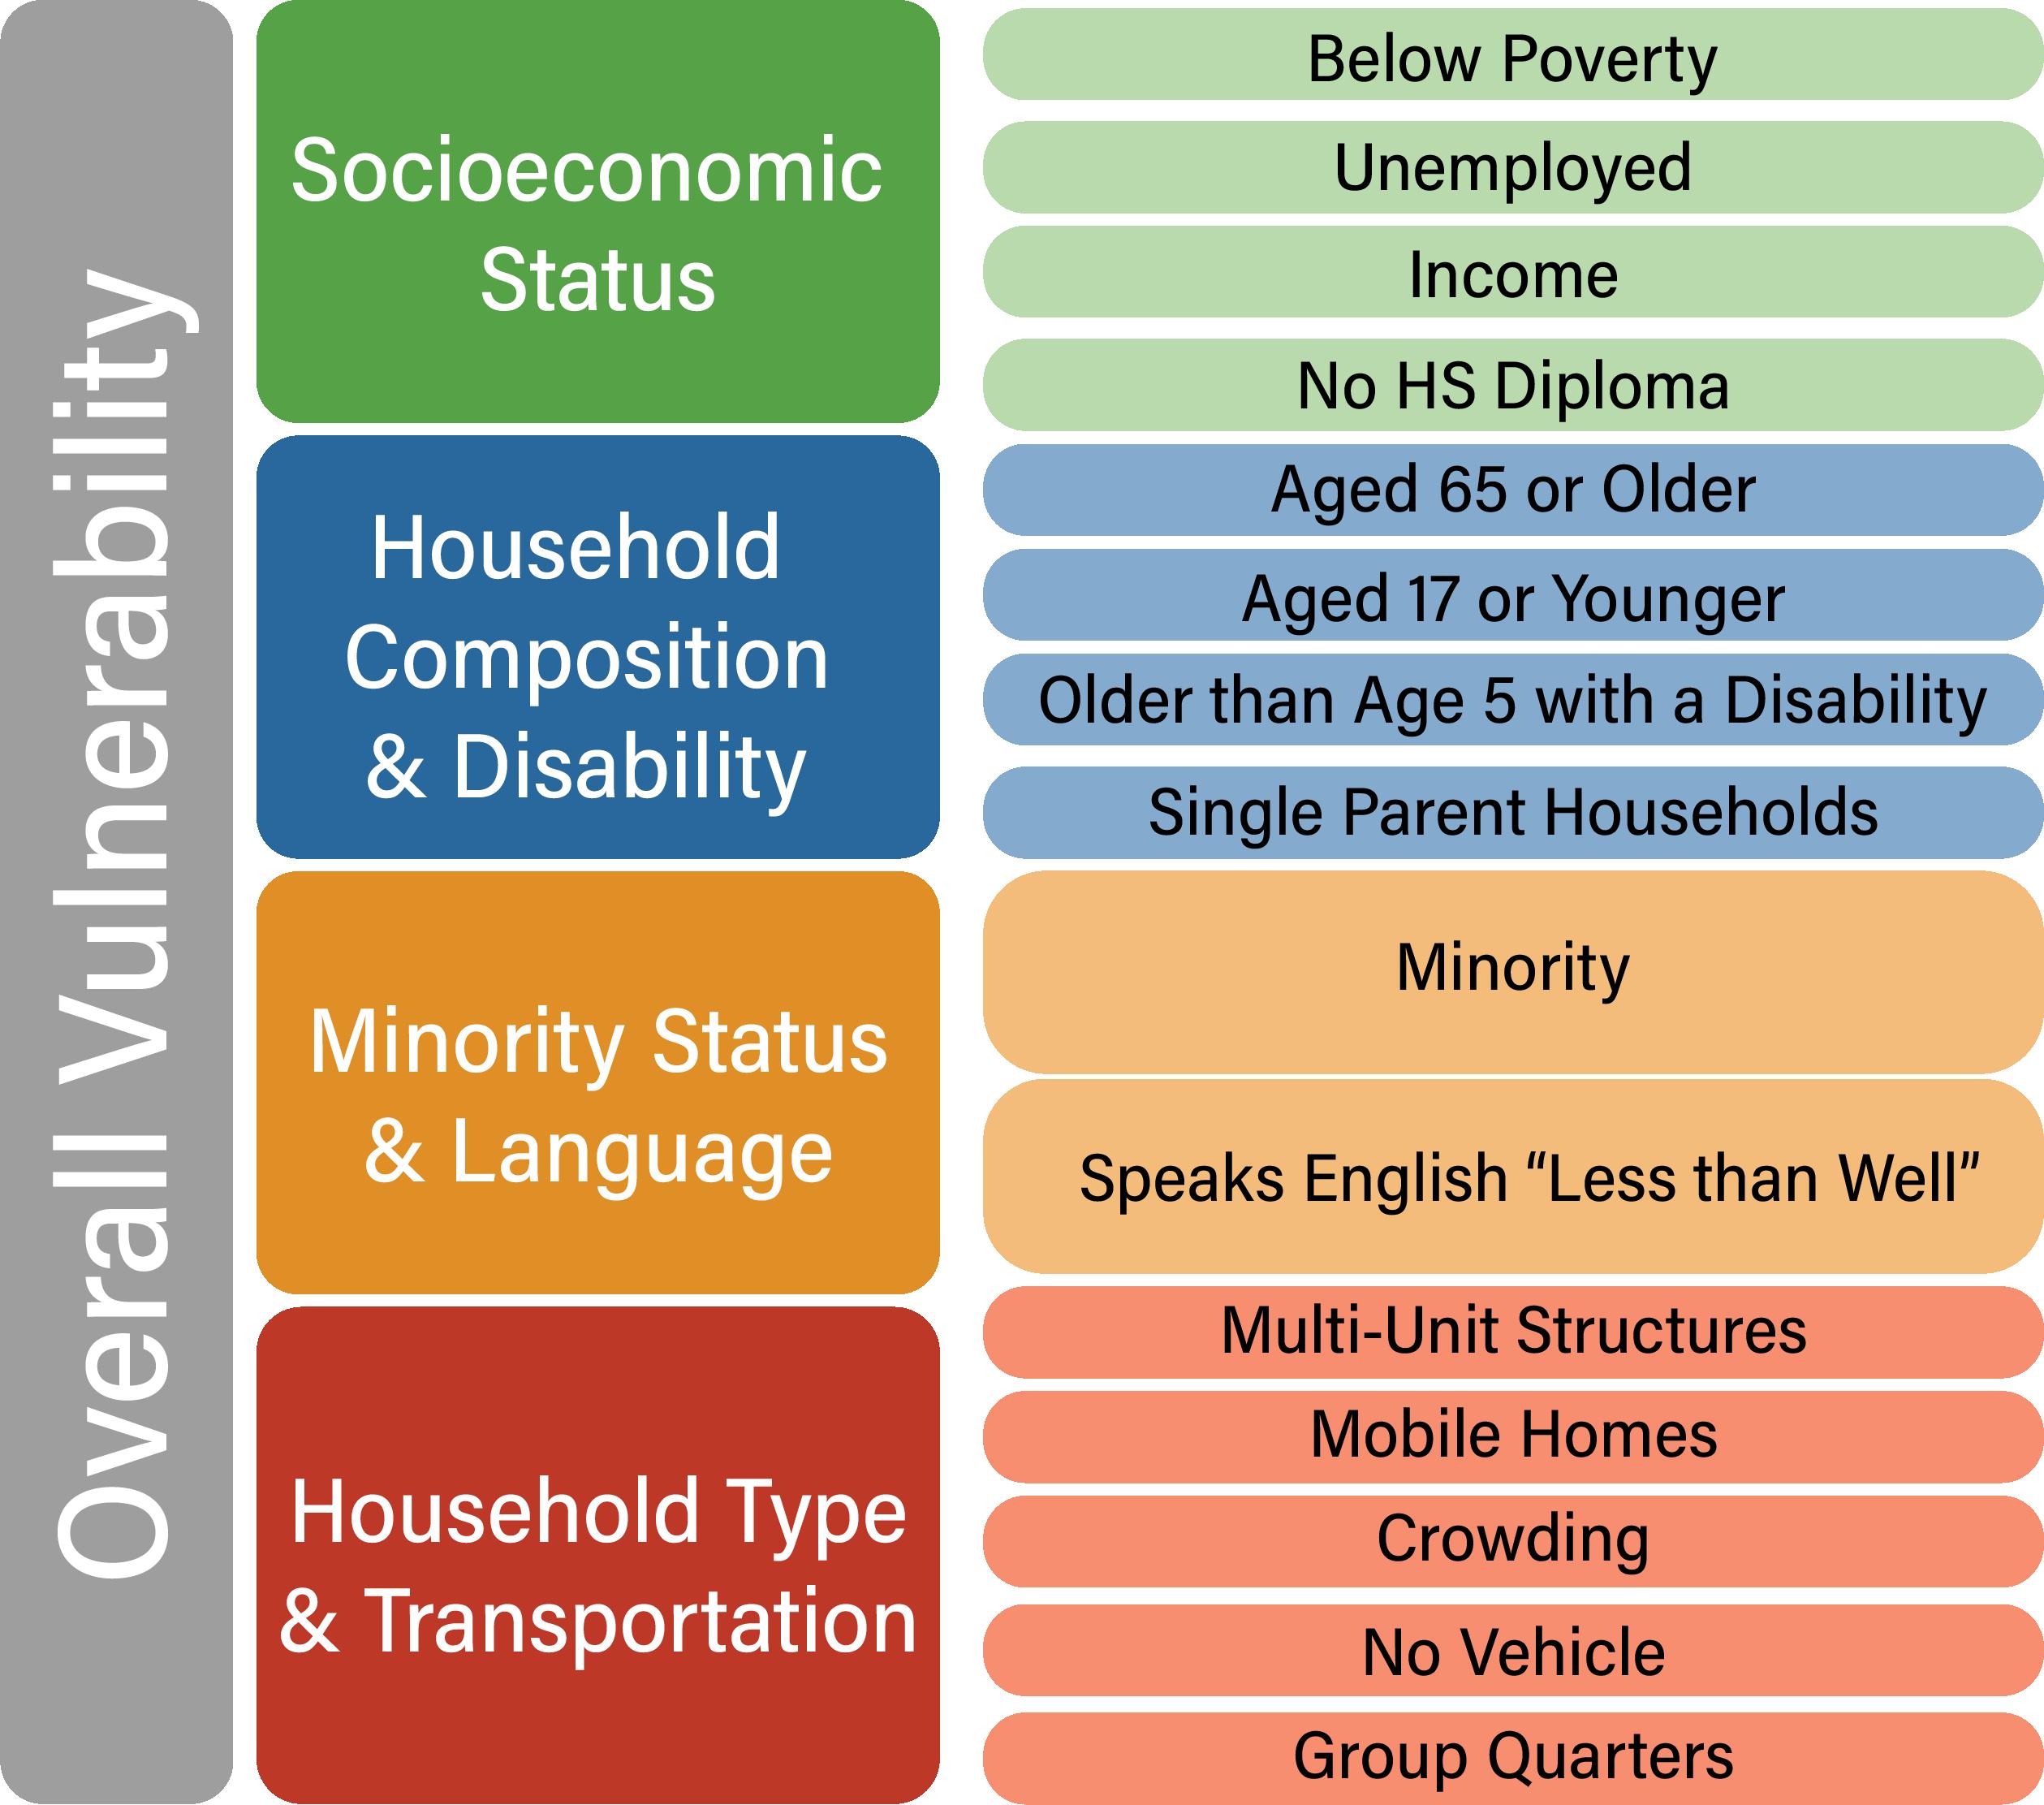
Minorities: Examines racial and ethnic minorities as well as their ability to speak English. Vulnerable populations identified as being part of a minority that may not be able to speak English very well.
Housing Type: Examines what type of housing is in the census blocks and how many vehicles the households own. Vulnerable populations are identified as not having access to a vehicle.
14 North Tonawanda CVA
Figure 3.1
The CDC is able to take these four categories and combine them to create an overall social vulnerability index. The reason it is important to identify social vulnerability in context with climate hazards is because these areas, due to their individual circumstances, feel the effects of climate hazards the strongest (Figure 3.2). This information, partnered with the demographic and climate hazard information, allows North Tonawanda to analyze where
future aid and support will be required. The following sections highlight the impacts of these climate hazards through various scorecards detailing the current state of the hazard in North Tonawanda, the communities and systems affected, where they are affected, and the potential future impacts that may result if no action is taken.
Figure 3.2
15 Fall 2022
Flooding
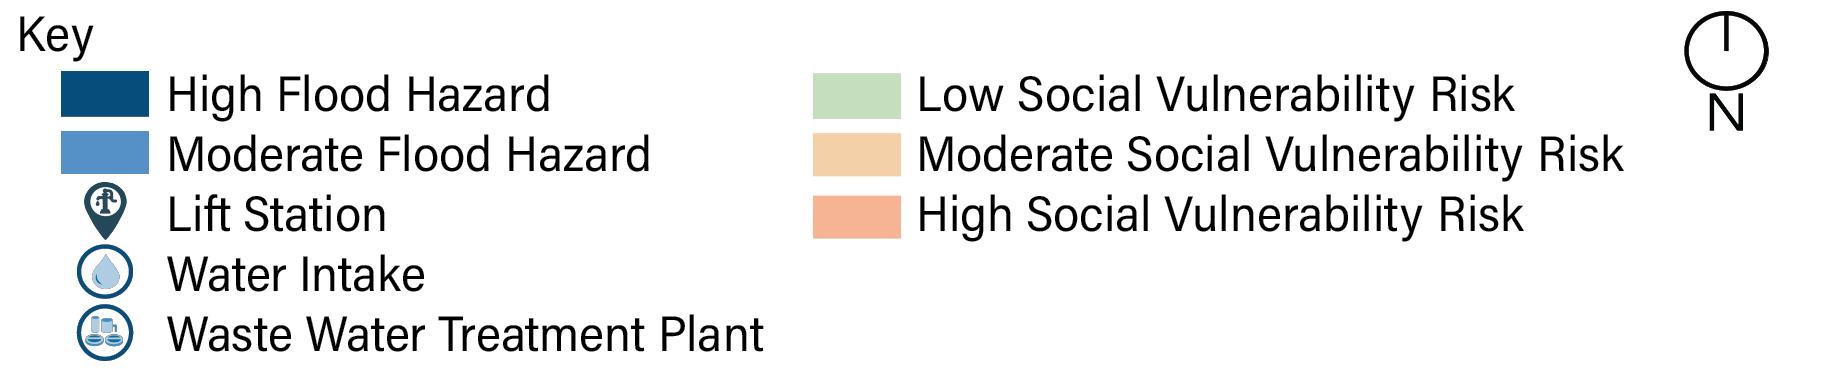
Current state: The Niagara County Climate Mitigation Plan for North Tonawanda identified floodings as a significant threat as the city has experienced urban flooding due to major storms and an insufficient and aging stormwater sewer system (Ecology and Environment inc, 2008). A major component of the insufficient and aging stormwater sewer system are the various lift stations throughout the city. The aging lift stations get overwhelmed during increased storms that result in the flooding of residential areas. These lift stations primarily affect the residential areas in census tract 228.04 and 233.01, as well as North Tonawanda Island, which is where one of North Tonawanda’s wastewater treatment plants is located. The map shows some of the most severe flooding areas in North Tonawanda, with the majority of storm water running off into the Niagara River or Tonawanda Creek.
Who/What:
Residents residing in census tracts 228.04 and 233.01 are situated near flood risk areas along Tonawanda Creek along the eastern border of the city. Considerably, 44% of residents located in Census Tract 233.01 Block Group 1 have a household income less than $25,000. Conversely, residents living in the neighboring census tract 228.04 (all block groups), have higher household incomes, the majority of which earns $100,000 or more. Thus, this climate vulnerability exposes equity concerns as one census tract is better suited to grappling the repercussions of flooding while the neighboring block group (of neighboring census tract) is ill-equipped to manage such an issue.

Furthermore, assets including the Wastewater Treatment Plant located on North Tonawanda Island and the aging stormwater sewer system are vulnerable to the consequences of flooding. While the Wastewater Treatment Plants possess abundant space to treat the city’s wastewater, the infrastructure is heavily outdated. While not a detriment to any individuals, as the island is uninhabited, the Wastewater Treatment Plant is connected to various lift stations in residential areas. Lift stations are part of the wastewater management system that move wastewater from low to high elevations allowing gravity to further move the water. These lift stations are also heavily outdated as they are interconnected with the whole waste/stormwater system. The effect of flooding on various areas depends on the performance of these lift stations and their ability to transport waste/stormwater. Residents living in areas where a lift station is in substandard condition and performs poorly can have a harder experience with the rippling effects of flooding.
Where: Residential areas in proximity to lift stations and FEMA flood hazard areas (Figure 3.3)

Future impacts:

The Federal Emergency Management Agency (FEMA)’s Niagara County Flooding Risk Report illustrates that 32% of North Tonawanda’s population is located in a watershed. These 10,096 residents are at a significantly higher safety risk due to being in an area that floods. In addition, with 32% of the resident’s property being located in the watershed, there is a higher likelihood of property damage during rainy seasons. The potential losses for flood event scenarios indicates that North Tonawanda is at risk of losing $2,810,000 worth of property from both resident and municipal property damage.

16 North Tonawanda CVA

17 Fall 2022
Land/Soil Degradation
Current state: As previously mentioned, the New York Stormwater Coalition has identified the Great Lakes region prone to soil erosion and flooding (which can cause further soil erosion). Furthermore, North Tonawanda has identified a series of man-made hazards, most of which are the result of chemical waste creating contaminated soils along a series of parcels throughout the city as seen on the Brownfield Map.
Who/What:
A brownfield is a parcel of land that was once an industrial or commercial site, now contaminated with various environmental pollutants due to abandonment and deterioration. This contamination affects the future use of such land for future development. As per the Brownfield Map, the majority of brownfields are located in a socially vulnerable census tract and are in close proximity to a waterfront. Block Group 3 of Census Tract 232 has the most brownfields sites. Most brownfields are also clustered on the southern border of North Tonawanda along Niagara Creek. In addition any census tract located on the waterfront may experience soil erosion as moving waters erode the soil
Where: Brownfields and Shoreline Areas. (Figure 3.4)
Future impacts:
The impacts of land degradation will consequently worsen through the spread of pollutants and increased flooding as air and water transports pollutants, including nitrogen compounds and tiny plastic fragments, depositing them on land surfaces (eea.Europea.eu). Furthermore, the effects of soil erosion go beyond the loss of fertile land as it has led to increased pollution and sedimentation in streams and rivers, clogging waterways and causing declines in fish and other species. Degraded lands are also often less able to hold onto water, which can worsen flooding. (worldwildlife.org).
18 North Tonawanda CVA
Brownfield Sites


19 Fall 2022
Invasive Species
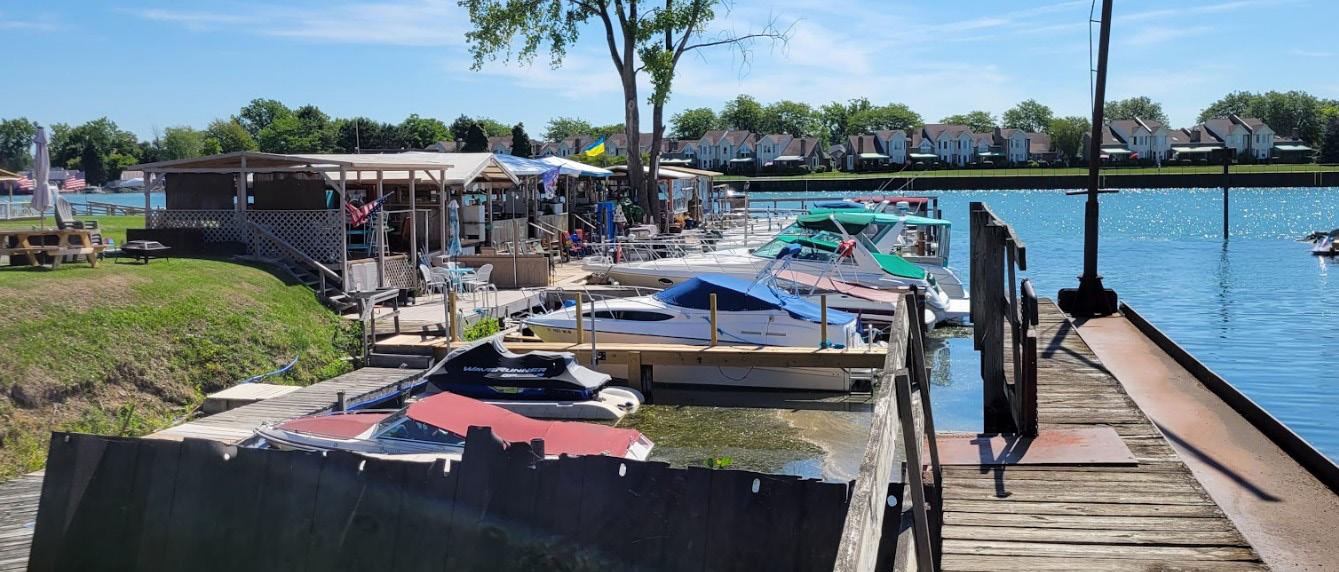
Current state: Hydrilla negatively impacts recreation and tourism, clogs waterways, and harms aquatic ecosystems while also being one of the most difficult aquatic invasive species to control. It can also spread disease to various birds as it serves as a host plant to a species of blue-green algae (cyanobacteria), which produces a neurotoxin linked to the disease.
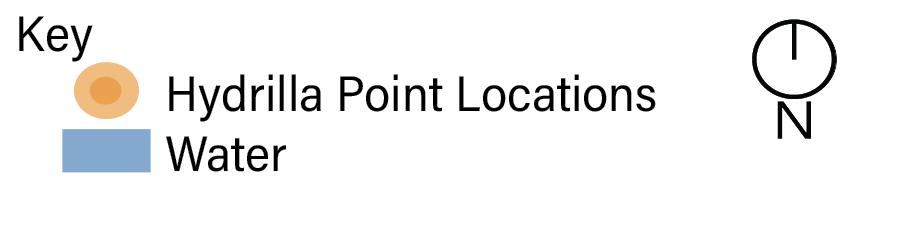
In August, 2021, the NYS Department of Environmental Conservation (DEC) announced the discovery of the plant hydrilla, an aquatic invasive species in the North Tonawanda Marina. This August, 2021 announcement aimed to prevent hydrilla from entering the Niagara River, where it would be impossible to control. However, in the final days of September, 2022, the DEC announced that the invasive plant was found along two locations of the eastern shore of the Niagara River. Furthermore, while Hydrilla is the main invasive species covered in this report, North Tonawanda has also faced harmful algal blooms and water chestnuts as further invasive threats. The spread of aquatic species are mostly similar in any water body which provides human activity. (Figure 3.5)
Who/What:
Residents living along the eastern border of North Tonawanda, next to Tonawanda Creek greatly witness the effects of Hydrilla as they are located in such an area. However, based on recent discoveries, the effects of hydrilla may be noticed by residents adjacent to Tonawanda Creek south of the city and the Niagara River. Hydrilla can deter residents from accessing the water, whether it be for swimming or boating. Furthermore, it can damage their boating or housing properties along water bodies. Therefore, hydrilla poses an overall social vulnerability for such residents. The various plant, aquatic, and avian species that have access to Tonawanda Creek are affected by hydrilla as well. An example of an avian species affected by hydrilla is waterfowl as the hydrilla covers much of the water’s surface, making it harder for the waterfowl to scavenge food. Hydrilla also prevents sunlight from penetrating into the waterbed, harming the respective plants and fish in the process. Common fishes found in Tonawanda Creek are the White Sucker, Northern Hogsucker, and Salmon.
Where: Shorelines/Waterfronts, Tonawanda Creek (Figure 3.6)
Future impacts:
Hydrilla can quickly spread in various water bodies as it only takes one fragment of the plant to start new growth. Human activity which spreads this invasive species are: transportation on boat trailers, fishing gear, waterfowl, and wildlife, wildlife and humans relocating fish and plants from infested waters, and aquarium dumping.
Hydrilla produces tubers in sediment that remain viable for years, allowing the plant to overwinter, meaning it can survive through the winter, and re-grow each spring. Once settled, hydrilla is difficult to remove, as it takes four-five years of successful, season-long remediation. Remediation mostly involves several applications of expensive aquatic herbicides. Therefore, prevention is crucial.
20 North Tonawanda CVA
Figure 3.5
Invasive Species Location
21 Fall 2022
Ellicott Creek
Tonawanda Creek
Sawyer Creek Niagara River
Wind
Current state: While all NYS counties experience their share of wind events, analysis indicates that North Tonawanda sits on the border of two of the windiest counties in New York: Erie and Niagara. The accompanied wind map illustrates wind from Lake Erie hitting the Niagara and Erie county border (Figure 3.7). Changes in climate also threaten the stability of convection currents, which transports air and evaporates water, also known as lake effect. Lake effect induces more irregularity in the behavior of wind and precipitation in Western New York. In addition, North Tonawanda has higher wind speed averages than both Buffalo and New York City with wind speed being an important factor when examining damage as faster winds cause more damage (Figure 3.8).
Who/What: Severe winds have the potential to negatively impact residents and North Tonawanda’s city infrastructure. Residents with low-income will be the most vulnerable as they have less financial resources to replace what brutal wind destroys. Specific census tracts and block groups in North Tonawanda that are vulnerable in this regard include Census Tract 232 Block Group 3 which has 64.07% of residents with incomes under $25,000 and Tract 233.01 Block Group 1 which has 44.04% of residents with incomes under $25,000 (Figure 1.2).
Where: All of North Tonawanda
Future impacts: “Severe windstorms can cause widespread damage to forests, buildings, transport and energy infrastructure.” (eea.Europea.eu). Severe winds can damage infrastructure such as power lines which can increase vulnerability during disasters.
22 North Tonawanda CVA Figure 3.8
23 Fall 2022 Figure 3.7
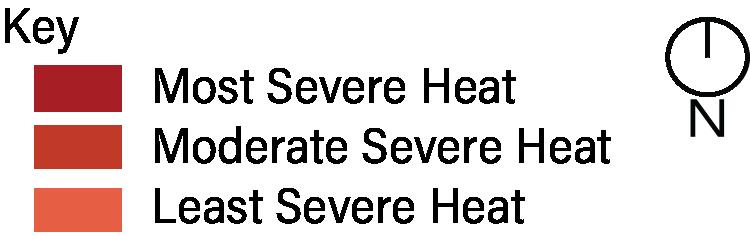
Heat Island Effect
Current state: Structures such as buildings and roads, particularly in urban areas, absorb and re-emit the sun’s heat more when greenery is limited. Effects are not only experienced in urban areas however, as heat islands can form under a variety of conditions, both during the day and night, in small or large cities, in any climate and season, and in suburban areas.
The lack of study on heat island effects in North Tonawanda prevents identification of specific sites that have endured such hazards. However, its growing downtown and areas with significantly exposed surfaces can trap heat at a larger scale than areas that are better protected from the sun’s emissions. It is also worth noting that North Tonawanda’s downtown areas are its most vulnerable according to the CDC census data in addition to being the most prone to heat island effects.
Who/What:
Residents in Downtown North Tonawanda are the most vulnerable as compared to the rest of the city. A significant amount of downtown residents have a household income less than $25,000. Furthermore, as is the case in almost every downtown, residents are more likely to rent property than own. Some downtown census blocks also house a significant number of people aged 65 or older. Many residential areas outside of downtown also house such a demographic. Lastly, the majority of North Tonawanda’s commercial parcels are located downtown, meaning it may receive ample visitors at certain times throughout the week, month, and year. The effects of heat islands may therefore irritate such visitors as well. The potential risks and costs associated with the consequences of heat islands will be discussed in the following sections.
Where:
All of North Tonawanda, more specifically downtown and heat-absorption prone surfaces (ex. Exposed pavements) (Figure 3.9 & 3.10)
Future impacts:
Heat Islands demand greater readings of electric and peak energy (using maximum electrical efficiency on a hot day). This means that electricity demand for necessities such as air conditioning, lights, and other appliances increases as temperature increases, which can further lead to an electric system override, potentially causing a blackout or power outage.
Impaired Water Quality: Hot surfaces like concrete and blacktop warms rainfall on contact. The stormwater then drains into sewers, further raising water temperatures as it travels back into natural water bodies from stormwater sewer systems.
Compromised Human Health and Comfort: The effects of Heat Islands have resulted in a high number of deaths and heat-related illnesses. Different age populations are susceptible to certain obstructions in their environment.
Middle aged adults and the elderly, as well as people with poor health or pre-existing health conditions experience physiological, psychological, and socio-economic factors that give greater difficulty in their everyday lives.
Juveniles are very prone to ozone pollution and other dangerous emissions as they breathe faster and are more likely to be outdoors. Low income areas receive inequity when seeking the appropriate aid. These areas are built with poor infrastructure conditions in the form of insulation, air conditioning and minimal space. Lastly, outdoor workers are more prone to stroke, exhaustion and dehydration. The long hours spent in these vulnerable areas can lead to hospitalization trips and even death.
24 North Tonawanda CVA
Local Heat Wave Areas
Fall 2022
Figure 3.9
Building Density in Vulnerable Areas
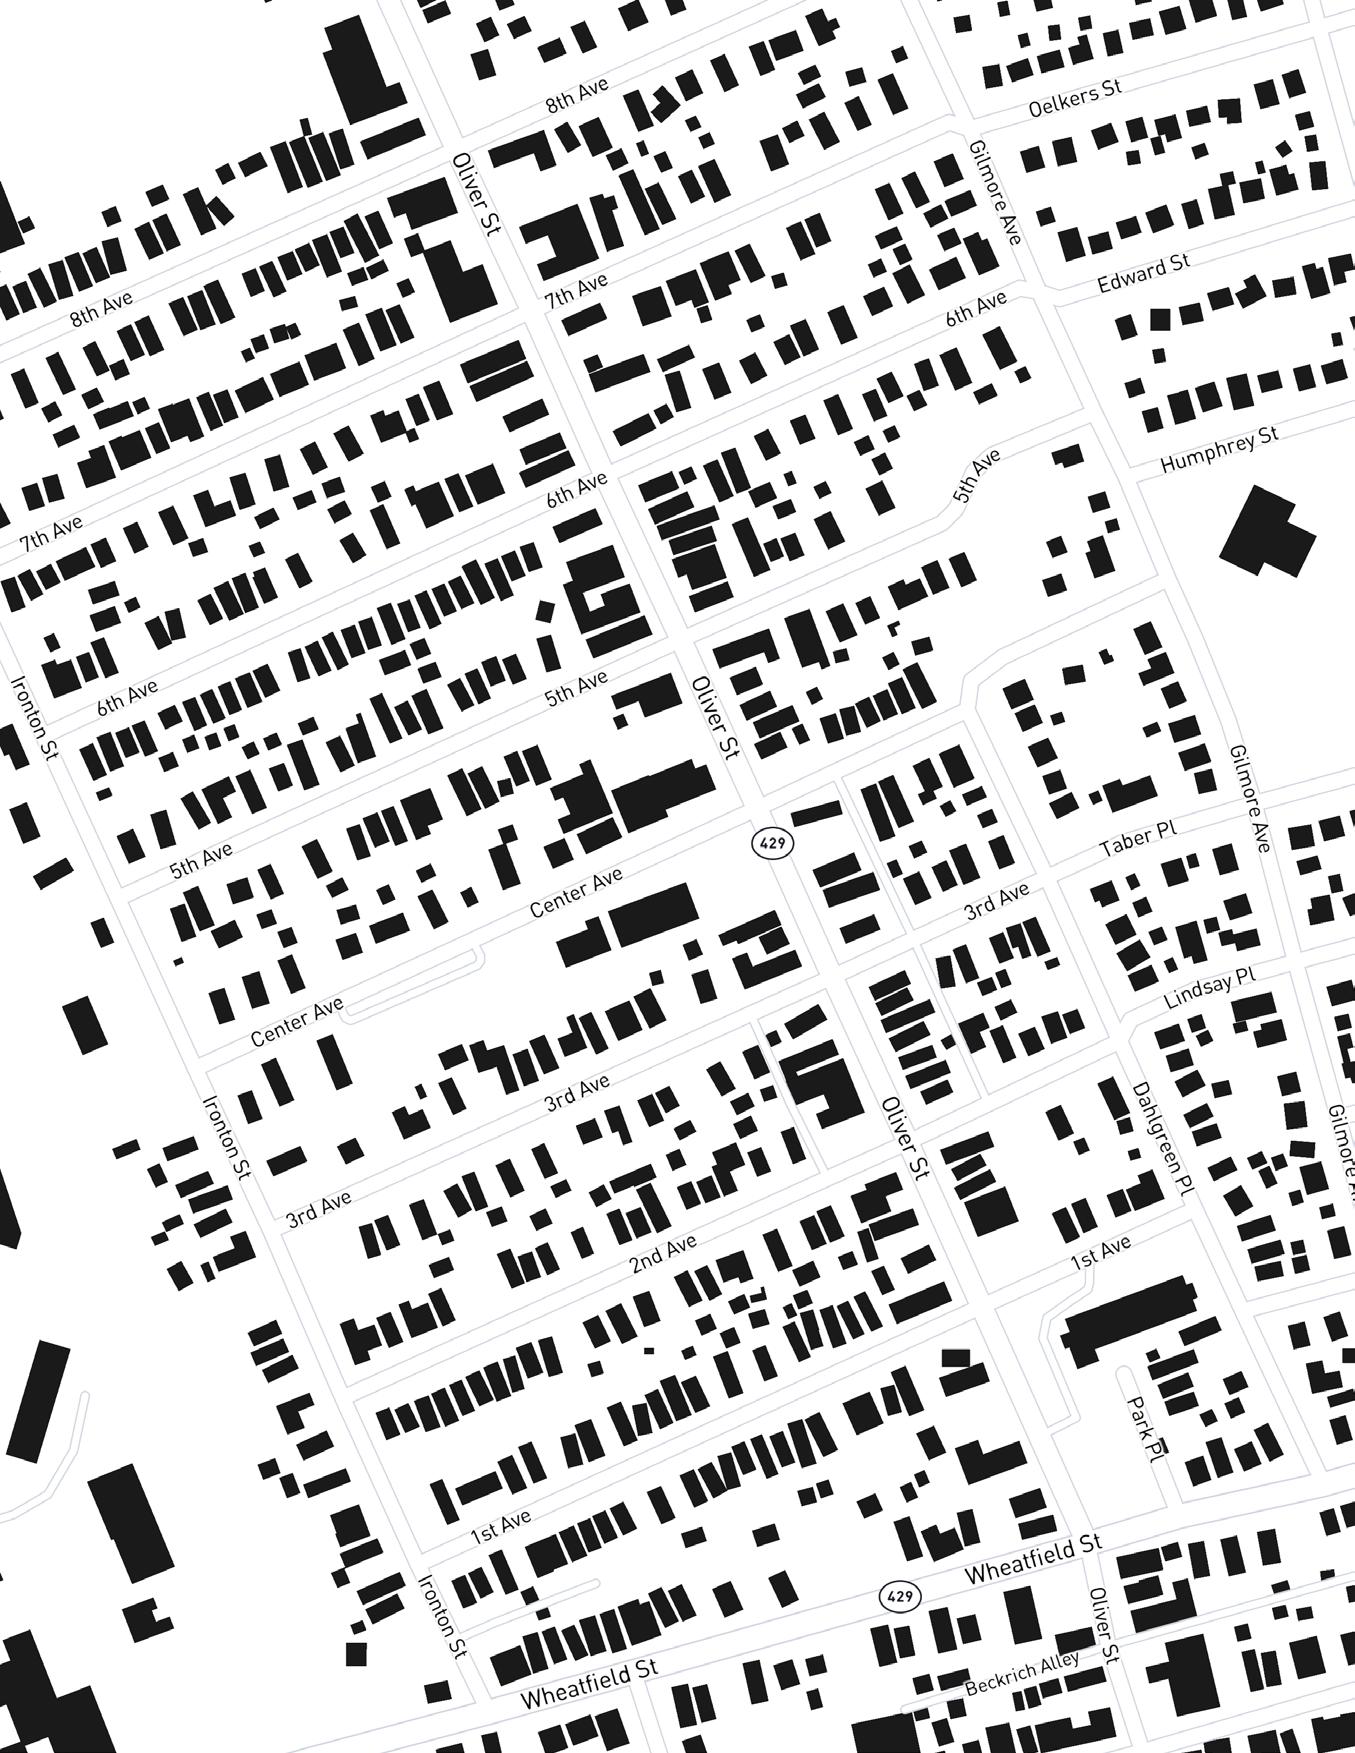
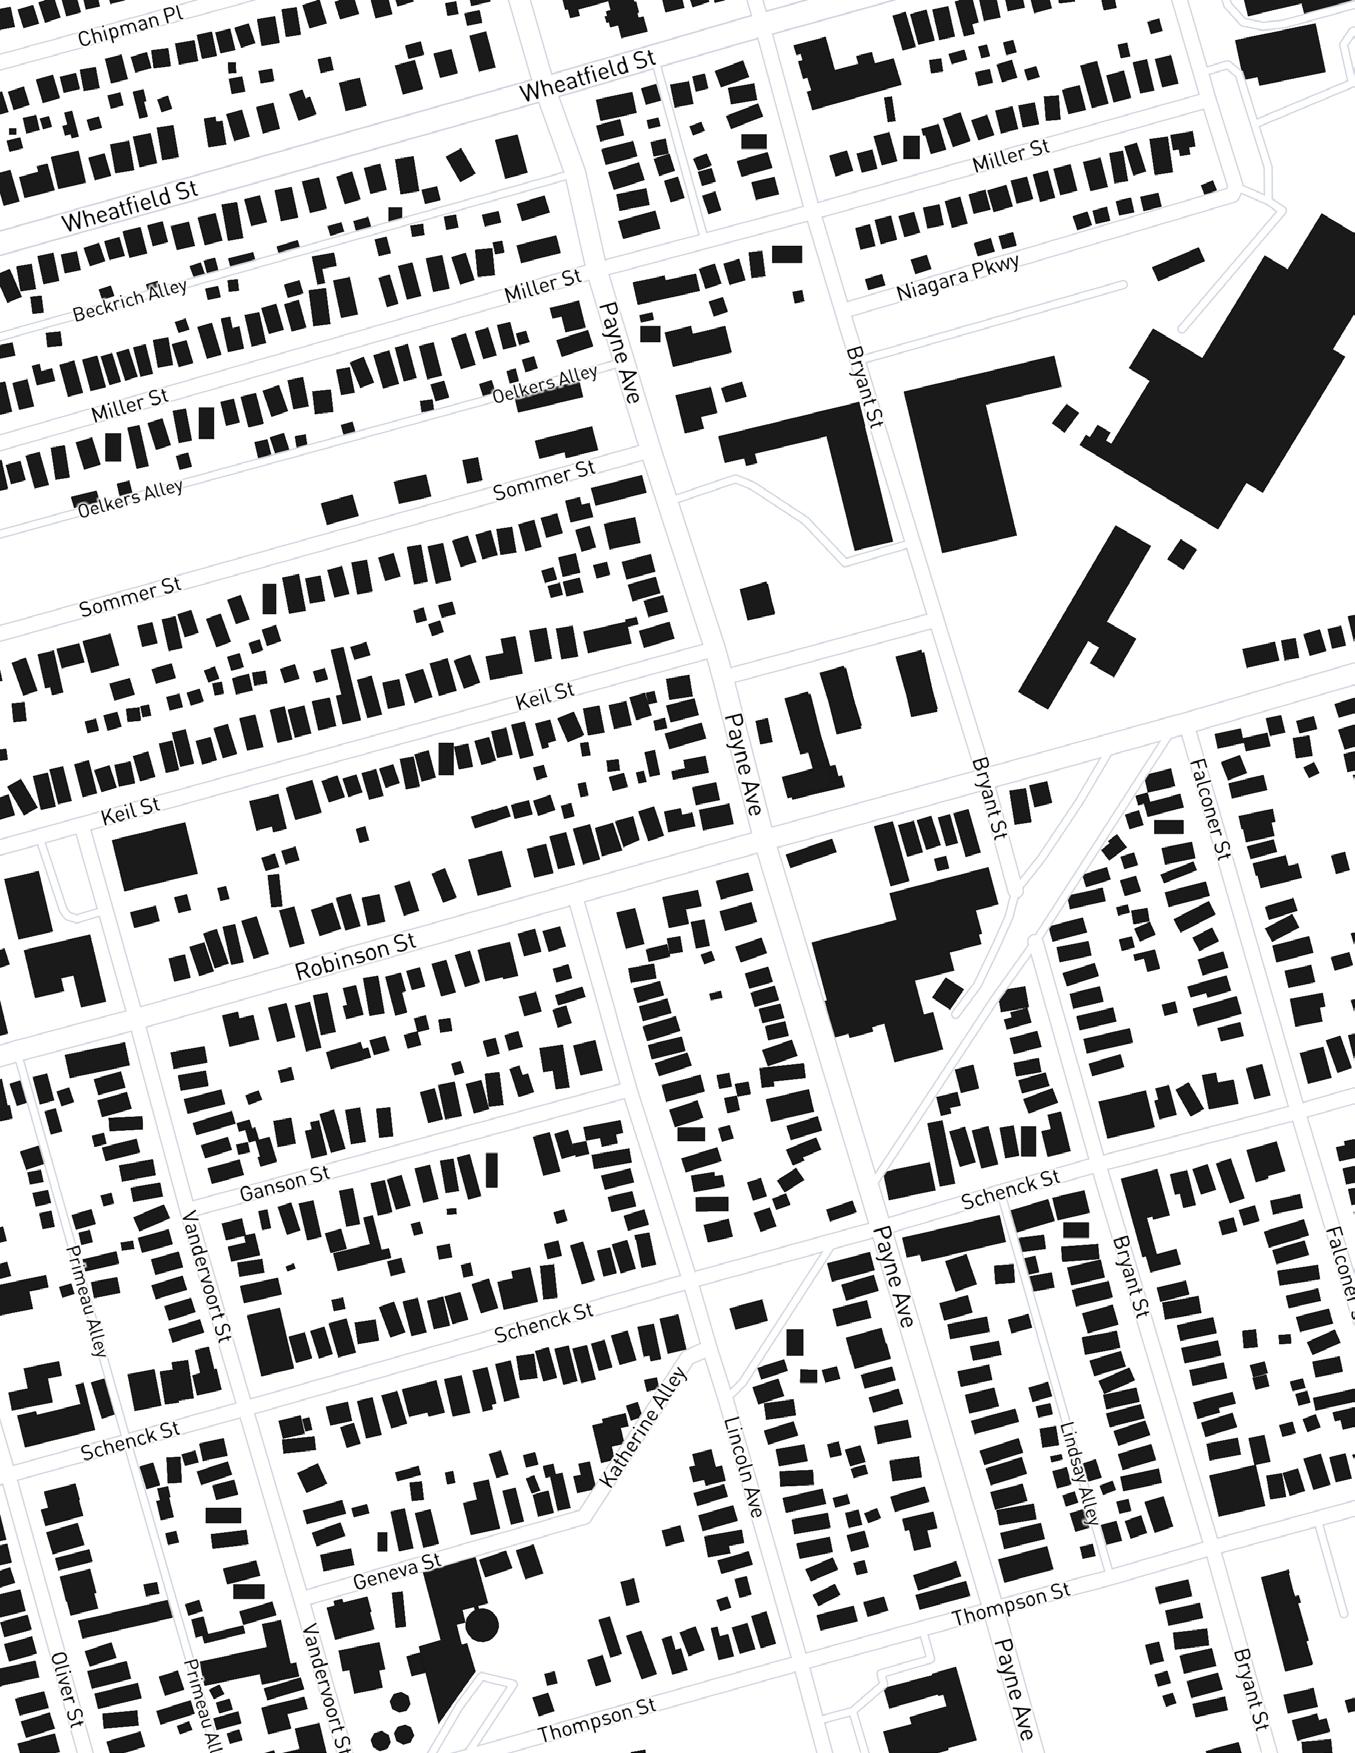
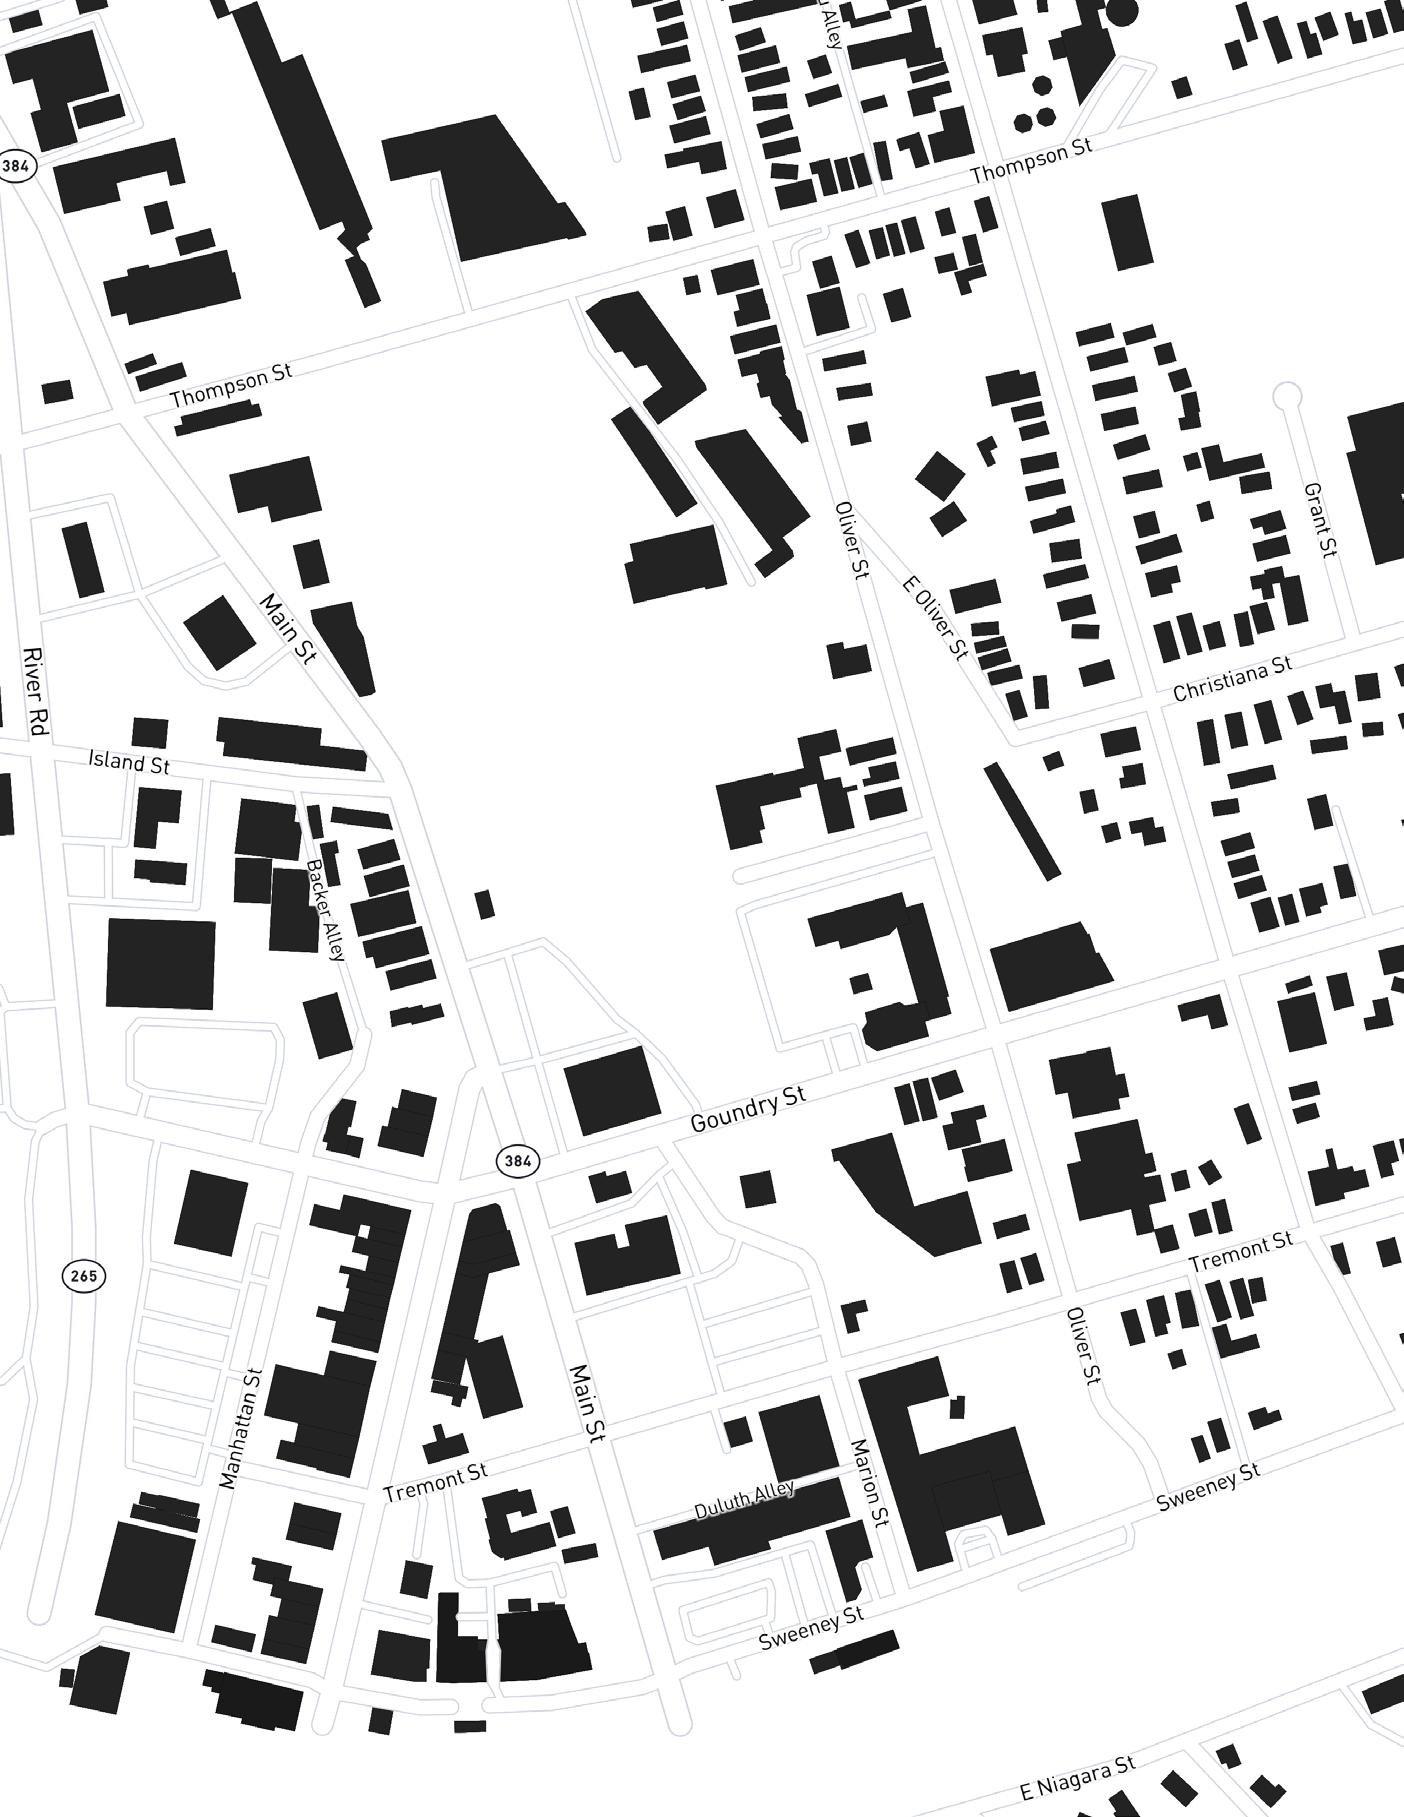
26 North Tonawanda CVA Figure 3.10
27 Fall 2022
Transportation and Related Infrastructure
Current state: North Tonawanda, like most other urban cities in the US, suffers from a lack of transportation diversity and is automobile dependent. Automobile dependence can lead to increased emissions in cities as according to the EPA in 2022 transportation was the largest cause of US gas emissions, contributing 27% of all emissions.
Over 92% of North Tonawanda residents who travel to work use a car and the US Census Bureau reports an average of 2 cars per household in North Tonawanda (DataUSA, 2022).
For bus services, there are bus stops along two disconnected routes running through North Tonawanda (Local Waterfront Revitalization Program). The locations of these stops are all along or near Oliver and Goundry Street.
There is no subway or train line for residents to travel but there are freight lines that run through the city.
Municipal departments and improvements are all focused in the downtown area with the exception of fire departments as seen in the community infrastructure map. In addition, the majority of recent road work has been focused on the downtown area, per the mayor’s 2022 state of the city report.
The overall lack of accessibility with current transportation options limits the mobility of vulnerable populations who are unable to drive and reduces residents to the automobile dependent lifestyle, increasing emissions. The introduction of Bird electric scooters to the city has started to bridge this gap in transportation accessibility by providing a healthier and climate conscious mobility option. Based on Figure 3.11, it is clear transportation options are focused downtown. For instance, the bike trail follows the western and southern borders of the city, never reaching any inner residential neighborhoods. Also, walkability is more concentrated downtown while the city’s only bus route is situated in the same area. This further justifies the city’s auto dependency as 92% of residents travel to work in a car and own an average of two cars per household as options are clearly limited for those located outside the downtown area.
Who/What:
Transportation emission affects all residents of North Tonawanda as emissions can lead to increased climate affects, worsening conditions for overall socially vulnerable areas including Census Tracts 232 and Tract 233.02. The lack of transportation options negatively affects older and disabled residents who are unable to drive and residents who are located outside of the downtown area. These areas with populations 65 or older are: Census Tract 229.02 Block Group 2 with 22.24%, Tract 228.03 Block Group 1 with 25.65%, Tract 228.02 Block Group 2 with 28.9%, Tract 228.04 Block Group 1, and Tract 233.01 Block Group 1.
Where: Throughout North Tonawanda (Figure 3.12)
Future impacts:
In addition to continuing to impact vulnerable populations who are unable to drive, North Tonawanda will see an increase in emissions and traffic if the city continues to grow or draws tourists in as lack of transportation options make private automobiles the most accessible option. In addition, the disconnect between the downtown and suburban residents in NT can contribute to an increase of vehicular emissions due to extended vehicular travel to such locations. Furthermore, concentration of various resources away from certain residential areas may be harmful to the community’s health and safety, such as hospitals and police stations.
28 North Tonawanda CVA
Transportation and Walkability
29 Fall 2022
Zoning
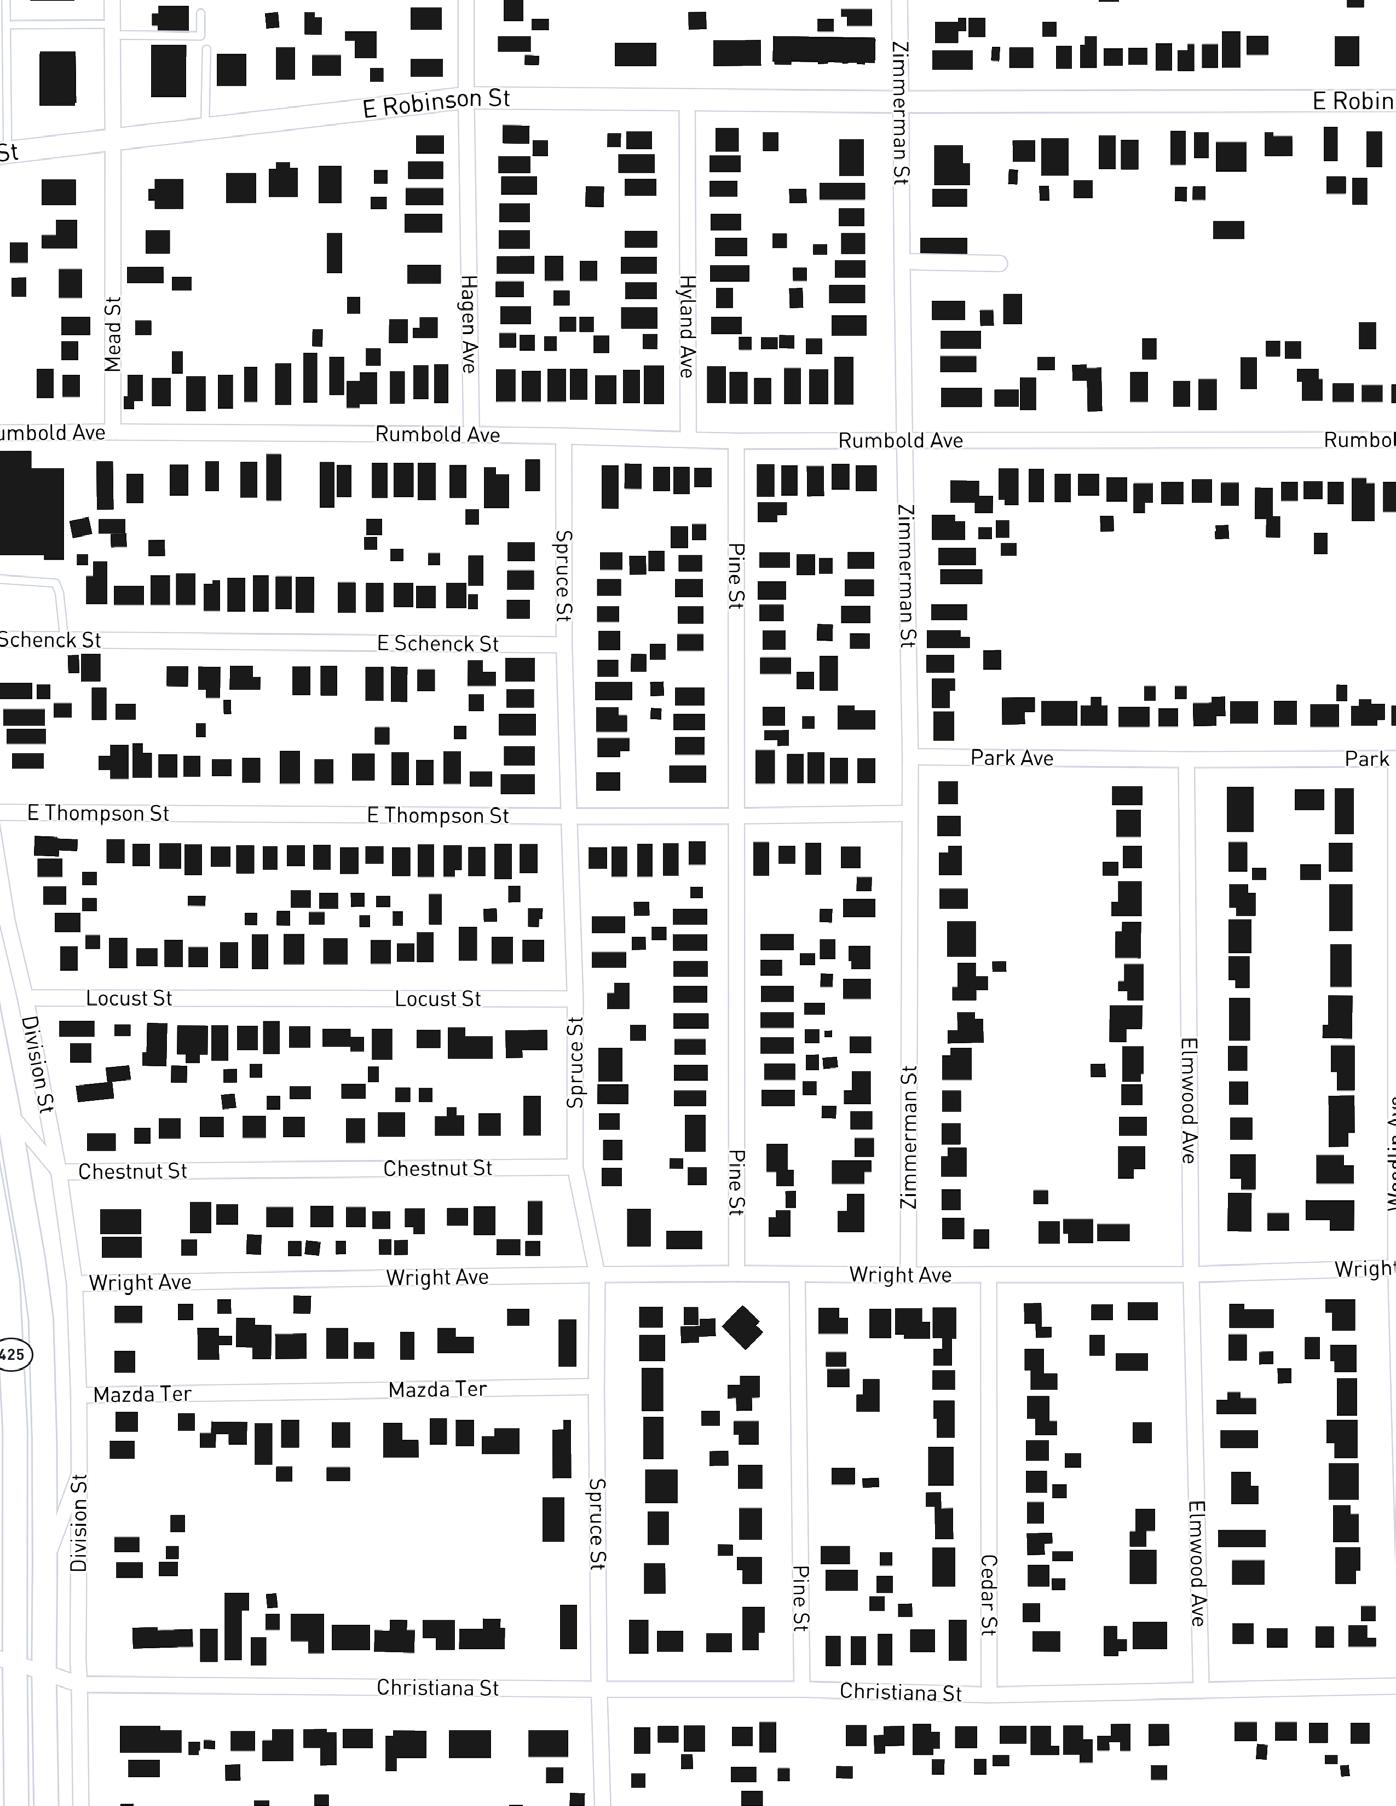
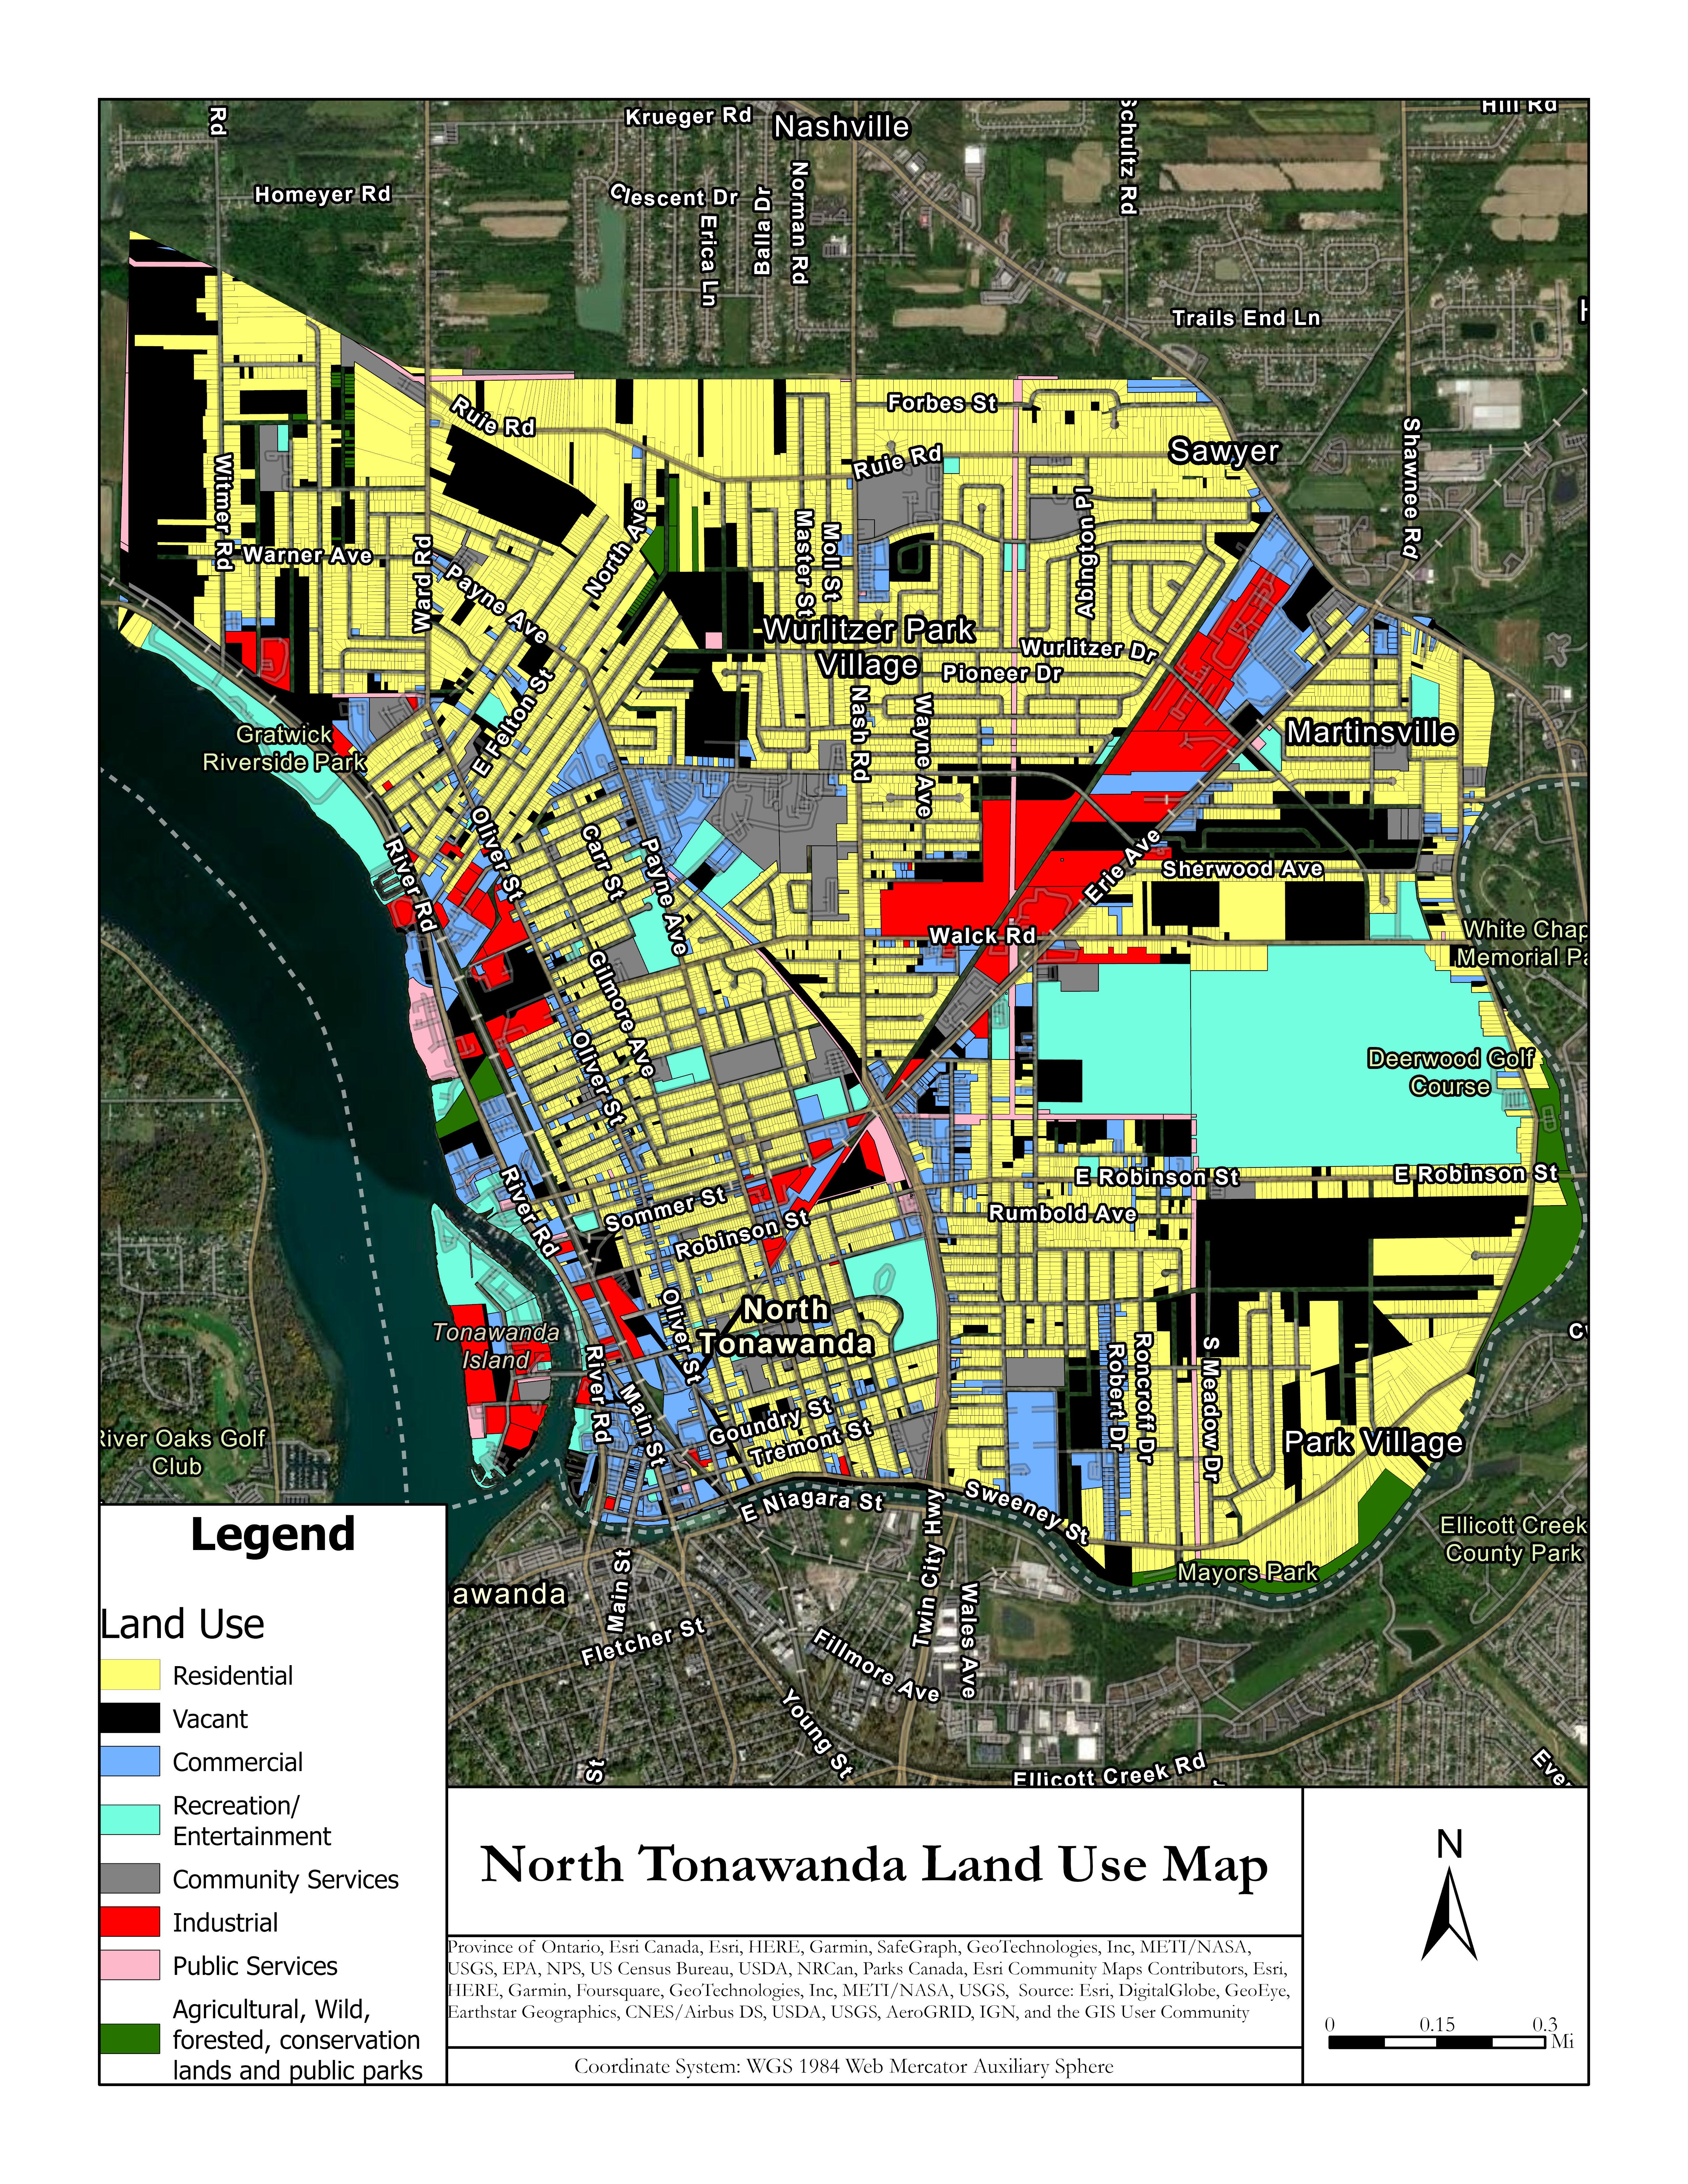
Current state: Current zoning in North Tonawanda does not address a variety of climate issues. Currently zoning in North Tonawanda as it relates to climate hazards only focuses on the prevention of brownfields by obstructing any dumping of hazardous materials. There are no zoning regulations or incentive policies to reduce emissions of industries, commercial and new development which would decrease overall emissions in North Tonawanda (Figure 3.13). North Tonawanda zoning does not require measurement of emissions from sources outside the municipality which would make it hard to direct policies to decrease its emissions.
Who/What:
All North tonawanda residents as they would be the ones to suffer the effects of increased emissions as well as business and industry which contribute to the emission footprint in North Tonawanda.
Where: Figure 3.14
Future impacts: Increase or stagnant emissions in North Tonawanda as based on city/population growth as well as businesses and industry moving in that goes against North Tonawanda’s commitment to environmentally responsible growth.
Figure 3.13
30 North Tonawanda CVA
Land Usage in North Tonawanda
31 Fall 2022
4: Conclusion
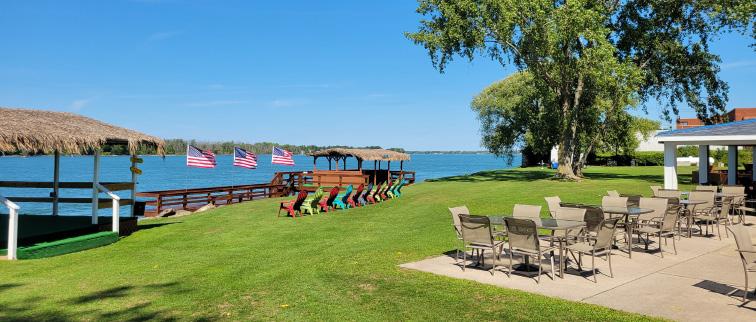
Once a prominent manufacturing and transportation hub, North Tonawanda is now a bedroom community. In recent years, the city has attempted to promote tourism by bolstering its downtown area. However, specific climate hazards in the area impose a threat to future growth. Implications include health complications and damage to ecosystems and infrastructure. Climate hazards that affect North Tonawanda are flooding and land degradation, invasive species, intense winds, heat island-related issues, and lifestyle-based emissions related to zoning and transportation. These concerns have agitated the community and natural environments and especially target vulnerable populations.
Vulnerable populations have been identified using the following factors: socioeconomic status, household composition and disability, minority status and language, and housing type and transportation. Furthermore, North Tonawanda’s identity is based on its waterfront and recreational activities, specifically around downtown where the city has put most of its revitalization efforts. If the spread of climate hazards are not prevented and mitigated, the city can potentially lose its downtown and tourism potential.
Climate change is expected to increase flood risk in New York State and North Tonawanda is no exception. “One factor in this increased risk will be increases in the frequency and severity of heavy-precipitation events” (D.E.C., 2022, p. 43). The northeast U.S. has faced a 70% increase in precipitation since 1958 and is expected to keep increasing by .10 inches per year. North Tonawanda has had issues with flooding due to its aging infrastructures such as the Tonawanda Channel’s high-water elevations and ice jams as a result of aging sewage and stormwater systems. Aging infrastructure to combat flooding is an issue that should be addressed, with over 30% of residents and land located in flood-risk areas. Therefore, infrastructure should be updated to cater to prevent such a hazard and protect affected populations.
The NYS 2100 Commission Report examined climate vulnerabilities in New York State and assessed long-term options for mitigation, which North Tonawanda can benefit from. Recommendations in the commission report include improving infrastructure as well as information systems (ClimAID, created by NYSERDA, assesses climate change and its impacts at a regional level).
32 North Tonawanda CVA
Source: Elliot Lear
This report analyzed several climate factors including temperature and precipitation and identified unique points of vulnerability in the city. North Tonawanda can utilize data provided in this report to help keep track of trends and isolate areas of vulnerability. Heavy and increased precipitation will lead North Tonawanda to face more frequent and severe flooding if the infrastructure is not improved. Updating infrastructure to be able to adapt to a changing climate is vital to protect the community in the future. Vacancy and land use should be updated and redesigned to create a green and sustainable community space that will be beneficial to the community as well as attract tourists and potential future residents, combating land degradation. Further focus should be made toward remediation efforts for invasive species, heat island
impacts, zoning, and transportation. The City of North Tonawanda has a great platform to rebuild, a sustainable and green community that can attract new industries as well as retain current businesses. Analysis of this report will help mitigate climate hazards as well as attract new residents into the community. More so, it will prove North Tonawanda a prime example in the region of what a climate-smart community resembles.
33 Fall 2022
Source: END 450 Class
1. Environmental Protection Agency. (n.d.). EPA Report Shows Disproportionate Impacts of Climate Change on Socially Vulnerable Populations in the United States. EPA. Retrieved October 1, 2022, from https:// www.epa.gov/newsreleases/epa-report-showsdisproportionate-impacts-climate-change-sociallyvulnerable
2. PSG, 360. (n.d.). Community garden installed in North Tonawanda. Niagara Frontier Publications. Retrieved October 1, 2022, from https://www.wnypapers.com/ news/article/current/2018/05/10/132601/communitygarden- installed-in-north-tonawanda.
3. CRRA Flood Risk Management Guidance - New York State Department of ... (n.d.). Retrieved October 1, 2022, from https://www.dec.ny.gov/docs/ administration_pdf/crrafloodriskmgmtgdnc.pdf
4. Niagara County invites public participation in Hazard mitigation plan. Niagara County, NY. (n.d.). Retrieved October 1, 2022, from https://www.niagaracounty. com/news_detail_T8_R4.php
5. 2022 state of the City North Tonawanda. (n.d.). Retrieved October 3, 2022, from https://www. northtonawanda.org/documents/Mayor/2022%20 State%20of%20the%20City.pdf
6. Tylec, A. J. (2022). 2022 State of the City North Tonawanda. City of North Tonawanda. RetrievedSeptember 25, 2022, from https://www. northtonawanda.org/documents/Mayor/2022%20 State%20of%20the%20City.pdf.
7. North Tonawanda, NY | Data USA. (n.d.). Retrieved October 3, 2022, from https://datausa.io/profile/geo/ north-tonawanda-ny/
8. City, N. T. (2021). 2021 Downtown Revitalization Plan Initiative. 2021 Downtown Revitalization Plan Initiative. Retrieved September 23, 2022.
9. Risk Management Guidance (ny.gov) Federal Emergency Management Agency, (May 4, 2021) , https://msc.fema.gov/portal/ advanceSearch#searchresultsanchor
10. NOAA National severe storms laboratory. NOAA National Severe Storms Laboratory. (n.d.). Retrieved October 2, 2022, from https://www.nssl.noaa.gov/
11. City of north tonawanda boa. Department of State. (n.d.). Retrieved October 2, 2022, from https://dos. ny.gov/location/city-north-tonawanda-boa
12. Western New York Stormwater Coalition. Environment & Planning. (n.d.). Retrieved October 2, 2022, from https://www3.erie.gov/environment/western-newyork-stormwater-coalition
13. CDC. (2018). CDC SVI 2018 documentation. CDC. Retrieved September 25, 2022, from https:// svi.cdc.gov/Documents/Data/2018_SVI_Data/ SVI2018Documentation.pdf
14. CDC. (2018). CDC’s Social Vulnerability index (SVI). Centers for Disease Control and Prevention. Retrieved September 25, 2022, from https://svi.cdc.gov/map.html
15. Climate action and Sustainability. Environment & Planning. (n.d.). Retrieved October 2, 2022, from https://www3.erie.gov/environment/climate-actionand-sustainability
16. City of North Tonawanda, NY: Zoning. City of North Tonawanda, NY Code. (n.d.). Retrieved October 2, 2022, from https://ecode360.com/8295875
17. Governor Hochul announces Buffalo and North Tonawanda as $10 million Western New York winners of fifth-round downtown revitalization initiative. Governor Kathy Hochul. (n.d.). Retrieved October 2, 2022, from https://www.governor.ny.gov/news/ governor-hochul-announces-buffalo-and-northtonawanda-10-million-western-new-york-winners ]
18. Climate action and Sustainability. Environment & Planning. (n.d.). Retrieved October 2, 2022, from https://www3.erie.gov/environment/climate-actionand-sustainability
19. MyRec.com. (n.d.). News: Community tree planting day. North Tonawanda Dept. of Youth, Recreation & Parks: News. Retrieved September 25, 2022, from https://northtonawandany.myrec.com/info/news/ details.aspx?NewsID=4597
20. 12 examples of climate-resilient city solutions. State of Green. (2022, November 7). Retrieved November 12, 2022, from https://stateofgreen.com/en/news/12examples-of-climate-resilient-city-solutions/
21. staff, S. X. (2022, June 22). Great Lakes levels are likely
34
References
North Tonawanda CVA
to see continued rise in next three decades. Phys.org. Retrieved November 12, 2022, from https://phys.org/ news/2022-06-great-lakes-decades.html
22. NASA. (2020, October 12). A degree of concern: Why global temperatures matter – climate change: Vital signs of the planet. NASA. Retrieved November 12, 2022, from https://climate.nasa.gov/news/2865/adegree-of-concern-why-global-temperatures-matter/
23. Galvin, M., & Maassen, A. (2020, December 16). 5 big ideas to address the climate crisis and inequality in cities. World Resources Institute. Retrieved November 12, 2022, from https://www.wri.org/insights/5-bigideas-address-climate-crisis-and-inequality-cities
24. Headline statements. Global Warming of 1.5 C. (n.d.). Retrieved November 12, 2022, from https://www.ipcc. ch/sr15/resources/headline-statements/
25. Definition of terms used within the DDC pages. IPCC DDC Glossary. (n.d.). Retrieved November 12, 2022, from https://www.ipcc-data.org/guidelines/pages/ glossary/glossary_fg.html
26. NASA. (2022, November 11). The effects of climate change. NASA. Retrieved November 12, 2022, from https://climate.nasa.gov/effects/#: :text=Climate%20 change%20has%20caused%20increased,related%20 health%20impacts%20in%20cities.
27. What we can do. Center for Climate and Energy Solutions. (2020, March 26). Retrieved November 12, 2022, from https://www.c2es.org/content/what-wecan-do/
28. Home: Environment & planning. Home | Environment & Planning. (n.d.). Retrieved November 12, 2022, from https://www3.erie.gov/environment/
29. Land and soil pollution - widespread, harmful and growing. European Environment Agency. (2022, September 19). Retrieved November 12, 2022, from https://www.eea.europa.eu/signals/signals-2020/ articles/land-and-soil-pollution
30. World Wildlife Fund. (n.d.). What is erosion? effects of soil erosion and land degradation. WWF. Retrieved November 12, 2022, from https://www.worldwildlife. org/threats/soil-erosion-and-degradation
31. Wind - severe windstorms. European Environment Agency. (2021, November 19). Retrieved November 12, 2022, from https://www.eea.europa.eu/publications/
europes-changing-climate-hazards-1/wind/windsevere-windstorms
32. Environmental Protection Agency. (n.d.). EPA. Retrieved November 12, 2022, from https://www.epa. gov/ghgemissions/sources-greenhouse-gas-emissions
33. Environmental Protection Agency. (n.d.). EPA. Retrieved November 12, 2022, from https://www.epa. gov/heatislands/heat-island-impacts
34. Tonawanda Creek. Tonawanda Creek | Natural Atlas. (n.d.). Retrieved November 12, 2022, from https:// naturalatlas.com/creeks/tonawanda-892440
35. Lift station basics. High Tide. (2020, April 21). Retrieved November 12, 2022, from https://htt.io/ resources/lift-station-basics/
36. DEC announces Invasive Aquatic plan hydrilla found at additional locations in Niagara River. DEC Announces Invasive Aquatic Plan Hydrilla Found at Additional Locations in Niagara River - NYS Dept. of Environmental Conservation. (n.d.). Retrieved November 12, 2022, from https://www.dec.ny.gov/ press/126263.html
37. Dec announces Aquatic Invasive Plant ‘hydrilla’ found at City of North Tonawanda Marina. DEC Announces Aquatic Invasive Plant ‘Hydrilla’ Found at City of North Tonawanda Marina - NYS Dept. of Environmental Conservation. (n.d.). Retrieved November 12, 2022, from https://www.dec.ny.gov/ press/123644.html
35 Fall 2022