Solar Solutions for a Greener Halifax
Analyzing the Role of Small-Scale Solar Installations in Emission Reduction
Hetvi Joshi

ACKNOWLEDGEMENT
I extend my heartfelt gratitude to my dedicated mentors, Jan Sakora, Kate Thompson, and Lama Hassan, whose unwavering guidance shaped this report. Special thanks to Michelle Miller, Manager of Climate Change Mitigation at Nova Scotia Environment and Climate Change, Catharine Chase, SCCF Coordinator at NS Dept. of Environment & Climate Change, and Kevin Boutilier, P. Eng, Manager of Community Energy at Environment & Climate Change | Property, Fleet & Environment, for their invaluable professional insights.
I would also like to acknowledge the support and encouragement received from various professionals in the field. Their expertise added depth to my understanding and enriched the quality of this work.
Furthermore, sincere appreciation goes to all those who contributed directly or indirectly to this research. Your collective efforts have played a crucial role in shaping the discourse on climate action and sustainable energy practices.
Lastly, I express gratitude to my peers, friends, and family for their understanding and support throughout this endeavour. Your encouragement kept me motivated and focused on the significance of this work in contributing to a cleaner and more resilient energy future.
INTRODUCTION
Halifax, Nova Scotia, stands at the forefront of innovative energy initiatives, grappling with the challenges of climate change and striving for a sustainable and resilient future. As a city that declared a climate emergency in 2019, Halifax has embarked on a transformative journey guided by its ambitious climate action plan, HalifACT, unanimously approved by the Halifax Regional Council in June 2020. Comprising 46 targeted actions, HalifACT is designed to lead the municipality toward a net-zero emissions goal by 2050 (HalifACT, n.d.) In this dynamic context, the report delves into the multifaceted landscape of Halifax's electricity production, energy consumption, and the crucial efforts undertaken to mitigate greenhouse gas emissions. In this context, the report explores transformative programs such as the Halifax Solar City (HSC) initiative, designed to make solar energy accessible and affordable for property owners, including non-profits, places of worship, co-operatives, and charities. Moreover, the report discusses the innovative Landlord to Tenant Program, offering a pathway for both landlords and tenants to contribute to a cleaner energy future. These initiatives are pivotal in shaping Halifax's energy landscape and contribute to the broader national and global conversation on climate action.
Drawing inspiration from successful renewable energy models, particularly Germany's Energiewende, the report outlines planning interventions tailored to encourage widespread adoption of solar power in Halifax. These proposed changes include solar-friendly zoning regulations, solar access in public spaces, and mandatory solar installations in new constructions. Additionally, the report recommends the expansion of net metering policies and explores the potential introduction of a Feed-in Tariff, inspired by Germany's successful experience. As Halifax navigates the complexities of energy transition, this report provides a comprehensive overview of its current energy infrastructure, initiatives, and proposes forwardthinking interventions. In doing so, it aims to contribute to the ongoing discourse on curbing Greenhouse Gas emission, inclusive energy policies, and the critical role of indigenous communities in shaping resilient and eco-conscious cities.
RATIONALE
The rationale for the comprehensive report on electricity production, consumption patterns, greenhouse gas emissions, and solar energy initiatives in Nova Scotia, with a focus on Halifax, stems from the critical need for informed decision-making and strategic interventions in the energy sector. The report aims to provide a thorough understanding of Nova Scotia's current energy landscape, emphasizing the nuances of electricity generation, consumption patterns, and the environmental impact of greenhouse gas emissions. Furthermore, the inclusion of Halifax-specific data enables a granular examination of localized efforts and challenges in achieving sustainability goals and the report tries to address this by:
• Informing Stakeholders
• Identifying Opportunities and Challenges
• Highlighting Halifax's Climate Action Initiatives
• Comparative Analysis with Germany
• Strategic Planning Recommendations
• Facilitating Informed Decision-Making
STUDY OBJECTIVES
The comprehensive study encompasses several key objectives aimed at understanding and evaluating Nova Scotia's energy landscape. Firstly, the report conducts a thorough assessment of the province's electricity production in 2019, highlighting the diverse sources contributing to Nova Scotia's energy mix, with a specific focus on coal, hydro, wind, and biomass. It examines the generating capacity, transmission infrastructure, and collaborative efforts with otherprovinces, emphasizingNovaScotia'srolein theCanadianenergyparadigm.Theanalysis extends to end-use energy demand, scrutinizing consumption patterns across various sectors and identifying the prevalent use of Residential, Commercial, and Institutional Propane and Other Liquid Fuels (RPPs). The report shifts its attention to Nova Scotia's greenhouse gas emissions in 2020, emphasizing the jaded progress in reducing emissions, particularly in the power sector. The focus then narrows to Halifax, detailing the city's greenhouse gas emissions in 2021, sector-wise contributors, and the ambitious HalifACT plan, highlighting Halifax's commitment to addressing climate change. The study extends its global perspective by comparing Halifax's initiatives with Germany's exemplary solar programs. It explores Germany's successful adoption of solar power, emphasizing initiatives such as feed-in tariffs, landlord-to-tenant programs, and community solar projects. Drawing lessons from Germany, the report formulates strategic planning recommendations for Halifax, including solar-friendly zoning regulations, solar access in public spaces, net metering expansion, solar easements, mandatory solar installations in new constructions, and potential updates to the Halifax Solar City program. The report aims to equip stakeholders with evidence-based insights for informed decision-making, advocating for the widespread adoption of solar power in Nova Scotia. Overall, the study serves as a comprehensive guide for policymakers, energy regulators, and the public, emphasizing the importance of transitioning towards cleaner and more sustainable energy practices.
METHODOLOGY
Literature Review
• A qualitative research method was carried out to develop a comprehensive understanding of the background and context related to electricity generation, consumption, greenhouse gas emission through various sectors at both provincial and HRM level. Further the research helped in analysing various climate mitigation efforts through renewable energy especially through solar power programs.
• Data gathered and analysed was through extensive readings of academic papers, reports and studies like HALIFACT and clean energy futures 2023.
Expert Interview
• In the pursuit of background knowledge, a conversation was initiated with industry professionals at Nova Scotia Power and climate mitigation experts at HRM and the provincial level. These interactions with relevant representatives from Nova Scotia Power aimed to uncover their perspectives on power generation, including challenges and ongoing initiatives. Engaged in conversations with professionals in the climate mitigation departments at HRM and the provincial level to gather insights into current strategies and future plans.
• This helped obtain first-hand information, expert opinions, and industry-specific insights to enhance the depth and relevance of the research project.
Data Analysis
• In the data analysis phase of the research, the primary objective was to integrate information derived from literature reviews and expert interviews into a cohesive framework for inclusion in the research report. Employing qualitative analysis techniques, the gathered data underwent a meticulous categorization and interpretation process.
• This involved identifying common themes, patterns, and key findings that emerged fromboththeextensivereadingsandinsightfulinterviewswithindustryandclimate experts. The qualitative approach allowed for a nuanced understanding of the subject matter, paving the way for a comprehensive synthesis of information that would contribute meaningfully to the subsequent stages of the research report.
BACKGROUND
ELECTRICITY PRODUCTION
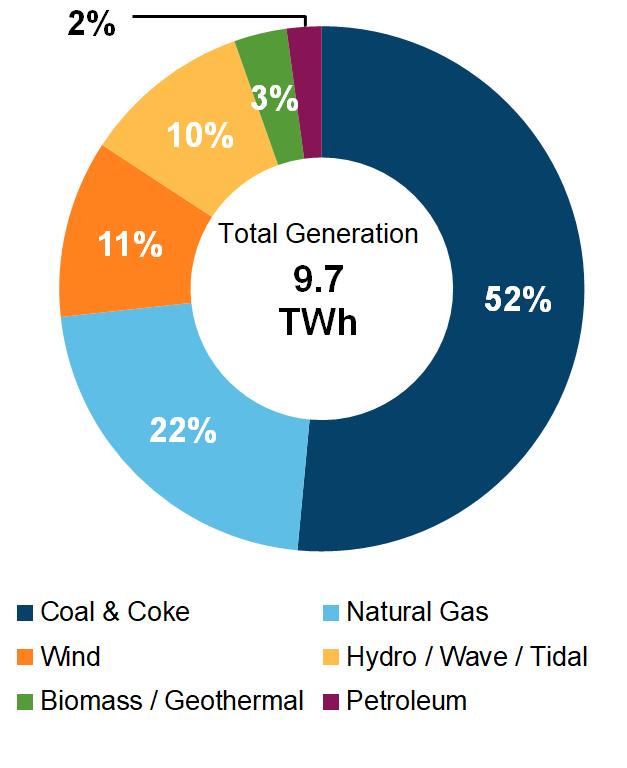
Figure 1 Power generation in Nova Scotia in 2019.
Source: https://www.cer-rec.gc.ca/en/dataanalysis/energy-markets/provincial-territorial-energyprofiles/provincial-territorial-energy-profiles-novascotia.
In the fiscal year 2019, Nova Scotia assumed a notable position within the Canadian electricity panorama, contributing 9.7 terawatt-hours (TWh), equating to 1.5% of the nation's aggregate generation (refer figure 1). The province maintained an assessed generating capacity of 3,061 megawatts (MW), predominantly relying on coal as the principal source, constituting 52% of Nova Scotia's total electricity output. Despite a predominant reliance on coal, Nova Scotia demonstrated a diversified energy portfolio, encompassing oil, natural gas, hydro, wind, and biomass for electricity generation (Government of Canada, 2023)
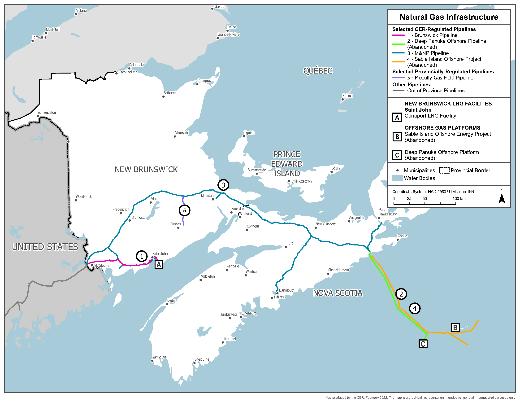
Nova Scotia's electricity infrastructure comprises an extensive network of approximately 32,000 kilometres of transmission and distribution lines. An instrumental addition to this grid is the Maritime Link Project, which commenced operations in January 2018 (refer figure 11 in appendix). This project serves as a vital link between Nova Scotia's electrical grid and the Muskrat Falls hydro facility located in Labrador. The initiative marked a significant milestone in August 2021 when Nova Scotia first received power from Muskrat Falls, and by midDecember 2021, electricity deliveries surged to levels ranging between 70% and 100% of the contracted amounts. The hydroelectric power transmitted through the Maritime Link Project is poised to supplant a portion of Nova Scotia's thermal generation. Notably, the project encompasses an extensive infrastructure, including over 300 kilometres of overland
transmission on Newfoundland, two 170-kilometer subsea cables traversing the Cabot Strait, and an additional 50 kilometres of overland transmission within Nova Scotia. This strategic project underscores Nova Scotia's commitment to enhancing its energy mix and sustainability through the integration of clean hydroelectric power into its grid (Government of Canada, 2023).
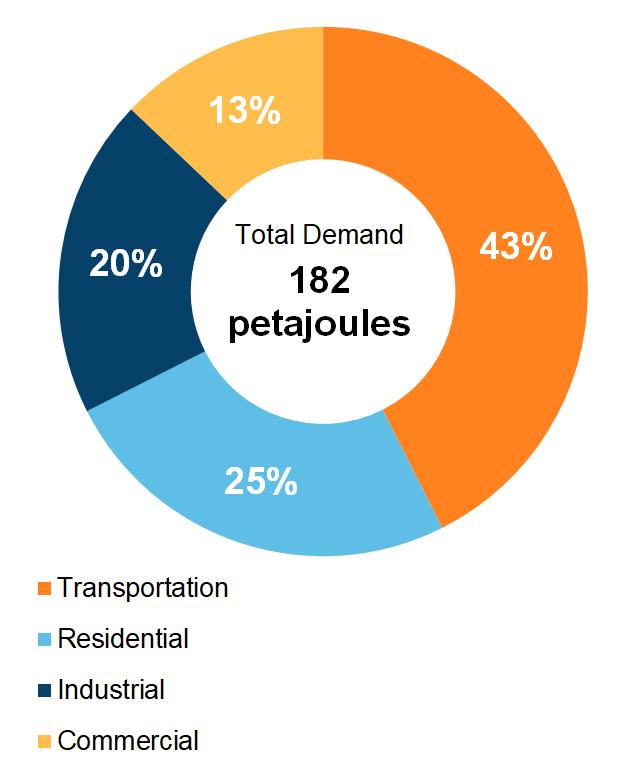
Figure 2 Nova Scotia power demand in 2019. Source: https://www.cer-rec.gc.ca/en/data-analysis/energymarkets/provincial-territorial-energyprofiles/provincial-territorial-energy-profiles-novascotia.
As shown in the figure 2, in 2019, Nova Scotia witnessed an end-use energy demand of 182 petajoules (PJ), with distinct patterns across various sectors. Notably, the transportation sector emerged as the primary consumer, constituting 43% of the total demand, followed by residential consumption at 25%, industrial needs at 20%, and commercial usage at 13%. Nova Scotia's aggregate energy demand, ranking as the tenth largest in Canada, and the eleventh largest per capita, underscores the province's significant role in the national energy landscape. Particularly alarming is Nova Scotia's power sector, which emitted 6.3 MT CO2e in 2020, contributing a staggering 11% to Canada's emissions from power generation. Despite purported commitments to cleaner energy, the province's progress meagre 24% reduction in the greenhouse gas intensity of its electricity grid. The intensity measured at 670 grams of CO2e per kilowatt-hour (g of CO2e/kWh) in 2020 remains unimpressivewhen compared to the already elevated880g of CO2e/kWhin 2005. The national average GHG intensity in 2020 was dramatically lower at 110 g of CO2e/kWh, emphasizing Nova Scotia's efforts to align with more stringent and environmentally conscientious standards (Government of Canada, 2023).
As represented through figure 3, in the year 2020, Nova Scotia's commitment to reducing greenhouse gas (GHG) emissions fell significantly short, with a total of 14.6 megatonnes (MT) of carbon dioxide equivalent (CO2e) still being emitted. This represented a mere 25% reduction since 1990 and an inadequate 36% decline since 2005. Despite these lackluster figures, the province tried to paint a positive picture by highlighting a per capita emissions rate of 14.9 tonnes CO2e, supposedly showcasing environmental stewardship. However, when viewed critically, this figure is only 16% below the Canadian average of 17.7 tonnes per capita. Examining the root causes, it becomes apparent that the largest emitting sectors in Nova Scotia,
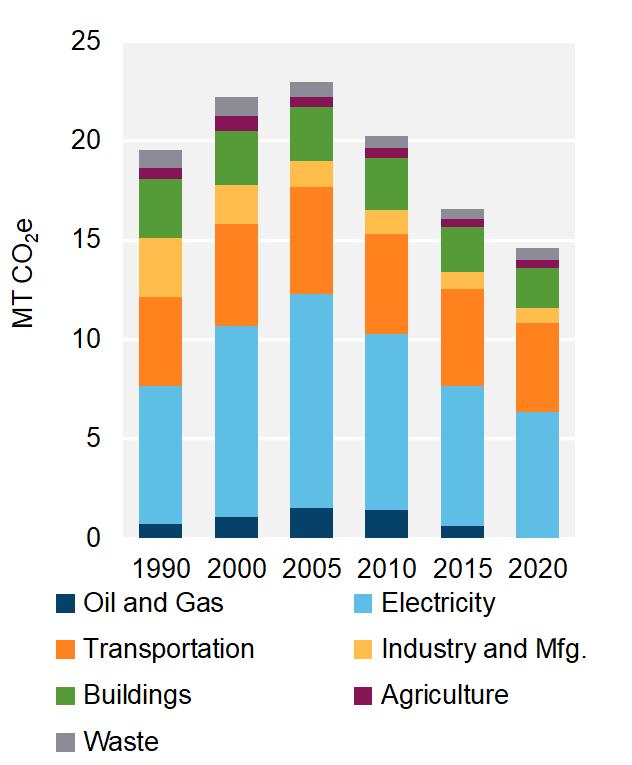
Figure 3 GHG emission by various sectors in Nova Scotia. Source: https://www.cer-rec.gc.ca/en/dataanalysis/energy-markets/provincial-territorial-energyprofiles/provincial-territorial-energy-profiles-novascotia.
including electricity generation (43%), transportation (30%), and buildings (residential and commercial) at 14%, continue to be major contributors to the environmental degradation (Government of Canada, 2023).
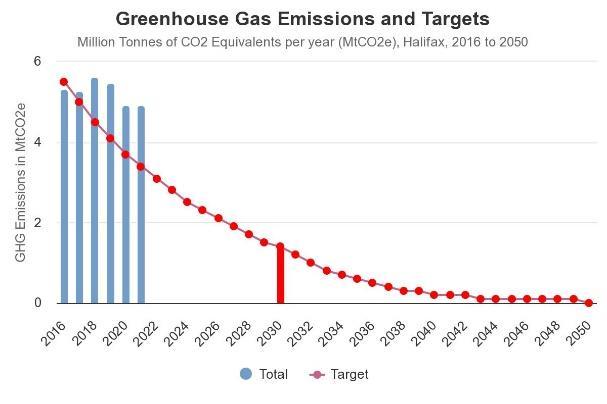
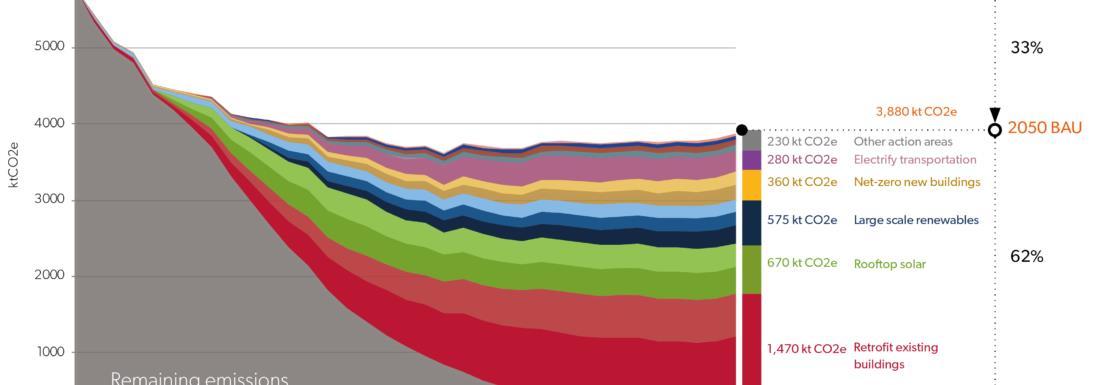
Figure 4 GHG
GREENHOUSE GAS EMISSION IN HALIFAX
In the year 2021, Halifax recorded greenhouse gas emissions totalling 4.92 million tonnes of CO2 equivalent (MtCO2e), reflecting a marginal decrease of 0.1% from the previous year and a more substantial 7.4% reduction compared to 2016 levels (refer figure 4). To achieve the ambitious goal of reaching 1.4 MtCO2e by 2030, an average annual decline of 13.0% is imperative, with a recognition that even swifter reductions will be necessary post-2030 to attain the 2050 objective of net-zero emissions (Halifax Index 2023 –Living, n.d.)
Halifax. Source: https://halifaxpartnership.com/research-strategy/halifaxindex/living/#environment
Source: https://halifaxpartnership.com/research-strategy/halifaxindex/living/#environment
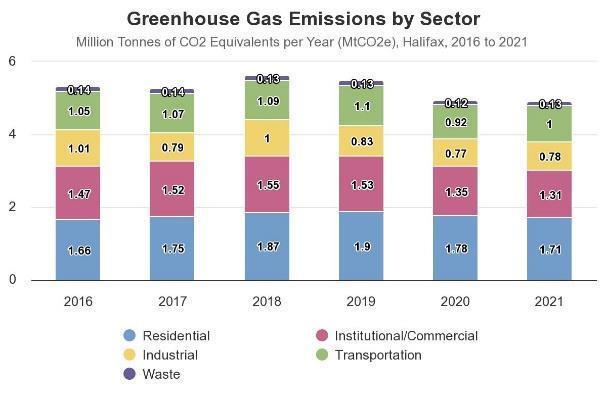
Noteworthy is the residential sector's continued status as the primary source of emissions, releasing 1.71 MtCO2e in 2021 (refer figure 5). Although residential emissions saw a 3.6% decline from 2020, they increased by 3.5% since 2016. The institutional/commercial sector, the second-largest emitter, accounted for 1.31 MtCO2e, exhibiting a 3.2% reduction from 2020 and a notable 10.9% decrease since 2016. Additional contributors included the transportation, industrial, and waste sectors, emitting 1.00, 0.78, and 0.13 MtCO2e, respectively. This comprehensive overview underscores the multifaceted nature of Halifax's emissions landscape, highlighting both achievements and challenges across key sectors, thus informing targeted strategies for future emission reduction initiatives (Halifax Index 2023 – Living, n.d.).
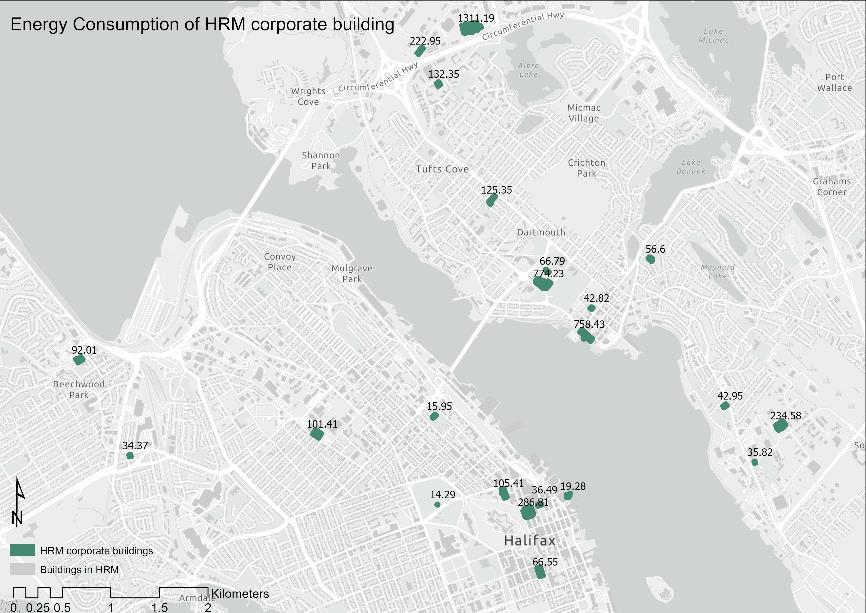
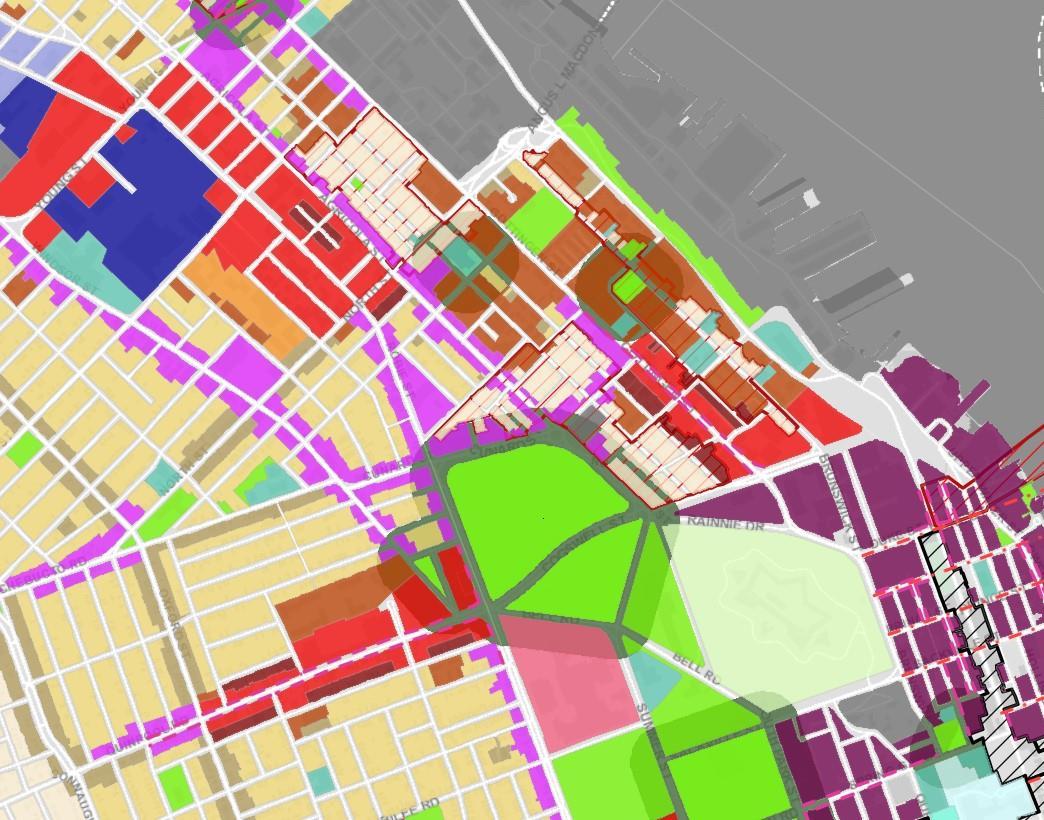
The GIS map in figure 6 comprises of HRM corporate building energy cost and use by fuel type, focusing on buildings populated in the Portfolio Manager online tool. Collected through billing data, it offers insights into the fuel composition and usage patterns in HRM corporate buildings, aiding third-party stakeholders in understanding the energy landscape. The associated map likely visually depicts the distribution of energy consumption and costs based on different fuel types, serving as a strategic tool for solar initiatives. Analysing the map allows stakeholders to identify trends, prioritize solar integration efforts, and strategically plan for a more sustainable and solar-powered future in HRM by addressing specific energy needs and challenges within its corporate infrastructure (HRM Building Energy Usage, n.d.)
INITIATIVES BY HALIFAX
On January 29, 2019, the Halifax Regional Council declared a climate emergency, initiating effortsto formulatean updatedclimateplan.Theresultant ambitiousplan,knownas HalifACT, gained unanimous approval from the Halifax Regional Council in June 2020. Comprising 46 targeted actions, HalifACT aims to guide the municipality toward achieving a net-zero emissions goal by 2050. The resulting Climate Action Plan, titled "HalifACT: Acting on Climate Together," serves as Halifax's pioneering strategy for both climate mitigation and adaptation. With a primary focus on enhancing resilience to current and future climate impacts, the plan sets ambitious targets, including a 75% reduction in community emissions by 2030 and a net-zero status by 2050 (refer figure 7). The unanimous approval underscores the commitment of Halifax in addressing climate change, and the journey of HalifACT serves as a
valuable roadmap for other municipalities seeking effective climate action plans (HalifACT, n.d.)
7 Pathway to reduce GHG emissions aligned with 1.5°C. Source: https://www.halifax.ca/about-halifax/energyenvironment/halifact-2050-acting-climate-together
HALIFAX SOLAR CITY PROGRAM
The ascent of renewable energy sources in Canada is a trend expected to endure, with the Halifax Solar City (HSC) program standing as a pioneering initiative in the country. This unique project, representing a community best practice in renewable energy, facilitates access to solar options for property owners. Administered by the Halifax Regional Municipality (HRM), the program alleviates the burden of substantial upfront installation costs for recipients. Eligibility extends to residential property owners, non-profits, places of worship, co-operatives, and charities, characterizing the program as a property assessed clean energy (PACE) initiative. Notably, the financing is tethered to the property rather than the individual, mirroring a conventional Local Improvement Charge (LIC). Participation remains entirely voluntary, and property ownership is retained by the property owner. Upon project completion, an agreement with HRM is established, and a voluntary LIC is affixed to the property postpayment to the solar contractor by HRM. LIC financing, executed at a fixed interest rate of 4.75% over a decade, is repaid autonomously from the annual property tax bill. Property owners retain the flexibility to settle the amount in full at any time without incurring penalties. This innovative program not only facilitates the financing of upgrades but also enables participants to offset the costs through savings on heating, cooling, and electricity expenditure (About Solar City, n.d.)
The Halifax Solar City (HSC) program was introduced with solar thermal technology, harnessing the sun's heat to warm water. This system incorporates a solar collector mounted on the home's roof, a pump for heat circulation and fluid transfer, and a heat exchanger to convey the heat to storage tank(s), preserving heated water for periods lacking sunlight. While citizens have the choice to adopt technologies without HSC financing, an overwhelming 83% of the installed solar capacity in Halifax within the first year stemmed from HSC, following a 4-year provincial rebate program initiated by Efficiency Nova Scotia, Solar Homes, in late 2018. HSC guides participants to the province's approved installer company listing, with the number of contractorsincreasingfromfivein2016totwenty-fourtoday.Theprogram's pilotphase(20132015), funded with $3.3 million approved in 2010, facilitated 388 homeowner solar water heating system installations over two years. Expressing interest, 3,000 citizens attended events,
and over 2,000 assessments were conducted to ensure suitability. These assessments revealed a return on investment of approximately 5% over 25 years, with interest over a decade yielding a 3.4% return. Costs were covered by participants, with the potential to save over $5.5 million over 25 years and curtail greenhouse gas emissions by 16.1 kg of CO2e (Szoller, 2021) .
Moreover, during their solar assessment visits, more than 2,365 homes underwent complimentary implementation of water conservation measures. These initiatives resulted in substantial savings, conserving 320 million litres of water over two decades and an annual cost reduction of $120,000 in water and heating expenses. The option of monitoring was presented and embraced by half of the systems subsidized by HSC, incurring a cost of $200 to property owners (a $1,200-$1,000 difference). In 2015, the Halifax Regional Municipality (HRM) expanded the program, introducing three solar system options: solar hot water, solar photovoltaic (PV), and solar hot air. PV solar panels, attached to rooftops through racking equipment or directly on the ground with a ground mount, generate direct current power. This power is then converted to alternating current power through an inverter, commonly used in households. The third option utilizes fans to intake, circulate, and exhaust air. The program aimed for an annual installation of 450 systems across various technologies, striving for cost neutrality. This approach was anticipated to result in an annual reduction of 840,000 kg of CO2e, accumulating to over 63 million kg of CO2e reductions over the systems' projected 25year lifespan within the anticipated three-year period (Szoller, 2021)
Between 2016 and 2019, a total of 1,420 agreements were entered into, amounting to $10.3 million in Halifax Solar City (HSC) financing. These agreements are anticipated to yield an annual utility cost saving of $700,000 and a reduction of 3,000 tonnes of greenhouse gas emissions. Specifically, 38 solar hot water systems, with a total cost of $337,231, saved 96,264 ekWhof energyand reducedemissions by59.6tonnes ofCO2e. Inthe case of381photovoltaic (PV) systems, costing $9,956,800, they saved 4,183 MWh of energy and reduced emissions by 2,992 tonnes of CO2e. Despite higher initial costs for consumers, transitioning to solar is a financially prudent decision over the long term. On average, HSC solar PV systems, priced at $20,000, are expected to yield savings of $57,000 over 25 years. Solar hot air systems, averaging $4,000, are projected to save $6,000 over 15 years, while solar hot water systems, with an average cost of $9,000, are estimated to generate savings of $20,000 over 25 years (Szoller, 2021).
While the Halifax Solar City (HSC) program has undeniably made strides in advancing solar energy adoption and reducing greenhouse gas emissions, certain challenges warrant attention for the program's refinement and sustained success. Financial accessibility remains a concern, as the program's innovative property-based financing model, while beneficial, might present a barrier due to the substantial upfront costs associated with solar installations. Statistical analysis indicates that the average cost of HSC solar PV systems, priced at $20,000, may pose financial constraints for potential participants, limiting inclusivity. Moreover, the program's dependency on external incentives, such as the 4-year provincial rebate program, raises questions about its long-term sustainability. While this external support has significantly contributed to theprogram's success, amorecomprehensivestatistical analysis could shedlight
on the program's ability to thrive independently and weather potential changes in external funding (Szoller, 2021)
COMMUNITY SOLAR GARDEN
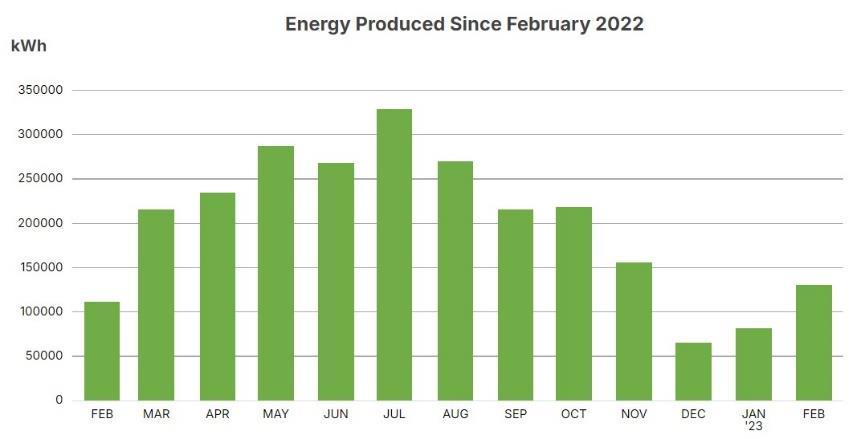
8 Energy produced through community solar garden program in 1 year. Source: https://www.nspower.ca/cleanandgreen/innovation/smartgrid-nova-scotia/community-solar-garden-performance
Solar garden initiative is designed to produce clean energy daily, contributing to the grid's overall sustainability. Participants in the program have the flexibility to decide the percentage of their personal electricity consumption they wish to source from the solar garden. Typically, 7-10 kW is sufficient to cover the entire electricity needs of an average home. Participants pay a fixed monthly subscription charge for their chosen solar capacity, starting at $6.86 per subscribed kW. From the outset, subscribers begin accumulating credits on their bills corresponding to the solar energy generated from their subscription. For instance, if you subscribe to 10 kW, your monthly subscription charge would be $68.60. The value of thesolarcredits, initially set at 5.493cents perkilowatt-hour(kWh)in 2021, increases annually by 2%. As time progresses, these solar credits surpass the subscription charge, resulting in monthly savings for participants. The total solar credit generated varies with the amount of sunny weather, leading to higher credits during the summer months when days are longer compared to the winter months (Community Solar Garden Application, n.d.)
Long-term subscribers can anticipate achieving net savings by the sixth year and cumulative savings by the ninth year. The Solar Energy Credit is contingent on the amount of solar energy generated, leading to monthly variations. Utilize our community solar calculator for a comprehensive understanding of the potential benefits of the program (Community Solar Garden Application, n.d.)
BEST CASE PRACTICE - GERMANY
WEATHER
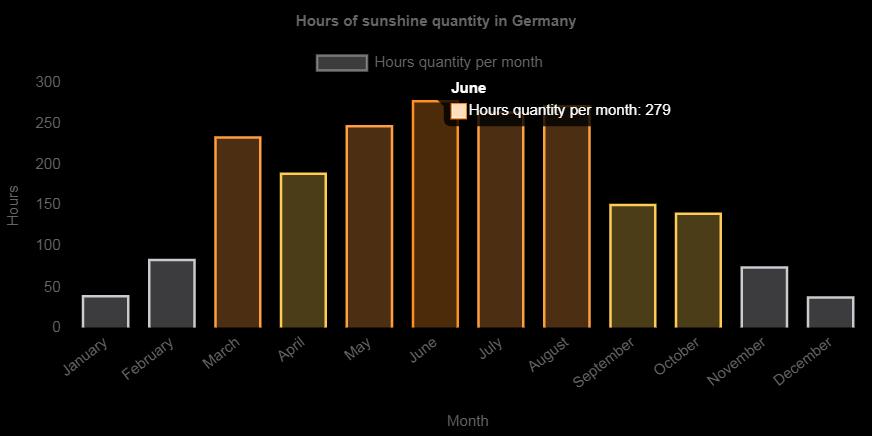
Germany and Halifax, despite being in different geographic locations, share interesting climate characteristics and variations. Germany, situated in the temperate, rainy climate zone of the mid-latitudes, experiences an annual mean temperature of 8.2°C between Sylt (northern Germany) and the Zugspitze (highest peak) from 1961 to 1990. The country sees an average of 1,544 hours of sunshine per year, with prevailing westerly winds bringing moist air masses from the Atlantic, resulting in up to 789 l/m2 of annual precipitation (refer figure 12 in appendix). The maritime influence keeps winters mild and moderates summer temperatures (The Number of Sunny Days in Germany by Federated State, by Year and Month, 2023). On the other hand, Halifax, located on the shores of the Atlantic Ocean, features an easternmaritime climate. Despite its northern location, Halifax experiences less severe weather than anticipated, with higher winter temperatures and lower summer temperatures compared to
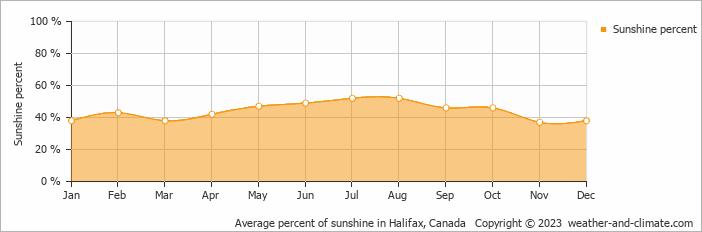
inland towns. The climate is characterized by changeable weather throughout the year. Halifax enjoys 290 sunny days annually, accounting for 1962 hours of sun, representing 43% of the days throughout the year (refer figure 13 in appendix). July stands out as the sunniest month with an average of 235 hours of sunshine. While Germany and Halifax differ in their geographic and climatic specifics, they both share the influence of maritime conditions, which plays a crucial role in moderating temperature extremes (Climate and Average Monthly Weather in Halifax (Nova Scotia), Canada, n.d.). Germany's annual mean temperature and sunshine hours align with Halifax's milder winters and cooler summers, showcasing the impact of proximity to large bodies of water in shaping climate patterns. The comparison underscores the importance of local geographical features in influencing climate characteristics.
INITIATIVE BY GERMANY
Despite having relatively low sunshine hours, Germany stands as one of the world's leading solar power producers. In 2021, the country held the fourth position globally, with an installed solar capacity nearing 60 gigawatts (GW), according to the International Renewable Energy Agency(IRENA),following several yearsofbeing afrontrunnerin this sector.Germany's solar energy initiative, commonly known as the "Energiewende" (Energy Transition), is globally recognized as one of the most ambitious and successful renewable energy programs. This initiative aims to shift the country's energy system away from fossil fuels and nuclear power toward a more sustainable and environmentally-friendly blend of renewable energy sources. Germany has taken bold initiatives to champion solar power, notably through the introduction of feed-in tariffs (FITs) in 2000. These tariffs offer fixed, above-market rates for solar electricity, incentivizing widespread solar adoption by ensuring favourable returns for producers. Additionally, the country has embraced community solar projects, encouraging collective citizen investment in solar installations, fostering a decentralized and participatory energy model. Germany's commitment to advancing solar technology is evident in substantial investments in research and development, aimed at enhancing the efficiency and costeffectiveness of solar panels (Solar Power in Germany – Output, Business & Perspectives, 2018).
FEED – IN – TARIFF
The inception of Germany's Feed-in Tariff (EEG) in 2000 marked a pivotal moment in the country's commitmentto renewable energy. Atthat time,renewable sources contributeda mere 6.2% to the electricity production, a figure that surged to 23.7% by 2012 and approximately 28% in 2014. Projections suggest that with this trajectory, Germany could achieve 100% renewable electricity by 2030. Key to this growth is the EEG's provisions, granting renewable energy priority access to the power grid. Energy producers receive a fixed price for each kilowatt-hour generated over a fixed 20-year period, ensuring a viable return on investment. To distribute the additional costs, the EEG surcharge was introduced, with end consumers contributingasetamountforeachkWhconsumed.Thissurcharge,whichstoodataround1.50€ per month for a 2-person household in 2004, increased to 3.10€ in 2009 and around 13€ in 2013. The EEG operates on an equity principle, enabling broad societal participation in the energytransformation.Eventhosewithout propertyownershiporthe means to invest in private
renewable installations can engage by purchasing shares in energy cooperatives. This inclusive approach has not only fosteredsustainableenergy practices but also ledto asubstantial increase in jobs within the renewable energy sector, growing from 40,000 in 1998 to about 400,000 in 2014 (wfcadmin, 2015).
LANDLORD TO TENANT
Residential electricity generation through rooftop solar installations extends its supply to tenants, neighbouring residential units, and ancillary facilities. Any excess electricity is seamlessly integratedinto thepublicgrid.Tenants derivefinancialadvantages by being exempt from a spectrum of charges traditionally associated with grid-based electricity procurement, encompassing feed-in tariffs, grid surcharges, electricity tax, and concession fees. Concurrently, landlords receive financial remuneration for each kilowatt-hour of electricity providedtotenants.Projectionssuggestthecapacitytopowerapproximately3.8millionhomes in Germany through rooftop installations. The remuneration for landlords is contingent upon variables such as the scale of the solar installation and the national photovoltaic expansion rate, fluctuating within the range of 2.2c/kWh to 3.8c/kWh. Notably, tenants retain the autonomy to select their electricity provider, ensuring competitive and advantageous pricing for the electricity vended by landlords. The operational framework encompasses vital considerations including the contractual duration governing electricity supply, the delineation of this contract from the rental agreement, and the imposition of a price ceiling on the electricity landlords may levy on tenants. This strategic initiative is designed to foster the widespread integration of solar energy within residential domains while upholding the principles of tenant autonomy and economic viability (Action, n.d.).
TODAY AND TOMORROW OF GERMANY
Germany has made significant strides in its renewable energy landscape, with solar power emerging as a substantial contributor to the national energy mix. Notably, between March and August 2021, solar panels surpassed the collective output of hard coal-fired plants, reaching a historic monthly high of 7.99 terawatt hours in June, constituting 20.6 percent of net electricity generation. The year 2020 witnessed solar power achieving record weekly and daily shares of 23 percent and almost 28 percent, respectively. These achievements underscore the efficacy of solar technology, especially during peak sun intensity around noon, when itcan contribute over 40percenttothecountry'spowerproduction.In2021,solarpowerarrayscollectivelygenerated approximately51terawatthoursofelectricity.Lookingforward,Germany aimstosignificantly reduce its CO2 emissions in the energy sector by 2030, with a target of 175 million tons, representing a 63 percent drop from 1990 levels. The Federal Government is committed to supporting the expansion of renewable energy sources and enhancing energy efficiency to achieve this goal. As part of this strategy, there is a concerted effort to increase the installed capacity of photovoltaic technology to 100 gigawatts by 2030, signifying a pivotal role for solar energy in shaping a sustainable and climate-friendly energy landscape. Importantly, the removal of the 52-gigawatt expansion cap underscores the government's commitment to fostering unlimited growth in solar installations (Solar Power in Germany – Output, Business & Perspectives, 2018).
RECOMMENDATION PLANNING INERVENTIONS
In the pursuit of sustainable and renewable energy solutions, integrating solar power into urban landscapes has emerged as a pivotal strategy for reducing reliance on conventional energy sources and mitigating environmental impact. This proposal seeks to explore and recommend planning interventions that encourage widespread adoption of solar power, leveraging insights gained from a comprehensive study of current electricity production methods, emission patterns, and a best-practice case study in Germany.
SOLAR FRIENDLY ZONING REGULATION
To implement solar friendly zoning regulation first policy makers, need to access the solar potential of different areas in Halifax. Identify regions with high solar exposure and potential for solar energy generation. The given map (refer figure 9) serves as a crucial tool for assessing solaropportunitieswithintheregion.Thismapwas meticulouslycreatedbyleveraging adigital elevation model based on LiDAR data from 2005, coupled with aerial photographs from 2006 and 2009. The methodology incorporates a shadow-obstruction technique using ESRI Hill shade and factors in solar radiation incidence and shading on the horizontal plane at pixelated roof elevation points Essentially, the map illustrates the relative solar accessibility on rooftop surfaces throughout HRM. It takes into account the solar position calculated at 5-minute intervals, tracking from dawn to dusk during equinoxes and solstices over four days. The averaged results provide a comprehensive overview of solar exposure on rooftops (Solar Map, n.d.).

Source: https://www.arcgis.com/apps/webappviewer/index.html?id=8c1749bb427f4bcca26e3b4318d9201c
To implement solar friendly zoning regulation, one needs to collaborate with urban planners, architects, and energy experts to review existing zoning codes. Identify barriers to solar installations, such as height restrictions or shading allowances, and revise them to be more solar-friendly. Develop and integrate solar access guidelines into the zoning code. These guidelines should specify the requirements for new developments to ensure adequate sunlight
exposure for current and future solar installations. These guidelines should take into account the initiatives like Feed in tariff and community solar gardens.
• Every existing structure within the solar-friendly zone must transition to 100% solar energy, while new constructions in these zones must adhere to solar-friendly regulations.
• Residents should have the flexibility to choose their electricity source, opting between self-generated power from solar panels and subscribing to solar community gardens.
• Community Solar Gardens with more benefits: Individuals using solar community garden subscriptions may benefit from reduced subscription charges based on energy consumption and increased solar credits, effectively shortening the return-oninvestment period.
• High-density buildings with limited rooftop space for solar panels should be incentivized to utilize electricity from nearby solar community gardens.
• Introducing Feed – in – Tariff: Initiatives for rooftop solar panels in single-unit dwellings should be supported by a feed-in tariff system. Implementing a feed-in tariff system ensures a fixed payment for each kilowatt-hour of energy produced, contributing to a shorter return-on-investment period.
• Providing subsidies on property tax and insurance benefits can motivate homeowners to generate electricity through solar panels.
• Exploring additional financing options, such as low-interest loans or government grants, could alleviate the upfront costs for participants, fostering wider adoption.
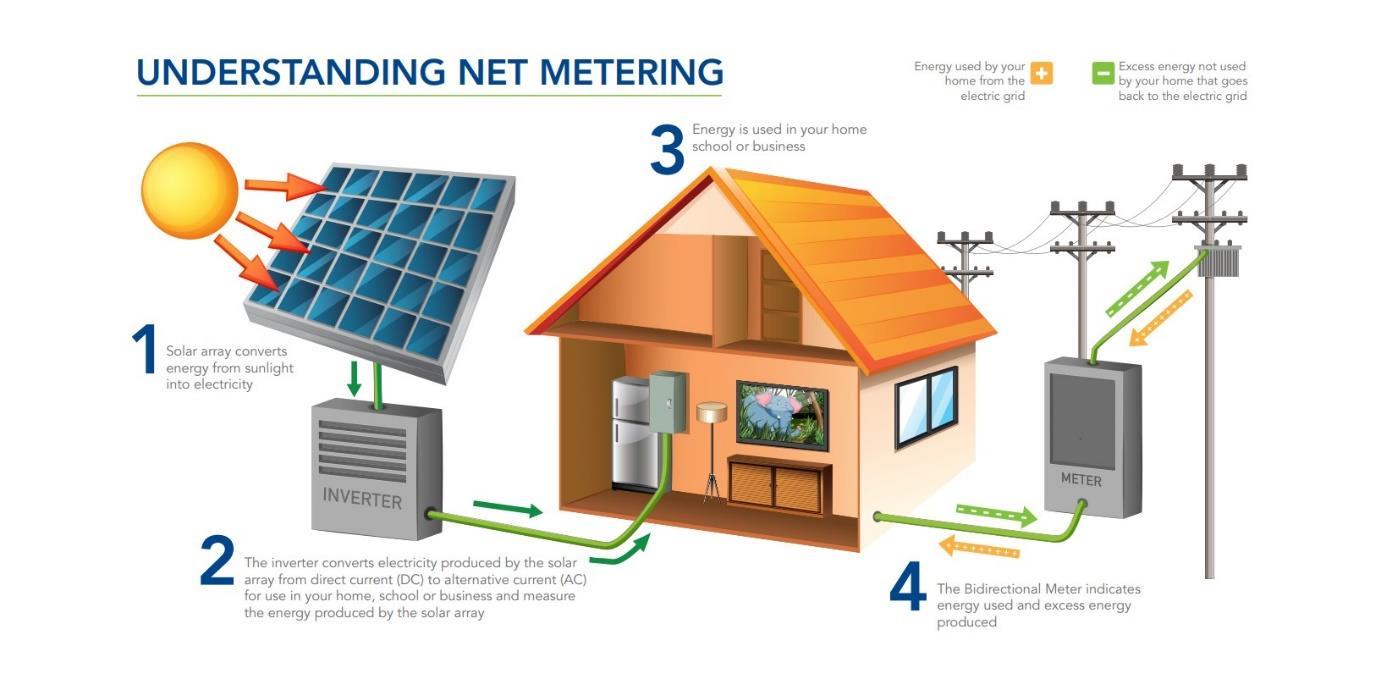
• Net metering: within the solar friendly zones, net metering policies should be expanded toallowmoreflexibleenergyexchangebetweensolarsystemownersandthegrid (refer figure 14 in appendix). This can include higher capacity limits, time-of-use net metering, and fair compensation for excess energy fed back to the grid.
• All the public infrastructure within the solar friendly zone like parks, parking lots and other public building must be solar powered.
• Solar Easements and Rights: Establishing clear solar easement laws and rights within solar friendly zone, ensuring that property owners have the legal right to access sunlight for solar energy generation.
• Introducing Landlord to Tenant Program: With the increase in the number of renters in Halifax, Landlord to Tenant program will play a huge role to boost solar power. The program is structured to exempt tenants from various charges associated with grid electricity, such as feed-in tariffs, grid surcharges, electricity tax, and concession fees, making solar energy an economically viable and attractive option for both parties. Landlords, on the other hand, receive funding for every kilowatt-hour of electricity supplied to their tenants, creating a mutually beneficial arrangement.