Challenges and developments in product design in the context of ESG
RAW MATERIALS, SEMI-FINISHED PRODUCTS AND COMPONENTS
Quality and functional requirements
Sustainable certification and verification of environmental declarations
Reduction of harmful substances - PFAS
Challenges and constraints
HEADQUARTERS AND MANAGEMENT
Change management and organisational development
Projects supporting sustainable development
People and organisational culture
Flood risk management - September 2024
Moving 2025
PRODUCTION
Contract manufacturing
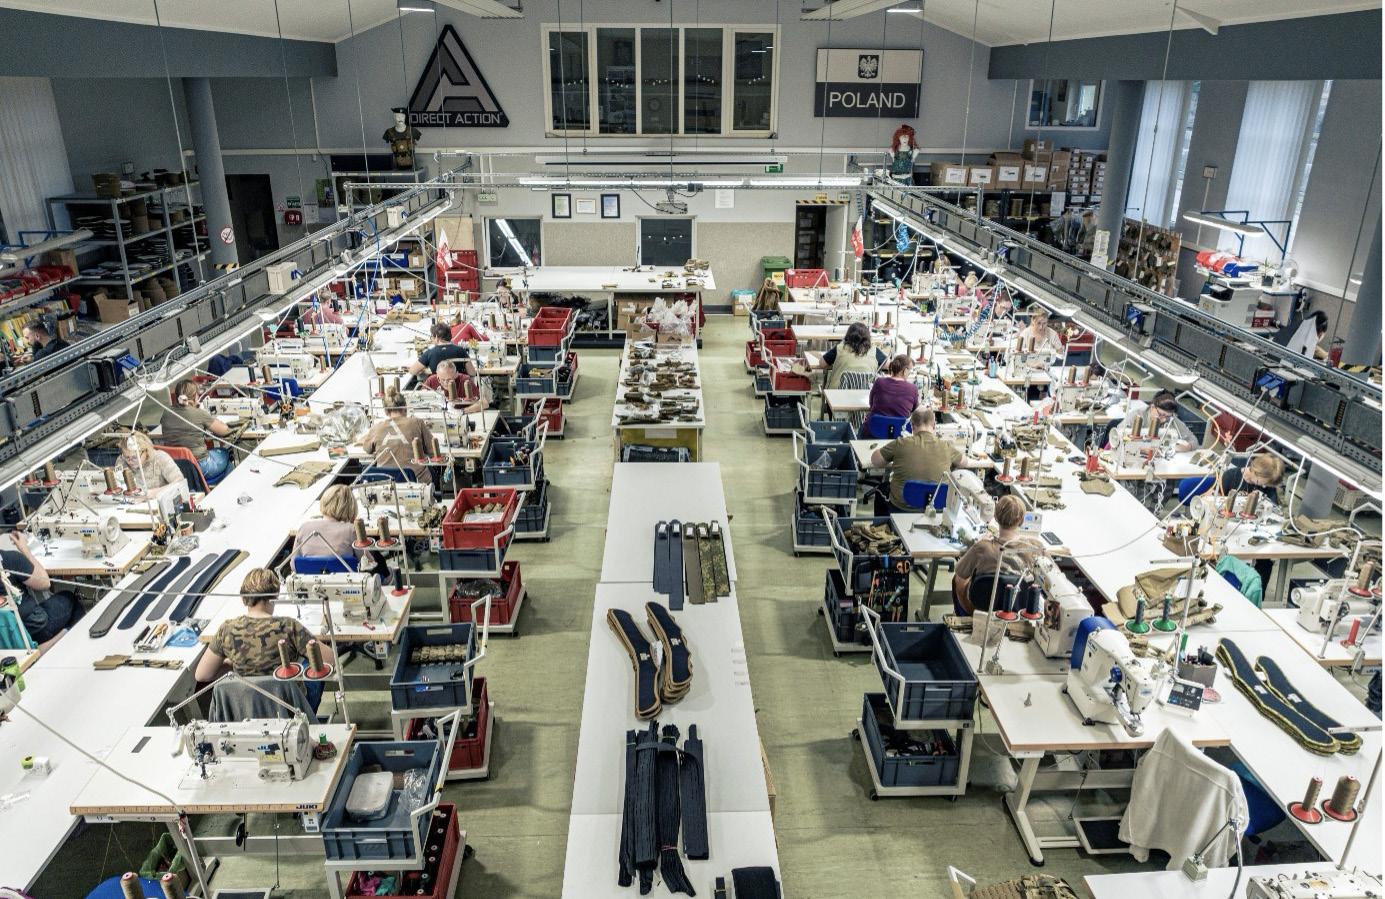
In-house production
LOGISTICS AND DISTRIBUTION
Transport UPSTREAM
Storage
Internal transport
DOWNSTREAM transport
Distributors and sales channels
PRODUCT USE AND UTILISATION
Quality Control and Complaints
Letter from the Management Board - ESG vision and commitments
This sustainability report has been produced despite there being no formal obligation to produce one. Our motivation was not only to learn about the structure and requirements of reporting in practice, but above all to gain real knowledge and understand the meaning behind the activities that the report covers. 2024 has been a time of intense searching and learning for our team - between clear signals from the market and regulators and the knowledge that the world around us is full of uncertainty, changing regulations and no readymade solutions that can be implemented “on the spot”.
We address the report to our stakeholders, partners and anyone looking for practical examples of ESG activities in the textile sector.
This report has been written in the spirit of lessons learned - for organisations that are at a similar stage and looking for inspiration or a reference point. Each process is a record of our journey - successes, trials, errors and course corrections. Example? Packaging - a topic where not everything went according to plan, but which taught us more than we expected.
The textile sector, in which we operate, has been under the microscope for years. It is a resource-intensive industry with a tremendous carbon and water footprint. At the same time, textile recycling remains in its infancy and the infrastructure for separate waste collection is not keeping up with the pace of production. This is the context in which we work - knowing the limitations but determined to act despite them.
We wanted the report to reflect our organisation: honest, concrete, in a process of constant change. Although we do not yet report strictly according to ESRS (European Sustainability Reporting Standards), our priority is to translate the sustainability values we hold as a team into real-world decisions - from design to production to supplier relations.
The structure of the report is based on the successive links in the value chain - from the production of the components, to the use and disposal of the final product. It is not a catalogue of readymade solutions, but a record of the process - where we are and the direction we are heading. Because although not everything is working perfectly yet, the most important thing has already happened: we have started.
Jędrzej Mieszczak President of the Management Board
Report overview
CONTEXT AND PURPOSE
The textile industry in which we operate faces a number of challenges - from a dispersed supply chain, to high resource consumption, to the difficulty of tracking what happens to a product after its use. This is why transparency and environmental responsibility are growing in importance - both in the eyes of customers and business partners.
This report is an attempt to show the impact of our activities - both environmental and social. We have structured it according to the product life cycle: from raw materials, production and logistics to use and end of life of the product. This makes it easier to see where in the value chain the greatest impact is created and where we can act more effectively. It is also a development document - we show not only the data, but also where we are still learning, building systems and developing competences..
REPORT PREPARATION - THE PROCESS OF DEVELOPMENT
We started the process of preparing this report immediately after the publication of the 2023 report. We decided to develop the content ourselves, without the involvement of external consultants. The aim of this approach was to gain an in-depth understanding of the entire process, to assess its labour intensity and to tailor the report to the specifics of our organisation, EntireM. Taking into account the possible regulatory changes resulting from the so-called ‘Omnibus Directive’, we focused on issues relevant to our stakeholders.
The process adopted consisted of the following stages:
• CALCULATING THE CARBON FOOTPRINT
We first identified the scope of the data and the organisational units responsible for collecting it. In 2024, we continued to work with the Plan Be Eco tool, which converted the data collected into CO2 equivalents. We paid particular attention to verifying the correctness of the input data - unit errors (e.g. kilograms instead of tonnes) can significantly bias the results. Although we have not yet implemented a full decarbonisation plan based, for example, on SBTi, we plan to develop an internal decarbonisation strategy after the publication of this report, including the relationship between utility consumption and the number of employees and the identification of areas with potential for emission reductions.
• ESTABLISHING A METHODOLOGY FOR MATERIALITY ANALYSIS
We then moved on to design a materiality analysis methodology tailored to our organisation’s capabilities. The ESG team conducted an internal competency diagnosis, identifying both strengths - such as experience in data analysis and knowledge of reporting principles - and areas for support, including ESG risk analysis and stakeholder engagement. This has allowed us to develop a realistic action plan, bringing us closer to the requirements of the ESRS standards.
• UPDATING THE STAKEHOLDER MAP
Based on the 2023 report, we have updated the stakeholder map, taking into account structural changes in the organisation. We assigned stakeholders weights according to two criteria: their impact on the company and their level of interest in the company’s activities. Grouping stakeholders into four categories - from strategic to external environment - facilitated the identification of communication and management priorities.
• CONSULTATION AND STAKEHOLDER INVOLVEMENT
We performed extensive consultations, using a variety of forms of contact - from questionnaires to one-to-one interviews - tailored to the specific characteristics of each group: suppliers, distributors, employees and management. The information thus obtained created a multidimensional picture of expectations and perceptions of the company, which formed the basis for further analyses.
• PRELIMINARY IDENTIFICATION OF IMPACTS, RISKS AND OPPORTUNITIES
Based on the results of the consultation and expert knowledge, we have drawn up a first list of potential impacts, risks and opportunities related to aspects of sustainability.
• ANALYSIS OF ESG RISKS
In response to the requirements of the ESRS standard, we have started to implement a process to identify and assess ESG risks, taking into account their scale, likelihood and persistence of impact. The analysis was carried out in part - resource constraints and lack of sufficient experience prevented it from being fully implemented.
Nonetheless, these activities have identified key competency and organisational gaps, which we plan to fill through the establishment of an interdisciplinary team and the integration of ESG risk analysis into existing management processes.
We view this stage as the foundation for building internal competence. Our aim is to progressively implement ESG risk analysis practices in a way that adds real value to the organisation. Until an appropriate level of maturity - both process and competence - is reached, we consciously forego full implementation, focusing instead on building a solid foundation.
• CONCEPT AND STRUCTURE OF THE REPORT
We organised a brainstorming session, which resulted in a coherent narrative that took into account the specifics of the industry and the company’s value chain. We designed the report with diverse stakeholders representing all links in the value chain in mind.
• INTERNAL DATA COLLECTION
We collected data on employment, salary levels, training activities and sustainability initiatives. The data came from key departments and made it possible to refine the themes of relevance and link them to ongoing and planned activities.
• EDITORIAL AND GRAPHIC WORK
For the first time, we developed and edited the content of the report ourselves. The graphic design, as in previous years, was handled by our in-house creative team.
Business environment and value chain
As part of our analysis of Entire M’s environment, we identified four layers of influence:
• Strategic stakeholders - including customers, management, employees, suppliers of raw materials and own brands;
• Formal stakeholders - national and EU regulators, financial institutions, service providers, consultants, future customers;
• Observers - media, NGOs, local community, competitors;
Each group was assigned a role, weighting and potential impact was assessed to create a map of relationships and priorities. An evaluation methodology based on scoring and expert commentary allowed for systematic management of stakeholder relations in line with due diligence.
EMPLOYEE PERSPECTIVE: Strong OHS, Rising Expectations and Ethical Challenges
Our employees are positive about our commitment to the ESG area. We rated health and safety aspects highly, with as many as 95% of employees declaring knowledge of OHS rules, and the average rating for occupational safety reached 4.66/5.
We also identified areas for improvement:
• Perceptions of the environmental impact of products - the lowest rated statements were those regarding the environmental performance of our products and the efficiency of the use of materials, especially by office workers (average: 3.5/5). This suggests a high awareness of the environmental impact of textile products.
• Ethics and equal opportunities - we noted significant perceptual differences between office and production workers, particularly in terms of the equal treatment of men and women. The drop in ratings in 2024 indicates the need to deepen our diversity policies and strengthen our ethical culture.
THE
SUPPLIERS’ PERSPECTIVE: High Awareness, Uneven Level of Implementation
Of the six suppliers surveyed:
• Five are familiar with the term ESG, indicating a growing awareness of the issue.
• Only one is measuring its carbon footprint, although three are planning to implement such measures in the next three years.
• Four monitor energy and water consumption, but only three have implemented a closed water cycle.
• All use LED lighting, four use RES and three have energy-efficient equipment.
Conclusions of the materiality analysis - summary of surveys
In 2024, we conducted a survey and qualitative research among our key stakeholder groups - employees, suppliers and distributors - obtaining a comprehensive picture of their expectations and perceptions of the organisation’s sustainability efforts.
The findings of the survey indicate that, despite the declared awareness, many of our partners need additional support in implementing advanced environmental and social practices. Differences in the level of implementation may be due, among other things, to limited knowledge of European regulations and reporting standards, which are only just beginning to affect nonEU suppliers.
THE DISTRIBUTORS’ PERSPECTIVE: Different Priorities for Domestic and Foreign Markets
The survey covered distributors in Poland and abroad. Common priorities are:
• Development of more sustainable products (100% of indications),
• Waste reduction,
• The value of communication based on trust.
However, the differences indicate a different approach:
• Foreign distributors (67.6%) expect Entire M’s suppliers to actively monitor compliance with the law, in contrast to Polish partners (40% recognise that the company should not do so).
• Perception of CO2 emissions - Polish distributors perceive CO2 emissions to be the least important, which may be due to a lack of confidence in the importance and concept of the carbon footprint.
• Technical support - foreign partners prefer repairs and availability of parts, while Polish B2B customers rely on product exchange - less environmentally beneficial.
Conclusions and actions
The results of the stakeholder survey served as a key input to assess the relevance of ESG topics.
The company plans to strengthen communication programmes, develop ethical and diversity policies. We are asking ourselves to what extent we can support our suppliers up the value chain in meeting ESG targets. This will be discussed in the following months of work, in the implementation of the digital passport or the preparatory work for the requirements of the EUDR Regulation.
External conditions
CLIMATE CHANGE AND ENVIRONMENTAL IMPACTS
September 2024 was the second warmest September on record for instrumental measurements worldwide. Poland has experienced record-breaking temperatures and a number of extreme phenomena, such as heavy rainfall and flooding. According to data from the IMGW-PIB (Institute of Meteorology and Water Management - National Research Institute), precipitation in the Lower Silesian, Opole and Silesian Voivodeships exceeded 200% of the multi-year average, reaching over 450% of normal at the synoptic station in Jelenia Góra.
For Entire M, the effects of these events were experienced directly - three of our four locations are in Lower Silesia and the fourth in the Opole region. Each is in a potential flood risk zone due to their location near rivers.
This experience highlighted the increasing climate risks associated with extreme weather and confirmed the need to include adaptation scenarios in infrastructure planning. For more information on the impact of the incident, our actions and adaptation plans, please see Flood Risk Management - September 2024.
REGULATORY AND GEOPOLITICAL PRESSURES
From our perspective, 2024 was one of the most challenging in terms of legislative changes in the area of sustainability.
The simultaneous implementation of several key EU regulations has created significant operational tensionsboth in terms of reporting and alignment of products and processes across the value chain.
Among the most important pieces of legislation were:
CSRD – Corporate Sustainability Reporting Directive, which significantly expands the scope and detail of ESG data disclosed;
ESRS – European Sustainability Reporting Standards, which sets out detailed requirements for the content and form of reports;
EUDR – EU Deforestation Regulation, which imposes obligations on traceability and supply chain compliance with environmental criteria;
ESPR – Ecodesign for Sustainable Products Regulation, which introduces new requirements for the design, durability and repairability of products;
GPSR – General ProductSafety Regulation, which updates the rules on manufacturers’ responsibility for the safety of products placed on the market.
These requirements place obligations on companies not only in terms of reporting, but also in the areas of product design, supply chain risk management and compliance with new environmental and social standards.
For an organisation of our scale and structure, it has been particularly challenging to keep up with the pace of change - with limited staff resources, a lack of clear interpretations and frequent updates to guidelines.
The ESG team has had to operate in an environment of high uncertainty, while learning new standards and coordinating cross-departmental activities.
An additional risk factor is the changing geopolitical environment and political narratives that may undermine the long-term sustainability of the ESG agenda. Concerns about deregulation or market fragmentation make us plan our activities carefully, focusing on flexibility and process resilience - not just meeting temporary formal requirements.
CHARACTERISTICS OF THE TEXTILE INDUSTRY
The textile industry today is under increasing regulatory and social pressure due to its high resource intensity, complex supply chains and significant environmental and climate impacts. The EU Sustainable Textiles Strategy (2022), combined with a series of regulations and directives, implies a profound transformation of the sector - from product design, to information obligations (e.g. digital product passport), to producer responsibility at the end of the product life cycle.
Although this transformation is intended to lead to a circular economy, in practice - from the perspective of a company formally categorised as a large enterprise but operating with resources typical of SMEsthe challenges are enormous. There is a shortage of available fabrics and components that meet environmental requirements, and recovery technologies are costly, immature and difficult to access. In addition,
supply chains - especially outside the EU - can sometimes be opaque and difficult to monitor.
Introducing elements of circular economy and product environmental responsibility requires not only technological changes, but also cultural and competence changes - from design, to working with suppliers, to new business models. It is a staggered process, requiring investment and external support. We see the current regulatory environment as challenging, but not fully adapted to the realities of medium-sized companies just building their adaptive capacity.
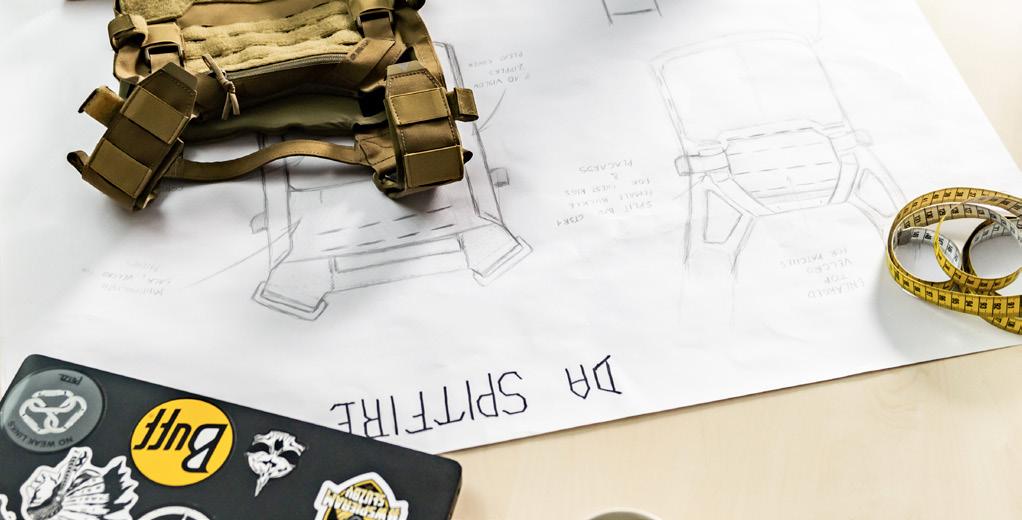
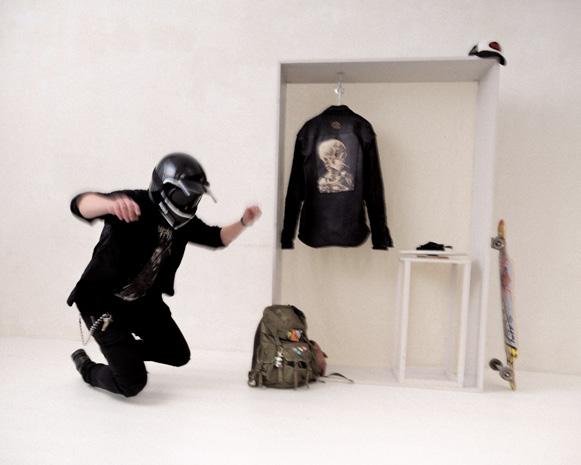
The process of designing and testing products
Whether the idea for a new product arises as a designer’s own concept or in response to a specific client need, the design process itself follows a structured pattern. Right from the concept stage, we take into account potential functions, field use and the challenges of daily use and care of the product.
We create a series of prototypes - both in the clothing and equipment categories - which we then test under real-world conditions. The tests involve members of the project team and, in selected cases, external experts. In parallel, we are investigating the properties of fabrics and components.
Challenges and developments in product design in the context of ESG
In 2024, we began work on defining what ‘green product’ means to us in practice, in response to the requirements under the Ecodesign for Sustainable Products Regulation (ESPR).
For internal purposes, we have assumed that a green product is first and foremost a product that is durable, repairable and, where possible, made up of recycled components. Although we do not yet have measurable and standardised longevity indicators, we assume that our products have a high longevity. A key quality parameter in this respect remains the number of complaints - its analysis can be found in the chapter on product use and disposal
In parallel, we are working on implementing eco-design principles into the product development process. Service life - understood as the possibility of long-term, safe and functional use of the product - was considered by us to be the most important design criterion. This means that the drive to improve the recyclability of materials or the proportion of secondary raw materials must not come at the expense of key product properties. We deliberately avoid the widespread use
of the popular rPET - due to its limited environmental effectiveness and controversy over the actual origin of the raw material.
It is important to emphasise that our products - particularly in the tactical, military and specialist apparel categories - are designed to perform precise utility functions, including protecting the wearer in demanding conditions. In this context, the use of fibre blends, the addition of elastane, multi-layer constructions, additional pockets or chemical coatings, may be necessary and functionally justified. Compromise to simplify the material composition will not be given priority in such cases - the features that affect the safety and functionality of use and the durability of the product remain paramount.
INVESTMENT TO SUPPORT DESIGN QUALITY
In 2024, we made investments in modern tools to support product development - we purchased a new laser, plotter and equipment for our first in-house research laboratory. The laboratory started operations in Q2 2025. We will report on the results of the lab’s work in our next ESG report for 2025.
In line with the development of the technological background in the organisational structure, we also introduced a new position of Product Owner. The main tasks of this role include coordinating the product development process, ensuring better integration of project teams’ activities and organising and structuring product information within product categories. The introduction of this function allows for more consistent communication, improves product data management and supports effective product life cycle management.
DIGITALISATION AND STANDARDISATION IN DESIGN
In the current year 2025, we plan to implement a 3D construction project that aims to reduce the number of prototype sewings and simplify the design catalogue. In addition, we have started the process of standardising dimensions and developing a single base model, which will facilitate quality control and enable better management of product variability.
Quality and functional requirements
The selection of suitable materials is one of the pillars of our design approach. The textiles and components used in our products must meet stringent performance requirements - durability, resistance and functionality in real, often extreme conditions are key.
As part of our development work, we systematically conduct material tests to ensure the high quality and long service life of our products. If we do not carry them out in-house, we require documentation from suppliers that the relevant tests have been carried out.
Properties we have verified include:
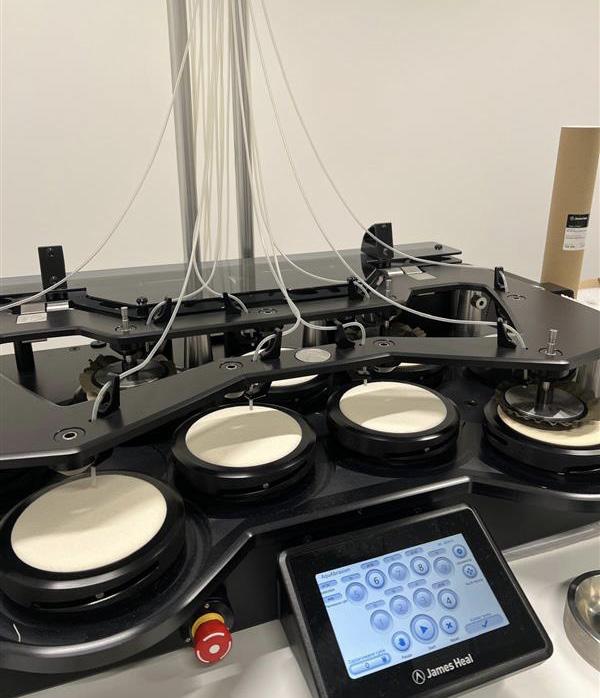
• Abrasion and wear resistance - Martindale test, evaluating the resistance of fabrics to intensive use.
• Colour fastness - analysis of colour fastness to abrasion (wet and dry) using Crockmeter.
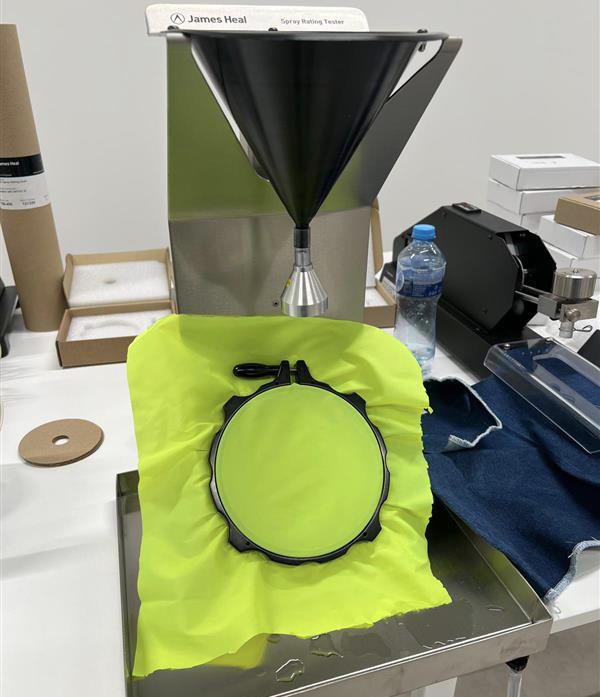
• Hydrophobicity and resistance to wetting - spray test, which measures the material’s ability to wick water away from the surface.
• Mechanical strength - tensile and tear tests on fabrics using a testing machine, in accordance with the relevant standards.
• Post-washing behaviour - tests simulating domestic laundering conditions, assessing, among other things, shrinkage, durability of prints and coatings and possible surface damage.
• Microscopic analysis - assessment of surface structure and fibre quality.
• Field use tests - we test our products in practice: in the forest, mountains, on a shooting range, during overnight stays in the open air or at work in variable climatic conditions. Fabrics are exposed to moisture, mud, abrasion and extreme use - it is not only durability that counts, but also comfort.
Photo. 2 - Spray tester
Photo. 1 - Martindale machine
In the coming years, we plan to strengthen our cooperation with suppliers who hold recognised environmental certifications, such as the EU Ecolabel or the OEKO-TEX Standard 100.
Their selection is driven by compliance with EU requirements on the reduction of hazardous substances, efficient resource management and consumer safety. The certifications also fit in with the objectives of the EU strategy for sustainable textiles - sustainability, repairability, recyclability and value chain transparency.
At Entire M, we apply due diligence in the assessment of environmental declarations. We are monitoring legislative developments in the European Union, including planned regulations on environmental claims (so-called ‚green claims’). We apply the precautionary principle in our external communications - we prefer restraint to the risk of unintentional greenwashing.
Our principles for selecting certificates:
• We only use certificates with proven credibility and environmental value.
• We only apply the certificates to products and processes that realistically meet their criteria.
• Any use of the certificate is subject to internal verification - designations are already planned at the design stage.
The aim is to introduce consistent, transparent standards for the use of environmental labels, in line with upcoming EU regulations.
In 2023, we began the process of phasing out coatings containing C6-type PFAS compounds, aiming for a full transition to C0 solution - perfluorinated-free substances. This is an important step towards reducing the impact of our products on human health and the environment.
In 2024, we placed our last orders for C6-coated products
Challenges and constraints
Despite progress, C0 coatings do not fully meet the requirements in some professional applications, especially in the military and technical sector, e.g. in terms of oil resistance or durability. Therefore::
• We are staying up to date with changing regulations, including the European Commission’s work on a possible exemption for specialist industries
• If such an exemption were to be introduced, the part of our production intended for the uniformed services could continue to use PFAS-containing coatings - in full compliance with the regulations.
INCOMPLETE KNOWLEDGE OF THE SUPPLY CHAIN
One of our main challenges remains the incomplete knowledge of our supply chain. In many cases, we do not have information on the actual manufacturers of components supplied by distributors and intermediaries, which makes it difficult to assess production conditions, environmental impact and compliance with social responsibility principles.
We view this lack of transparency as a significant risk in the context of upcoming EU regulations and growing expectations of accountability throughout the value chain. We plan to gradually fill these information gaps in the coming years.
We are currently informing suppliers of our plans in this regard. We are committed to an evolutionary approach, based on mutual trust and communication - no sudden demands or reorganisation of cooperation. Sustainable
Our objectives until the end of 2026:
• Launch of digital supply chain mapping platform.
• Establish measurable indicators of supply chain knowledge (e.g. percentage of mapped suppliers on an annual basis).
• Implement a Code of Conduct or Business Partner Declaration, setting out environmental and social responsibility standards and mutual expectations.
EUDR AND ORGANISING THE SUPPLY CHAIN
Regulations being introduced by the European Union, such as the EUDR (EU Deforestation Regulation), could give real support to our supply chain clean-up efforts in the future. The legislation has the potential to make it easier to identify raw materials with a high environmental impact and increase transparency throughout the process.
In the longer term, we hope that the regulatory pressure for transparency will translate into greater access to material from reliable sources and enable us to have better control over every stage of the supply chain.
At the same time, we do not hide the fact that this entails certain challenges. We are concerned about the difficulty of obtaining detailed information from our suppliers - especially as we do not always have full knowledge of their awareness of the origin of the products they supply. We also wonder whether the new requirements will reduce the availability of proven suppliers, which could affect the fluidity of production and the pace of new product development.
HEADQUARTERS AND MANAGEMENT
Change management and organisational development
In recent years, we have been consistently building the foundations for further growth and strengthening our organisation’s ability to manage change efficiently. We have developed four strategic pillars that provide a common direction for the activities of all teams:
1. Increased recognition of own brands - we are investing in communication, quality and image consistency to build strong brands that stand out in the market and inspire confidence in customers.
2. Extended product availability - we are systematically increasing the number of customer contact points and distribution channels, enabling us to reach a wider audience.
3. Developed distribution network - within this area, we have completed the redevelopment of the Helikon Tex shop, prepared a plan to modernise the Direct Action shop and launched a project to increase storage capacity.
4. Organisational excellence and collaborationwe are standardising processes, mapping them and preparing for ISO 9001 recertification in 2025. The goal is smooth, predictable and effective inter-team working.
A new organisational structure, implemented in response to the growing scale of the business, was also an element supporting the realisation of these pillars. As the Board noted in the strategic announcement:
“We have put the expectation of rapid growth at the forefront of our company’s long-term strategy. We believe that dynamic growth is necessary for us to be a strong and resilient company, to survive future market turbulence and aggressive competitive behaviour, and to be able to realise our full potential. However, growth will not happen on its own - it requires active action from all Entire M teams.”
Three main business areas responsible for achieving the development goals were defined: Product, Supply Chain and Sales & Marketing. The new division of responsibilities allows a better focus on key challenges, while maintaining close cooperation.
In 2024, we adopted Growth and Ecology as the pillars of our quality policy - with the intention of reinforcing their importance in both operational and strategic activities. We recognise that not all the provisions of this policy fully meet the current requirements of transparency, measurability and avoidance of greenwashing. Therefore, we plan to revise it progressively so that it better reflects actual activities and clearly defined objectives, creating a document that not only provides direction, but also realistically supports day-to-day decisions and activities in the organisation.
ASPECTS SUPPORTING CORPORATE GOVERNANCE
In response to increasing market demands and as part of our expanding business profile, we are also developing the competence to participate in military contracts and specialised tendering procedures.
ISO 9001 is the international standard for quality management - it confirms that an organisation operates in a structured, predictable manner and is focused on continuous improvement.
AQAP 2110 is an additional standard required for military procurement - meeting it is necessary to participate in defence tenders.
Possession of these certificates opens up the possibility for our organisation to participate in tenders for the supply of equipment and products intended for military purposes. One of the requirements of such tendering procedures is a proven quality management system in line with civil and defence standards.
The execution of military contracts often involves additional responsibilities, including oversight by the Government Military Representative. The presence of a MON representative means not only inspection of products and documentation, but also ongoing verification of the functioning of the quality system during production.
SUCCESSFUL INSPECTION IN ŚWIEBODZICE
- confirmation of the effectiveness of our quality system
In 2024, the Świebodzice plant hosted the first such demanding quality inspection by a Government Military Representative. The subject of the inspection was belts manufactured for a special order for the military.
The result? A very high rating and a clear statement: our quality system does not just work ‘on paper’, but actually functions in everyday work. This, the inspector stressed, is still a rarity nationwide.
This is a tremendous success for the entire quality team, and in particular for the team at the Świebodzice production site, who have demonstrated exceptional commitment and professionalism. We take the conclusions of the audit as a guide for further work.
Among the most important are:
• more accurate recording and classification of non-conformities (distinguishing between problems and non-conformities),
• a system for assessing and qualifying suppliers,
• improving metrology processes.
ISO 9001 AND AQAP 2110 RECERTIFICATION AUDIT - preparing for 2025
In 2025, we will undertake a recertification audit of two key quality standards: ISO 9001 and AQAP 2110.
A recertification audit is a kind of ‘general review’ - an independent certification body checks that our processes comply with the requirements of the standards.
As part of our preparations, we have planned, among other things:
• review of system documentation,
• analysis of key quality indicators,
• updating risk assessments, implementing corrective and improvement actions in areas identified as critical.
Maintaining certification is not only a formal requirement, but above all a confirmation for customers, partners and institutions that the quality of our activities is real and measurable - and not just declared.
Projects supporting sustainable development
Continuing projects in 2024:
• Eco-packaging - to be developed from 2023, described in detail in Chapter 6 ‘Product’.
• Eco-product - a new research project exploring the possibilities of Entire M in the context of designing for new eco-design regulations.
New initiatives planned for 2025:
• Raising ESG awareness at Entire M- an internal campaign to demystify ESG concepts and make them more understandable and attractive to employees.
• Carbon footprint analysis database - a tool for comparing raw material consumption, essential for informed decarbonisation.
• Risk and opportunity analysis - an interdisciplinary exercise to identify and discuss the impact of risks and opportunities in the context of Entire M.
• Code of ethics - a document developed in a participatory manner to support the organisational culture and strengthen the governance system.
• Alignment with EUDR - preparing for obligations under the Deforestation Regulation.
• Digital product passpor t - preparing Entire M for the requirements arising from the ecodesign regulation
DIGITAL PRODUCT PASSPORT (DPP) – the path to transparency and compliance
We do not identify with the fast fashion approach. Nevertheless, we are aware that the EU’s proposed Digital Product Passport (DPP) legislation will also cover our textile products. Therefore, we have already started preparations for the implementation of a digital product passport for both our brands in 2024.
Instead of passively waiting for delegated acts for the textile industry, we have developed our own roadmap for the planned implementation of the passport, covering the period 2025-2027.
TECHNICAL AND FUNCTIONAL ASSUMPTIONS
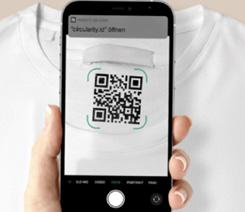
Data carrier: We decided to use permanent QR codes sewn into the product labels - with a view to their durability and availability even after purchase. We rejected solutions based solely on cardboard tags.
Scope of information contained in the initial version of the passport:
• Product information: material composition, product type, functionality,
• Carbon footprint: including the production of the main material, its transport, its manufacture (in-house or outsourced) and its packaging,
• Care and after-sales service: including repair options within the Eco-product project,
• Rules for sorting waste: packaging and textiles.
• Product logistics: through the use of RFID technology, we present the supply chain and flow of goods.
CHALLENGES AND PLANNED ACTIVITIES
On the road to full implementation, we identified key challenges:
• Versioning the product and assigning carbon footprint data to a batch or specific product - with cyclical production (e.g. the UTP model, produced continuously for 14 years) this is more difficult than with one-off seasonal collections.
• Durability of the data carrier - we test the QR code’s resistance to repeated washing and wear and tear.
• Data integration - DPP requires combining information from multiple departments (accounting, facility, product development, marketing) into one consistent database.
• Scale of the data - we are looking at whether the information will be allocated to batches or to each unit of product.
TEST PHASE AND NEXT STEPS
In 2025, we plan to pilot the implementation of DPP for 20 of our most popular in-house and outsourced products. Once we have evaluated the results, we will proceed to scale the process to the entire range of approximately 1000 products.
At the same time, we are actively following up:
• the development of EU DPP regulations,
• the activities of other companies in the sector,
• good practice and available technology.
We believe that a proactive approach and early testing of solutions, even if the first version still has educational and marketing value, brings more value than waiting for legislation to be fully settled.
Product packaging -
continued
In 2024, we continued implementation of the changes initiated in 2023 with three key decisions:
• clothing products will be repackaged from plastic polybags into paper packaging (paperbags),
• non-clothing products (backpacks, bags, accessories) will, as a rule, no longer be packaged in individual plastic packaging, with possible exceptions dictated by the need for additional protection,
• DA brand products manufactured in our sewing plants will still be packaged in individual polybags, but made of recyclable LDPE monomaterial (as opposed to PAPE compound).
REASONS FOR CHANGE
• Alignment with the PPWR regulation and progressive reduction of packaging waste,
• Awareness of Extended Producer Responsibility (EPL) obligations, including increasing fees for distributors in EU countries,
• The recycling potential of paper (approx. 90%) far exceeds that of plastics (approx. 40%), even though by weight the wastes are comparable.
SUSTAINABLE IDEAS VERSUS HIDDEN REALITY - what really slowed down the Eco-packaging project
• Lack of availability of recycled transparent LDPE packaging - need to use virgin plastic in DA packaging,
• Increased packing time for paperbag products at suppliers,
• Limitation of the possibility to visually inspect products in warehouses (lack of transparency of paperbags),
• Amazon USA platform requirements for transparent pre-packaging,
• Risk of product damage in e-commerce in the US market due to lack of protective packaging and longer delivery times,
• The need to maintain a high level of cleanliness and care in high-storage warehouses,
• Limited availability and competitiveness of paperbag suppliers in European and Asian markets.
These changes are challenging in terms of further expansion into non-European markets, but are necessary if we are to remain compliant with regulations, stakeholder expectations and the direction of sustainability.
People and organisational culture
In 2024, the rate of employment growth has slowed down relative to the previous two years, reflecting a natural stabilisation after the company’s strong growth phase. Following the opening of new plants in 2022 and 2023 and the implementation of new functional departments, 2024 was marked by the consolidation of structures and the improvement of management processes.
The average annual headcount increased by 34 to reach 348 (compared to 314 in 2023 and 220 in 2022). It is still dominated by women (70% of the total workforce), which remains consistent with the profile of production positions typical of the garment industry, such as seamstresses.
The increase in employment was mainly in permanent contracts, with their number increasing by as much as 23% year-on-year. This result confirms our policy of building lasting relationships with our employees, based on a two-stage employment model: first a fixed-term contract to allow them to get to know each other and then, if mutually compatible, a permanent contract.
There was a significant increase in permanent employment, with the number of such contracts increasing by 23% compared to the previous year. This confirms our strategy of building long-term relationships with employees, in line with an approach in which each fixed-term contract is treated as a vetting stage before permanent employment. At the same time, temporary employment fell by 5% and the number of people working part-time remained at a low, stable level (18 people, -1 y/y), highlighting the continuation of the trend in full-time employment.
In 2024, we continued to work with 17 business people (IT areas, marketing, sales) and a representative in Taiwan who supports us in the local market and with suppliers.
We do not employ agency workers or in a non-guaranteed working time model. It is a considered decision that stems from the belief that long-term collaboration translates into quality, commitment and a sense of security for employees - key values in our organisational culture.
Staff turnover has proved to be a far greater challenge in 2024. The number of people who have left the organisation has increased by as much as 68% compared to 2023 (from 22 to 37 people). The biggest increase was in the 30-50 age group - key to the organisation’s stability - where the number of departures more than doubled (from 13 to 27 people, +108%). There was also a slight increase in departures among the youngest employees (+50%), while there was a decrease in the over-50s group (-20%).
The increased turnover may be a result of the intensive organisational changes of recent years, but it also signals increased expectations of work culture and further development of career paths. This phenomenon has already been covered by an internal analysis to better understand the reasons for departures and to plan measures to support retention in key competence and age groups.
Our employees in numbers
1 - Number of employees on average per year, by gender 2022-2024; change 2023/2024
Table 2 - Employment by form and gender annual average 2022-2024; change 2023/2024
Table 3 - Employment by type and gender annual average in 2022-2024; change 2023/2024
Table
Table 4 - New employees by gender 2022-2024; change 2023/2024
Table 5 - New employees by age in 2022 and 2023
Table 6 - Employees who left the organisation by gender between 2022 and 2024; change 2023 / 2024
Table 7 - Employees who left the organisation by age between 2022 and 2024; change 2023 / 2024
SAFETY AND HEALTH OF EMPLOYEES
Production always involves risks. That is why we have been operating our own practical system of concern for employee safety and health for years. We are not about “ticking off” requirements, but about everyone being able to go home safe and sound after work.
Key elements of the system:
• A two-person Occupational Health and Safety Service (a senior specialist and a specialist), supported by an OHS Committee with representatives from all sites and an occupational physician.
• Risk assessment prepared jointly by a health and safety specialist and an experienced person from the job. We did not update the assessments in 2024; the next round is scheduled for Q2 2025.
• Work environment reviews every two years or after significant changes - the most recent confirmed no exceedances of standards.
PARTICIPATION AND OPEN COMMUNICATION
Everyone - employee, subcontractor or visitor - has access to paper and digital knowledge bases (risk assessments, substance charts, test results). In addition, all those carrying out work on Entire M’s premises are required to comply with the organisation’s health, safety, fire and first aid regulations. Near-misses can be reported via the TEAMS application or a paper form, for employees without access to a computer. Applications are reviewed by the health and safety team.
• At periodic health and safety training, we remind all employees that:
• no one will face consequences for reporting an incident or near miss,
• everyone has the right to stop work when they consider it to be dangerous,
• reporting channels, including anonymous ones (boxes on the shop floor, form in Teams) are regularly monitored by the Health and Safety department.
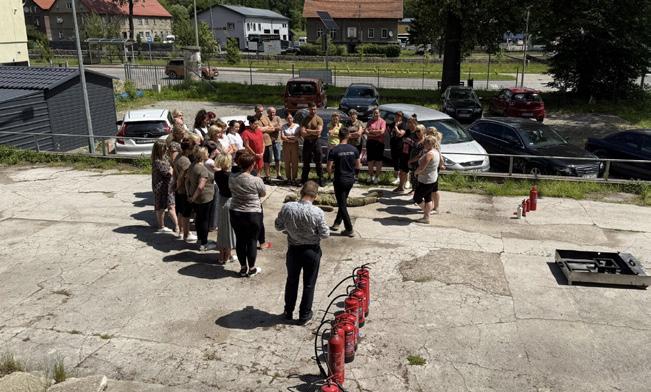
Training included not only theoretical health and safety issues, but also practical exercises using the AED, internal hydrant and foam, powder and snow extinguishers on a specialist fire simulator .
Periodic training is carried out exclusively on a classroom basis due to the practical elements of this training. Everyone in the company knows the basics of firefighting and first aid. In 2025, an evacuation, fire protection, first aid and health and safety exercise using VR technology will be incorporated into periodic training. We are keen to see procedures backed up by established skills, and a not document that will just be placed on the shelf.
In 2024, there were five accidents with light injuries. 3 of these involved moving around the site and 1 accident occurred during first aid training. The only accident related directly to the production process and involved a seamstress’ finger being pierced while sewing.
KEY PREVENTION MEASURES IMPLEMENTED IN 2024.
• Safety helmets and additional nets in the high-bay warehouse.
• Sprinkler system integrated into the FAS signalling system (with plans to connect it to the State Fire Service in 2025).
• Taking due care of all Entire M sites in terms of health, safety and fire safety during refurbishments and adjusting systems after any building extensions.
• In order to reduce occupational hazards, workers employed as “seamstress” / “tailor” are subject to compulsory physical exercise during working hours to improve circulation and ensure the health of the musculoskeletal system - especially the upper limbs.
Table 8 - Participants in OHS training, 2022-2024
Tabele 9 - Accidents at work and occupational diseases, 2022-2024
Photo 4, 5 - firefighting training
HEADQUARTERS AND MANAGEMENT
SOCIAL ASPECTS - support for employee development - company initiatives in 2024
In 2024, EntireM has implemented a series of measures focused on developing employee competences, improving well-being and building a values-based organisational culture. The following are the most important initiatives implemented at the headquarters:
“LEADER PROFILE” PROGRAMME
The aim of the programme was to align expectations for managers and to strengthen competencies to support effective team management. The leader competency model was based on six key attitudes:
• courage
• openness
• empathy
• responsibility
• proactivity
• determination
Activities such as recruitment, training and feedback are aimed at strengthening managerial skills, including communication, systems thinking, work organisation, team collaboration, emotion management, relationship building and leadership.
DEVELOPMENT TALKS
The Development Conversations programme, which provides a space for an individual conversation about each employee’s aspirations, needs and development path, continued in 2024. This is a key element of a culture of feedback and career planning.
HCMDECK TRAINING PLATFORM
We have launched a state-of-the-art e-learning platform that supports the development of employees at different stages of their work in the organisation.
It currently includes, among others:
• an onboarding programme for new employees,
• the module “Well-being in your hands” - with content on ecology, health, coping with change and stress,
• product training in the form of videos - this database is regularly updated and expanded with new products.
PROFESSIONAL DEVELOPMENT AND TRAINING
Developing people is not only about training, but above all about investing in the future of the company. At Entire M, we believe that empowering the team is the foundation for innovation, security and responsible leadership. That is why we are constantly working to ensure that our development activities meet the real needs of employees - regardless of their position or seniority.
WHAT DOES THE DATA SHOW?
During the period under review, more than half of the employees (56%) participated in at least one form of training. Those in specialist positions and in middle management were the most active - here the percentage of participants exceeded 85%, and training included both soft and technical competences. Women were particularly likely to benefit from training to develop interpersonal skills - for example, as many as 85.7% of female professionals took part in such programmes.
There is also clear potential for further growth - especially among rank and file employees and older age groups. The participation of these groups in training was significantly lower (27.9% and 24% respectively), which may indicate a barrier to access or a mismatch between forms and topics and their needs.
WHAT SHOULD BE APPRECIATED?
• High level of involvement of specialist and managerial staff, both in technical and soft training.
• Strong presence of women in personal skills development programmes.
• A diverse range of training courses tailored to levels of responsibility and responsibilities.
WHAT DO WE WANT TO IMPROVE?
The data collected is an important but incomplete picture of reality. The current breakdown does not take into account one-to-one activities - such as 1:1 development meetings, 360-degree assessments or mentoring - which are a key element of management development. Therefore, we plan to revise our data collection methodology in order to be able to describe the actual extent and quality of development activities at Entire M even more fully in the future.
Participation of all employees in training
Participation of top management in training 73%
Participation of workers 55+ in training 24%
Participation of production workers 28%
Participation in soft training (total)
Participation in specialised training (total) 1.5% – 53%*
Risks in the absence of improvement
Weakening of an organisational culture based on contin-uous learning
Decline in development leadership and loss of leaders' influence in shaping a learning culture
Development of the competence gap between generations, limitation of knowledge transfer
Decrease in motivation and commitment, feeling of lack of development and promotion opportunities
Insufficient support for communication and cooperation skills, especially at lower levels
Uneven development of technical competences in the organisation, risk of competence gaps
* Range of values depending on level of employment - highest share among professionals and middle management.
General information on training
Total number of training courses(number of training courses) 62
Total number of employees - 366
Number of trainees(number of people) 846
Number of all training courses organised in the organisation
Total number of employees in the organisation
Number of employees who participated in training
Number of employees who attended at least 1 training course(number of people) 216 A figure showing how many employees received at least 1 training course per year
Type of training specialised (external) (number) 27 216 soft (internal) (number) 35 140
Availability and type of training subcategory number Description and comments
Total number of training hours - 3680 h Total hours of training provided in the organisation
of
PROMOTING WELL-BEING
We delivered a series of webinars dedicated to mental health and life balance, including topics such as:
• stress and the rapid pace of change,
• adapting to change,
• healthy habits in sedentary work,
• tolerance of uncertainty and management of emotions in crisis situations.
ACCESS TO PSYCHOLOGICAL SUPPORT - the HearMe platform
In response to the plight of the September 2024 floods - full of uncertainty, real threats and strong emotions - the HearMe platform has been made available to employees. It allows individual online sessions with psychologists and therapists.
The aim of this initiative was to support the mental health and wellbeing of the team at a time of increased stress, anxiety and fears for safety - both personal and professional.
EMPLOYEE NPS INDICATOR SURVEY
In 2024, a Net Promoter Score (NPS) survey was conducted for the first time, assessing employee loyalty by asking how willing they would be to recommend a company as a place to work. Result obtained: +18
• 42.6% of employees would definitely recommend working for the company
• 33.6% remain neutral
• 24% would not recommend the company as an employer
A positive result is an incentive for further development. In response to the results, an in-depth analysis was launched to identify areas for improvement.
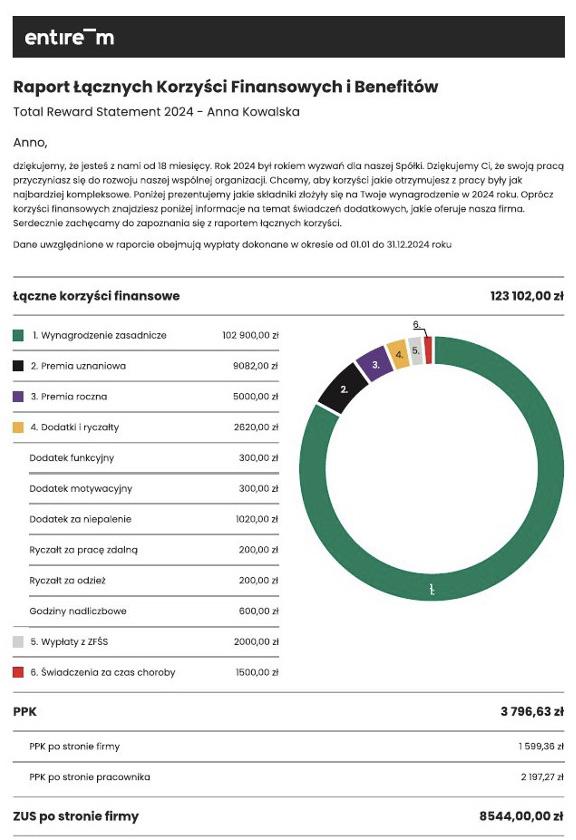
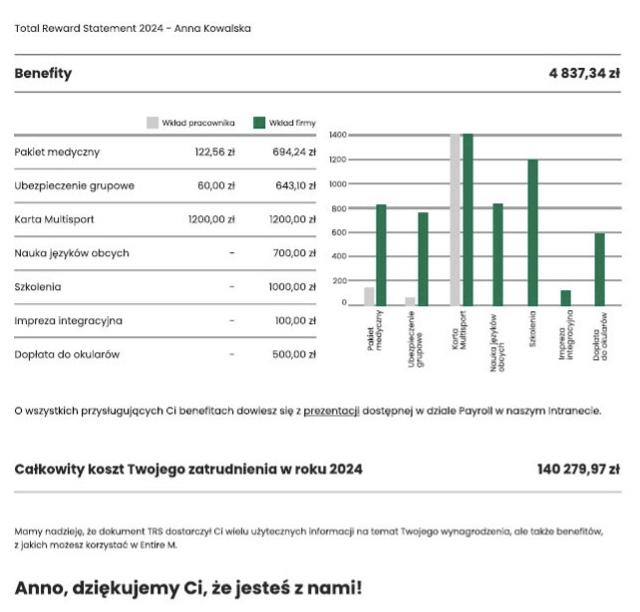
TOTAL REWARDS REPORT (TRS)
In 2024, a project was initiated to prepare a Total Rewards Statement (TRS) - individual reports showing the total remuneration package, including social security contributions, PPK, non-wage benefits and training costs. The initiative aims to increase transparency and awareness of the value of employment within the company.
INNOVATIVE JOB EVALUATION PROJECT
At the end of 2024, we launched an internal job evaluation project, the results of which will be presented more extensively in the 2025 report. The initiative is innovative and stands out from standard market solutions for two key reasons:
• Involvement of a multidisciplinary team: we included leaders and managers representing almost all operational areas of the company in the process. This approach allows for a deeper understanding of the specificities of individual roles and reinforces the community approach to shaping an equitable remuneration system.
• Abandoning off-the-shelf market schemes: we consciously opted out of external consultancies to develop a remuneration model that is fully tailored to our organisational culture, job types and team expectations. We prioritise transparency and partnership in the process.
The new system is intended to move away from the prevailing approach based solely on market benchmarks to a model that reflects the real added value that a position brings to an organisation. Valuation is based on clearly defined criteria such as:
• level of competence,
• the quality of inter-team cooperation,
• the extent of decision-making autonomy,
• innovation and impact on organisational development,
• the importance of the role in achieving results (including financial results),
• the existence of deficit competences (e.g. craft trades professions such as tailors).
This project is an important part of achieving our goals of creating a fair, motivating and sustainable working environment.
EQUAL TREATMENT AND EQUAL OPPORTUNITIES FOR EMPLOYEES
Between 2022 and 2024, Entire M monitored equal pay and career opportunities among its employees. The data shows that while progress is being made in some areas, significant challenges remain.
The largest pay disparity is among senior executives, with women earning on average as much as 32% more than men (132%) in 2022, but in subsequent years their salaries fell relative to men, reaching 83% in 2024. This could be an indication of instability in remuneration policies or changes in the employment structure. Among rank-and-file employees, the situation is more even, with women earning on average 89% of what men earn in 2024, an improvement on 2023 - a strategic project launched in 2024, the Job Valuation Project, described earlier in this chapter, is a response to this instability.
The employment structure shows a clear gender imbalance in top positions, with women making up only 20% of senior management. In contrast, women predominate among professionals and operational staff, which may indicate limited opportunities for promotion. This structure may have an impact on the persistent wage gap.
HEADQUARTERS AND MANAGEMENT
Age-wise, employees in the 30-50 range predominate, which demonstrates the stability of the team, but also the need for efforts to attract younger talent. People under 30 are almost absent from management, which can limit the diversity of perspectives.
In 2024, a third member - also male, but from outside the ownership family - joined the Board of Directors, bringing significant expertise in the areas of finance, sales and marketing. Up to this point, the Board of
Directors was made up exclusively of the founder’s sons, who were also shareholders in the company. This is an important step towards opening up to external insights and new competences. Today, the Board combines what built the company from the beginning - the owners’ commitment and their knowledge of the company from the inside - with professional support and a fresh approach from the outside.
Wage gap in 2022-2024 (percentage difference in average pay between men and women)
Employees by management level and gender in 2024
Employees by management level and age in 2024
Demographic characteristics of the Entire M Board 2022-2024
INTERNAL COMMUNICATION
In response to the needs signalled by employees and weaknesses in internal communication, we have taken measures to improve the flow of information and strengthen team engagement.
• In 2024, we launched the intranet - a central knowledge base that supports communication between departments, promotes successes and provides access to key information.
• Twice a year, meetings are held with the Board of Directors, presenting results, plans and developments.
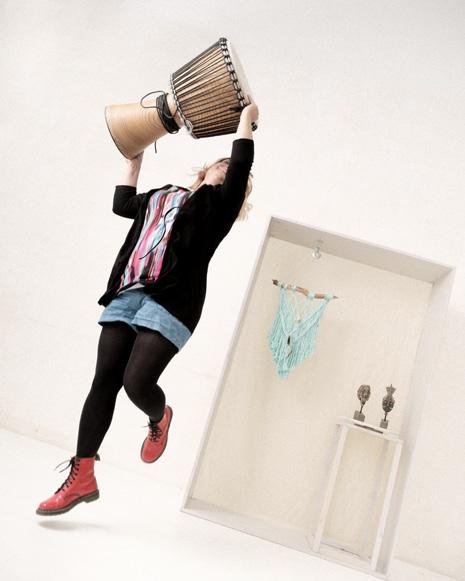
• As part of team integration, we carried out a “Hobby” project, showcasing the passions of employees.
• From 2025, we plan to implement a comprehensive internal communication strategy.
• In 2025, we will begin work on a code of ethics created in a participatory way so that ethical values reflect the collective voice of the team. We want the code to be a living document, supporting the organisation’s culture and day-to-day decisions, rather than just a declaration on paper.
Photo 6, 7, 8, 9 - “Hobby” project
Flood risk management - September 2024 Moving 2025
CONTEXT AND SCOPE OF THE THREAT
In September 2024, the Lower Silesia area (southern Oder river basin) experienced localised water surges as a result of heavy rainfall. In our company’s value chain - encompassing three sewing plants (Nysa, Nowa Ruda, Świebodzice) and our head office in Błonie near Warsaw - we have been able to create a strong and sustainable value chain. Wrocław - only the Nowa Ruda plant was directly affected. Other sites, although located in areas of potential danger, avoided flooding.
IMPACT ON OPERATIONS
• Direct effects in Nowa Ruda: The ground floor production rooms were flooded, but thanks to immediate clean-up work - drying and cleaning - production resumed within 48 hours. There were no equipment or material losses.
• Transport disruption: For the duration of the floods, transport of raw materials and products between all plants and the headquarters was suspended.
COUNTERMEASURES AND EMERGENCY RESPONSE
Emergency response team
• An interdisciplinary team has been set up: OHS, HR, payroll, logistics and communications.
• Daily reports allowed staff to stay informed and encouraged them to use only proven sources of knowledge and avoid panic.
• Fundraising for affected workers; provision of dehumidification equipment and support materials.
• Free psychological consultation via the HearMe platform for all employees
• Flexible allocation of days off and remote working, with full payroll consistency.
• Payment of one-off benefits and planned training with an insurance broker on asset protection.
Flood procedures and liability
• “Flood Procedures” have been implemented, authorising plant managers to take immediate emergency action.
• The decision-making scheme has been simplified, which has reduced response times and minimised the risk of competency ambiguities.
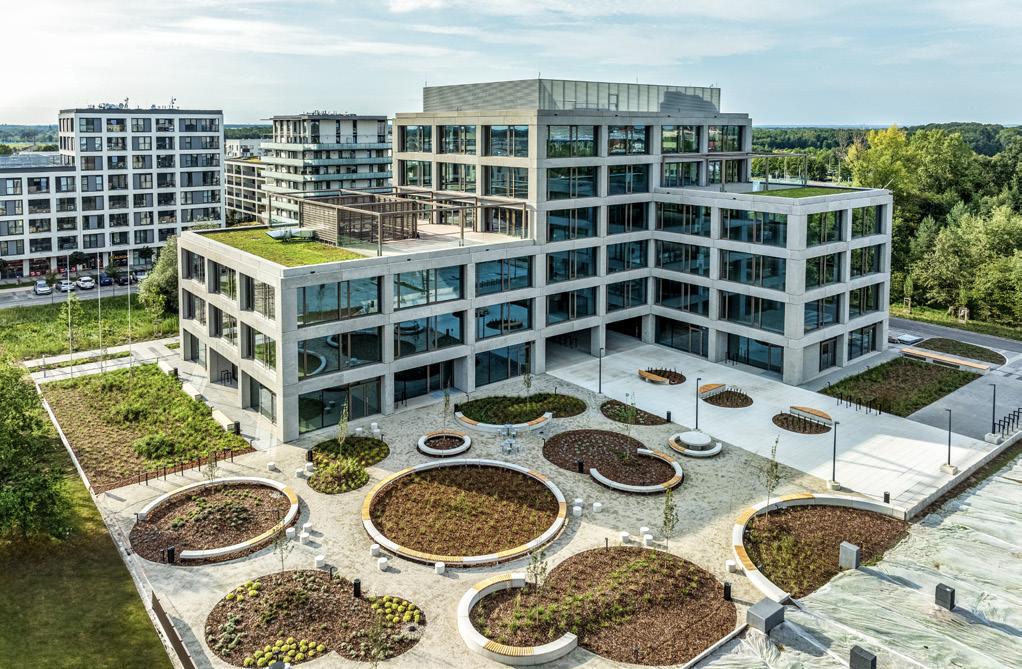
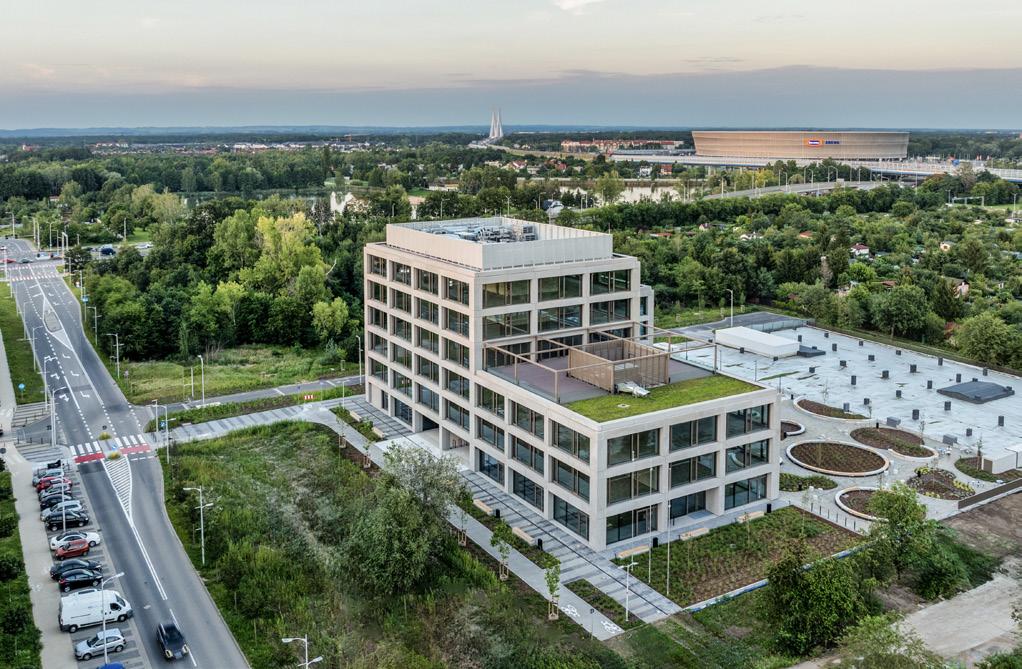
In 2025, we plan to consolidate the three existing locations into one new corporate headquarters. This strategic change carries significant organisational risks - including possible downtime associated with relocation, time spent on packaging, adaptation and the implementation of new systems and work logistics. An additional challenge may be the exodus of some employees, for whom the new location will be difficult to reconcile with their private lives or daily commute.
On the other hand, we see this change as a real opportunity to improve the efficiency and quality of collaboration - most teams will work in one place, which will facilitate communication, reduce decision-making time and strengthen the organisational culture. Modern, better-designed spaces will promote comfort and integration, and the location in Wrocław may increase our attractiveness as an employer for qualified professionals from the region. The move is treated not just as a change of address, but as part of the company’s operational transformation.
Photo 10, 11 - New Entire M headquarters
Contract manufacturing
Our business mainly consists of manufacturing cooperation with partners in Asia and Europe. Most of our suppliers are companies with many years of experience in garment production, with whom we work on the basis of long-term relationships, trust and mutual transparency. More than 60 per cent of our suppliers are partners with whom we have worked for more than five years. Such long-term relationships foster effective project refinement, improve quality and timeliness of delivery and build mutual understanding of expectations and requirements.
The new platform is designed to give our suppliers insight into Entire M’s development plans, allowing them to better plan production and manage resources. We want to take communication with partners to a higher level - more open, based on mutual understanding and personal contact.
We are committed to building relationships that go beyond the standard framework of cooperation. This is why we see so much value in face-to-face meetingsthey allow us to better understand the realities in which our partners operate. An example is our visits to China, which helped us to look at the local labour market without prejudice and stereotypes. We saw first-hand the social and economic changes that affect the day-today operations of the companies there.
This experience has proved extremely valuable to usand we want to continue it with other business partners as well.
RISK: In such a business model, there is a risk of relying too much on personal relationships, which can lead to informal arrangements that will be difficult to enforce.
PAYMENT PRACTICES AND LONG-TERM COOPERATION
In 2024, we have focused on making our procurement processes more efficient by introducing a Work in Progress (WIP) form for ongoing updates of procurement details. We tested and implemented with the largest supplier with the highest level of order complexity. The process of implementing the platform was based on online training, a trip to the Partner’s premises and regular monthly meetings to answer questions, identify problems in the form’s operation and improve the process.
In 2025, we plan to implement a form for communication with further suppliers, enabling:
• centralising the exchange of information between departments,
• monitoring and classifying the causes of delays,
• early detection of risks and implementation of countermeasures,
• real-time data analysis.
Our approach to payment practices is based on partnerships and predictability, which is the foundation for long-term partnerships with suppliers. In line with commercial arrangements, we settle liabilities within a short timeframe - usually under 90 days. In many cases, we use advance payments when placing an order and make payment already when the goods are dispatched.
An important part of our practice is to expedite payments deliberately - we make payments in advance, introducing a 7-day safety buffer. As a result, our partners can count on financial stability and do not have to worry about delays.
RISKS AND OPPORTUNITIES related to the structure of finished product suppliers.
The current structure of our supply chain is characterised by a strong concentration, with almost 60% of our finished product supply coming from Chinese suppliers. Such an arrangement provides the operational benefits of developed relationships, quality standardisation and simplified logistics management. However, from the point of view of sustainable risk management, it involves significant risks.
Social and reputation risk:
• Disclosure of irregularities on the part of a key supplier can result in a loss of stakeholder trust.
IDENTIFIED OPPORTUNITIES
Co-creating innovation with a strategic partner:
• A strong relationship with a major supplier enables the joint development of sustainable production and resource optimisation solutions (e.g. RES implementation, emission reduction, process automation).
High repeatability and quality:
• A standardised production process allows consistent quality and cost efficiency to be maintained.
Planned diversification strategy
In response to the growing need to increase the resilience of the supply chain, we have begun work to identify opportunities to diversify production sources. Our aim is to create a more flexible and secure supplier base that can better cope with potential disruptions.
KEY RISKS RELATED TO CONCENTRATION OF SUPPLY
Breaking the supply chain:
• Geographical concentration of suppliers (mainly Asia) increases vulnerability to transport disruptions, cost increases and trade conflicts.
• Climate and natural hazards (floods, earthquakes, typhoons).
• Political and regulatory risks (embargoes, tariffs, export restrictions).
Operational risk:
• Heavy dependence on a single producer limits flexibility and makes it difficult to react quickly to market changes.
• Difficulties in implementing innovation in situations requiring sudden change.
At this stage, we are looking at different geographies - both in Asia and Europe - for potential collaboration with new partners. In parallel, we are working on defining clear and measurable criteria that will allow us to assess suppliers not only in terms of quality and efficiency, but also environmental impact, working conditions and openness to innovation.
Diversification of production
Shares of countries in production
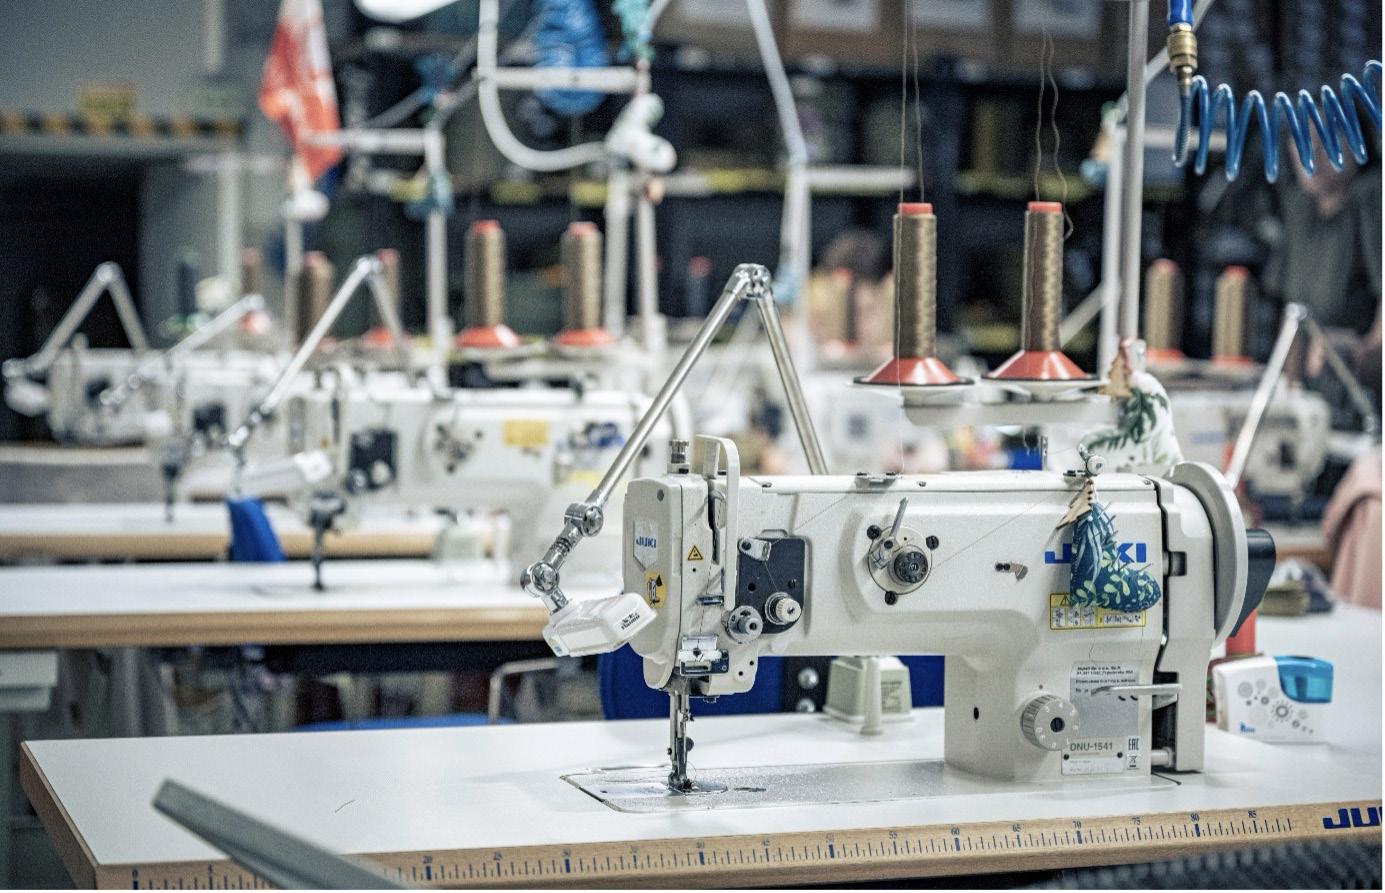
In-house production
We carry out our own production at three sites: in Nowa Ruda, Nysa and Świebodzice. This is where the majority of Direct Action branded products and a significant proportion of Helikon Tex belts are made.
For years, we have been ensuring that our sewing plants are not only efficient factories, but above all a safe and comfortable workplace - organised with respect for the needs of the employees.
INVESTMENT IN INFRASTRUCTURE AND WORKING CONDITIONS
In 2024, we continued our modernisation efforts at the production facilities, focusing on improving working conditions, safety and social infrastructure:
• Nowa Ruda: renovation of the administrative floor has been completed, creating new office space, a conference room and a server room. State-of-theart men’s and women’s changing rooms have also been built, which we reported on in the 2023 report. “ The production halls have been additionally illuminated, improving working comfort. A waste shed and a car park with 20 new parking spaces were also added. Plans include upgrading the terrace to serve as a summer social space.
• Nysa: a car park extension is planned, although this involves a reduction in green space.
• Świebodzice: special curtains pasted on the windows were used to lower the temperature inside the building.
Photo 12, 13 - Production plant in Nowa Ruda
SOCIAL AND EMPLOYEE WELFARE INITIATIVES
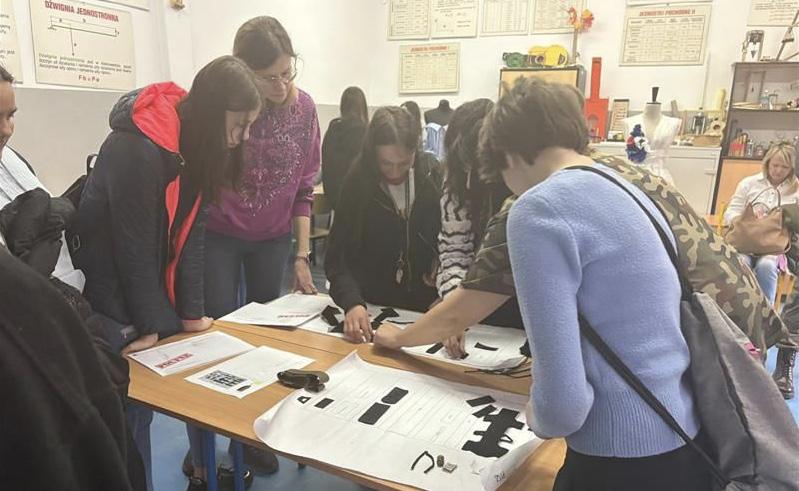
• Cooperation with education: the Świebodzice plant cooperates with the local vocational trade school to promote training as a fashion industry technician.
• Improved work ergonomics: all sewing rooms have been equipped with new pallet trucks with scales, promoting ergonomics and efficiency.
• Optimisation project: we continue to hold monthly meetings in the sewing rooms, where we discuss processes and look for opportunities to improve work - also in the context of moving some production from Asian markets to Poland.
• Strengthening social dialogue: the the position of shop steward - an employee representative - was created at the Nysa plant to promote dialogue and resolve reported issues in an atmosphere of trust.
• World Sewing Day: on 14 June, we proudly celebrated World Sewing Day - an opportunity to thank our seamstresses and tailors for their craftsmanship, precision and commitment.
• Emergency support: in response to local flooding, the Nysa and Nowa Ruda sites were involved in psychological support and in organising collections for those affected. Employees were given the option to stay at home in case of an emergency or to participate in rescue operations. Special procedures have also been developed to define actions and responsibilities during floods.
What do our employees in the sewing rooms say?
RESULTS OF THE INTERNAL ESG STUDY.
The results of the ESG questionnaires among the seamstresses showed a valuable perspective on the assessment of the situation in the organisation.
Strengths
• Workplace safety received top marks - our employees feel safe and health and safety rules are well known and applied.
• Resource efficiency is an area where a high level of awareness is noticeable - from energy to the use of materials.
• The company’s environmental activities are visible and positively evaluated - employees perceive that the company cares about the environment.
Areas to be strengthened
• Equal opportunities - women in particular reported a sense of limited opportunities for promotion and career development.
• Organisational ethics - company values are less felt among production teams than among office workers.
• Environmental awareness of products - identification of products as environmentally friendly and sensitivity to climate change is declining.
We take the conclusions of the survey as a starting point for further action - both in terms of internal communication and development programmes..
Photo 14 - Świebodzice - meeting with school youth
Transport UPSTREAM
SUSTAINABLE MANAGEMENT OF THE TRANSPORT OF MATERIALS AND SEMI-FINISHED PRODUCTS
In 2024, the company used four main modes of transport to import products and components: sea, rail, road and air. Each is characterised by different levels of emissivity, operational risks and optimisation opportunities.
MARITIME TRANSPORT - the primary channel for large deliveries
Maritime transport accounts for more than 75% of all tonne-kilometres. This is the cheapest solution for large volumes, but is characterised by long delivery times (30-60 days) and low flexibility. Risks include port congestion, armed conflicts (e.g. in the Suez Canal area), as well as container shortages and limited transparency in the supply chain - in part, the choice of carriers remains with the suppliers.
RAIL TRANSPORT - an alternative with moderate impact
Rail transport accounted for 19.5% of total transport to the company in 2024. Delivery takes 15-20 days and CO2 emissions are lower than in sea or air transport. Rail provides greater control, traceability of shipments and integration with road transport. The main risks relate to routes through Russia, Belarus or Kazakhstan, as well as customs problems, especially with the classification of garments. In 2024, we experienced a delay of more than a month by prolonging the customs process due to the transport of military clothing, this experience influenced the decision to reduce the share of rail transport in 2025 until the situation improves.
ROAD
TRANSPORT - operationally
key in Europe
Road transport accounts for approximately 4.5% of tonne-kilometres. Used mainly for deliveries within the EU and from European ports to our warehouse near Wrocław, it offers flexibility and short lead times. Its relatively high specific emissions and its impact on urban air quality are an important environmental aspect. Risks include, among others, tightening climate regulations and rising fuel costs. An undoubted opportunity is the consolidation of cargo, or low-carbon carriers
AIR TRANSPORT - minimum share, high footprint
We use air transport occasionally - mainly for urgent deliveries (e.g. deliveries to trade fairs/shipping a prototype). It is a quick method (1-3 days), but the least sustainable - both in terms of emissions and costs. Air transport in 2024 accounted for around 0.1% of total transport.
Share of transport modes in upstream transport
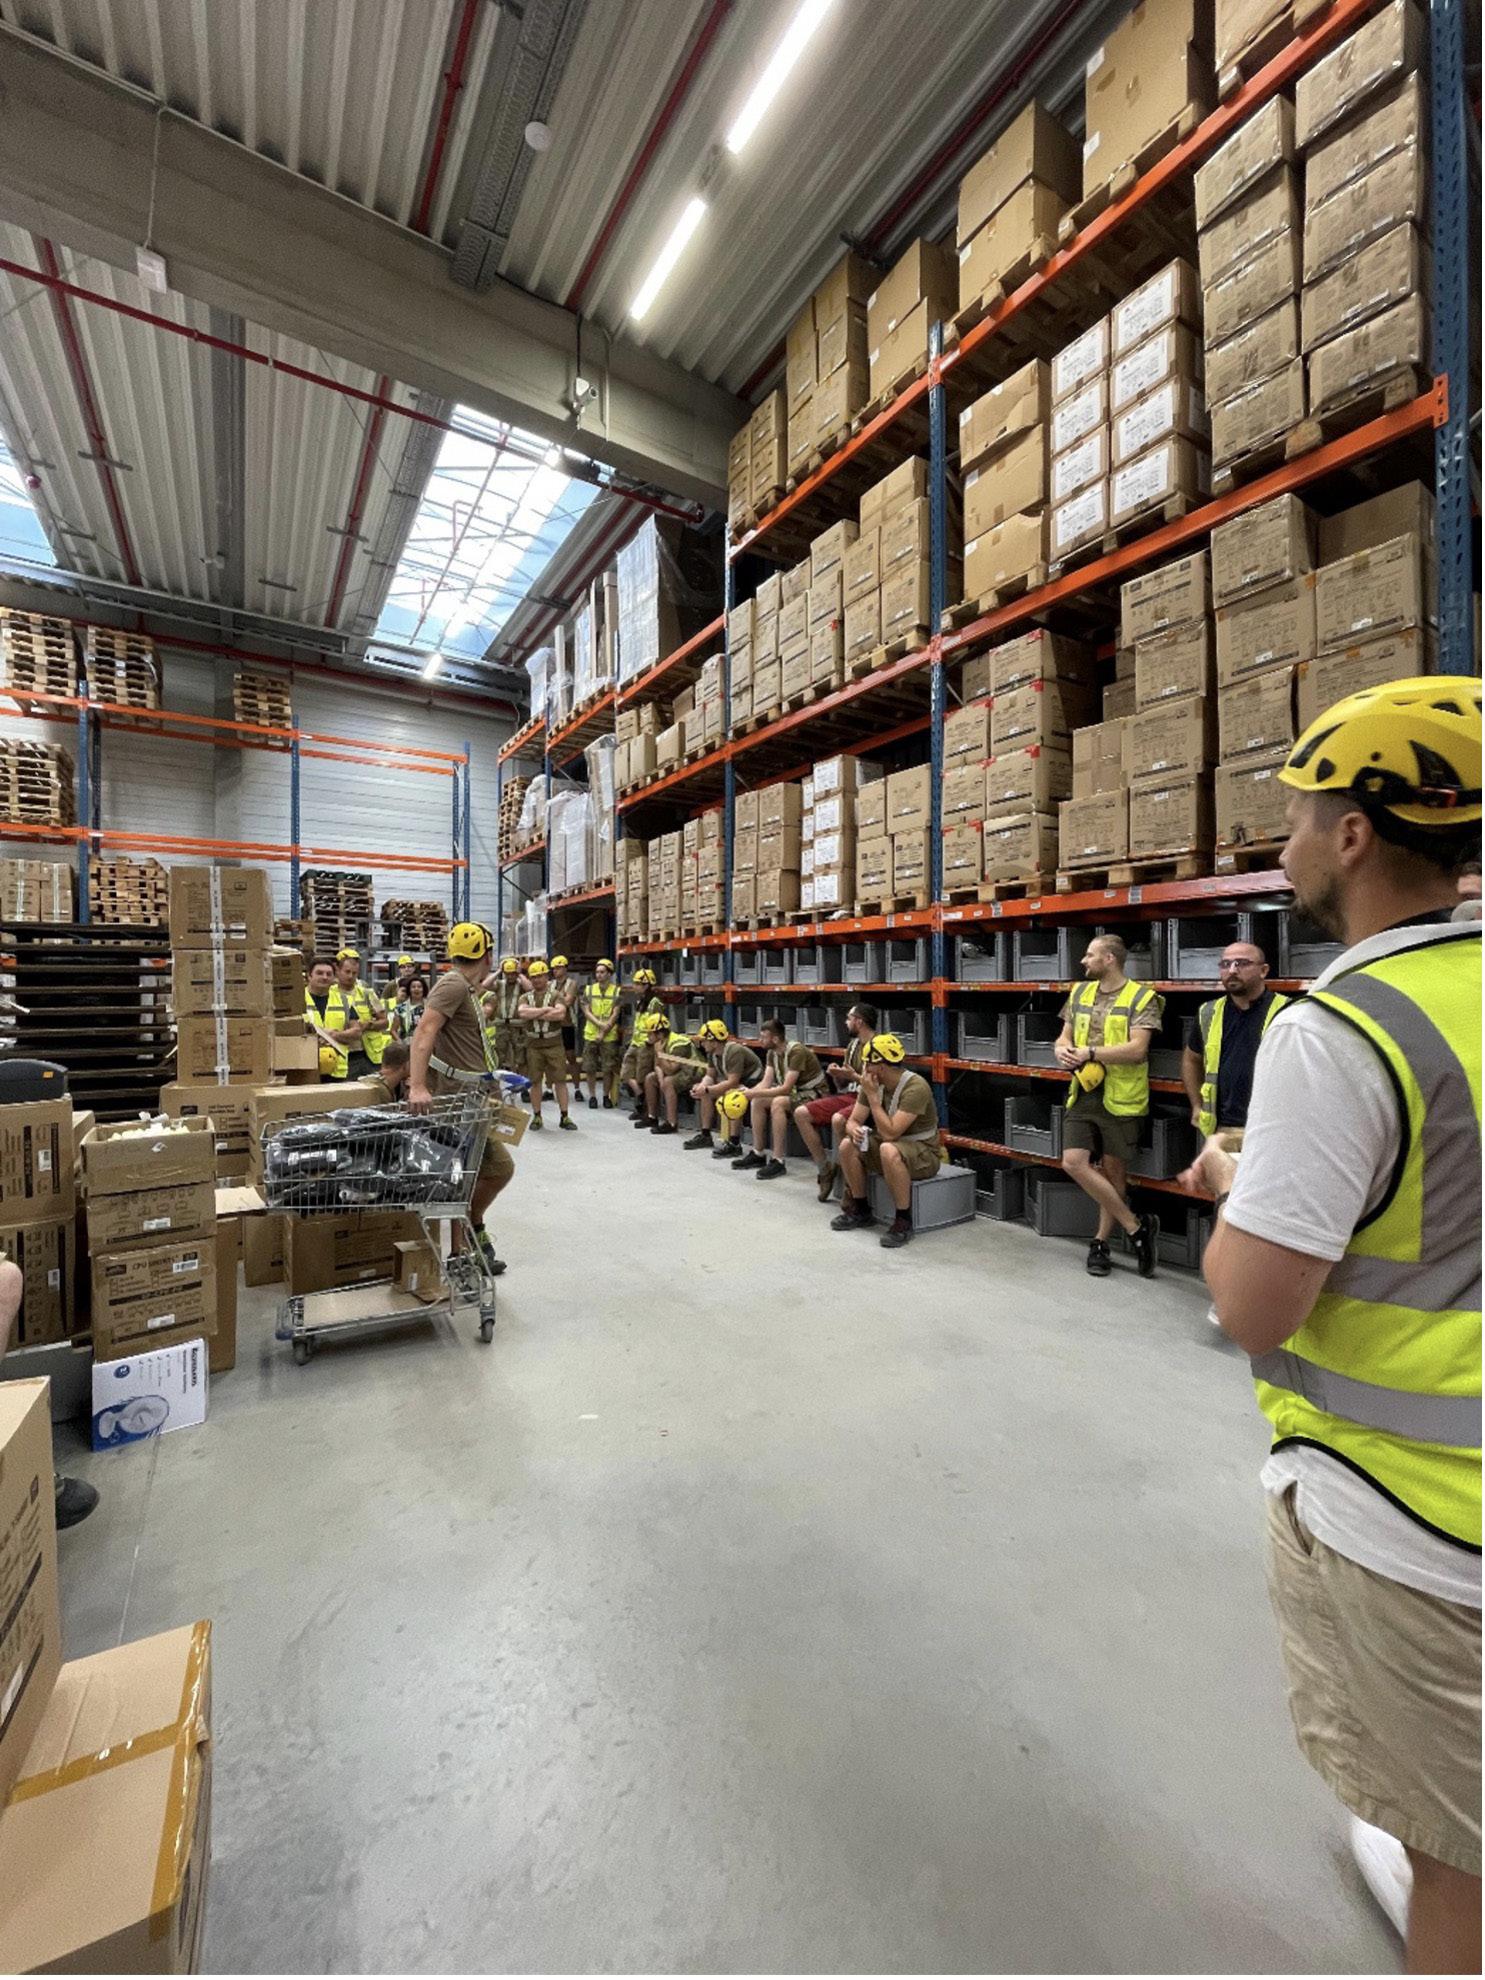
Storage
The warehouse plays a key role as the company’s logistics centre - it is here that we consolidate deliveries, complete orders and coordinate the flow of goods between plants and customers. Operational efficiency, security and good communication are the cornerstones of its daily operation.
INVESTMENT IN INFRASTRUCTURE
In 2024, we continued our safety prevention activities. Key initiatives included:
• installation of safety nets at high bay storage racks,
• retrofitting the warehouse with a retention tank connected to a sprinkler system,
• maintaining high standards of fire protection and compliance with health and safety rules.
COMMUNITY INITIATIVES
However, the internal satisfaction survey (NPS) showed that working conditions in the warehouse were rated lower than in other parts of the organisation. We took this as an important signal and impetus for action.
In response:
• we have expanded the space for dialogue - daily ‘assemblies’ and permanent supervisor on-call support open communication,
• you are encouraged to raise problems and ideas directly with staff.
• Warehouseman’s day
We plan further activities based on regular dialogue and the real needs of the team..
Internal transport
INTER-LOCATION SHIPMENTS - efficiency and environmental impact
Transport between our plants and warehouses is a regular part of operations. In 2024, company vehicles covered nearly 70 ,000km, which accounted for around 11% of all business trips. While this is not the highest priority area in our sustainability strategy - risk mapping points to other, more relevant topics - we are trying to gradually implement solutions to reduce emissions and increase efficiency.
As part of our testing, where possible we have introduced lightweight cardboard pallets, which reduce the weight of the load and allow us to reduce fuel consumption. Although we wanted them to become standard, some large haulage companies do not accept them - which limits their use. Unfortunately, the cardboard pallets did not survive the operational test and for the time of writing the report (first half of 2025) we have reverted to standard solutions.
We also try to combine transports from different departments to make better use of cargo space and reduce the number of trips. We are increasingly using our own means of transport, which allows us to better control both emissions and costs.
Photo 13 - Logistics Centre - in Błonie.
DOWNSTREAM transport
DELIVERY TO DISTRIBUTORS AND END CUSTOMERS - efficiency and environmental impact
The transport of products to customers (downstream) is carried out in both the B2B and B2C segments. In 2024, the total transport volume was 2,132,784 tonne-kilometres, of which approximately 40% was by road and 60% by air. These activities are carried out in cooperation with three independent logistics operators.
The data does not include the distributors’ own transport from our warehouse; in future years we plan to extend the analysis to include this information as well.
Currently, the company does not apply formal environmental criteria to its logistics partners, but identifies this area as a potential direction for sustainable supply chain practices. Targets have not yet been set for the reduction of greenhouse gas emissions associated with downstream transport, but the company is looking at the possibility of implementing appropriate indicators to monitor the environmental impact of these activities in future reporting years.
Distributors and sales channels
CHARACTERISTICS OF MARKETS AND TYPES OF CUSTOMERS
Distributors/end customers (B2B/B2C/B2G)
Our business is based on three main customer segments: B2B (business customers), B2C (individual customers) and B2G (institutional and public sector customers).
In the B2C area, 2024 was marked by intensive work to launch a state-of-the-art online shop, which is expected to become a key retail channel and strengthen the direct relationship with end users.
In the B2G segment, we continued our prospecting activities and participation in tenders, especially in the military sector, which fits in with our product and image competences. We are keeping an eye on trends, emerging environmental criteria and guidelines for procurers, which may in future influence the shape of the textile products procured by public institutions.
Since 2024, we have been developing a sewing service for third-party brands.
In 2024/2025, we conducted a survey to identify expectations, opinions and knowledge on sustainability among B2B and B2G customers.
The survey among B2B customers showed clear priorities related to supply chain transparency and the sustainability of the products offered. Both Polish and foreign partners most often pointed to the need for careful monitoring of the origin of raw materials and compliance with the law by suppliers, with representatives of foreign markets also emphasising ethical working conditions at sub-suppliers more than Poles. In the environmental area, the introduction of more sustainable products and efforts to reduce waste and educate customers on proper disposal were rated highest. There was, however, a noticeable difference: foreign distributors showed a greater willingness to reduce greenhouse gas emissions, while for Polish partners climate issues ranked lower in the rankings, showing a more sceptical stance towards climate issues.
Respondents also indicated the importance of lifecycle support - from replacement and repair to access to spare parts - although the preference for complete replacement of goods suggests the need for in-depth education on eco-design and extending the life of products. In open comments, distributors called for the implementation of less packaging, better communication and availability of spare parts.
Unfortunately, we did not receive even one response from the B2G group, which may be due to strong spam protection, low engagement or a lack of understanding of materiality analysis in ESG reporting.
SALES MARKET
Strategy and business model in the context of sales markets:
The Company’s sales are heavily concentrated in the European market (91.34% of revenues), due to its well-established operational position in the region and product compliance with EU regulations. Such a model provides regulatory predictability but limits strategic flexibility.
Sales to Asia (5.96%) and North and Central America (2.22%) remain marginal, although they may represent the seeds of future diversification. The remaining regions are symbolic (Africa - 0.26%, South America -0.17%, Oceania - 0.07%), indicating very limited global coverage.
Tytuł wykresu
With the adoption of the EU regulation on the eco-design of products, including textiles, our organisation is aware of the current definition of sustainable textile products. The key characteristics of future-oriented textile products - durability, longevity, repairability and reusability - have long been recognised as priority directions in the work of the Expertise, Product Development and Quality Control departments.
We systematically monitor and analyse the quality of our products, including their mechanical and service resistance. To this end, we plan to set up our own laboratory to carry out physical-mechanical tests on components used in both in-house and outsourced production. This will allow for faster detection and elimination of potential material weaknesses at the product development stage.
Quality Control and Complaints
Since 2022, we have been recording and analysing complaints made by B2C and B2B customers, including cases deemed to be unfounded. Details of the percentage of applications are shown below.
M percentage of complaints 2022-2024
However, we believe it is a valuable measure of the durability, failure rate and quality of our products - in line with the growing importance of sustainable textile products.
Despite the small number of applications, we are constantly developing our quality monitoring systems. We categorise the causes of complaints, building a database that allows us to make informed design decisions - regarding structural reinforcements, material optimisation or functional changes.
This process is also an organisational challenge: we are developing solutions to efficiently collect, aggregate and analyse data in a way that supports the development of the next generation of products.
We recognise that a sustainable textile product is one that can be repaired and reused. That is why, as part of the Eco-product project, we want to develop a system that allows customers to repair the products they have purchased. We currently offer this service on a limited basis - customers from Europe can send the product back to our head office, where it will be repaired and sent back by return post.
• Percentage of products repaired - 13% of products reported under complaints
• Percentage of products disposed of - 16% of products claimed
• Products that have been given a ‘second life’ through internal resale - 52% of products from claim returns.
• Cases handled remotely (no need for physical return) - 19% of complaints
With these measures, we want to maximise the life cycle of our products and reduce waste, in line with the principles of a circular economy.
In 2024, the percentage of complaints reported to Entire M for own and distributed brands was 0.07% in relation to the number of products sold.
This is a low indicator, but due to the lack of publicly available industry data, it is difficult to determine how we rank against the market.
Entire
We consciously analyse our carbon footprint to locate the main sources of emissions and manage them effectively. The calculations form the basis for internal reduction recommendations.
Organisational boundaries considered for this reporting period
Organisational boundaries have been defined in line with the principles contained in the GHG Protocol and the ISO 14064-1:2019 guidelines. The GHG Protocol provides for two different strategies to consolidate GHG emissions: the equity share approach and the control approach (financial or operational). For this report, Entire M, with its own brands Helikon-Tex and Direct Action, was included.
Carbon footprint The carbon footprint is the total amount of greenhouse gases emitted as a result of a company’s direct and indirect activities. Usually expressed in kilograms or tonnes of CO2 (kg or t CO2e).
Greenhouse gases (GHGs) are gases in the Earth’s atmosphere that cause the greenhouse effect - they contribute directly to climate change by increasing the Earth’s average temperature. The most common anthropogenic greenhouse gases in the atmosphere are carbon dioxide (CO2), methane (CH4) and nitrous oxide (N2O). The largest anthropogenic producers of greenhouse gases are the energy, agriculture and industry sectors.
The reduction in the carbon footprint for 2024 compared to earlier estimates is mainly due to the correction of data errors rather than the effects of reduction measures. The error was related to inconsistencies in the units and indicators in the software used for the calculations - see the descriptions of the individual emission categories for detailed explanations.
Scope 1
i.e. emissions from the combustion of fuels in stationary equipment, own and leased vehicles and fugitive emissions.
CO2 equivalent in Mg (tonnes)
Scope 1 Emissions
Scope 2
i.e. emissions
The increase in electricity consumption in 2024 compared to 2023 is due to more complete data.
In the current reporting period, energy consumption from all sewing plants was included on an annual basis, while in 2023, the data only covered the period from the start-up (spring 2023).
We are pleased to note the increase in the share of RES energy in the total energy mix in 2024 compared to 2023. The photovoltaic panels reached full capacity by operating all year round, which had a positive impact on the structure of energy consumption and the reduction of indirect emissions (Scope 2).Scope 3 of the carbon footprint includes all indirect GHG emissions that do not arise from the company’s direct operations or from purchased energy (Scope 1 and 2), but are related to the entire value chain - both upstream and downstream.
Scope 3
CATEGORY 1 - Purchased goods and services
Explanation of the decrease in emissions related to the purchase of office supplies (coffee, tea, cleaning products, office supplies):
In 2024, we started using a new, more detailed emissions database developed by the Plan Be Eco application. This database better reflects current market and technological conditions in the production of office supplies and has been developed on the basis of more recent and representative source data.
This change improves the compliance of the calculations with the GHG Protocol standard - particularly with regard to the emission allocation rules. As a result of the use of more precise emission factors, the value of emissions in this category has decreased, reflecting real changes in supply chains and progress towards more sustainable consumption.
Quantitative consumption of significant goods purchased in scope 3, category 1
Water consumption
In 2024, we have seen our water consumption double from the previous year. The main cause was the process of filling the retention tank associated with the start-up of the sprinkler system at the facility on Sosnowa Street. This system, linked to the internal hydrant network, is a key element of fire safety.
Thanks to this investment, we have significantly increased the security level of the facility - in 2025, the system will additionally be integrated into the monitor-
Aggregate water consumption for Entire M in 2023- 2024.
ing of the National Fire Service, which will enable a rapid response in the event of an emergency.
The process of filling the reservoir was felt by the local community in Miękinia - a temporary drop in water pressure was associated with inconvenience for some residents. Although the increase in consumption is not permanent, periodic water abstractions may be repeated in the future, e.g. in connection with mandatory inspections and functional tests of the system. We are aware of this impact and will strive to reduce inconvenience to the surrounding area as much as possible.
Packaging
Changes in packaging consumption in 2024
In 2024, the total weight of packaging used has decreased by 33% compared to the previous year. The main reason for this was lower order and production volumes, but not only that - the decrease is also a result of the activities of the “eco-packaging” programme, which has been implemented since 2023.
This project includes, among other things, the elimination of plastic packaging (so-called polybags) for non-clothing products and the gradual implementation of paper substitutes in the clothing category (so-called paperpacks).
Three groups dominate the structure of packaging consumption:
• Imported transport packaging - the predominant share by weight is made up of reinforced cardboard boxes used for sea transport from suppliers to warehouses.
• Transport packaging purchased - wooden pallets used in the supply chain to.
• Unit packaging - this mainly includes product hangers (hangtags and hangers) and foil packaging, the share of which is gradually declining in favour of paper and cardboard solutions.
Total weight of packaging used for Entire M in 2023-2024
Total weight of packaging used for Entire M in 2023 - 2024 by type of raw material
Total weight of packaging used for Entire M in 2023- 2024 by packaging type
Total weight of packaging used in 2024
Packaging by purpose
Packaging by raw material
Reducing the weight of packaging - a case study: glove packaging
In the case of the gloves produced on our behalf, despite a similar scale of orders to the previous year, the weight of packaging has decreased significantly. We ditched the foil in favour of a simple hanger made of uncoated recycled paper, which reduced the use of virgin raw materials and increased recyclability compared to 2023. This trend is illustrated in the chart below.
Helikon-Tex® brand gloves - comparison of pack weight [kg] by raw material
Below are the raw material consumption figures for in-house production in 2024
Raw materials purchased for production in own sewing plants
The transformation in the area of packaging was our first step in complying with the proposed PPWR, which sets new standards for sustainable packaging - including through the obligation to reduce weight and volume, the prohibition of unnecessary elements and the requirement to facilitate recycling.
Raw material requirements for finished goods production
In this overview, we present the raw material requirements for the production of Helikon-Tex and Direct Action private label products, distinguishing between the two main production models:
• In-house production - carried out at company-owned sewing facilities in Poland.
• Contract manufacturing - carried out by our regular production partners located in Asia and Europe.
Methodology and calculation assumptions
In order to estimate the annual consumption of raw materials in 2024, certain methodological simplifications have been adopted, resulting from the current stage of construction of the materials database:
• Plastics - structural components (e.g. buckles), pre-packaging (LDPE) and technical stiffening plates are included. Due to the lack of complete identification of polymers, this category has been treated collectively as ‘plastic’. Work is under way on the detailed classification of plastics, which in future will enable the precise assignment of emission factors.
• Metal components - includes metal alloy components (e.g. locks, eyelets, fasteners), classified collectively due to incomplete knowledge of material compositions. Data will be successively supplemented in the new raw material base.
• Textiles - nylon was the dominant raw material in 2024. Due to comparable CO2e emission factors and the predominant origin of the raw materials in Asia, other synthetic fibres (e.g. polyester, elastane) have been included collectively in this comparison.
Comparison of the total weight of glove unit packs between 2023 and 2024
Changes in raw material volumes - production context
The increase in total raw material consumption in 2024 relative to 2023 should be interpreted in the light of operational changes. In 2023:
• A significant proportion of the components were purchased in advance (in 2022), with a view to setting up two new sewing facilities;
• Full operation of all three sewing plants was not achieved until 2024, significantly increasing the scale of operations and material requirements.
Contract manufacturing - raw material requirements
A simplified approach, in line with the methodology used in previous years, was used to estimate the raw material consumption of the commissioned production of Helikon-Tex and Direct Action’s own brands in 2024. Due to the limited availability of primary data and the high labour intensity of data acquisition, the following assumptions were made:
• Material scope: only the main outdoor fabrics were analysed, based on their weights and raw material composition as declared by suppliers.
• Ancillary components: materials used for linings, internal components and accessories such as buttons, zips or buckles have been omitted.
• Product coverage: only products finally sold in 2024 under the Helikon-Tex and Direct Action brands are included. Small accessories (such as gloves, belts, hats) and products from distributed brands were excluded.
• Method of calculation: estimates were based on the actual number of units sold, not on quantities produced or purchased.
This approach resulted in a representative picture of the main material streams, with a reasonable workload. In the following years, it is planned to develop the internal material database so that auxiliary and additive materials can also be progressively included. This will allow a more comprehensive calculation of raw material consumption and associated emissions at a life-cycle level.
Raw material requirements for contract manufacturing
Raw material requirements for contract manufacturing 2024
Weight share of raw materials used for the finished product in outsourced production
In 2024, the demand for raw materials in the contract manufacturing of the Helikon-Tex and Direct Action brands increased in most major textile categories compared to the previous year. Synthetic fibres accounted for the largest share of the material structure, in particular:
• Polyester - 347.4 tonnes (+11% y/y),
• Nylon - 118.7 tonnes (+21% y/y),
• Cotton and organic cotton - 176.3 tonnes (+9% y/y).
In contrast, a decrease in more sustainable materials was observed, such as:
• merino wool, recycled polyester - their share fell to zero in the report.
These changes are due, among other things, to limitations in data availability and a simplified estimation methodology based on the composition of the main fabrics in the actual products sold. This approach does not include auxiliary components and additives, which means that the total raw material consumption of contract manufacturing is actually higher than the figures presented. However, in the coming years, we aim to include more components and commodity groups (e.g. hats, socks and other complementary accessories) in our reporting.
CATEGORY 2 - Issues related to the acquisition of capital goods
Impact of capital expenditure on carbon footprint
As in the previous year, an analysis was made of the three main product groups that make up a significant proportion of capital expenditure and at the same time influence the level of issuance associated with the capital purchase category.
In 2024, the base of emission factors used in the carbon footprint calculations, carried out in collaboration with the startup Plan Be Eco, was updated. The new methodology is based on more detailed and up-to-date source data and has been developed in accordance with the GHG Protocol’s emission allocation principles.
This change increases the transparency and comparability of the data, while better reflecting modern technological and market realities - including progress in decarbonising supply chains. In many cases, this results in lower specific emissions values, which translates into more precise and realistic reporting of environmental impacts.
As a result, issue values reported for some categories - including office furniture - may be significantly lower than last year, despite comparable purchase volumes. This difference is due to improvements in data quality and not directly due to reduction efforts on the part of the organisation.
These changes illustrate a shift in the structure of investments away from areas of high unit emissivity (e.g. furniture, real estate) towards items of a more functional nature, linked to operational development (e.g. equipment, machinery).
The observed decrease in the total carbon footprint resulting from investments is the result of the following changes:
• Office furniture - a significant 96% year-on-year decrease in expenditure, which had a direct impact on the reduction in emissions associated with this category.
• Electronic equipment - an increase in inputs of 52%, resulting in a partial increase in emissions, with this category having a lower mass share but a higher unit emissivity factor.
• Production equipment (sewing machines) - a significant increase in expenditure of 162% over 2023, linked to the further development of the production infrastructure.
• Real estate - no new developments in this area in 2024, in contrast to the previous year, which had a stabilising effect on the level of emissions in this category.
• Update of emission factors - new methodology Plan Be Eco
CATEGORY 3 WTT - Emissions associated with energy consumed for Entire M (not included in Scope 1 and 2) and arising during transport, distribution, transmission.
Category 4 - Emissions associated with upstream transport
CO2
Reducing emissions from transport
The observed decrease in greenhouse gas emissions in the transport category (Scope 3 - Backhaul transport and distribution) was due to a change in the mix of transport modes used in international logistics for the supply of components and finished products. Key drivers of the reduction included:
• Reduction in maritime transport - total tonne-kilometres fell by 24% y/y in favour of low-emission rail transport;
• Increased use of rail transport - an increase of 69% in tonne-kilometres y/y, resulting in a significant reduction in unit emissions compared to sea and air freight;
• Reduction in air transport - 75% decrease in tonne-kilometres y/y; air transport, despite its small volume share, has a high CO2e/km emission rate;
• Stable level of road transport, which remained at a similar level compared to 2023.
CATEGORY 5 - Emissions related to waste generated
Waste-related emissions
The observed decrease in waste-related GHG emissions in 2024 is not the result of targeted reduction measures, but is due to an update of the emission factors used in the calculations.
As Plan Be Eco, the company that supports us in reporting our carbon footprint, explains:
“The changes have been implemented in line with the principle of continuous improvement and in the spirit of transparency. We can assure you that the current metrics comply with current methodological standards and are a more reliable reflection of the actual emissions associated with the company’s operations.”
The new emission factors take into account changes in waste management systems, treatment process efficiencies and improved national and industry data, allowing a more precise estimation of emissions from operational waste.
Municipal waste - challenges and reflections
In 2024, we have seen an increase in waste across all municipal fractions. The largest share by weight is plastic waste, which largely comes from single-use packaging accompanying the purchase of ready meals delivered to the office every day. Although convenient and widely available, this solution entails a heavy environmental burden.
We recognise that it remains a challenge to change the daily habits of employees - both in terms of giving up single-use packaging and reducing purchases of food packaged in small, individual portions. However, we believe that through education and examples of good practice it will be possible to gradually reduce this type of waste.
List of municipal waste by weight
Municipal waste [hectolitres]
Ekwiwalent CO2 w Mg (tony)
Mixed waste, which is an important part of our waste balance, also requires special attention. It is a clear signal to us that, despite the availability of separate collection, some of the recyclable fractions still end up in mixed waste - often due to ignorance or unclear segregation.
In response to these challenges, we are planning an internal education campaign on the principles of separate waste collection in 2025.
We see increasing environmental awareness in the day-to-day running of the office as part of our environmental responsibility and organisational culture.
Specific waste associated with operational activities (BDO approach)
As part of our operations, we also generate waste specific to our company profile, which is classified and managed in accordance with the requirements of the BDO register. The main fractions of this waste include:
• Textile waste - Includes fabric offcuts from production processes (cutting, packaging) and damaged textile products that have been withdrawn from the market as a result of the complaints process. This fraction is a natural part of the production cycle in sewing factories and is an inherent result of working with textile materials on a large scale.
• Plastic packaging waste - Main sources are leftover courier packaging and security film (e.g. stretch). For reporting purposes, waste from the laser cutting process of plastic components is also included in this category. In terms of weight, their share remains marginal compared to packaging waste.
• Waste from cardboard packaging - Includes cardboard not used in the process of storage, further transport and damaged units that are not reusable. These are typical of warehouse and logistics operations.
All listed waste is recorded in accordance with current legislation and is managed in cooperation with authorised third parties.
Breakdown and weight of waste by sorted fraction (based on data from the National Waste Database) in 2023-2024
Packaging waste - cardboard
Cardboard waste is mainly generated as surplus transport packaging delivered from production sites. These cartons are reused - they are used to store products in the warehouse and to ship goods to distributors and customers.
Despite effective reuse, this left around 5.5 tonnes of cardboard classified as waste in 2024. The decrease in the overall weight of this waste relative to 2023 is due to increased demand for cardboard boxes for day-today logistics operations - mainly storage and shipping.
We are concerned to see an increase in the overall weight of plastic packaging waste and post-production waste - both textile and plastic.
This trend points to the need to strengthen waste reduction activities at source, to better prepare production.
CATEGORY 6 - Issues related to business travel
CO2 equivalent in Mg (tonnes)
Business travel - methodology and conclusions
There is no year-on-year decrease in emissions in the business travel category in 2024. The change in reported emissions is due to the use of an updated emissions factor implemented by Plan Be Eco.
As the methodology provider explains:
“The new indicator is based on up-to-date data and more advanced methods for estimating emissions from transport modes (in particular to the car without differentiating between fuel type, engine type and vehicle weight). It reflects current industry standards and more accurate energy consumption profiles.”
At the same time, it should be noted that at this stage we do not keep detailed records of the type of fuel and engine type in private and hired vehicles used for business travel. Given the marginal contribution of this category to our total carbon footprint (Scope 1, 2 and 3), and the relatively low efficiency of obtaining this data, it was decided to use an averaged emission factor for passenger cars, without distinguishing between propulsion types.
This approach is consistent with the principle of efficiency of data collection and proportionality of effort to environmental impact. This category will remain under scrutiny, as regular car journeys to the sewing room, made almost daily, account for an increasing share of business travel emissions. Due to the high carbon footprint of this mode of transport, this is an area where we have a direct impact
Business travel by car 2024
Percentage of car delegations (in km) by direction
CATEGORY 7 - Emissions related to employee commuting
Employee commuting - methodology and estimation
As last year, we conducted a survey of 10 per cent of employees in 2024, representing all locations - both offices and production facilities. Based on the responses, we scaled the results to the entire team of more than 300 people in order to estimate commuting emissions.
2023 2024 method of calculation
Employees’ commuting to and from the workplace 118.19 386.30 average data method
CO2 equivalent in Mg (tonnes)
The increase in the value of employee commuting emissions in 2024 is due to a change in the data collection methodology. Compared to 2023, which only considered one-way distance (home-to-work), 2024 uses an approach that includes the full distance travelled daily by the employee, i.e. the home-to-work-to-home route. This change provides greater data accuracy and a better reflection of the true impact of this category on Scope 3 emissions.
CATEGORY 8 - Leased assets (upstream) - not applicable to EntireM
CATEGORY 9 - Emissions from downstream transport and distribution
In 2024, emissions associated with the transport of finished products to customers and distributors were calculated using two methods:
• Dachser and DHL - two of the three major carriersprovided complete data on the carbon footprint of the services provided, an example of good cooperation and access to reliable, useful information.
• Small shipments (e-commerce and distributors) - we calculated the emissions ourselves with the help of a calculation application, based on data provided by UPS (weight and distance for each shipment).
Compared to the previous year, we saw a significant increase in reported emissions in this category. This change is not due to an increase in the scale of operations, but to the acquisition of more accurate source data.
In 2023, we used estimates based on average weights and distances. Now, thanks to earlier planning of the data acquisition process and better cooperation with carriers, reporting has reached a higher level of precision.
The significant increase in emissions in this category, despite using the same general methodology, is due to the updating of indicators and algorithms by Plan Be Eco
As the supplier explains:
“In this category, assumptions regarding frequency of use and energy consumption during laundering were verified. The new approach takes into account, among other things, the type of fabric, the energy efficiency of the washing machines and the typical habits of the users, which increases the reliability and comparability of the results.”
CATEGORY 12 - Emissions associated with the disposal of sold products
CATEGORY 10 - Emissions related to processing of products sold - not applicable to Entire M
CATEGORY 11 - Emissions from product use
In this category, emissions have been estimated for clothing only, assuming that the only significant source of emissions is the washing of clothing during use For non-clothing products, cleaning was assumed to be limited to wiping the surface, with no energy consumption.
Methodological assumptions:
• Washing is carried out according to the recommendations on the labels, i.e. at 30°C.
• We do not have market data or direct information from customers on the frequency of washing - estimates have been taken depending on the category (lighter garments washed more often, heavier garments - such as jackets - once a year at most).
• The calculation was based on the number of garments sold in 2024.
In 2024, emissions in this category were estimated for textile products such as clothing, bags and backpackssold under private labels. Due to the lack of uniform regulations for separate textile collection in the EU Member States (at the reporting date, textiles are not a separate, mandatory waste fraction like glass, plastic or biowaste), a conservative end-of-life assumption was made.
We assume that used textile products go to:
• fraction of mixed waste and then
• to landfill or incineration - depending on the prevailing waste management model in the country.
Explanation of the change in emissions in the product disposal category
The decrease in emissions in category 12 (disposal of products sold) is not due to the reduction measures implemented on the part of the company, but to the correction of an error in the unit adopted (the value was originally reported in kilograms rather than tonnes).
CO2
CO2
CO2
Plan Be Eco, responsible for the carbon footprint calculations, conveyed:
“All changes have been implemented in line with the principle of continuous improvement and in the spirit of transparency. We can assure you that the current metrics comply with current methodological standards and are a more reliable reflection of the actual emissions associated with the company’s operations.”
We believe that the current emission values better reflect the actual environmental impact, according to current databases and end-of-life scenarios.
CATEGORY 13, 14, 15 - i.e. Issues related to leased assets (downstream), Franchises, Investments - not applicable to Entire M
ADDITIONAL CATEGORY - Issues related to the digital presence of Entire M member sites on the web
Emissions related to digital presence (websites)
This approach identifies the environmental impact of digital activity, which, although relatively small, is significant in terms of the full picture of an organisation’s carbon footprint and can grow with the scale of e-commerce.
Carbon footprint - summary
As part of our outreach and sales activities, we operate three main websites:
• helikon-tex.com
• eu.directactiongear.com
• entirem.com
In 2024, for the purpose of assessing digital emissions, we added up the total number of hits on all three sites. Emissions calculations were carried out on the basis of:
• the number of page views,
• estimated energy consumption on servers and terminal equipment,
• averaged CO2e emission factors per input.
There are several internationally recognised methodologies and standards for calculating a carbon footprint. Entire M’s report was compiled by Plan Be Eco based on the GHG Protocol, data collected by the company and emission factors:
• Greenhouse gas reporting: conversion factors 2024.
• DEFRA The National Centre for Emissions Management (KOBiZE)
• EPA
• EXIOBASE
• BEIS
• A Carbon Footprint for UK Clothing and Opportunities for Savings
• Toyoshima’s
• Circular Ecology
• Tauron Market Economics Limited
Electricity was counted using the market-based method, which involves directly extracting data on greenhouse gas emissions emitted per unit of energy from the producer.
CO2
in Mg (tonnes)
CO2 equivalent in Mg (tonnes)
Summary of the carbon footprint reporting process
In 2024, with a great deal of effort, we were able to recalculate our organisation’s carbon footprint in full-covering all three scopes of emissions (Scope 1, 2 and 3). At the same time, we are aware of the limitations and imperfections accompanying the current stage of development of our reporting practices.
Key challenges include:
• Lack of an integrated system for collecting material and operational data - currently data is mainly obtained in the form of Excel sheets. In 2025, we plan to start building an internal reporting system that will make the data monitoring and verification process more consistent, automated and higher profile.
• In the course of working with the PlanBeEco app - we encountered significant inaccuracies and instability in the results. Fluctuations in emission rates - both increases and decreases - were often due to undocumented changes in application rates rather than real operational changes on the part of our organisation. This situation highlighted to us the risk of relying solely on external tools.
• Experience has confirmed that the development of reliable environmental data requires the strengthening of in-house expertise in emissions counting methodologies and data quality control.
• Immaturity of carbon footprint reporting systemsfrom an organisational perspective, we recognise that the process of capturing industry-specific emissions metrics is time-consuming and error-prone.
We also recognise that current limitations may affect the comparability of data between years - so methodological and source context is particularly important in interpreting the results.