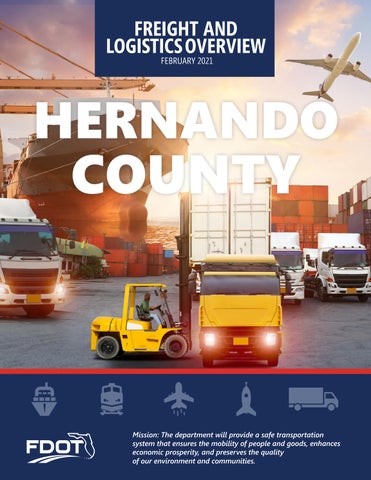
HERNANDO COUNTY
Mission: The department will provide a safe transportation system that ensures the mobility of people and goods, enhances economic prosperity, and preserves the quality of our environment and communities.
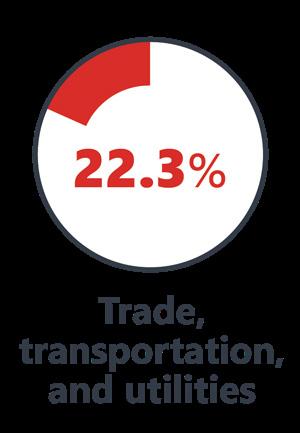


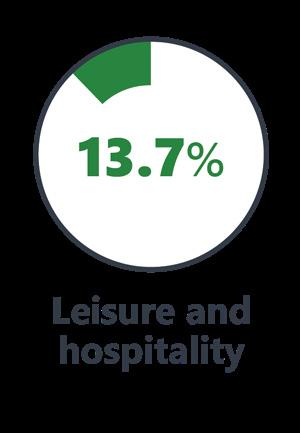
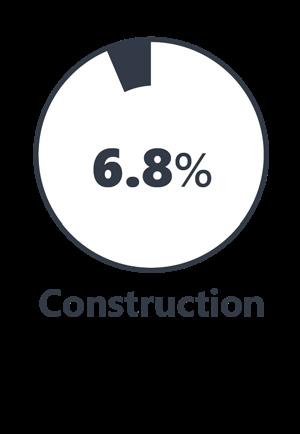
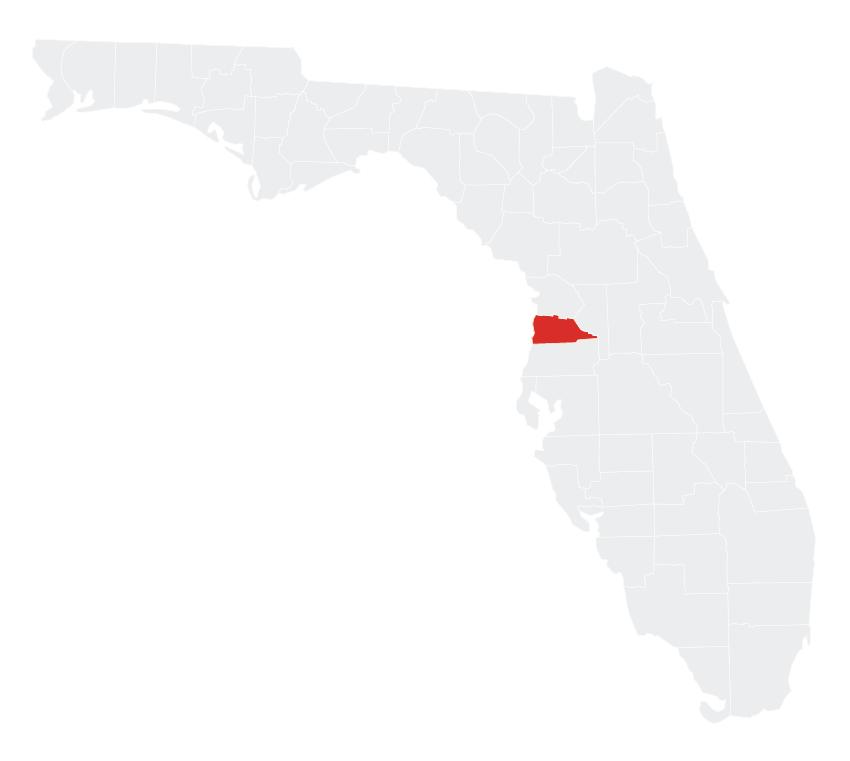
LARGEST INDUSTRY SECTORS BY EMPLOYMENT (2019) Office of Economic and Demographic Research HERNANDO COUNTY HIGHLIGHTS “FLORIDA’S ADVENTURE COAST” AREA ( SQ . MILES ) 589 COUNTY SEAT BROOKSVILLE LARGEST CITY ( SIZE ) BROOKSVILLE 2019 POPULATION 188,358 2019 EMPLOYMENT 45,069 Bureau of Economic Business Research Bureau of Labor Statistics POPULATION (Annual Growth Rate) + 1.00% EMPLOYMENT (Annual Growth Rate) + 2.76% DID YOU KNOW?
aviation services,
FASTEST GROWING INDUSTRIES (2010-2019) PROFESSIONAL AND BUSINESS SERVICES JOBS ADDED 2,202 EDUCATION AND HEALTH SERVICES 1,895 TRADE, TRANSPORTATION, AND UTILITIES 1,433 CONSTRUCTION 1,278 MANUFACTURING 1,074 Bureau of Labor Statistics
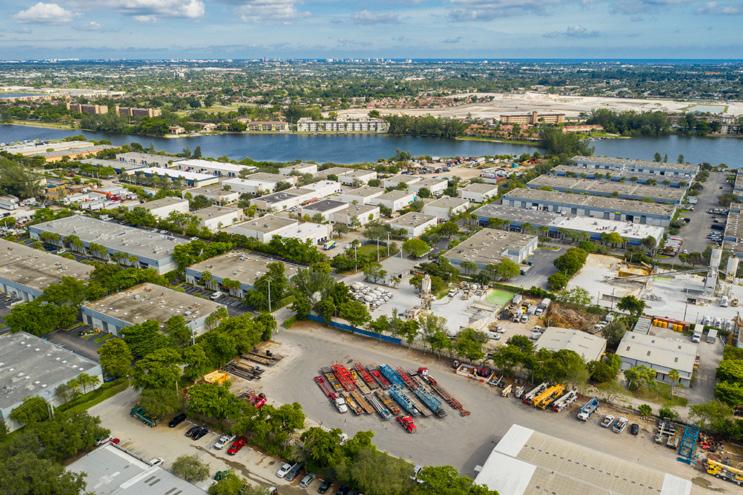
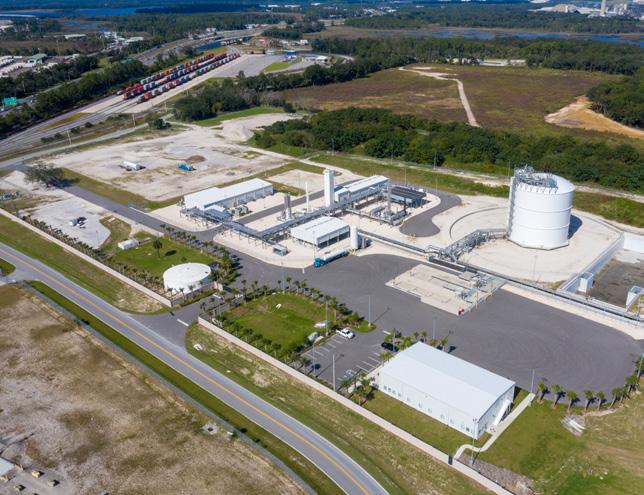
Hernando County is home to the Brooksville-Tampa Bay Regional Airport & Technology Center which offers first-class
and industrial/corporate land leasing. 23% of Hernando County land is agriculturally classified as Greenbelt. Ridge Manor, Hernando County is home to the largest (truck-to-truck) WalMart Distribution Center in the U.S. at approximately 1.6 million square feet (150,000 m2) in size.

IMPORTS WITHIN COUNTY EXPORTS
Value: TOP
TOP
by
COMMODITY FLOW HIGHLIGHTS
Warehouse, Distribution Center and
Movements $
Clay,
$
Petroleum or
Products $
$
Transportation Equipment $
Machinery $
Food
Products $
Fabricated
Products $
Chemicals or Allied Products $
Electrical Equipment $
2.01 M 2.21 M 0.38 M 97.1 K 13.57 M 4.92 M $ 1.23 B $ 1.62 B $ 26.35 M $ 34.95 M $ 0.59 B $ 0.73 B Transearch - Commodity Classification is based on Standard Transportation Commodity Code
digit codes
2018 2045 2018 2045 2018 2045 Tonnage:
COMMODITY by Tonnage, 2018
COMMODITY
Value, 2018
Nonmetallic Minerals 508,591 Nonmetallic Minerals 12,237,308 Clay, Concrete, Glass, Stone 323,677 Clay, Concrete, Glass, Stone 1,095,693 Petroleum or Coal Products 283,534 Waste or Scrap Materials 138,479 Warehouse, Distribution Center and Drayage Movements 267,783 Farm Products 25,195 Coal 236,172 Warehouse, Distribution Center and Drayage Movements 13,990
Drayage
454,981,585
Concrete, Glass, Stone
147,400,442
Coal
151,859,431 Nonmetallic Minerals
131,723,792
141,550,316
60,701,199
or Kindred
126,784,244
Metal
46,333,545
57,899,951
42,589,821
(STCC) 2
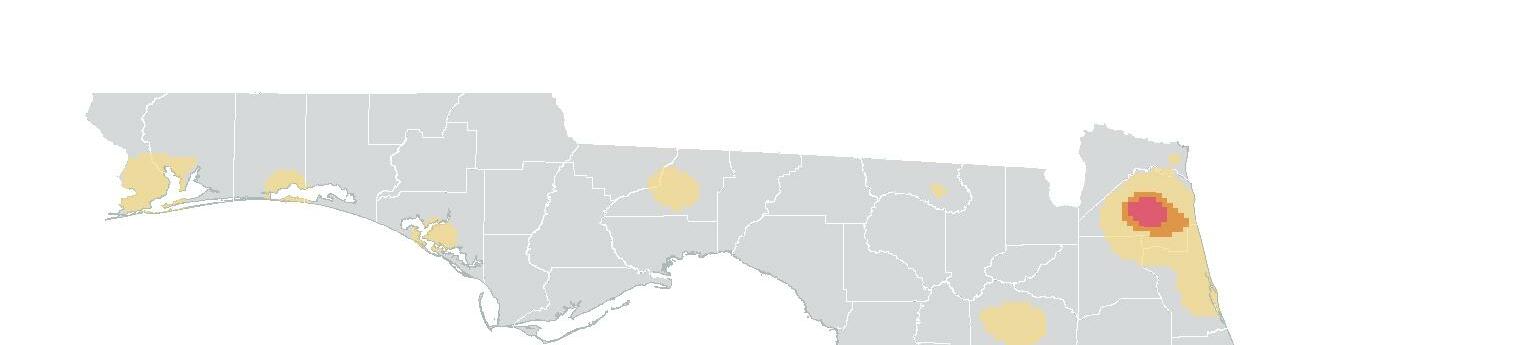
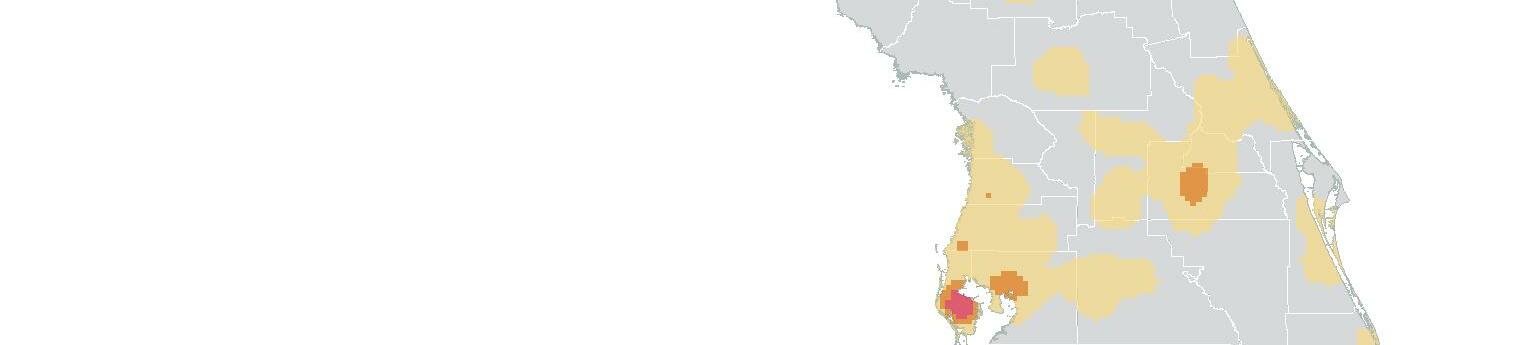
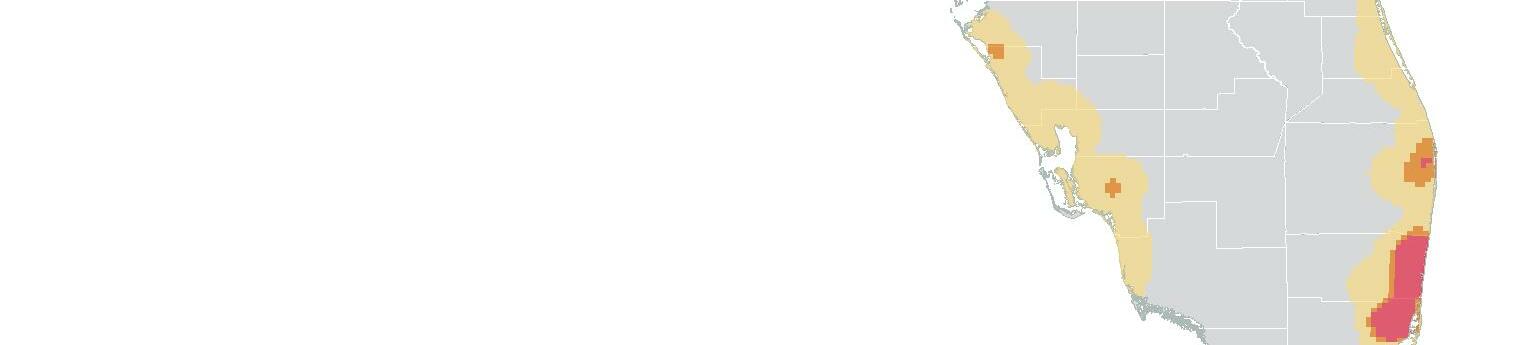
4 1 2 5 3 ! ! ! ! ! ! ! ! ! ! ! ! ! ! ! ! ! ! ! ! ! ! ! ! ! ! ! ! ! ! ! ! ! ! ! ! ! ! ! ! ! ! ! ! ! ! ! ! P ! ! P ! P 5 2 3 4 1 4 2 1 5 3 ! ! ! ! ! ! ! ! ! ! ! ! ! ! ! ! ! ! ! ! ! ! ! ! ! ! ! ! ! ! ! ! ! ! ! ! ! ! ! ! ! ! ! ! ! ! ! ! ! P ! P ! ! ! 2 4 1 3 5 HERNANDO COUNTY EXPORTS AND IMPORTS DOMESTIC EXPORTS ( TONS ) DOMESTIC IMPORTS ( TONS ) INTRASTATE EXPORTS ( TONS ) INTRASTATE IMPORTS ( TONS ) Transearch DOMESTIC EXPORTS (TONNAGE) 1 Georgia 130,494 2 North Carolina 77,302 3 Alabama 28,143 4 California 26,145 5 South Carolina 24,900 INTRASTATE EXPORTS (TONNAGE) 1 Hillsborough 4,751,865 2 Pasco 1,251,024 3 Orange 994,244 4 Pinellas 817,447 5 Palm Beach 630,228 DOMESTIC IMPORTS (TONNAGE) 1 Kentucky 237,808 2 Georgia 48,154 3 Alabama 33,298 4 Texas 20,324 5 Louisiana 15,206 INTRASTATE IMPORTS (TONNAGE) 1 Hillsborough 540,163 2 Pasco 111,660 3 Sumter 87,387 4 Miami-Dade 82,986 5 Citrus 75,427 ! <2K ! 2K-6K ! 6K-13K ! 13K-28K ! 28K-131K ! <2K ! 2K-7K ! 7K-20K ! 20K-48K ! 48K-238K <77K 77K-275K 275K-630K 630K-1.3M 1.3M-4.8M <8K 8K-26K 26K-50K 50K-112K 112K-541K
§ 75 £ ¤ 19 ? ? A A § ¨ ¦ 75 £ ¤ 98 £ ¤ 98 £ ¤ 301 £ ¤ 41 £ ¤ 41 £ ¤ 98 £ ¤ 19 Cemex-Brooksville Regency Technologies Barrette Outdoor Living Topline Machine Wal-Mart Distribution Center Hernando County Airport Citrus Pasco Sumter ® 5 ® 3 ® 2 ® 4 ® 1 CSXT SIS Rail SIS Highway National Highway Freight Network Other Roadways Major Freight Parcels Aviation Facility 0 2 4 1 Miles ¯ HERNANDO COUNTY FREIGHT INFRASTRUCTURE LARGEST FREIGHT EMPLOYERS 1 Walmart DC 1K-2K 2 Accuform Manufacturing 200-300 3 Barrette Outdoor Living 200-300 4 Aydin Displays 100-200 5 Micro Matic USA 100-200 MAJOR FREIGHT LAND USES 7.0 M SQ.FT Floor Area 70.68% Warehousing and distribution centers 15.61% Light manufacturing 4.60% Minerals processing and construction material plants 2.51% Utilities 2.40% Open storage 945.2 M SQ.FT LAND AREA 58.84% Sewage disposal and waste land 20.75% Mining lands, petroleum lands, or gas lands 8.74% Minerals processing and construction material plants 7.28% Utilities 3.05% Warehousing and distribution centers Florida Department of Economic Opportunity, 2018 Florida Department of Revenue, 2019
Includes parcels greater than 100K square feet floor area and are related to wholesale, retail, manufacturing, industrial, distribution centers, dairies, feed lots, utilities, mining, oil/gas lands and sewage/wastewater.
Major Freight Parcels:


FL Rank Commodity % Florida Share FL Rank Commodity % Florida Share 8 Coal 2.33% 2 Nonmetallic Minerals 11.86% 21 Misc. Manufacturing Products 1.04% 10 Misc. Manufacturing Products 2.76% 22 Waste or Scrap Materials 0.91% 14 Clay, Concrete, Glass, Stone 2.23% 29 Clay, Concrete, Glass, Stone 0.78% 13 Marine Products 0.92% 30 Warehouse, Distribution Center and Drayage Movements 0.63% 14 Electrical Equipment 0.88% FL Rank Commodity % Florida Share FL Rank Commodity % Florida Share 8 Coal 2.33% 3 Nonmetallic Minerals 8.69% 31 Clay, Concrete, Glass, Stone 0.61% 15 Clay, Concrete, Glass, Stone 1.94% 28 Warehouse, Distribution Center and Drayage Movements 0.58% 12 Marine Products 1.16% 37 Marine Products 0.39% 21 Fabricated Metal Products 0.84% 33 Petroleum or Coal Products 0.36% 20 Machinery 0.57% MAJOR COUNTY COMMODITIES IMPORTS EXPORTS TOP COMMODITY by Tonnage, 2018 (relative to Florida) TOP COMMODITY by Value, 2018 (relative to Florida)


97.22% TONNAGE 98.04% VALUE 2.78% TONNAGE 1.96% VALUE 0.00% TONNAGE 0.00% VALUE 0.00% TONNAGE 0.00% VALUE 50+ Miles Distance from closest airports (Tampa International Airport and Orlando International Airport) TRANSPORTATION STATISTICS AND FREIGHT MOVEMENT BY MODE 249 K Daily Truck Miles Traveled 1.23 Planning Time Index 1,812 Public Roadway Mileage 16.13 Class I Mainline Miles (CSX) - Class II Mainline Miles - Class III Mainline Miles 55 Miles Distance from closest seaport (Port Tampa Bay)
3rd most populous US State $1T Gross Domestic Product 4th Largest US Economy and 17th Largest Economy in World Nation’s 3rd largest workforce 1 in 5 U.S. exporters are located in Florida $153B International Trade 1.76M jobs supported by Trade, Transportation and Utilities industry sector 1.25M jobs supported by Leisure and Hospitality industry sector 131M annual visitors CAPITAL TALLAHASSEE AREA
SQ . MILES
53,624 LARGEST
POPULATION
ANNUAL POP
EMPLOYMENT
ANNUAL EMP
FLORIDA HIGHLIGHTS Bureau of Economic Business Research, Bureau of Labor Statistics INTERNATIONAL IMPORTS 1 CHINA $9.5B 2 JAPAN $6.5B 3 BRAZIL $6.4B 4 MEXICO $4.5B 5 CHILE $3.7B INTERNATIONAL EXPORTS 1 BRAZIL $13.4B 2 COLOMBIA $4.2B 3 ARGENTINA $3.6B 4 DOMINICAN REPUBLIC $3.1B 5 CHILE $3B DOMESTIC IMPORTS 1 GEORGIA $44B 2 CALIFORNIA $29B 3 TEXAS $26B 4 ALABAMA $18B 5 ILLINOIS $18B DOMESTIC EXPORTS 1 GEORGIA $22B 2 TEXAS $19B 3 CALIFORNIA $15B 4 NORTH CAROLINA $12B 5 NEW YORK $10B
(
)
CITY (SIZE) JACKSONVILLE
(2019) 21,208,589
GROWTH RATE (2010-2019) 1.4%
(2019) 8,884,065
GROWTH RATE (2010-2019) 2.8%


TRANSPORTATION STATISTICS AND FREIGHT MOVEMENT BY MODE 123,104 Public roadway mileage 12,130 State Highway System (SHS) mileage 30.7M Daily truck miles traveled on SHS 98 Public truck parking facilities 15 Deepwater seaports 4.1M Twenty-foot equivalent units (TEUs) 16.8M Annual cruise passengers 2,936 Miles of roads 6.9M Annual rail passenger traffic 5,899 Miles of gas transmission and hazardous liquid pipelines Includes shipments by multiple modes and by parcel delivery services, U.S. Postal Service, or couriers (capped at 150 pounds). This category is not limited to containerized or trailer-on-flatcar shipments. 129 Public use airports 20 Commercial service airports 2 Active spaceports 83% TONNAGE 3.5% TONNAGE 6.7% TONNAGE 0.1% TONNAGE 3.6% TONNAGE 3.1% TONNAGE 71% VALUE 2.9% VALUE 1.8% VALUE 5.4% VALUE 1% VALUE 17.9% VALUE Freight Analysis Framework Transportation Data and Analysis Office (FDOT) Freight and Multi-modal Operations Office (FDOT)


§ 75 § 75 Pensacola Orlando Miami Tampa Jacksonville Tallahassee § ¨ 10 § 75 § ¨ 4 § ¨ 95  ¾ Spaceports ¾ ¾ Àí Seaports  À ¾ Commercial Service Airports Interstates Railway Corridors Turnpike Freight Activity Low Medium High ¾ ¾ í ¾ ¾ Àí ¾ ¾ Àí ¾ ¾ Àí ¾ ¾ Àí ¾ ¾ Àí ¾ ¾ Àí ¾ ¾ Àí ¾ ¾ Àí ¾ ¾ Àí ¾ ¾ Àí ¾ ¾ Àí ¾ ¾ Àí ¾ ¾ Àí ¾ ¾ Àí  À ¾  À ¾  À  À ¾  À ¾  À ¾  À ¾  À ¾  À ¾  À ¾  À ¾  À ¾  À ¾  À ¾  À ¾  À ¾  À ¾  À ¾  À ¾  À ¾ Rickey Fitzgerald Manager, Freight & Multimodal Operations Florida Department of Transportation 605 Suwannee Street, Tallahassee, FL 32399 Rickey.Fitzgerald@dot.state.fl.us 850.414.4702 FLORIDA COMMODITY FLOWS (2018-2045) IMPORTS WITHIN FL EXPORTS 20182045 20182045 20182045 TONNAGE 142M190M656M761M57M103M VALUE $321B $690B $402B$844B$180B$606B Freight Analysis Framework (FAF) 4.5.1.