THE BOULDERS

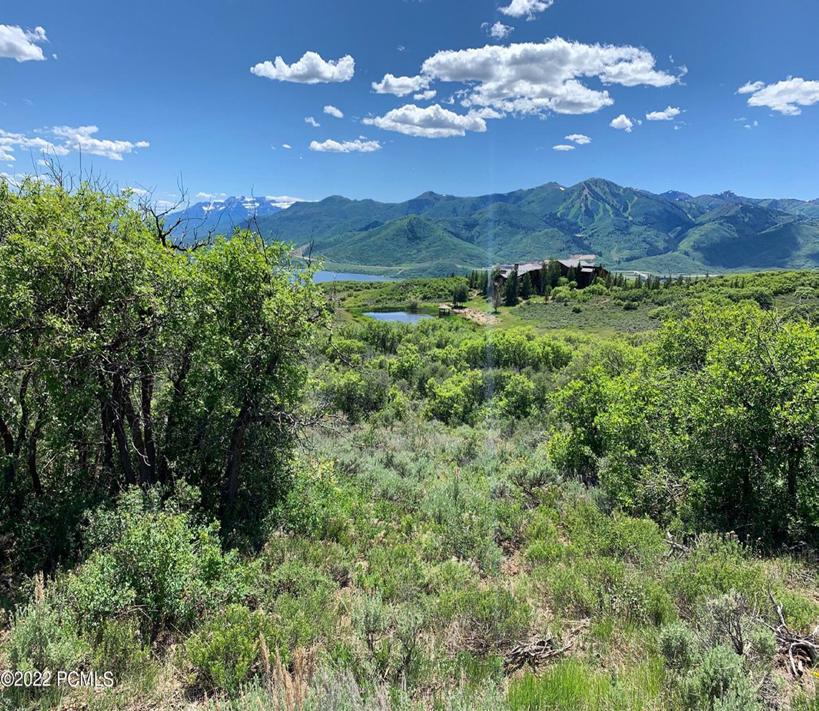
VIEWS FROM TIMPANOGOS TO SNOWBASIN BouldersParkCity.com
Utah’s Best Resort Development Opportunity
The Boulders


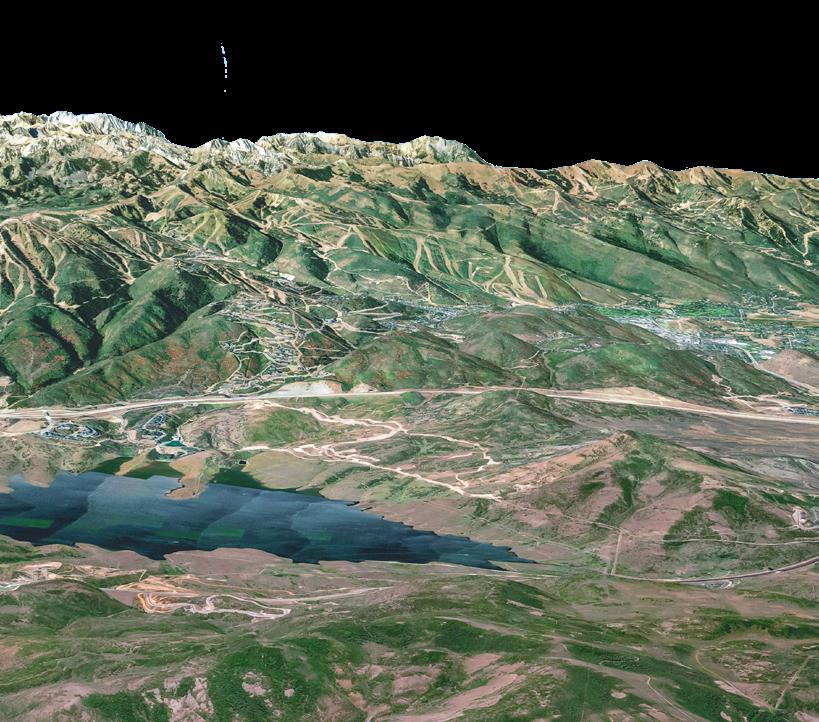
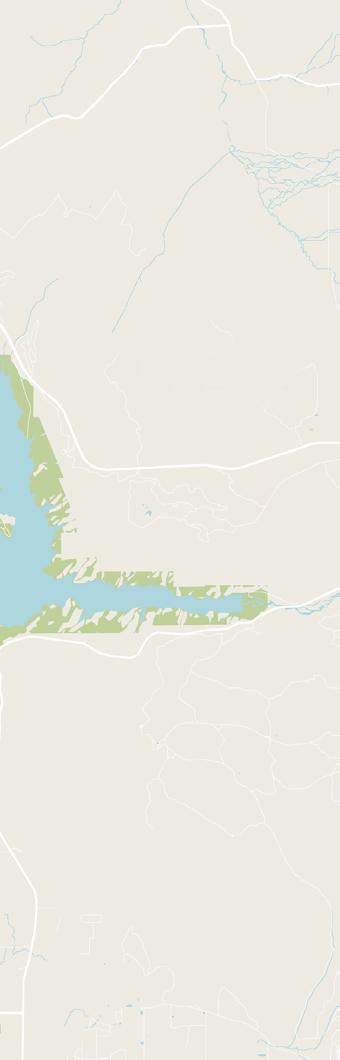
MT TIMPANOGOS MIDWAY TUHAYE Jordanelle Reservoir Provo River THE BOULDERS
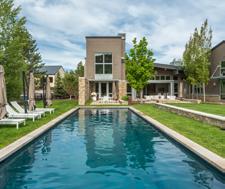
is perfectly situated for a four-seasons resort development. Only minutes away from the best of Park City, including fabulous dining and entertainment on historic Main Street and endless recreation opportunities at the nearby world-class ski areas, on the Jordanelle Reservoir, and on the Provo River. The nearby Uintah Wilderness area also offers endless opportunities. Panoramic views of the Wasatch and Uinta Mountains abound from this rare property. PROPERTY OVERVIEW 1120 State Road 248 | Hideout

PARK CITY PARK CITY RESORT DEER VALLEY RESORT SIZE 114.63 acres PRICE $25,000,000 PARCELS 00-0020-8181 00-0020-8182 00-0020-8184 00-0020-8185 ZONING Mountain Residential CITY Hideout
CONCEPT PLAN
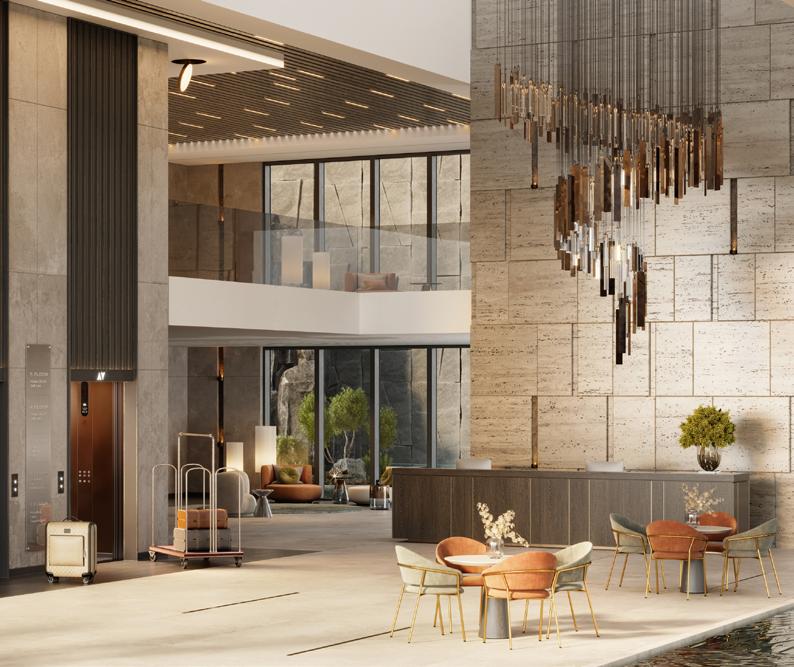
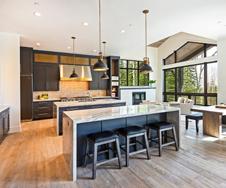
Created to meet the present and future needs of the Town of Hideout, the example Concept Master Plan for Boulders was created by Pete Gillwald from the renowned local land planning firm Land Solutions. Land Solutions was the creator of High Star Ranch, and was involved in land planning for The Colony at White Pine Canyon, among other storied local developments. This exciting concept embodies the mixed use principle, including a commercial village, a boutique hotel, condominiums, townhomes, cottages and single family homes. All of these could be integrated into one highly amenitized resort community.
This Concept is not binding on the developer, but has been the subject of discussions with Hideout and was favorably received.


LOCAL AMENITIES & ATTRACTIONS
PARK CITY
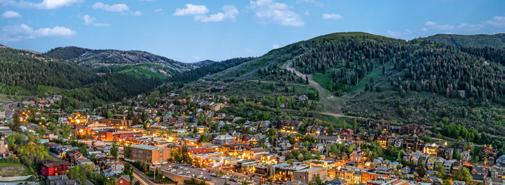
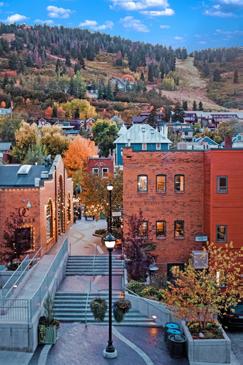
America’s Favorite Ski Town offers endless entertainment, shopping, and dining.
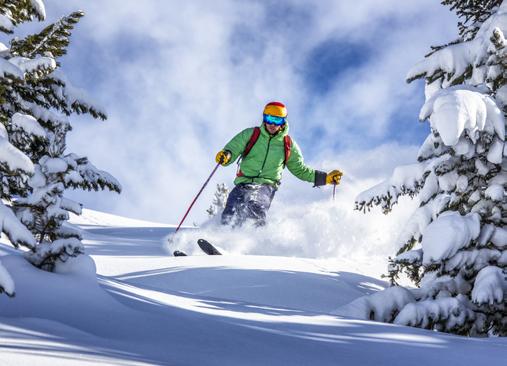
OUR SKI RESORTS
There are 10 world-class ski resorts within a onehour radius of the Salt Lake airport, with Park City and Deer Valley resorts located in the heart of Park City.
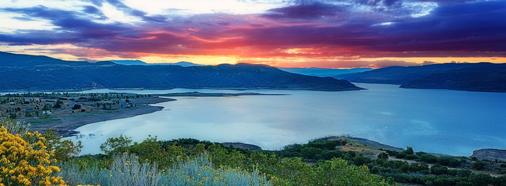
JORDANELLE RESERVOIR
This 3,068 acre reservoir is the ideal setting for boaters, water-skiers and wave-runners, with sandy beaches and day-use cabanas, minutes from The Boulders.
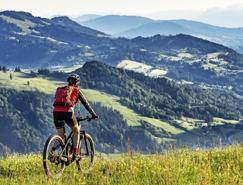
MOUNTAIN TRAILS
The hills surrounding Park City offer more than 400 miles of public trails ideal for spectacular hiking and biking recreation.

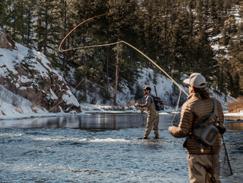
FISHING
Utah is home to diverse fly fishing opportunities, from high alpine lakes and streams to cottonwood lined subalpine valleys.

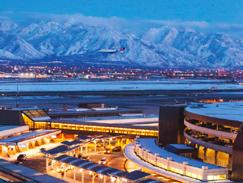
SLC INT’L AIRPORT
The Salt Lake International Airport is a mere 40-minute drive, making Park City one of the top 2nd home destinations in the country.

Ivory-Boyer CONSTRUCTION REPORT
Ivory-Boyer CONSTRUCTION REPORT
increases, permitted construction value Q1 and 2022 Q1. During the first three permitted construction value reached $3.46 over the same time period from 2021. The drop in nonresidential construction activity. construction value declined by 16.0% from Q1 2022 Q1. construction value reached $2.37 billion in the first surpassing last year’s record by 15.0%. Additions, permitted values decreased 38.6% from
“Utah bounced back in 2021 from the pandemic recession shock. Nationally, the jobs base is still 3.3% smaller than prepandemic. In 2021, only Utah and Idaho had more jobs than in 2019. The leisure, hospitality and mining industries have yet to reach their 2019 peaks. The travel and tourism sector shone bright in 2021. Despite operating under pandemic conditions and international travel restrictions, Utah ski resorts experienced a record number of skier visits during the 2020-21 season. Preliminary data suggest that visitors to Utah’s state and national parks also hit a record high in 2021.”
After three years of increases, permitted construction value decreased between 2021 Q1 and 2022 Q1. During the first three months of 2022, total permitted construction value reached $3.46 billion, a 2.2% decrease over the same time period from 2021. The decline was led by a drop in nonresidential construction activity. Nonresidential construction value declined by 16.0% from Q1 2021 to $0.68 billion in 2022 Q1. Residential construction value reached $2.37 billion in the first quarter of 2022, surpassing last year’s record by 15.0%. Additions, alterations, and repairs permitted values decreased 38.6% from 2021 to $0.41 billion.
Table 1: First Quarter 2022 Construction Highlights to first quarter 2021) (billions)
Total $3.46 $2.37 $0.68 $0.41
dwelling units continued their recordyear into 2022. Residential permitted units 9.3% since 2021 Q1 and setting a record Single-family permitted units decreased Condos, townhomes, and duplexes also set permitted, an increase of 8.3% over last is up 82.4% from last year, with a record
Median Sales Price
Total 9,722 53
Source: Ivory-Boyer Construction Database
Residential Construction
Residential Construction
MEDIAN SALES PRICE IN UTAH
Permit-authorized dwelling units continued their recordsetting pace from last year into 2022. Residential permitted units reached 9,722, increasing 9.3% since 2021 Q1 and setting a record the first quarter. Single-family permitted units decreased 17.7% to 4,055 units. Condos, townhomes, and duplexes also set record with 2,156 units permitted, an increase of 8.3% over last year. Apartment activity is up 82.4% from last year, with a record 3,458 units permitted.
Figure 1: Value of Permit-Authorized Construction in Utah, January–March 2000–2022 (Millions of Constant 2022 Dollars)
As inflationary pressures push interest rates higher, the new forsale market is expected to see a decline as reflected in singlefamily permitted units. However, the first quarter of 2022 saw 9,722 new permitted units. This is a 9.3% increase, beating out the previous record set in 2021 (see Figure 2). Single-family permitted units decreased 17.7% from 2021, hitting 4,055 in the first three months. Permitted multifamily units increased 44.4% from 2021, with 5,614 units in the first quarter.
As inflationary pressures push interest rates higher, the new sale market is expected to see a decline as reflected in family permitted units. However, the first quarter of 2022 9,722 new permitted units. This is a 9.3% increase, beating out previous record set in 2021 (see Figure 2). Single-family permitted units decreased 17.7% from 2021, hitting 4,055 in the first months. Permitted multifamily units increased 44.4% from with 5,614 units in the first quarter.
Utah County continues to lead the state in single-family permits, approving 1,341 new units in the first quarter; however, this represents a 20.2% decrease from 2021 (see Table 2). Washington County issued 609 single-family permits, a 30.4% decline. Among cities, Eagle Mountain leads the state in single-family permits through the first quarter, permitting 321 units, a decrease of 23.0% from last year (see Table 3). St. George is second, permitting 252 single-family units, a decrease of 33.5% over the first quarter of 2021. The increase in multifamily activity is likely the result of affordability woes plaguing the market. Multifamily permitted units increased 44.4% in the first quarter of 2022 to 5,614, a record for the first three months (see Figure 3). The increase was driven
Utah County continues to lead the state in single-family permits, approving 1,341 new units in the first quarter; however, represents a 20.2% decrease from 2021 (see Table 2). Washington County issued 609 single-family permits, a 30.4% decline. Among cities, Eagle Mountain leads the state in single-family permits through the first quarter, permitting 321 units, a decrease of from last year (see Table 3). St. George is second, permitting single-family units, a decrease of 33.5% over the first quarter of The increase in multifamily activity is likely the result affordability woes plaguing the market. Multifamily permitted units increased 44.4% in the first quarter of 2022 to 5,614, a for the first three months (see Figure 3). The increase was
THE LOCAL Real Estate Market
August 2021 September October 2021 November December January 2022 February 2022 March 2022 April 2022 May 2022 June 2022 July 2022 12-Month Avg* Historical Median Sales Price by Month Point at which half of the sales sold for more and half sold for less, not accounting for seller concessions, in a given month. Median Sales * Median Sales not the average $354,000 $455,000 $508,000 2020 2021 2022 July $600,000 $340,000 $425,000 $520,000 2020 2021 2022 Year to Date + 22.4%+ 28.5%+ 11.6% + 25.0%+ 10.6% + 7.9%
Published July 2022
$0 $500 $1,000 $1,500 $2,000 $2,500 $3,000 $3,500 $4,000 2000 2001 2002 2003 2004 2005 2006 2007 2008 2009 2010 2011 2012 2013 2014 2015 2016 2017 2018 2019 2020 2021 2022 Total Residential Nonresidential Additions/Alterations/Repairs $0 $100 $200 $300 $400 $500 $600 $700 $800 2000 2001 2002 2003 2004 2005 2006 2007 2008 2009 2010 2011 2012 2013 2014 2015 2016 2017 2018 2019 2020 2021 Millions Total Nonresidential Residential
(All values compared
Value
Change
Construction Value
Residential Valuation
Nonresidential Valuation
Additions, Alterations, and Repairs
Value (actuals) Change
New Dwelling Units
Single Family 4,055 Condo/Townhome/Duplex 2,156 Apartments (3+ units) 3,458 All Other Units
Published July 2022
2006 2007 2008 2009 2010 2011 2012 2013 2014 2015 2016 2017 2018 2019 2020 2021 2022 Residential Nonresidential Additions/Alterations/Repairs $0 $100 $200 $300 $400 $500 $600 $700 $800 2000 2001 2002 2003 2004 2005 2006 2007 2008 2009 2010 2011 2012 2013 2014 2015 2016 2017 2018 2019 2020 2021 2022 Millions Total Nonresidential Residential Table 1: First Quarter 2022 Construction Highlights (All values compared to first quarter 2021) Value (billions) Change Total Construction Value $3.46 -2.2% Residential Valuation $2.37 15.0% Nonresidential Valuation $0.68 -16.0% Additions, Alterations, and Repairs $0.41 -38.6% Value (actuals) Change Total New Dwelling Units 9,722 9.3% Single Family 4,055 -17.7% Condo/Townhome/Duplex 2,156 8.3% Apartments (3+ units) 3,458 82.4% All Other Units 53 -36.1% Source: Ivory-Boyer Construction Database Permit-Authorized Construction in Utah, 2000–2022 Dollars) CONSTRUCTION HIGHLIGHTS (1st Quarter 2022 - Ivory-Boyer Construction Report) July 2022 Report - Utah Association Of Realtors Ivory-Boyer Real Estate Center - 2022 1st Qtr Report
“Net in-migration reached a 16-year high in 2021, with nearly 35,000 new residents moving in from out of state. Population growth, combined with job and wage growth and low interest rates, fueled the ongoing real estate and construction boom. The value of nonresidential construction reached a new peak of $2.7 billion, and builders permitted a record 35,500 new dwelling units, despite supply chain challenges and price pressures. Strong demand continues to boost home prices, which increased a neverexperienced 23.5% over the year.

The consensus forecast predicts another year of substantial economic expansion in Utah in 2022. Utah’s fundamental advantages—a youthful demographic profile, economic diversity, a stable fiscal and regulatory environment, crossroads of the west location, global connections, and social cohesion—will continue to influence the state’s economic position in 2022 and beyond.
As long as major risks to the national expansion are not realized, Utah’s economy will once again be among the best in the nation.”
2022 Economic Report To The Governor, Utah
$0 $500 $1,000 $1,500 $2,000 $2,500 $3,000 $3,500 $4,000
2000 2001 2002 2003 Millions
Trade, Trans., Utilities
Other Services Government Information Ed. & Health Svcs. Prof. & Bus. Svcs.
Permitted Units
$0 $100 $200 $300 $400 $500 $600 $700 $800
0 2,000 4,000 6,000 8,000 10,000 12,000
Permitted Units
0 2,000 4,000 6,000 8,000 10,000 12,000
All Jobs 3.3% [+51,600]
Total Residential Nonresidential Additions/Alterations/Repairs
Figure 2: Permits Issued for Residential Units in Utah, January–March 2000–2022
2000 2001 2002 2003 Millions
All Jobs 3.3% [+51,600]
Market STATS2022 Economic Report to the Governor
2021: Major bounce back from pandemic shock 2022:
Leisure & Hospitality Mining
2000 2001 2002 2003 2004 2021 2022
Total Nonresidential Residential
Total Single-Family Multifamily
nonresidential construction reached a new peak of $2.7 billion, and builders permitted a record 35,500 new dwelling units, despite supply-chain challenges and price pressures. Strong demand continues to boost home prices, which increased a neverexperienced 23.5% over the year.
$0 $5,000 $10,000 $15,000 2011 Millions of Nominal Dollars
2000 2001 2002 2003 2021
Source: Ivory-Boyer Construction Database
Figure 3: Permits Issued for Multifamily Units by Type, January–March 2000–2022
Table 2: Top-Ranked Counties for Detached Single-Family Home Permits, January–March 2021 and 2022
Net Migration Natural Increase Population Change -20,000 0 20,000 40,000 60,000 80,000
0 1,000 2,000 3,000 4,000 5,000 6,000
2011 2012 2013 2014 2015 2016 2017 2018 2019 2020 Millions of Nominal Dollars[+13,900] [+7,900] [+6,000] 12.4% [+13,600]
County 2021 2022 Change
Permitted Units
Utah 1,680 1,341 -20.2%
Washington 875 609 -30.4%
Total Single-Family Multifamily 0 1,000 2,000 3,000 4,000 5,000 6,000
Salt Lake 713 458 -35.8%
Utah U.S. -8.1% [-800] -3.1% [-4,800] 0.0% [0] 0.7% [+1,800] 1.3% [+500] 2.7% [+5,600] 3.5% [+7,800] 4.8% [+13,900]
Davis 405 391 -3.5% Weber 203 226 11.3%
Source: Ivory-Boyer Construction Database
2000 2001 2002
The consensus forecast predicts another year of substantial economic expansion in Utah in 2022. The most pressing internal risks will be growth-driven challenges like a limited labor supply, increasing costs, and housing affordability. Declining fertility, air quality, and water challenges will also add pressure. COVID-19 and inflation pose additional downside risks.
Permitted Units Multifamily Apartments Condos/Townhome/Duplex
2000 2001 2002 2003
Source: Ivory-Boyer Construction Database
Table 4: Top-Ranked Counties for Multifamily Permits, January–March 2022
Ivory-Boyer Real Estate Center - 2022 1st Qtr Report
1960 1964 1968 1972 1976 1980 1984 1988 1992 1996 2000 2004 2008 2012 2016 2020
County Apartment Units Condo, Townhome, and Duplex Units Total Multifamily Units
Salt Lake 2,095 385 2,480
Utah 776 869 1,645
$0 $200 $400 $600 $800 $1,000 $1,200
Utah's fundamental profile, economic environment, crossroads and social cohesion—will economic position the national expansion again be among $10,000 $12,000 $14,000 Total Nonresidential Residential Additions/Alterations/Repairs 18,968 19,260 16,111 12,224 13,308 12,078 11,583 14,390 17,340 17,674 $0 $5,000 $10,000 $15,000 $20,000 $25,000
Davis 365 193 558 Washington 42 170 212 Weber 107 100 207
Source: Ivory-Boyer Construction Database
2000 2001 2002 2003 2004 2012 2019 2020 2021 2022 Millions
Utah Value of New Construction, 2000–2022f Utah National $0 $2,000 $4,000 $6,000 $8,000 $10,000 $12,000 $14,000 2000 2001 2002 ($ millions) 8.0 10.0 12.0 Millions
Note: Ski seasons include year (i.e., 2019 represents
Utah Economic Dashboard - Kem C. Policy Institute - Sept 2022
2004 2005 2006 2007 2008 2009 2010 2011 2012 2013 2014 2015 2016 2017 2018 2019 2020 2021 2022
2004 2005 2006 2007 2008 2009 2010 2011 2012 2013 2014 2015 2016 2017 2018 2019 2020
2022
2003 2004 2005 2006 2007 2008 2009 2010 2011 2012 2013 2014 2015 2016 2017 2018 2019 2020 2021 2022
2004 2005 2006 2007 2008 2009 2010 2011 2012 2013 2014 2015 2016 2017 2018 2019 2020 2021 2022
2005 2006 2007 2008 2009 2010 2011 2012 2013 2014 2015 2016 2017 2018 2019 2020
2004 2005 2006 2007 2008 2009 2010 2011 2012 2013 2014 2015 2016 2017 2018 2019 2020 2021 2022
2005 2006 2007 2008 2009 2010 2011
2013 2014 2015 2016 2017 2018
12% 10% 8% 6%
Gardner
U.S.: -3.3% -0.9% -0.6% 0.0% 3.3%
Utah: 2.7% U.S: 5.4%Diversity,
construction value
During the first three value reached $3.46 period from 2021. The construction activity. 16.0% from Q1
billion in the first 15.0%. Additions, decreased 38.6% from
continued their recordpermitted units setting a record units decreased duplexes also set of 8.3% over last year, with a record
Construction in Utah,
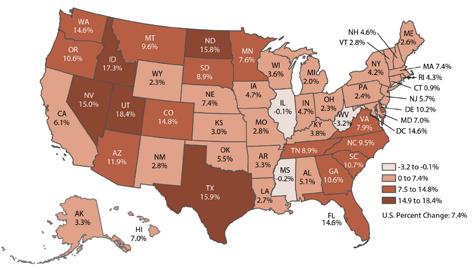
Hawaii New York Louisiana Alaska Vermont Arkansas Montana Arizona Utah Idaho
First Quarter 2022
Mining, 0.5%
Government, 15.9%
Leisure & Hospitality, 9.2% Other Services, 2.6%
Education & Health Services, 13.4%
Oregon, Arizona, Colorado, Washington, and California all have larger economies than Utah, but only Arizona has a higher Hachman Index score, and that by less than half a point. States with similar-sized economies include Alabama, Kentucky, Iowa, and Oklahoma. Of these, only Alabama has an index score above 90, indicating a very diverse economy. Alabama scores 91.2, Kentucky 89.8, Iowa 78.7, and Oklahoma the lowest at 70.3. Despite Utah’s midsized economy (29th largest), its industrial composition is more diverse than even the largest states.
2020 total job count: 1.54 million
Construction, 7.6% 9.0%
Ivory-Boyer CONSTRUCTION REPORT
Trade, Trans., Utilities, 18.9%
Information, 2.5%
CONSTRUCTION REPORT
Professional & Business Services, 14.4%
Table 1: First Quarter 2022 Construction Highlights
After three years of increases, permitted construction value decreased between 2021 Q1 and 2022 Q1. During the first three months of 2022, total permitted construction value reached $3.46 billion, a 2.2% decrease over the same time period from 2021. The decline was led by a drop in nonresidential construction activity. Nonresidential construction value declined by 16.0% from Q1 2021 to $0.68 billion in 2022 Q1.
Financial Activity, 6.0%
(All values compared to first quarter 2021)
Value (billions) Change
Total Construction Value $3.46 -2.2%
Residential Valuation $2.37 15.0%
Residential construction value reached $2.37 billion in the first quarter of 2022, surpassing last year’s record by 15.0%. Additions, alterations, and repairs permitted values decreased 38.6% from 2021 to $0.41 billion.
Nonresidential Valuation $0.68 -16.0%
Additions, Alterations, and Repairs $0.41 -38.6%
Value (actuals) Change
Total New Dwelling Units 9,722 9.3%
Single Family 4,055 -17.7%
Condo/Townhome/Duplex 2,156 8.3%
Apartments (3+ units) 3,458 82.4%
All Other Units 53 -36.1%
Permit-authorized dwelling units continued their recordsetting pace from last year into 2022. Residential permitted units reached 9,722, increasing 9.3% since 2021 Q1 and setting a record for the first quarter. Single-family permitted units decreased 17.7% to 4,055 units. Condos, townhomes, and duplexes also set a record with 2,156 units permitted, an increase of 8.3% over last year. Apartment activity is up 82.4% from last year, with a record 3,458 units permitted.
Source: Database
Residential Construction
As inflationary pressures push interest rates higher, the new forsale market is expected to see a decline as reflected in singlefamily permitted units. However, the first quarter of 2022 saw 9,722 new permitted units. This is a 9.3% increase, beating out the previous record set in 2021 (see Figure 2). Single-family permitted units decreased 17.7% from 2021, hitting 4,055 in the first three months. Permitted multifamily units increased 44.4% from 2021, with 5,614 units in the first quarter.
Table 1: First Quarter 2022 Construction Highlights (All values compared to first quarter 2021)
Value (billions) Change
Total Construction Value $3.46 -2.2%
Residential Valuation $2.37 15.0%
Nonresidential Valuation $0.68 -16.0%
Additions, Alterations, and Repairs $0.41 -38.6%
Value (actuals) Change
Total New Dwelling Units 9,722 9.3%
Single Family 4,055 -17.7%
Condo/Townhome/Duplex 2,156 8.3% Apartments (3+ units) 3,458 82.4%
All Other Units 53 -36.1%
Source: Ivory-Boyer Construction Database (Most Diverse) 90.0 - 94.9 85.0 - 89.9 75.0 - 84.9 <75.0 (Least Diverse)
Residential Construction
Utah’s Leads the
As inflationary pressures push interest rates higher, the new forsale market is expected to see a decline as reflected in singlefamily permitted units. However, the first quarter of 2022 saw 9,722 new permitted units. This is a 9.3% increase, beating out the previous record set in 2021 (see Figure 2). Single-family permitted units decreased 17.7% from 2021, hitting 4,055 in the first three months. Permitted multifamily units increased 44.4% from 2021,
Utah County continues to lead the state in single-family permits, approving 1,341 new units in the first quarter; however, this represents a 20.2% decrease from 2021 (see Table 2). Washington County issued 609 single-family permits, a 30.4% decline. Among cities, Eagle Mountain leads the state in single-family permits through the first quarter, permitting 321 units, a decrease of 23.0% from last year (see Table 3). St. George is second, permitting 252 single-family units, a decrease of 33.5% over the first quarter of 2021. The increase in multifamily activity is likely the result of affordability woes plaguing the market. Multifamily permitted units increased 44.4% in the first quarter of 2022 to 5,614, a record for the first three months (see Figure 3). The increase was driven 2000 2001 2002 Millions 2017 2018 2019 2020 2021 2022 Residential
Source: Ivory-Boyer
Utah County continues to lead the state in single-family permits, approving 1,341 new units in the first quarter; however, this represents a 20.2% decrease from 2021 (see Table 2). Washington County issued 609 single-family permits, a 30.4% decline. Among cities, Eagle Mountain leads the state in single-family permits through the first quarter, permitting 321 units, a decrease of 23.0% from last year (see Table 3). St. George is second, permitting 252 single-family units, a decrease of 33.5% over the first quarter of 2021.
The increase in multifamily activity is likely the result of affordability woes plaguing the market. Multifamily permitted units increased 44.4% in the first quarter of 2022 to 5,614, a record for the first three months (see Figure 3). The increase was driven
Total Nonresidential Residential
Published July
Policy Institute in partnership with the Ivory-Boyer Real Estate Center.
2022
2016 2017 2018 2019 2020 2021 2022 Nonresidential $0 $100 $200 $300 $400 $500 $600 $700 $800 2000 2001 2002 2003 2004 2005 2006 2007 2008 2009 2010 2011 2012 2013 2014 2015 2016 2017 2018 2019 2020 2021 2022 Millions
Ivory-Boyer Construction
First Quarter 2022 Published July 2022
$0 $500 $1,000 $1,500 $2,000 $2,500 $3,000 $3,500 $4,000
4,000 6,000 8,000 10,000 12,000 Permitted Units
Construction Database
Figure 1: Value of Permit-Authorized Construction in Utah, January–March 2000–2022 (Millions of Constant 2022 Dollars) Hachman Index Score U.S. = 100 95.0+
AK 39.3 IL 96.3 NC 95.1 PA 95.5 GA 97.1 UT 95.5 MO 97.4 AZ 95.9 WV 50.8 FL 90.8 MN 93.8ID 81.2 NM 63.2 CA 93.2 WI 91.6 OR 92.9 NE 77.0 WA 77.7 LA 89.4 AL 91.2 OH 92.9 TX 86.3 CO 94.2 SC 92.7 OK 70.3 TN 92.4 WY 33.9 ND 37.4 KY 89.8 ME 91.4 NY 76.3 NV 73.8 MI 92.4 AR 87.6 MS 87.3 MT 77.9 KS 91.4 IN 79.1 SD 61.2 VA 90.6 IA 78.7 HI 74.4 VT 90.7 NH 94.8 MA 89.1 RI 89.0 CT 90.1 NJ 94.5 MD 87.6 DE 64.9 DC 49.5 Highlights Note: All 2021 data are estimates Sources for figures: Kem C. Gardner Policy Institute; U.S. Bureau of Labor Statistics; U.S. Bureau of Economic Analysis; U.S. National Park Service; Ski Utah; Utah Economic Council; Hachman Index; U.S. Census Bureau; and Utah Population CommitteeConstruction, 7.6% Manufacturing, 9.0% Trade, Trans., Utilities, 18.9% Information, 2.5% Financial Activity, 6.0% $0 $2,000 $4,000 2000 2001 2002 2003 2004 2005 2006 2007 2008 2009 2010 2011 2012 2013 2014 2015 2016 2017 2018 2019 2020 2021e 2022f 0.0 2.0 4.0 6.0 8.0 10.0 12.0 1983 1985 1987 1989 1991 1993 1995 1997 2099 2001 2003 2005 2007 2009 2011 2013 2015 2017 2019 2021e Millions National Park Visits Skier Days 2004 2008 2012 2016 2020 2000 2010 20202005 2015 0.0% 3.3% 3.5% Hawaii New York Louisiana Alaska Vermont Arkansas Montana Arizona Utah Idaho 2.7% 2.4% Utah: 2.7% U.S: 5.4% 2.0% 3.8% 3.5% 2.4% 4.9% 3.9% 6.5% 4.7% 2.8% 2.0% 3.0% 2.4% 2.1% 4.4% 2.5% 2.8% 6.3% 2.8% 3.3% 2.8% 2.9% 5.7%2.3% 2.8% 2.8% 4.9% 2.8%
Manufacturing,
0.0 2.0 1983 1985 1987 1989 1991 1993 1995 1997 2099 2001 2003 2005 2007 2009 2011 2013 2015 2017 2019 2021e1950 1960 1970 1980 1990 2000 2010 20201955 1965 1975 1985 1995 2005 2015 -4% -6% -8%
13.9% 8.9% 8.5% 7.7% 7.5%
3.5%
2.7% 2.4%
2.0% 3.8% 3.5% 2.4% 4.9% 3.9% 6.5% 4.7% 2.8% 2.0% 3.0% 2.4% 2.1% 4.4% 2.5% 2.8% 6.3% 2.8% 3.3% 2.8% 2.9% 5.7%2.3% 2.8% 2.8% 4.9% 2.8% Economic
2020 Note: Ski seasons include December of the year noted through late spring of the following year (i.e., 2019 represents the 2019-2020 ski season)
Population Growth Rate
Nation Percent Change, 2010-2020 Source: 2020 Apportionment Data, U.S. Census Bureau2022 Economic Report To The Governor, Utah 2022 Economic Report To The Governor, Utah Ivory-Boyer Real Estate Center - 2022 1st Qtr Report
Regional MAP
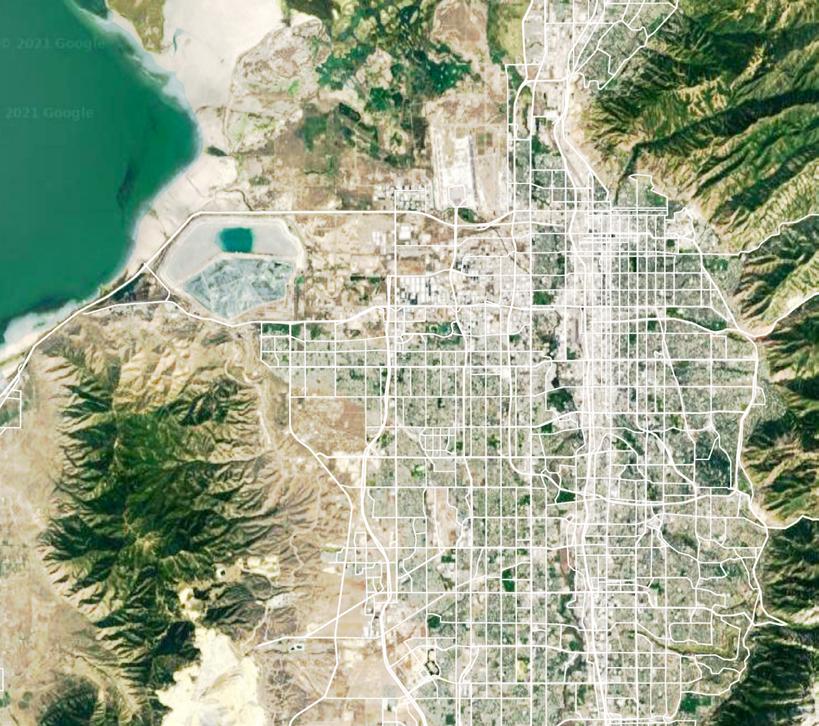 SALT LAKE INT’L AIRPORT
SALT LAKE CITY
Great Salt Lake
SALT LAKE INT’L AIRPORT
SALT LAKE CITY
Great Salt Lake
THE BOULDERS
Salt Lake City — the urban heart of the metropolitan Wasatch Front is just a 40 minute canyon’s drive away. Other destinations on the Wasatch Back include the alpine splendor and access to endless outdoor recreation only 20 miles away in Heber Valley. The quaint mountain town of Kamas is the gateway to the Uinta Mountain Range, home to Utah’s tallest peak: King’s Peak. From Kamas, it’s all scenic driving all the time on the 56-mile Mirror Lake Highway Scenic Byway. Park City is nearby a handful of state parks, including Jordanelle State Park, a boater’s haven, and Rockport State Park. Wasatch Mountain State Park offers hiking, mountain biking, snowmobiling and skiing opportunities depending on the season.

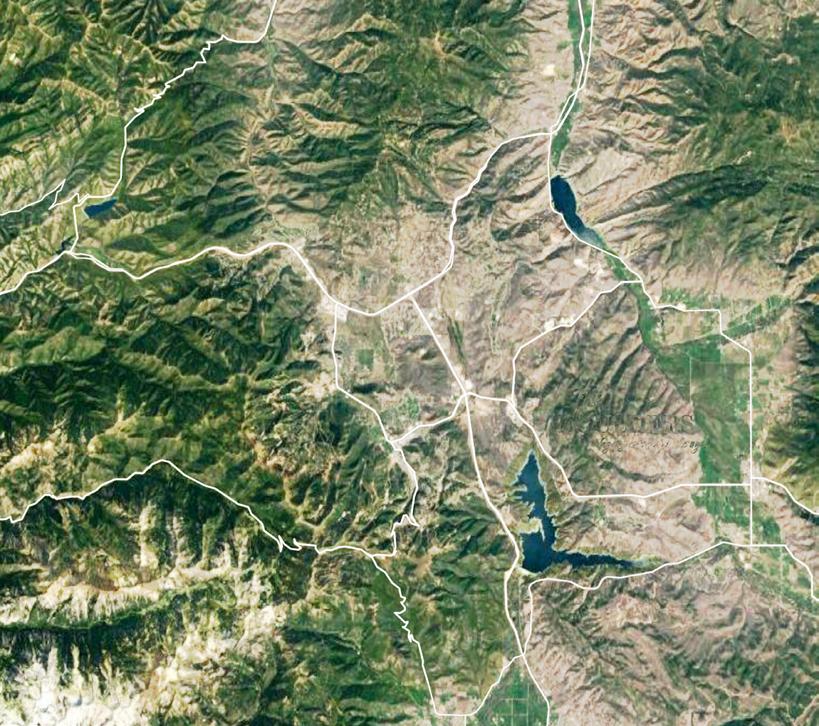 UINTA MOUNTAINS
PARK CITY
HEBER VALLEY
Jordanelle Reservoir
UINTA MOUNTAINS
PARK CITY
HEBER VALLEY
Jordanelle Reservoir


 PARK CITY
Wasatch Mountain State Park
PARK CITY
Wasatch Mountain State Park
MIDWAY
CANYONS VILL AGE
THE BOULDERS
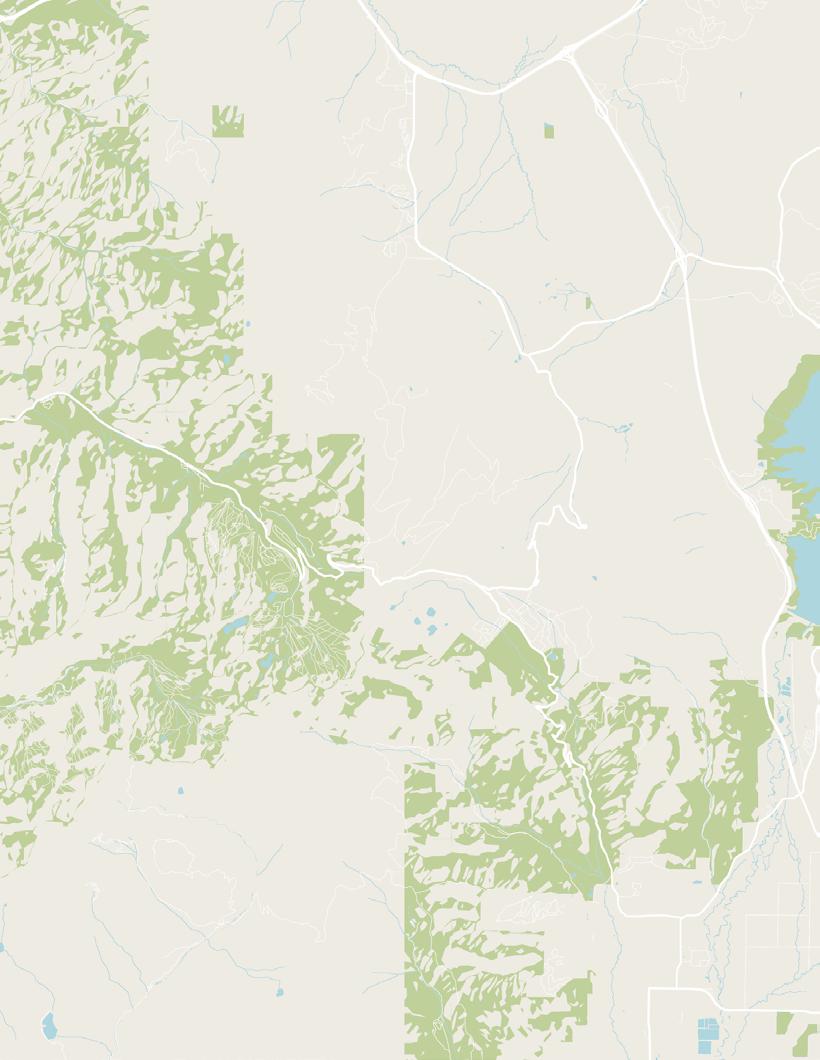
THE AREA
If skiing powder is your thing, Park City has you covered. With 426 downhill trails across 9,326 acres and numerous places to Nordic ski, there are limitless possibilities. These numbers partially explain why the U.S. Ski and Snowboard team is headquartered in Park City. Other reasons include unbeatable proximity, quality of recreational opportunities, and quality of life.
Park City Mountain is the largest ski resort in the United States, while Deer Valley is one of the country’s most popular luxury mountain resorts. Recently, development of Mayflower Mountain Resort has commenced, with the intention of opening in late 2024. In all likelihood Mayflower will be operated in conjunction with Deer Valley, greatly expanding the size of the combined resort. The Soldier Hollow Nordic Center just south of Midway once featured in the Olympic games and offers great cross-country skiing. Newest to the area is Woodward Park City, an adventure sports center with a lift of its own.
Jordanelle Reservoir
HEBER


GREG MINER JD 435.668.7771 Greg@UtahLuxuryGroup.com UtahLuxuryGroup.com MURRAY GARDNER 435.640.5184 Murray@GardnerGroupParkCity.com GardnerGroupParkCity.com Listing courtesy of KW Park City Keller Williams Real Estate. Each Office Independently Owned and Operated. All information from sources deemed reliable. Buyer to verify all information to Buyer’s satisfaction. All information subject to change. BouldersParkCity.com Masterplan, Aerial Video, Photos, and More
