
Housing Market Report
Prepared by Bright Research
Key Market Statistics
Housing Market Trends
Median home price at near record high despite more inventory on the market. Active listings at the end of the month were 4.0% higher than last year across the Washington, D.C. metro; however, not all buyers have more choices, specifically those looking in Alexandria City, Arlington County or Fairfax County, VA.
New listings declined 11.4% year-over-year in the Washington, D.C. metro, though new pending sales were down by a smaller percentage. New listings outpaced new pending sales in March, which is what led to growing month-end inventory.
Despite the inventory increase, the median sold price was $599,990, up by 10.1% in March, the fastest pace of home price growth since February 2022.
Homes continue to sell quickly in the competitive Washington, D.C. metro area market. Half of all homes sold in March were on the market a week or less.

Data asof April 4, 2024
Market Outlook
The spring will be challenging for buyers as new listings have been slow to come to the Washington, D.C. metro area market and mortgage rates remain elevated. Even in the counties where supply is higher than last year, gains are modest. Buyers who wait for lower mortgage rates later this year could find more inventory, but they will also face even more competition as rate drops entice more buyers into the market.
Source: Freddie Mac
Avg. Mortgage Rate 30-yr fixed rate
more, visit brightmls.com/research
Weekly
For
4% 5% 6% 7% 8% Apr '23 Apr '24
Washington, D.C. Metro
Mar 2024 Mar 2023 Change YTD 2024 YTD 2023 Change Closed Sales 3,702 4,181 -11.5% 9,456 10,013 -5.6% Median Sold Price $599,990 $545,000 +10.1% $566,677 $530,000 +6.9% Median Days on Market 7 days 9 days -2 days 10 days 16 days -6 days New Pending Sales 4,797 5,028 -4.6% 11,869 12,461 -4.8% New Listings 4,969 5,610 -11.4% 14,746 15,191 -2.9% Active Listings 5,609 5,392 +4.0% 5,609 5,392 +4.0% Months of Supply 1.39 1.12 +0.27 mos. 1.39 1.12 +0.27 mos. Showings 115,819 131,285 -11.8% 291,091 331,918 -12.3%
(Mar
4,181)
(Feb '24: 3,082)
(Mar '23: $545,000)
(Feb '24: $560,000)
(Mar '23: 9 days)
7 days -2 days -3 days
(Feb '24: 10 days)
Days on Market
'24 vs. Mar '23
'24 vs.
'24 vs. Mar '23 March 2024 Mar '24 vs. Feb '24 March 2024 Closed Sales 2019-2022Range 2024 2023 2024 2023 2022 2021 2020 2019 March 2024 Mar '24 vs. Mar '23 Mar '24 vs. Feb '24 Median Sold Price March 2024 Housing Market Report Washington, D.C. Metro : 2 0 days 10 days 20 days 30 days 40 days 2019 2020 2021 2022 2023 2024 $350,000 $400,000 $450,000 $500,000 $550,000 $600,000 $650,000 Jan Feb Mar Apr May Jun Jul Aug Sep Oct Nov Dec 0 2,500 5,000 7,500 10,000 Jan Feb Mar Apr May Jun Jul Aug Sep Oct Nov Dec
-11.5% +20.1%
Median
Mar
Mar
Feb '24 Mar
3,702
'23:
$599,990 +10.1% +7.1%
Active Listings New Listings New Pending Sales 2019-2022Range 2024 2023 2019-2022Range 2024 2023 March 2024 Housing Market Report March 2024 Mar '24 vs. Mar '23 Mar '24 vs. Feb '24 March 2024 Mar '24 vs. Mar '23 Mar '24 vs. Feb '24 March 2024 Mar '24 vs. Mar '23 Mar '24 vs. Feb '24 Washington, D.C. Metro : 3 0 2,500 5,000 7,500 10,000 12,500 15,000 2019 2020 2021 2022 2023 2024 0 2,500 5,000 7,500 10,000 12,500 Jan Feb Mar Apr May Jun Jul Aug Sep Oct Nov Dec 0 2,500 5,000 7,500 10,000 Jan Feb Mar Apr May Jun Jul Aug Sep Oct Nov Dec 4,797 -4.6% +24.5% (Mar '23: 5,028) (Feb '24: 3,852)
-11.4% (Mar '23: 5,610) +18.0% (Feb '24: 4,210)
+4.0% +6.3% (Mar '23: 5,392) (Feb '24: 5,277)
4,969
5,609
Mar '24 vs. Mar '23 Mar '24 vs. Mar '23 Mar '24 vs. Mar '23 Washington, D.C. Metro 4,797 -4.6% 4,969 -11.4% 115,819 -11.8% Alexandria City, VA 198 +3.1% 189 -8.3% 3,591 -14.7% Arlington County, VA 229 -5.4% 235 -16.1% 4,215 -17.7% FairfaxCity, VA 24 -20.0% 21 -41.7% 729 -0.4% FairfaxCounty, VA 1,147 +2.4% 1,047 -13.6% 28,940 -15.2% FallsChurch City, VA 8 -50.0% 12 +20.0% 190 -46.0% Frederick County, MD 316 -11.7% 281 -22.4% 6,010 -7.2% Loudoun County, VA 432 -6.7% 446 -10.4% 9,540 -14.3% MontgomeryCounty, MD 946 -1.3% 937 -1.8% 25,556 -8.3% Prince George'sCounty, MD 840 -5.6% 775 -9.9% 23,069 -7.2% Washington, DC 657 -13.4% 1,026 -13.9% 13,979 -14.9% Mar '24 vs. Mar '23 Mar '24 vs. Mar '23 Mar '24 vs. Mar '23 Washington, D.C. Metro 3,702 -11.5% $599,990 +10.1% 7 days -2 days Alexandria City, VA 161 -16.6% $702,450 +5.6% 6 days -2 days Arlington County, VA 176 -10.7% $717,500 +10.4% 7 days -2 days FairfaxCity, VA 19 +11.8% $670,000 +8.9% 4 days -1 day FairfaxCounty, VA 818 -14.8% $739,999 +11.8% 5 days -1 day FallsChurch City, VA 17 +21.4% $775,000 -26.9% 5 days -4 days Frederick County, MD 249 -18.6% $477,500 +11.3% 7 days -2 days Loudoun County, VA 355 -2.7% $750,000 +4.2% 5 days -1 day MontgomeryCounty, MD 720 -5.0% $590,000 +10.2% 7 days -1 day Prince George'sCounty, MD 679 -9.6% $435,000 +4.8% 14 days -5 days Washington, DC 508 -18.1% $640,000 -0.1% 19 days -4 days March 2024 Housing Market Report Local Markets Closed Sales Median Sales Price Median Days on Market New Pending Sales New Listings Showings Local Markets Washington, D.C. Metro : 4
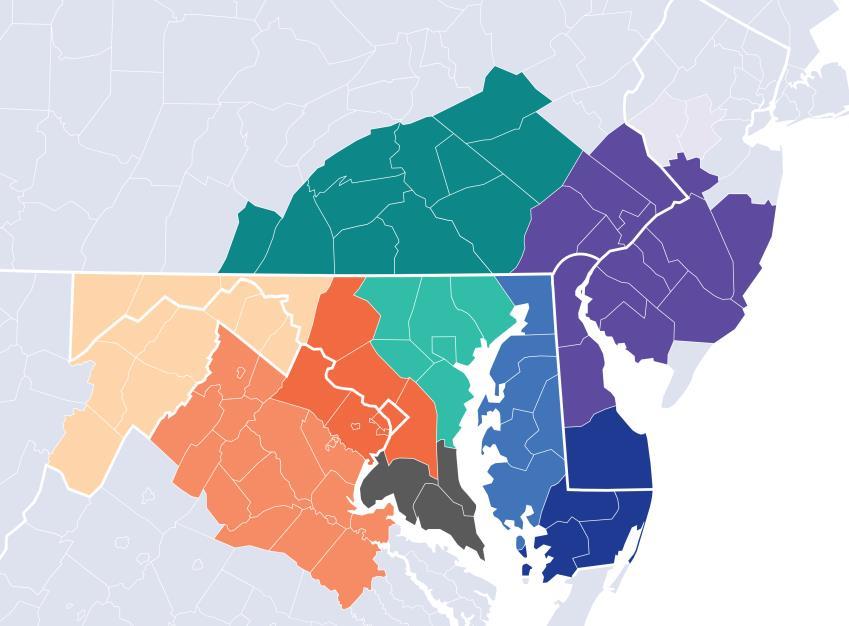
Local Market Map
MD/WV Panhandle
North Central Virginia
Washington D.C., Metro
Central Pennsylvania
Baltimore Metro
Southern Maryland
Maryland Eastern Shore
Philadelphia Metro
Del/Mar Coastal
About Bright MLS
Bright MLS was founded in 2016 as a collaboration between 43 visionary associations and two of the nation’s most prominent MLSs to transform what an MLS is and what it does, so real estate pros and the people they serve can thrive today and into our data-driven future through an open, clear and competitive housing market for all. Bright is proud to be the source of truth for comprehensive real estate data in the Mid-Atlantic, with market intelligence currently covering six states (Delaware, Maryland, New Jersey, Pennsylvania, Virginia, West Virginia) and the District of Columbia.
are available at brightmls.com/research.
Mar '24 vs. Mar '23 Mar '24 vs. Mar '23 Washington, D.C. Metro 5,609 +4.0% 1.39 +0.27 months Alexandria City, VA 130 -15.0% 0.76 -0.01 months Arlington County, VA 224 -24.3% 1.19 -0.19 months FairfaxCity, VA 15 -50.0% 0.63 -0.48 months FairfaxCounty, VA 827 -11.3% 0.90 +0.07 months FallsChurch City, VA 14 +133.3% 1.27 +0.77 months Frederick County, MD 311 +5.4% 1.05 +0.29 months Loudoun County, VA 419 +4.5% 1.08 +0.23 months MontgomeryCounty, MD 792 +12.7% 1.04 +0.29 months Prince George'sCounty, MD 886 +0.5% 1.25 +0.14 months Washington, DC 1,991 +17.5% 3.56 +1 months Local Markets More
Active Listings Months of Supply Washington, D.C. Metro : 5
Christy Reap,
Relations Director with
or information requests:
market insights
Please contact
Media
interview
• (202) 309-9362
• christy.reap@brightmls.com