Washington, D.C. Metro
June 2025 Housing Market Report
by Bright Research
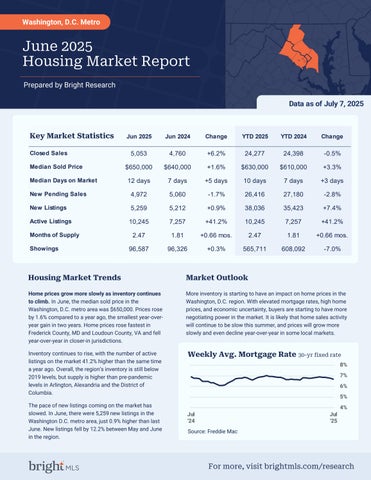
Key Market Statistics
Housing Market Trends
Home prices grow more slowly as inventory continues to climb. In June, the median sold price in the Washington, D.C. metro area was $650,000. Prices rose by 1.6% compared to a year ago, the smallest year-overyear gain in two years. Home prices rose fastest in Frederick County, MD and Loudoun County, VA and fell year-over-year in closer-in jurisdictions.
Inventory continues to rise, with the number of active listings on the market 41.2% higher than the same time a year ago. Overall, the region’s inventory is still below 2019 levels, but supply is higher than pre-pandemic levels in Arlington, Alexandria and the District of Columbia.
The pace of new listings coming on the market has slowed. In June, there were 5,259 new listings in the Washington D.C. metro area, just 0.9% higher than last June. New listings fell by 12.2% between May and June in the region.

More inventory is starting to have an impact on home prices in the Washington, D.C. region. With elevated mortgage rates, high home prices, and economic uncertainty, buyers are starting to have more negotiating power in the market. It is likely that home sales activity will continue to be slow this summer, and prices will grow more slowly and even decline year-over-year in some local markets.
Source: Freddie Mac
June 2025
Jun '25 vs. Jun '24
Jun '25 vs. May '25
5,053 +6.2% +5.5% (Jun '24: 4,760) (May '25: 4,790)
Median Sold Price
2025
Jun '25 vs. Jun '24
Jun '25 vs. May '25
$650,000 +1.6% -1.5% (Jun '24: $640,000) (May '25: $659,950)
Median Days on Market
12 days +5 days
Jun '25 vs. Jun '24 June 2025
+4 days (Jun '24: 7 days) (May '25: 8 days)
Jun '25 vs. May '25
June 2025
Jun '25 vs. Jun '24
Jun '25 vs. May '25
4,972 -1.7% -7.2% (Jun '24: 5,060) (May '25: 5,357)
June 2025
Jun '25 vs. Jun '24
Jun '25 vs. May '25
5,259 +0.9% (Jun '24: 5,212) -12.2% (May '25: 5,991)
June 2025
Jun '25 vs. Jun '24
Jun '25 vs. May '25
10,245 +41.2% -1.6% (Jun '24: 7,257) (May '25: 10,413)
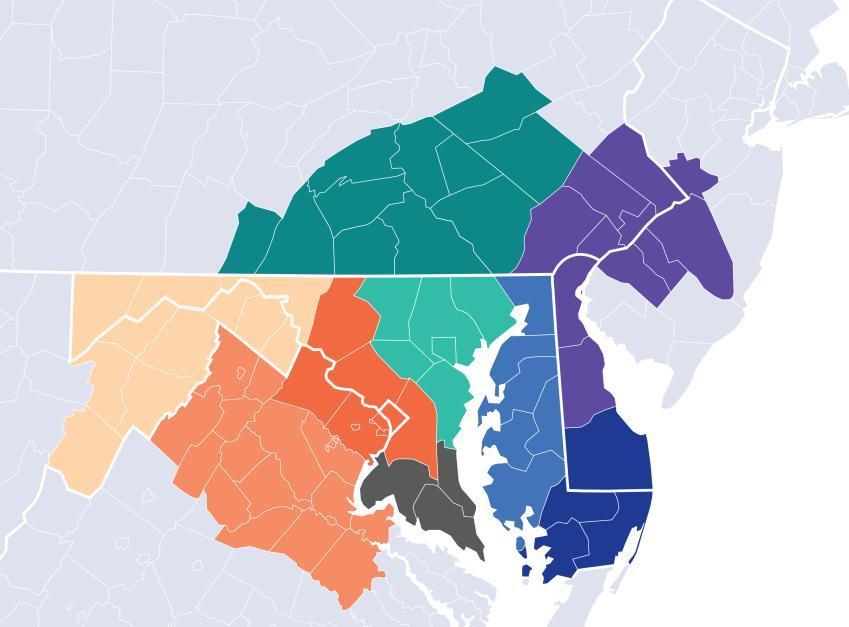
Local Market Map
MD/WV Panhandle
North Central Virginia
Washington D.C., Metro
Central Pennsylvania
Baltimore Metro
Southern Maryland
Maryland Eastern Shore
Philadelphia Metro
Del/Mar Coastal
About Bright MLS
Bright MLS was founded in 2016 as a collaboration between 43 visionary associations and two of the nation’s most prominent MLSs to transform what an MLS is and what it does, so real estate pros and the people they serve can thrive today and into our data-driven future through an open, clear and competitive housing market for all. Bright is proud to be the source of truth for comprehensive real estate data in the Mid-Atlantic, with market intelligence currently covering six states (Delaware, Maryland, New Jersey, Pennsylvania, Virginia, West Virginia) and the District of Columbia.
Please contact Christy Reap, Media Relations Director with interview or information requests:
• (202) 309-9362
• christy.reap@brightmls.com
Prepared by Bright Research Data as of July 7, 2025
2,418 June 2025
+6.6%
Jun '25 vs. Jun '24 (Jun '24: 2,269)
+2.5%
Jun '25 vs. May '25 (May '25: 2,358)
$860,000
June 2025
+2.4%
Jun '25 vs. Jun '24 (Jun '24: $840,000) +1.1%
Jun '25 vs. May '25 (May '25: $850,707)
$900,000
$850,000
$800,000
$750,000
$700,000
$650,000
$600,000
$550,000
$500,000
Median Days on Market
10 days
June 2025
+4 days
Jun '25 vs. Jun '24 (Jun '24: 6 days)
+3 days
Jun '25 vs. May '25 (May '25: 7 days)
New Pending Sales
2,296
June 2025
Jun '25 vs. Jun '24 (Jun '24: 2,352)
Jun '25 vs. May '25 (May '25: 2,568)
2,311
June 2025
Jun '25 vs. Jun '24 (Jun '24: 2,251) -15.7%
Jun '25 vs. May '25 (May '25: 2,743)
4,305
June 2025
+46.4%
Jun '25 vs. Jun '24 (Jun '24: 2,941)
-0.7%
Jun '25 vs. May '25 (May '25: 4,336)
About Bright MLS
Bright MLS was founded in 2016 as a collaboration between 43 visionary associations and two of the nation’s most prominent MLSs to transform what an MLS is and what it does, so real estate pros and the people they serve can thrive today and into our datadriven future through an open, clear and competitive housing market for all. Bright is proud to be the source of truth for comprehensive real estate data in the Mid-Atlantic, with market intelligence currently covering six states (Delaware, Maryland, New Jersey, Pennsylvania, Virginia, West Virginia) and the District of Columbia.

Prepared by Bright Research Data as of July 7, 2025
1,370 June 2025
+2.9%
Jun '25 vs. Jun '24 (Jun '24: 1,331)
+6.8%
Jun '25 vs. May '25 (May '25: 1,283)
$620,000
June 2025 +4.8%
Jun '25 vs. Jun '24 (Jun '24: $591,500) -0.8%
Jun '25 vs. May '25 (May '25: $625,000)
Median Days on Market
11 days
June 2025
+4 days
Jun '25 vs. Jun '24 (Jun '24: 7 days)
+3 days
Jun '25 vs. May '25 (May '25: 8 days)
New Pending Sales
1,390
June 2025 +2.0%
Jun '25 vs. Jun '24 (Jun '24: 1,363)
Jun '25 vs. May '25 (May '25: 1,424)
1,494
June 2025
Jun '25 vs. Jun '24 (Jun '24: 1,454) -6.3%
Jun '25 vs. May '25 (May '25: 1,594)
2,439 June 2025
+37.6%
Jun '25 vs. Jun '24 (Jun '24: 1,772)
+1.6%
Jun '25 vs. May '25 (May '25: 2,400)
About Bright MLS
Bright MLS was founded in 2016 as a collaboration between 43 visionary associations and two of the nation’s most prominent MLSs to transform what an MLS is and what it does, so real estate pros and the people they serve can thrive today and into our datadriven future through an open, clear and competitive housing market for all. Bright is proud to be the source of truth for comprehensive real estate data in the Mid-Atlantic, with market intelligence currently covering six states (Delaware, Maryland, New Jersey, Pennsylvania, Virginia, West Virginia) and the District of Columbia.
June 2025
Prepared by Bright Research
Market Statistics
1,263 June 2025
+8.9%
Jun '25 vs. Jun '24 (Jun '24: 1,160)
+10.2%
Jun '25 vs. May '25 (May '25: 1,146)
Data as of July 7, 2025
$390,000
June 2025 +1.3%
Jun '25 vs. Jun '24 (Jun '24: $385,000) -2.3%
Jun '25 vs. May '25 (May '25: $399,000)
$420,000
$400,000
$380,000
$360,000
$340,000
$320,000
$300,000
Median Days on Market
19 days
June 2025
+8 days
Jun '25 vs. Jun '24 (Jun '24: 11 days)
+3 days
Jun '25 vs. May '25 (May '25: 16 days)
New Pending Sales
1,284
June 2025
Jun '25 vs. Jun '24 (Jun '24: 1,343)
Jun '25 vs. May '25 (May '25: 1,364)
1,452
June 2025 -3.5%
Jun '25 vs. Jun '24 (Jun '24: 1,505) -12.2%
Jun '25 vs. May '25 (May '25: 1,653)
3,501 June 2025 +37.6%
Jun '25 vs. Jun '24 (Jun '24: 2,544)
-4.8%
Jun '25 vs. May '25 (May '25: 3,677)
About Bright MLS
Bright MLS was founded in 2016 as a collaboration between 43 visionary associations and two of the nation’s most prominent MLSs to transform what an MLS is and what it does, so real estate pros and the people they serve can thrive today and into our datadriven future through an open, clear and competitive housing market for all. Bright is proud to be the source of truth for comprehensive real estate data in the Mid-Atlantic, with market intelligence currently covering six states (Delaware, Maryland, New Jersey, Pennsylvania, Virginia, West Virginia) and the District of Columbia.