AREA REPORT


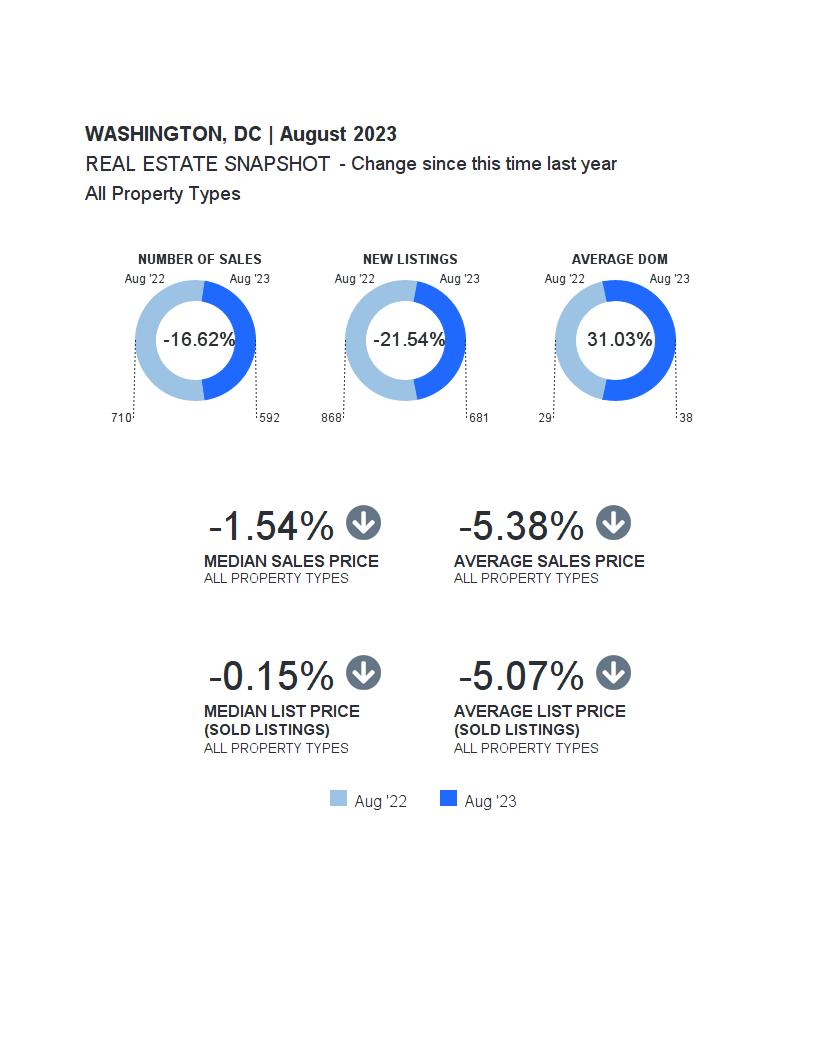

August 2023 | All Property Types
August 2023 | All Property Types
August 2023 | All Property Types
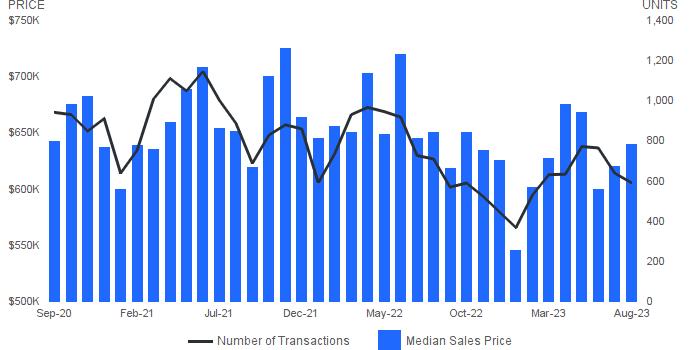
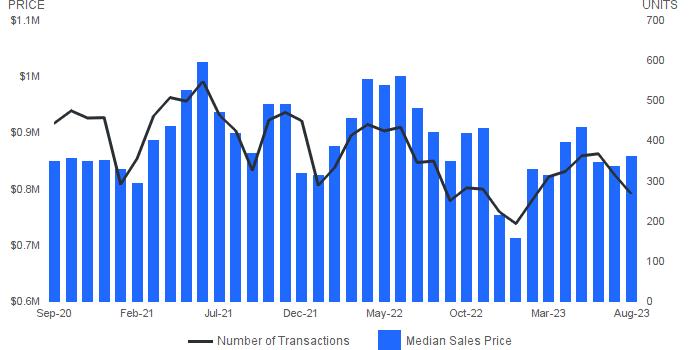
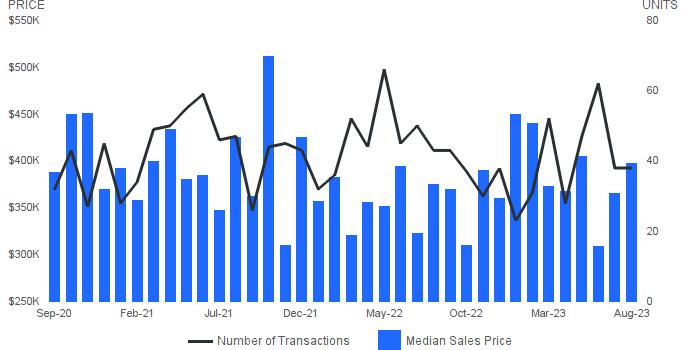
Median Sales Price | Price of the ""middle"" property sold -an equal number of sales were above and below this price.
Number of Sales | Number of properties sold.
August 2023 | All Property Types
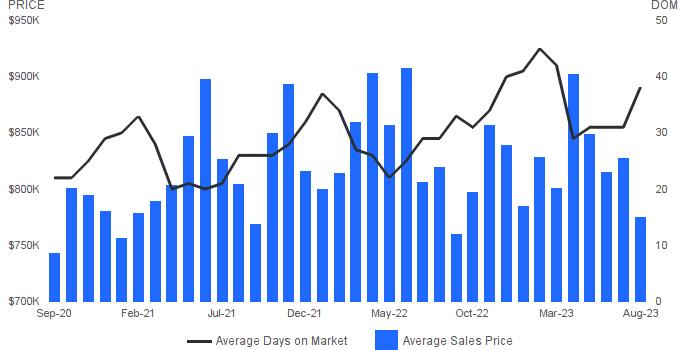
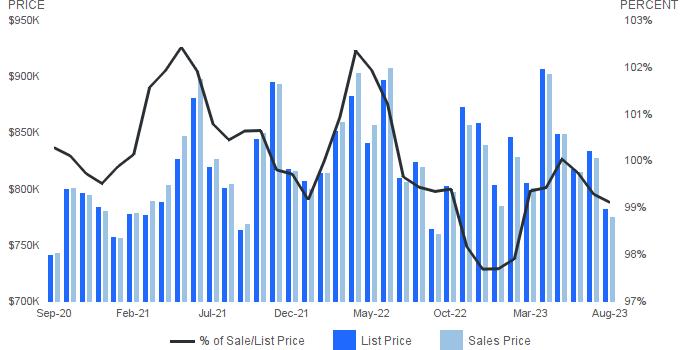
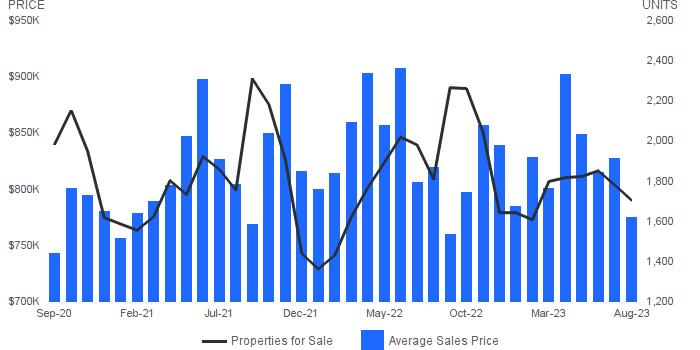
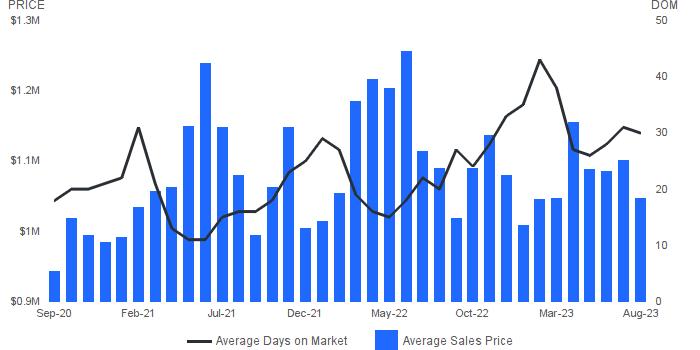
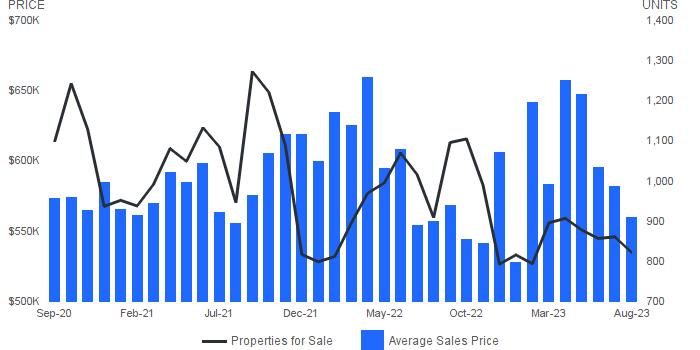
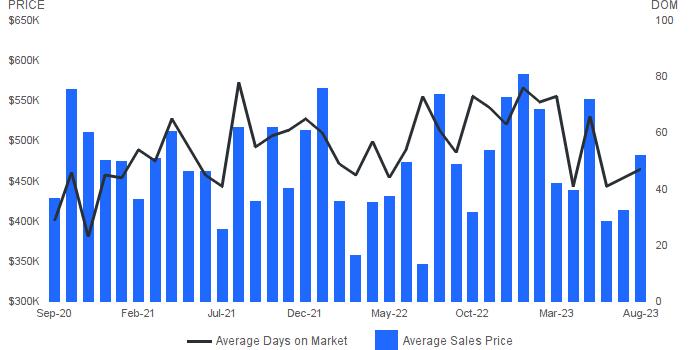
Average Sales Price| Average sales price for all properties sold. Average Days on Market | Average days on market for all properties sold.
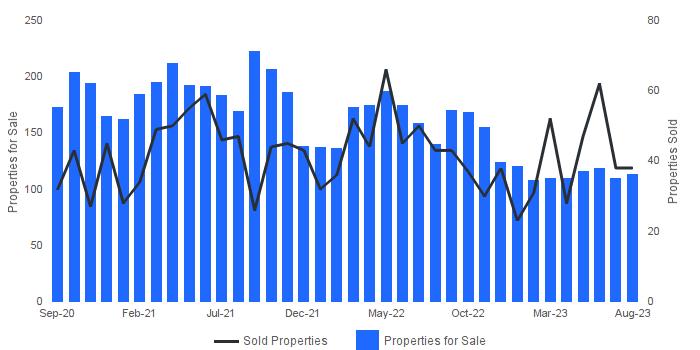
August 2023 | All Property Types
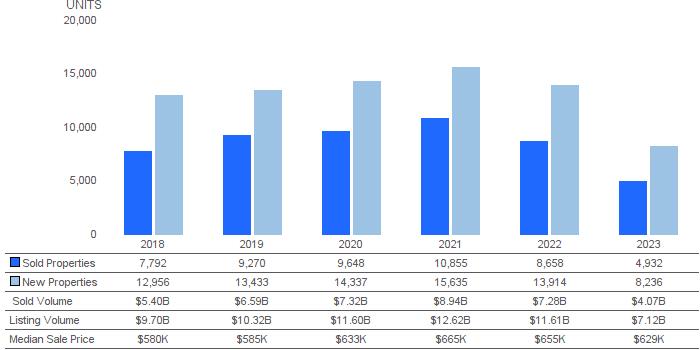
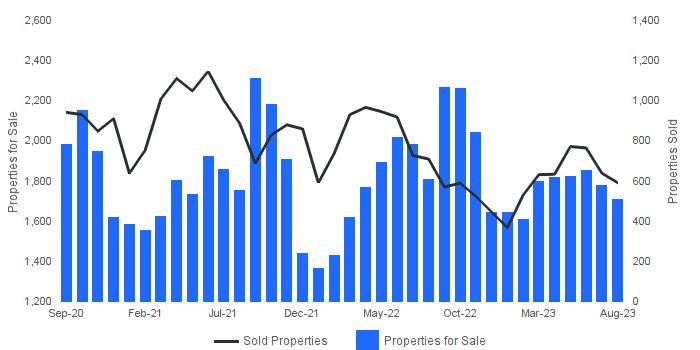
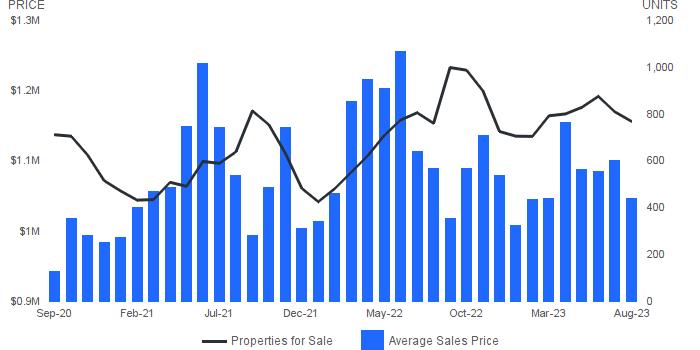
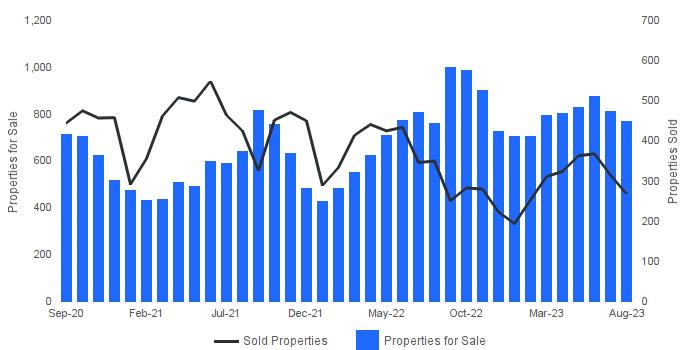
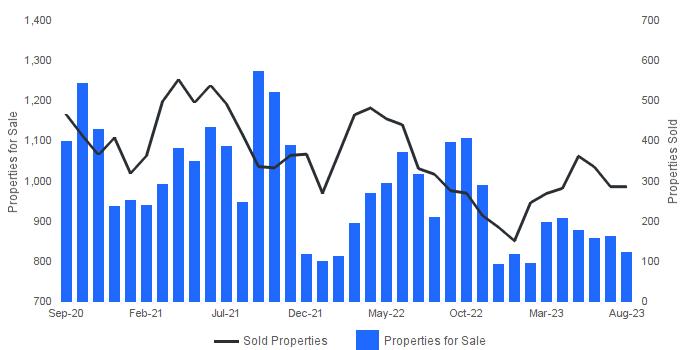
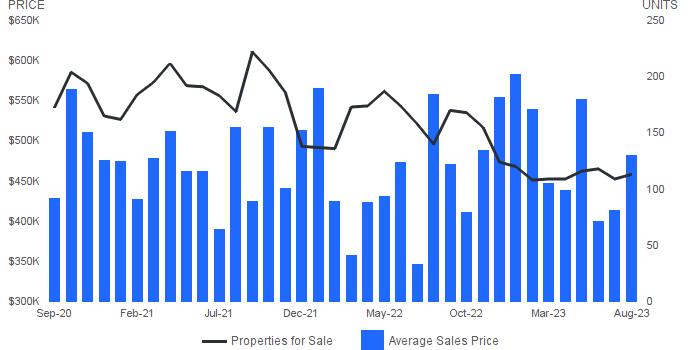
Properties for Sale | Number of properties listed for sale at the end of month.
Sold Properties| Number of properties sold.
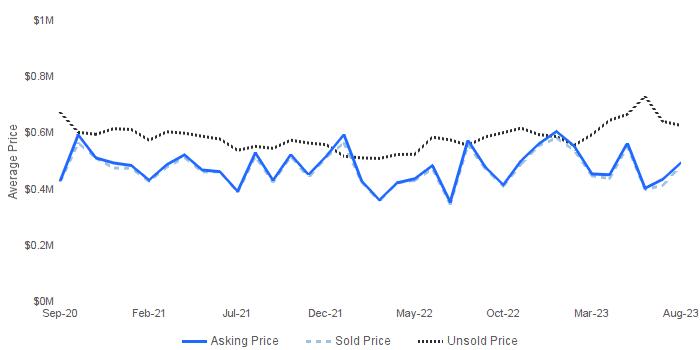
August 2023 | All Property Types
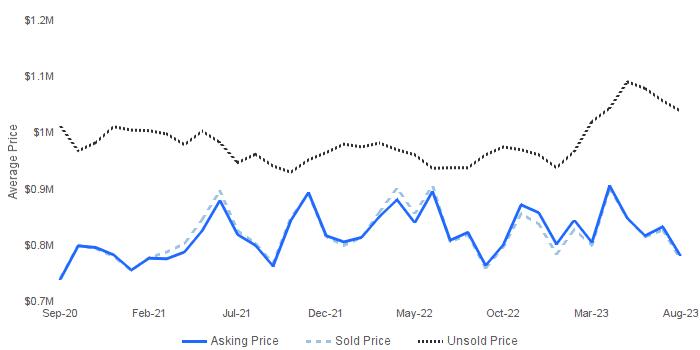
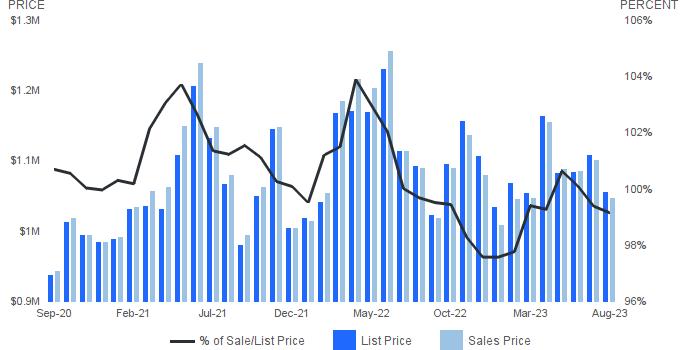
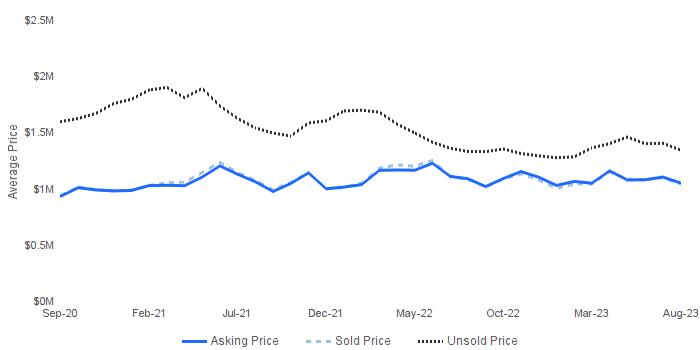
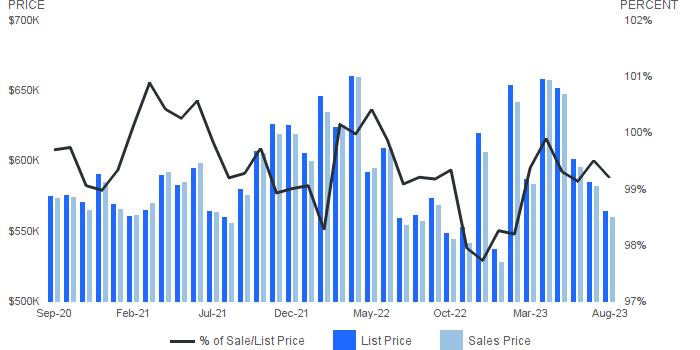
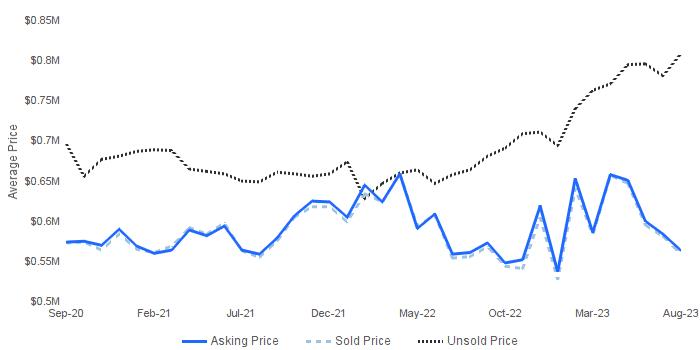
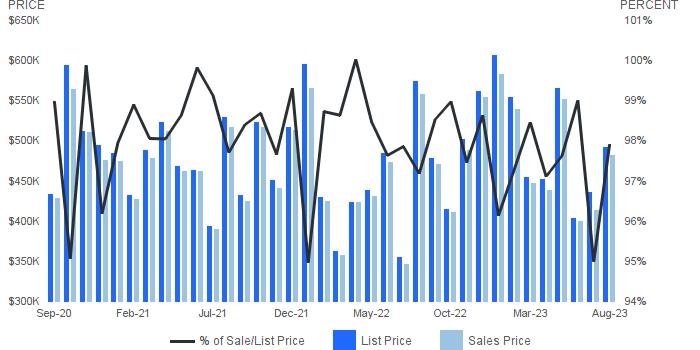
Asking Price | the average asking price of sold properties
Sold Price | the average selling price
Unsold Price| the average active list price
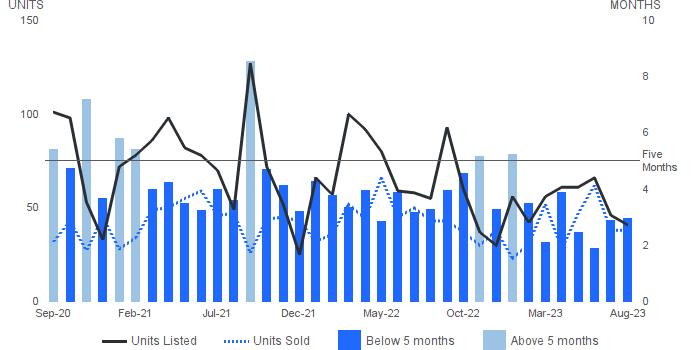
August 2023 | All Property Types
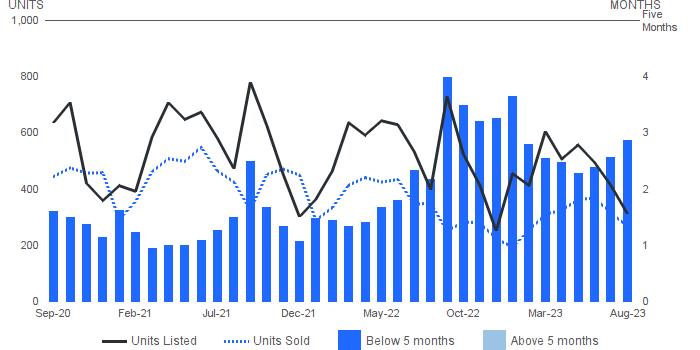
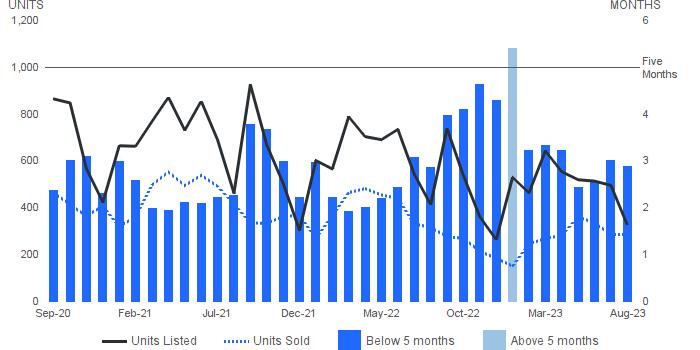
Absorption Rate | Looks at the past year's monthly supply of inventory. In a normal market there should be a 6 month supply. The higher the rate above 6 the more aggressive a seller has to be with the competition; price and having a picture perfect property.
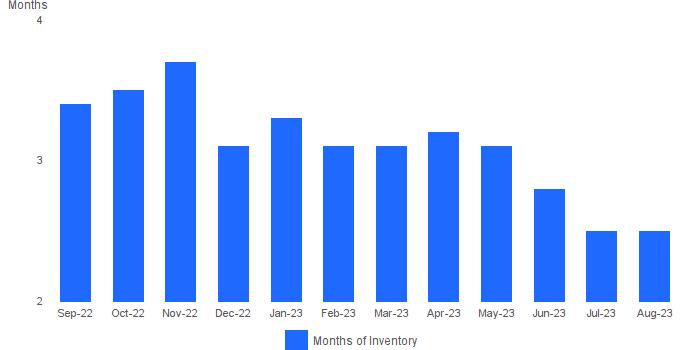
August 2023 | All Property Types
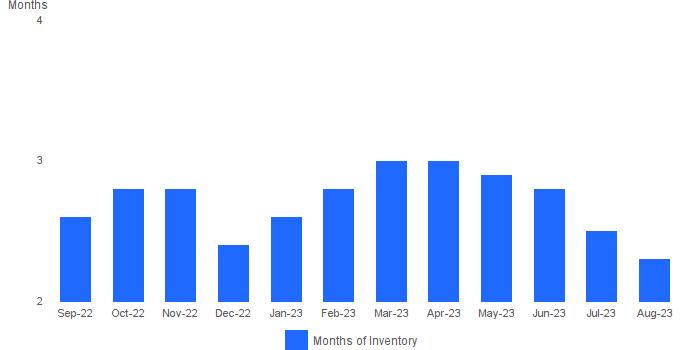
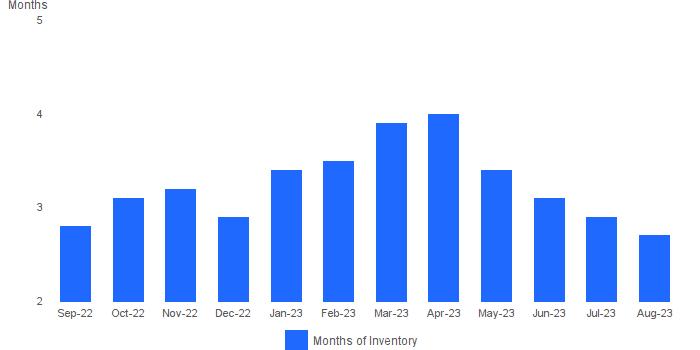
Months Supply of Inventory | Properties for sale divided by number of properties sold.
Units Listed | Number of properties listed for sale at the end of month.
Units Sold| Number of properties sold.
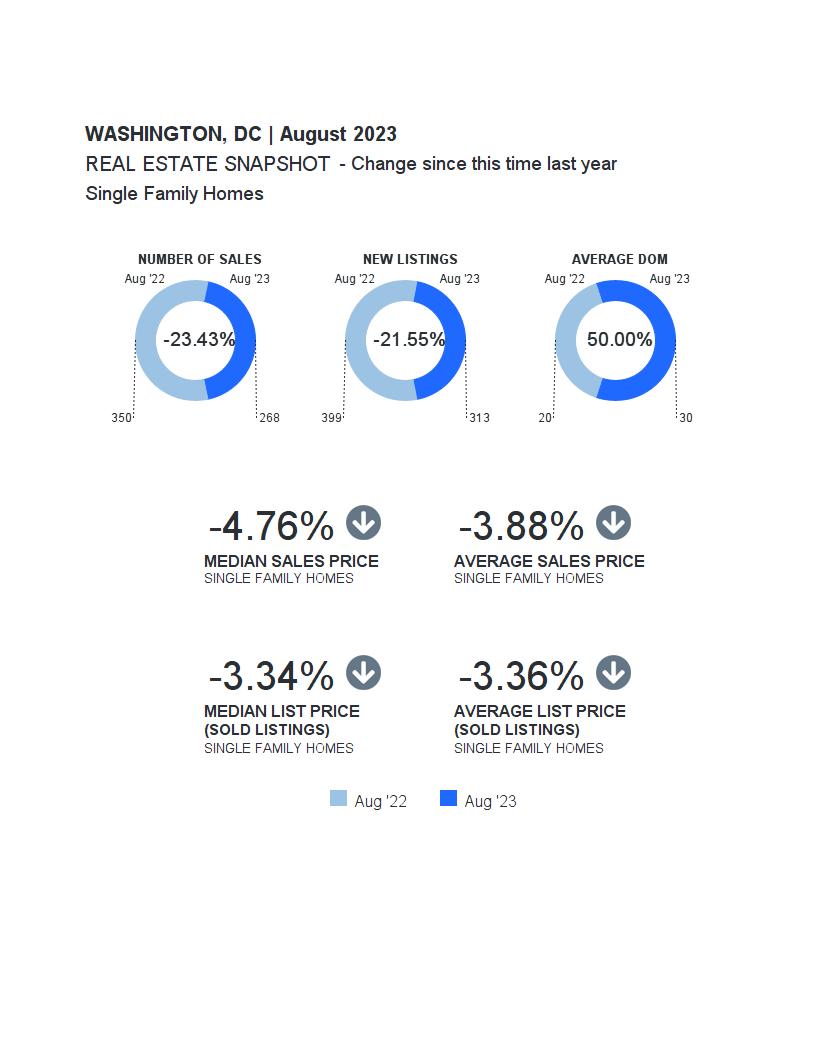
August 2023 | Single Family Homes
August 2023 | Single Family Homes
August 2023 | Single Family Homes
Median Sales Price | Price of the ""middle"" property sold -an equal number of sales were above and below this price.
Number of Sales | Number of properties sold.
August 2023 | Single Family Homes Average Sales Price| Average sales price for all properties sold.
August 2023 | Single Family Homes
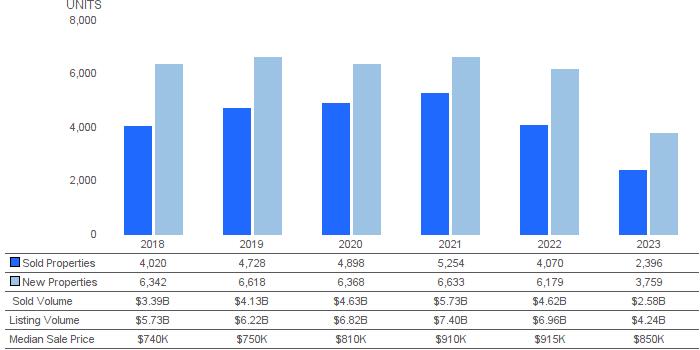
Properties for Sale | Number of properties listed for sale at the end of month.
Sold Properties| Number of properties sold.
August 2023 | Single Family Homes
Asking Price | the average asking price of sold properties
Sold Price | the average selling price
Unsold Price| the average active list price
August 2023 | Single Family Homes
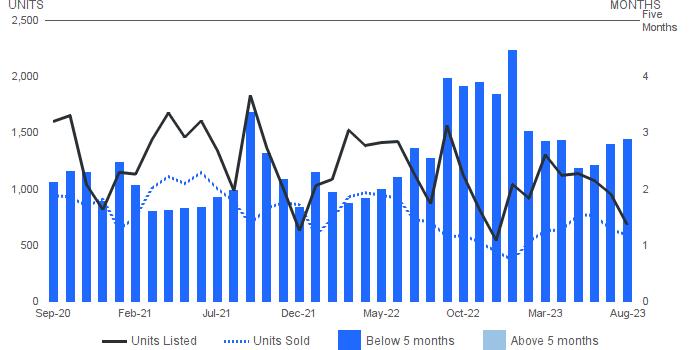
Absorption Rate | Looks at the past year's monthly supply of inventory. In a normal market there should be a 6 month supply. The higher the rate above 6 the more aggressive a seller has to be with the competition; price and having a picture perfect property.
August 2023 | Single Family Homes
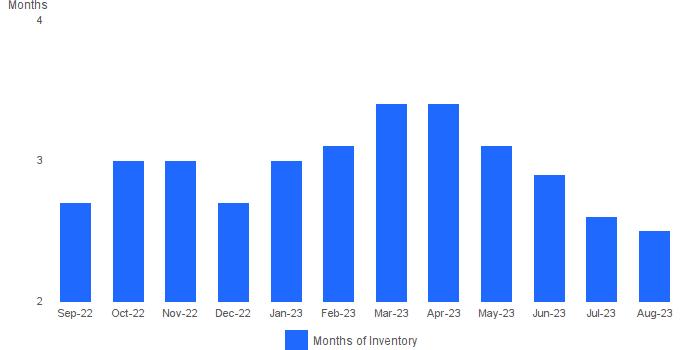
Months Supply of Inventory | Properties for sale divided by number of properties sold.
Units Listed | Number of properties listed for sale at the end of month.
Units Sold| Number of properties sold.
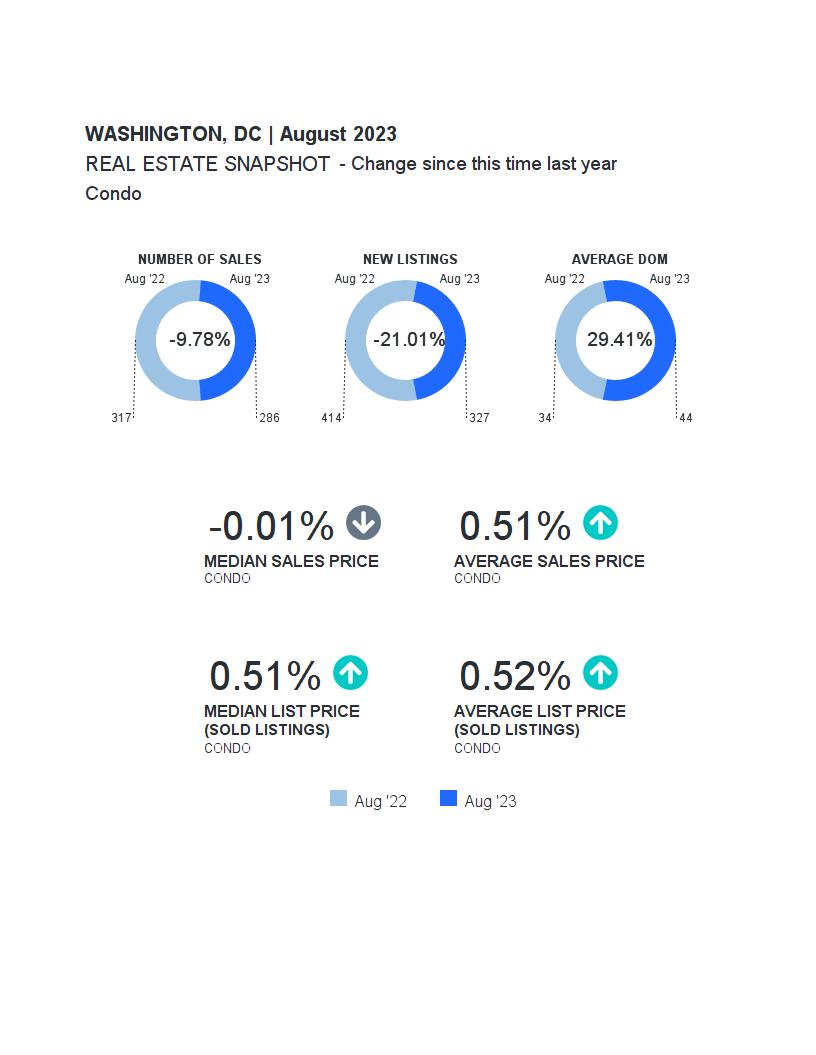
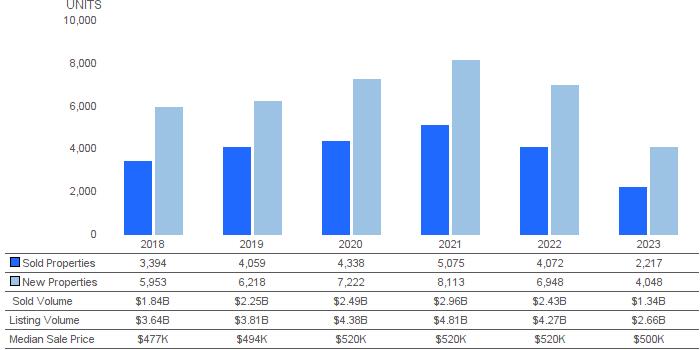
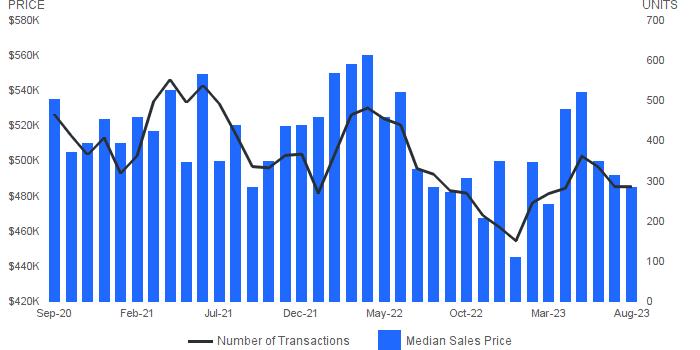
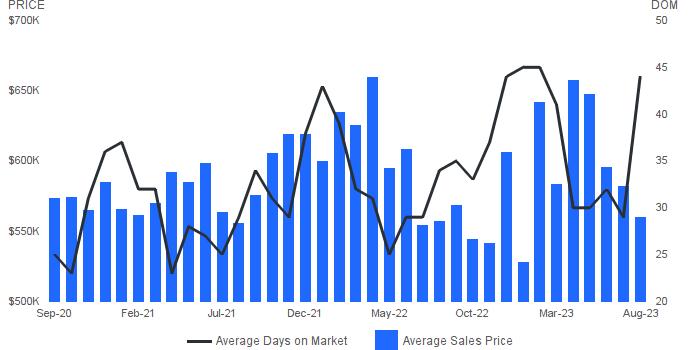
August 2023 | Condo
August 2023 | Condo
August 2023 | Condo
Median Sales Price | Price of the ""middle"" property sold -an equal number of sales were above and below this price.
Number of Sales | Number of properties sold.
August 2023 | Condo
Average Sales Price| Average sales price for all properties sold. Average Days on Market | Average days on market for all properties sold.
August 2023 | Condo
Properties for Sale | Number of properties listed for sale at the end of month.
Sold Properties| Number of properties sold.
August 2023 | Condo
Asking Price | the average asking price of sold properties
Sold Price | the average selling price
Unsold Price| the average active list price
August 2023 | Condo
Absorption Rate | Looks at the past year's monthly supply of inventory. In a normal market there should be a 6 month supply. The higher the rate above 6 the more aggressive a seller has to be with the competition; price and having a picture perfect property.
August 2023 | Condo
Months Supply of Inventory | Properties for sale divided by number of properties sold.
Units Listed | Number of properties listed for sale at the end of month.
Units Sold| Number of properties sold.
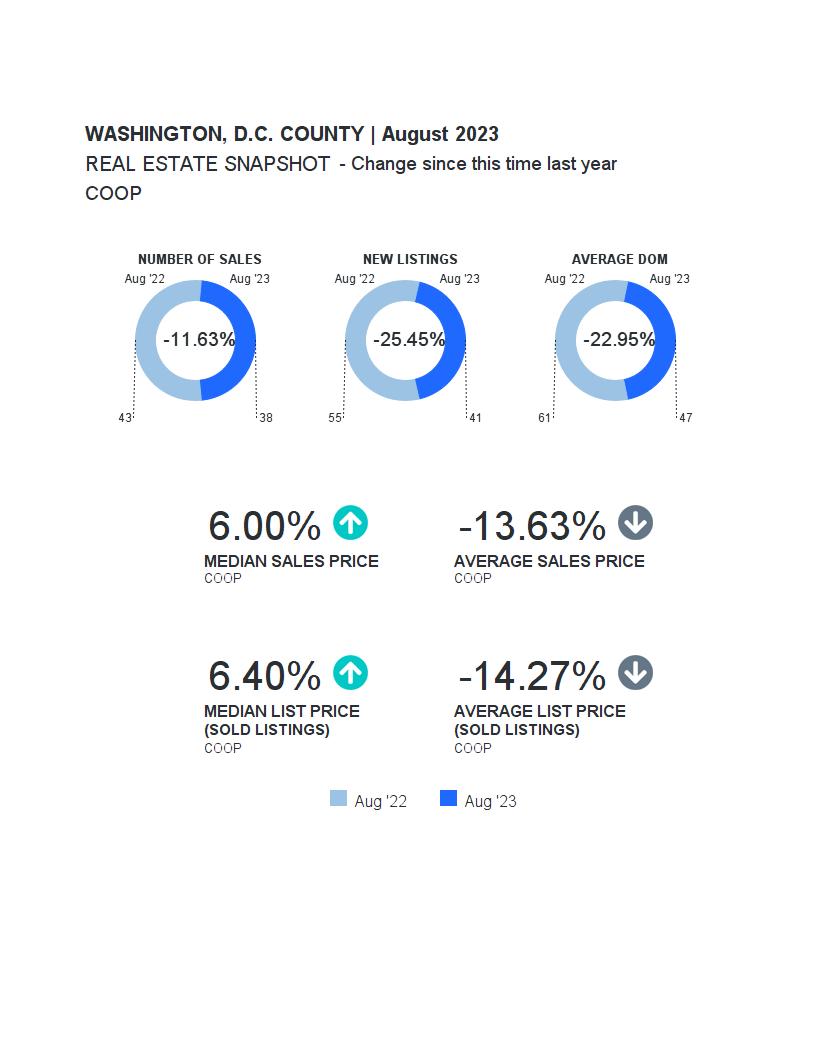
August 2023 | COOP
August 2023 | COOP
August 2023 | COOP
Median Sales Price | Price of the ""middle"" property sold -an equal number of sales were above and below this price.
Number of Sales | Number of properties sold.
August 2023 | COOP
Average Sales Price| Average sales price for all properties sold. Average Days on Market | Average days on market for all properties sold.
August 2023 | COOP
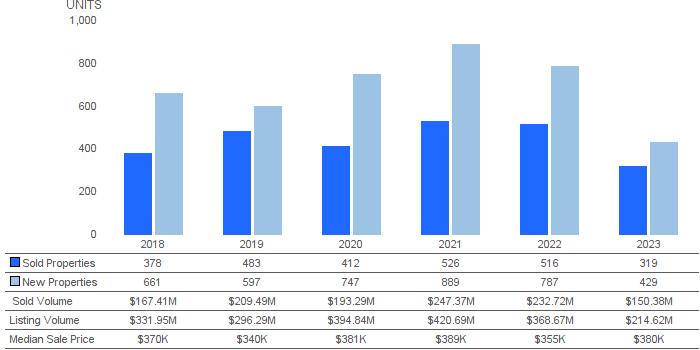
Properties for Sale | Number of properties listed for sale at the end of month.
Sold Properties| Number of properties sold.
August 2023 | COOP
Asking Price | the average asking price of sold properties
Sold Price | the average selling price
Unsold Price| the average active list price
August 2023 | COOP
Absorption Rate | Looks at the past year's monthly supply of inventory. In a normal market there should be a 6 month supply. The higher the rate above 6 the more aggressive a seller has to be with the competition; price and having a picture perfect property.
August 2023 | COOP
Months Supply of Inventory | Properties for sale divided by number of properties sold.
Units Listed | Number of properties listed for sale at the end of month.
Units Sold| Number of properties sold.
The property information herein is derived from various sources that may include, butnotbelimited to,countyrecords andtheMultiple Listing Service, and it may include approximations. Although the information is believed to be accurate, it is not warranted and you should not rely upon it without personal verification. ©2023 Coldwell Banker. All Rights Reserved. Coldwell Banker andtheColdwell Banker logosare trademarks ofColdwell Banker Real Estate LLC. The Coldwell Banker® System is comprised of company owned offices which are ownedby asubsidiary ofAnywhere AdvisorsLLC and franchised offices which are independently owned and operated. The Coldwell Banker System fully supportstheprinciplesoftheFair HousingAct and the Equal Opportunity Act.