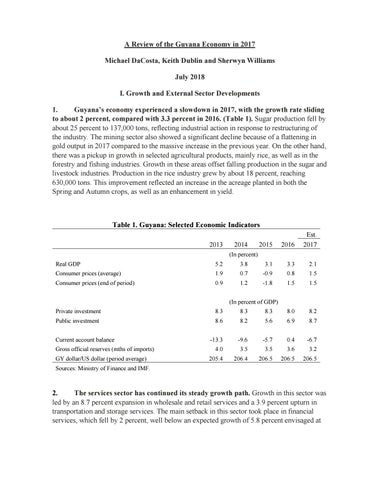
A Review of the Guyana Economy in 2017 Michael DaCosta, Keith Dublin and Sherwyn Williams July 2018 I. Growth and External Sector Developments 1. Guyana’s economy experienced a slowdown in 2017, with the growth rate sliding to about 2 percent, compared with 3.3 percent in 2016. (Table 1). Sugar production fell by about 25 percent to 137,000 tons, reflecting industrial action in response to restructuring of the industry. The mining sector also showed a significant decline because of a flattening in gold output in 2017 compared to the massive increase in the previous year. On the other hand, there was a pickup in growth in selected agricultural products, mainly rice, as well as in the forestry and fishing industries. Growth in these areas offset falling production in the sugar and livestock industries. Production in the rice industry grew by about 18 percent, reaching 630,000 tons. This improvement reflected an increase in the acreage planted in both the Spring and Autumn crops, as well as an enhancement in yield.
Table 1. Guyana: Selected Economic Indicators 2013
2014
2015
2016
Est. 2017
(In percent) Real GDP
5.2
3.8
3.1
3.3
2.1
Consumer prices (average)
1.9
0.7
-0.9
0.8
1.5
Consumer prices (end of period)
0.9
1.2
-1.8
1.5
1.5
(In percent of GDP) Private investment
8.3
8.3
8.3
8.0
8.2
Public investment
8.6
8.2
5.6
6.9
8.7
-13.3
-9.6
-5.7
0.4
-6.7
4.0
3.5
3.5
3.6
3.2
205.4
206.4
206.5
206.5
206.5
Current account balance Gross official reserves (mths of imports) GY dollar/US dollar (period average) Sources: Ministry of Finance and IMF.
2. The services sector has continued its steady growth path. Growth in this sector was led by an 8.7 percent expansion in wholesale and retail services and a 3.9 percent upturn in transportation and storage services. The main setback in this sector took place in financial services, which fell by 2 percent, well below an expected growth of 5.8 percent envisaged at
2
the time of the budget presentation. On the other hand, the pace of activity in construction more than doubled to 11.4 percent. 3. In 2017, inflation remained restrained at 1.5 percent, largely reflecting slow growth in consumer spending and the relative stability of the exchange rate. The inflation rate was lower than anticipated, in spite of the Bank of Guyana’s accommodative monetary policy. Consumption was slower relative to the high spending during Guyana’s Golden Jubilee in 2016. 4. The current account balance shifted from a small surplus in 2016 to a deficit of 6.7 percent of GDP in 2017. This reflected lower gold exports and a pickup in international oil prices. The deficit on the services account was lower than expected, reflecting an improvement in factor services that more than offset weaker balances in non-factor services. The current account deficit was financed largely by foreign direct investment in the oil sector and by loan disbursements to the public sector. Increased foreign investment in oil exploration and regional investment in the services sector allowed the reserve coverage to be maintained at about 3.2 months of imports, just marginally below the level at the end of the previous year, but remaining above the Bank of Guyana’s benchmark for reserve adequacy of 3 months. Table 2. Guyana: Balance of Payments (in millions of US dollars) 2015
2016
Est. 1/ 2017
-181.5
13.0
-235.0
-287.4
-292.6
-340.4
-7.2
-147.2
-196.2
-226.2
71.4
-13.2
181.8
228.0
212.9
2.3
-53.2
0.0
-10.1
0.0
-107.7
-53.3
-53.1
-69.5
-79.7
107.7
53.3
53.1
69.5
79.7
Bank of Guyana NFA
55.7
-2.0
-20.1
12.1
6.5
Exceptional financing
52.0
55.3
73.2
57.4
73.2
3.1
2.6
17.7
17.7
17.7
48.8
52.8
55.5
55.5
55.5
Current account Merchandise trade Capital account Errors and omissions Overall balance Financing
Of which:
Debt relief Debt forgiveness
Source: Ministry of Finance, Bank of Guyana, and Statistical Bureau. 1/ Projections presented with the Budget for 2018. 2/ Revised estimates in April 2018.
Revised 2/ 2017
Proj. 1/ 2018
3
5. The exchange rate depreciated somewhat in 2017. However, the exchange rate was not flexible enough to prevent an appreciation of Guyana’s real exchange rate, reflecting the impact of a strong U.S. dollar. De facto exchange rate flexibility would soften the impact of terms of trade shocks. The steady buildup in international oil prices and the decline in gold exports have added pressure to the balance of payments, and Guyana is now more vulnerable to large terms of trade shocks given its dependence on imported oil and the concentration of its exports on a few commodities. The IMF has classified the exchange rate regime as a de facto stabilized arrangement, with very limited movements that are insufficient to offset external shocks. Exchange rate flexibility, together with appropriate fiscal and monetary policies, is needed to contain the current account deficit. 6. The economy is expected to grow by about 3½ percent in 2018. This would reflect a rebound in the performance in the mining sector, and some stabilization in agricultural production. The strong performance in rice production, nonfinancial services, and construction is expected to continue in the current year. Growth in 2018 will receive a major boost from the launch of several public sector infrastructural projects that will be geared towards improving links between the coastal and interior regions. It will also be supported by budget interventions that will act as a catalyst for private sector investments. Inflation will continue to be subdued in 2018, reflecting relative exchange rate stability and a slow buildup in international oil prices.
II. A Review of Central Government Operations in 2017 7. As measured by the size of the overall deficit of the central government, fiscal performance is estimated to have deteriorated marginally in 2017. The deficit grew from 4.4 percent of GDP in 2016 to 4.7 percent of GDP in 2017 mainly as a result of the higher rate of implementation of the public investment program. The data for 2017 are based on provisional estimates and this review attempts to document the individual budgetary items that contribute to this fiscal outturn, Receipts of Revenues and Grants 8. Revenue receipts and grants were buoyant in 2017. Revenues increased from 24.5 percent of GDP in 2016 to 26.2 percent of GDP in 2017, while grants grew from 1.1 percent of GDP to 2.1 percent of GDP during the same period (Table 1). These improvements were broad-based and tax receipts benefited from increased collections of VAT, excise taxes, withholding taxes and company income taxes which are associated with the solid growth registered by some sectors of the economy. Although there was an overall increase in revenue receipts, non-tax revenues are estimated to have declined during 2017. This decline occurred despite the improvement in the financial performance of some public enterprises which enabled them to pay higher dividends to the central government, and stricter enforcement of the policy of transferring excess cash balances of statutory agencies to the Consolidated Fund.
4 Current Expenditures 9. In spite of efforts to maintain a lid on current expenditures, there was a significant increase in spending during 2017. Expenditures grew to 25.1 per cent of GDP from 23.5 percent of GDP in the previous year. This increase was explained not only by higher expenditures on wages and salaries and goods and services, but also, to a lesser extent, by transfers which went mainly to loss-making public enterprises. In the non-financial public enterprise sector, the operations of several public enterprises were profitable, reflecting recent financial reforms. These include the Guyana Rice Development Board, the Guyana Post Office Corporation, and GuyOil. However, as a result of the financial losses made by other public enterprises, in particular GuySuCo and Guyana Power and Light (GPL), transfers from the central government were still necessary, resulting in an overall increase in transfers. 10. In the case of GuySuCo, the public enterprise has been saddled with a business model that fails to maximize profits. It was structured around efforts to protect employment levels while operating in an international sugar market characterized by depressed prices. The subsidies required from the central government for the loss-making public enterprises were larger in 2017 than in 2016, despite reforms that were introduced to improve cost efficiency and productivity. With regard to other items of expenditure, interest payments remained at about 1 percent of GDP, partially reflecting the comparatively low interest rate environment and the continued impact of the Multilateral Debt Relief Initiative conducted in 2006 and 2007. Operating Balance 11. As in the previous years, the operating balance was in surplus in 2017, increasing to 3.2 percent of GDP from 2.1 percent of GDP in 2016. This improvement can be attributed to the enhanced receipts of revenue and grants which more than offset the increases in current expenditure items.
5
Table 3. Central Government Financial Operations (In percent of GDP) 2016 Revised
2017 Prov. Estimates
Total Revenue and Grants Tax Revenue Non-tax Revenue Grants
25.6 21.0 3.5 1.1
28.3 23.0 3.2 2.1
Current Expenditures of which: Transfers Interest Current expenditures excl. Transfers & Interest
23.5 9.3 0.9 13.3
25.1 9.8 1.1 14.2
Operating Balance
2.1
3.2
Capital Expenditure
6.4
7.9
-4.4
-4.7
4.4 1.1 3.3
4.7 1.5 3.2
Overall Balance Financing Net External Financing Net Domestic Financing Total Public Sector Debt (projected end of period, in percent of GDP)
45.7 External 33.2 Domestic 12.5 Sources: Budget Speech; Minister of Finance, November 2017: National Accounts Statistics, Bureau of Statistics, Government of Guyana.
46.8 34.7 12.0
Capital expenditure 12. The central government ramped up the implementation of the public sector investment program (PSIP) during 2017. Responding to the concerns expressed for several years in official circles that implementation of the PSIP had fallen short of what is required to support economic needs, it is estimated that there was a significant increase in capital expenditure in 2017. Spending rose from 6.4 percent of GDP in 2016 to 7.9 percent of GDP in 2017. A detailed breakdown of the composition of the public investment program is unavailable at this time but the higher level of capital expenditure is based on firm indicators, despite the slow pace of implementation during the first half of the year.
Overall deficit
6
13. At 4.7 percent of GDP in 2017, the overall deficit of the central government was moderately higher than the deficit in 2016, despite the marked rise in the capital expenditure program. The relative stability of the overall deficit is explained by the higher operating surplus in 2017 which was sufficiently large to provide the resources needed to fund much of the increase in capital expenditure. Financing 14. As in previous years, the overall deficit was largely financed from domestic sources. Net domestic financing was relatively stable at 3.2 percent of GDP in 2017. At the same time, net external financing grew from 1.1 percent of GDP to 1.5 percent of GDP––evidence of the close relationship between the PSIP and the associated funding provided by external donors. Public debt 15. Total public sector debt increased from US$1,601.1 million in 2016 (45.7 percent of GDP) to US$1,662.4 million (46.8 percent of GDP), an increase of 3.8 percent. 1 While net financing of the overall deficit of the central government from domestic sources exceeded net financing from external creditors in 2017, outstanding external debt was significantly larger than domestic debt in both 2017 and 2016. At US $1,234.54 million, external debt comprised 34.7 percent of GDP in 2017 while domestic debt accounted for only 12 percent. Of the outstanding external debt, the major share is owed to multilateral creditors. This debt has a long maturity profile and low average interest rates, reflecting the concessional terms on which these loans were extended. At US$427.83 million, outstanding domestic debt in 2017 is mainly in the form of short-term treasury bills which have maturities of up to 1 year. Longerterm bonds still comprise only a small share of the outstanding domestic debt.
III. The Financial Sector Introduction 16. At the end of 2016 the financial system in Guyana comprised 6 commercial banks with 40 branches, and 6 nonbank financial institutions. The central bank also had responsibility for supervising 16 insurance companies, 41 pension plans, 19 cambios
1
Public sector debt includes the debt of the central government and the debt of the non-financial public enterprises that is guaranteed by the central government.
7
authorized to carry out foreign exchange transactions, and 4 money transfer agencies. 2 There are also about 24 credit unions, supervised by the Ministry of Labour and Cooperatives. 3 17. There are no publicly available consolidated data on the amount of resources held in the entire financial system. The Bank of Guyana presents consolidated asset/liability data only on the banking system, and summary assets/liabilities of certain groups of other institutions including insurance companies, trust companies, and pension funds. A rough estimate of the size of the financial system can be derived by summing the resources in the banking system and those of the nonbank institutions, and deducting from that total the deposits of the nonbanks in the banking system to avoid double counting. 4 A calculation along those lines would give a result of G$531 billion, or US$2.6 billion, equivalent to about 70 percent of GDP (Table 4). 18. The financial system is supervised by the Bank of Guyana, the central bank. The bank issues licenses for banking operations, sets minimum capital adequacy, liquidity, and reserve levels, and has the power to intervene in institutions, appoint liquidators and administrators, and take possession and wind up institutions.5
2
Bank of Guyana Annual Report, 2016; https://www.bankofguyana.org.gy/bog/images/research/Reports/ANNREP2016.pdf 3 Caribbean Regional Financial Stability Report, 2015; http://www.ccmfuwi.org/files/publications/crfsr/crfsr_2015.pdf. Undated statistics on the website of the Caribbean Confederation of Credit Unions show that total assets of 24 credit unions in Guyana amounted to G$21.6 million https://caribccu.coop/cccu-affiliates/guyana/ 4 There are other transactions that will need to be offset, including loans between banks and nonbanks. 5 Financial Institutions Act, 1995, Available at: https://www.bankofguyana.org.gy/Documents/Legislation/BOG%20Act/Financial%20Institutions%20Act%201 995.pdf
8
Table 4. Guyana: Estimated Resources in the Financial System (in millions of US dollars)
Resources in the banking system 1/
G$mn
% of GDP
349,814
46
213,188
28
32,262
4
530,740
70
2,576
70
Resources in the nonbank institutions 2/: New Building Society Trust
62,350
Companies
11,580
Finance Companies Domestic Insurance Companies
51,060
Pension Schemes
36,486
51,702
Total nonbank resources Less deposits of nonbanks in banks Total resources in the financial system In US$mn
Sources: Bank of Guyana Statistical Bulletin and September 2017 IMF Country Report on Guyana. 1/ Defined as money and quasi-money, or private sector bank deposits plus currency in circulation. 2/ Defined as total assets.
Developments in the banking system 19. Over the five years ending 2017 resources in the banking system (mainly private sector deposits) increased by about 4-5 percent a year, except for 2015, when they grew by less than 2 percent. 6 In broad terms, the growth in resources was in line with that of nominal GDP. 20. With interest rates at historic lows (time deposit rates have remained at just over 1 percent since 2013), there is little incentive for the private sector to place new deposits for purposes of income or yield. Alternatives to bank deposits are limited or similarly low yielding. The 3-month treasury bill rate averages about 1.5 percent, most interest rates in nonbanks range from 1–2 percent, and the local stock exchange generates low turnover as a result of a limited number of tradeable stocks. Surplus private sector savings in search of yield are likely being channeled into real assets like housing and construction, land, or the mining industry. 21. Bank lending to the private sector, including for mortgages, grew by 15 percent and 10 percent in 2013 and 2014, respectively, but slowed to 2½ percent a year in 6
Resources are defined as private sector deposits plus currency in circulation, referred to in the Bank of Guyana statistics as “money and quasi-money”.
9
2016–2017. The growth of mortgage loans averaged 4 percent a year in 2016–2017 and lending to individuals and businesses grew by 1½ percent a year. Central bank data show that there has been a downward trajectory since 2014 in lending to agriculture (except rice) and since 2015 in manufacturing. Lending has been driven by demand in the retail, services, and household sectors. 22. Lending to the central government by the banking system increased by $28 billion in 2015 and $22 billion in 2016, but remained unchanged in 2017. There was renewed borrowing amounting to $22 billion (US$106 million) in the first three months of 2018. Central government deposits and loans in commercial banks have remained broadly stable since 2014, so most of its borrowing originated at the central bank. In the Bank of Guyana’s statistics, the bank’s assets which are classified as claims on (lending to) the government are presented as largely unchanged at about $1 billion since 2014. The government’s borrowing is presented under the bank’s liabilities as a negative deposit, or overdraft. On April 25, 2018, the overdraft stood at $52.7 billion, or US$255 million.7 Public enterprises built up their deposits in the banking system by $13 billion in 2015-2016, but drew down $25 billion (US$124 million) of these deposits in 2017. Recent policy changes 23. Progress is being made in three areas that are important for fostering a more resilient financial system. These are deposit insurance, an emergency liquidity facility, and enhanced open market operations. Legislation that would introduce deposit insurance has been drafted and is making its way through parliament. 8 On its approval Guyana will join The Bahamas, Barbados, Jamaica, and Trinidad & Tobago, which have already established deposit insurance schemes. The law would establish a Deposit Insurance Corporation, governed by a board. The corporation would collect premia from financial institutions, 9 manage a Deposit Insurance Fund, and guarantee deposits up to G$2 million (about US$10,000). Branches of foreign owned financial institutions will not be covered by the Scheme. 24. Legislation has also been drafted to enhance the central bank’s powers in open market and credit operations with financial institutions. 10 For the first time, the legislation authorizes the central bank to lend or borrow precious metals. The legislation also grants power to the central bank to provide emergency liquidity assistance (ELA) to deposit taking financial institutions, on the basis of adequate collateral, for periods not exceeding 91 days. Repayment of ELA loans will be guaranteed by the Ministry of Finance.
7 Bank of Guyana Statement of Assets and Liabilities. https://www.bankofguyana.org.gy/bog/images/research/Reports/abmar2018.pdf 8 Deposit Insurance Bill, 2018, Bill No. 7 of 2018. Available at: http://parliament.gov.gy/chamber-business/billstatus/deposit-insurance-bill-2018/ 9 The initial premium to be paid by each financial institution will be equivalent to 1.5 percent of insured deposits. The legislation provides for the imposition of an extraordinary premium if warranted. 10 Bank of Guyana (Amendment) Bill 2018, Bill No. 6 of 2018. Available at:
Issues and risks
10
25. In recent years steady growth in bank deposits combined with weak demand and/or supply of credit to the private sector have resulted in ultra-low interest rates and significant excess liquidity in the banking system. These conditions have created risks including the possible development of price bubbles for real assets such as property. When combined with inflows into the economy from oil and gas beginning in 2020, these conditions could intensify price bubbles, fuel inflation, and contribute to an appreciation of the real exchange rate. 26. At the same time the conditions provide opportunities. The government could take advantage of them to refinance debt or issue new debt to help cover its ambitious infrastructure programmes. Also, those private sector firms looking to expand their operations could tap into low cost local financing through the stock exchange or private placements. 27. The level of nonperforming loans (NPLs) remains high at 13.2 percent of total loans and advances at the end of 2017. 11 The ratio is high by Caribbean regional standards. In a recent study at the IMF, Guyana had the fourth highest ratio in 2016, higher than those of Barbados, Belize, Trinidad and Tobago, Suriname, and Jamaica. The highest ratios have occurred in the agriculture, manufacturing and services sectors. Concentration of NPLs is concerning. In 2015 about a quarter of loans to agriculture were nonperforming, one bank had an NPL ratio of 23 percent, and half of all banking system NPLs were concentrated in one domestic bank. 12 Given the size of the nonbank financial sector (total assets equivalent to 28 percent of GDP) it will be important also to assess NPLs and associated risks in institutions such as finance houses, trust companies, and the building society. 28. High NPLs may generate a negative feedback loop in which they inhibit new lending, which, in turn, dampens economic activity and creates conditions for new NPLs. They also affect banks’ risk assessments, contributing to the very high interest rate spreads. The IMF study mentioned above notes that some of the key factors affecting NPLs include macroeconomic conditions, credit risk management practices in some banks, weaknesses in the legal framework and practices relating to loan recovery, and the absence of a market for distressed assets. 29. There is a need for greater transparency in the statistics on government borrowing in the central bank’s statistics. Such borrowing should be shown as loans or advances under the bank’s assets, and not as negative deposits, particularly since the bank’s statistical tables provide for advances to the government. In the bank’s March 2018 Statistical Abstract the column headed “Advances” in Table 1.1 shows no advances. A clearer presentation would improve public understanding of the operations of the banking system and the central government. Bank of Guyana and IMF. Beaton, K., et al (2017) “Problem loans in the Caribbean: Determinants, Impact and Strategies for Resolution”, IMF Working Paper 17/230. 11 12
11
30. Also relating to statistics, it is important that policymakers and the central bank monitor closely the size, interrelationships, and developments in the entire financial system. Being able to do this requires ascertaining the size of the nonbank financial sector and consolidating those balances with the banking system data. This will permit improved monitoring of nonbanks as a group as well as of the entire financial system. Table 4: Guyana: Financial Sector Indicators (billions of Guyana dollars) 2012 2013 2014 2015 2016 2017
March 2018
Bank of Guyana Total assets Foreign assets Government deposits Government overdraft
259.5 175.0 57.3 --
234.7 160.2 52.1 --
208.0 137.5 21.4 --
188.8 123.6 -2.3
220.1 123.2 -21.3
221.9 120.5 -25.7
205.8 101.9 -46.4
Commercial Banks Total assets In percent of GDP Private sector deposits % change Loans to private sector 1/ % change Business Individuals Mortgages % change mortgages
378.1 64.9 233.5 12.0 155.4 21.4 80.1 26.8 48.5 20.6
413.6 67.4 242.9 4.0 178.8 15.1 91.2 30.9 56.7 16.9
421.8 66.4 247.4 1.9 196.7 10.0 101.7 30.9 64.1 13.1
442.9 67.5 250.6 1.3 208.2 5.8 101.7 34.9 71.6 11.7
467.3 65.8 259.5 3.6 213.2 2.4 102.0 36.7 74.5 4.1
471.1 62.0 267.1 2.9 218.5 2.5 103.5 37.1 77.9 4.6
478.7 ‌ 275.8 4.6 215.5 2.7 102.5 34.5 78.5 3.8
Banking System Net domestic credit % change Public sector Government Rest of public sector Money and Quasi-Money % change
99.0 5.9 -44.9 -0.6 -44.3 301.8 11.5
123.8 25.1 -36.1 16.7 -52.8 313.4 3.8
154.9 25.1 -25.8 28.3 -54.1 329.6 5.2
184.6 19.2 -6.4 56.3 -62.7 334.5 1.5
198.9 7.7 7.0 78.1 -71.1 351.0 4.9
218.6 9.9 27.4 78.9 -51.5 367.2 4.6
231.2 17.4 46.8 101.2 -54.4 369.9 6.8
582.7
614.1
635.3
656.5
709.7
759
‌
GDP
billions of G$
Source: Bank of Guyana 1/ Includes mortgage loans. Source: Bank of Guyana Banking System Statistical Abstract.