REPORT CARD 2021 Northern Gulf Reporting from data from July 2020 to June 2021 www.gulfsavannahnrm.org 2020-2021 overall environmental score up from 3.2 in 2020 7.14 out of 10 For more information about this score, refer to the Environment page inside
Case studies
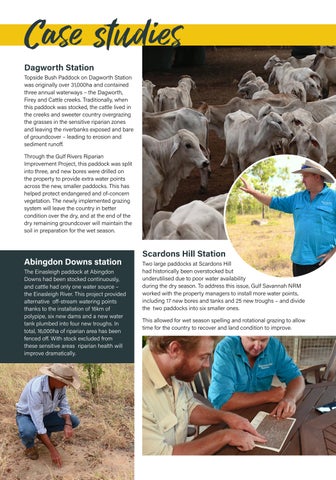
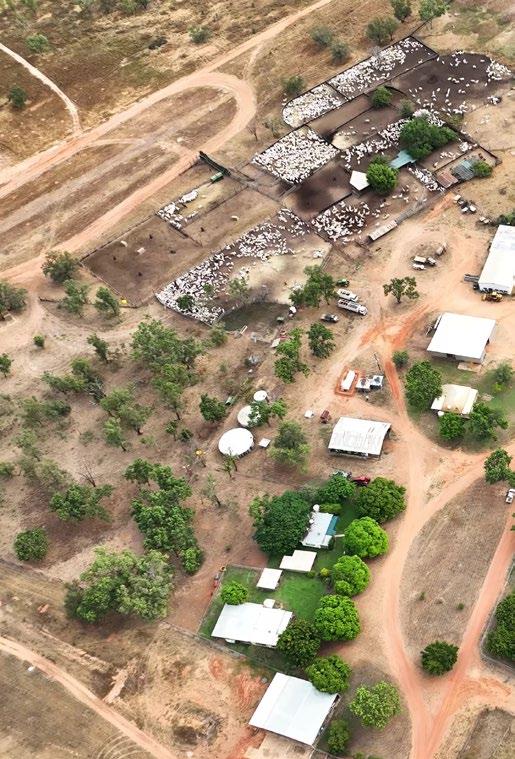
Dagworth Station
Topside Bush Paddock on Dagworth Station was originally over 31,000ha and contained three annual waterways – the Dagworth, Firey and Cattle creeks. Traditionally, when this paddock was stocked, the cattle lived in the creeks and sweeter country overgrazing the grasses in the sensitive riparian zones and leaving the riverbanks exposed and bare of groundcover – leading to erosion and sediment runoff.
Through the Gulf Rivers Riparian Improvement Project, this paddock was split into three, and new bores were drilled on the property to provide extra water points across the new, smaller paddocks. This has helped protect endangered and of-concern vegetation. The newly implemented grazing system will leave the country in better condition over the dry, and at the end of the dry remaining groundcover will maintain the soil in preparation for the wet season.
Abingdon Downs station
The Einasleigh paddock at Abingdon Downs had been stocked continuously, and cattle had only one water source –the Einasleigh River. This project provided alternative off-stream watering points thanks to the installation of 16km of polypipe, six new dams and a new water tank plumbed into four new troughs. In total, 16,000ha of riparian area has been fenced off. With stock excluded from these sensitive areas riparian health will improve dramatically.
Scardons Hill Station
Two large paddocks at Scardons Hill had historically been overstocked but underutilised due to poor water availability during the dry season. To address this issue, Gulf Savannah NRM worked with the property managers to install more water points, including 17 new bores and tanks and 25 new troughs – and divide the two paddocks into six smaller ones.
This allowed for wet season spelling and rotational grazing to allow time for the country to recover and land condition to improve.


Burlington station
Fencing was established on Burlington Station to create a new grazing management regime. Rubbervine was treated across an area of more than 100ha. Three new watering points and a submersible pump have been installed to improve stock management across the property, reduce grazing pressure and improve the condition of native vegetation.
Ooralat Station
At Ooralat Station, the station owners destocked their river frontage to the Einasleigh River for 12 months to increase the pasture biomass around an infestation of Rubbervine.


They then waited for sufficient rain to dampen the soil to protect native grasses and seedbank before implementing a strategic controlled burn.
Working in conjunction with Indigenous rangers from neighbouring Talaroo Station, they conducted the burn using a combination of conventional and traditional burning methods to burn off and kill rubbervine infesting the riparian area. This will improve the condition of native vegetation along the 28km stretch of the Einasleigh River.
Key outcomes of these case studies
The condition of over 99,492ha of native vegetation was improved
Over 192km of fencing installed
41km of water pipelines, 2 water pumps, 7 dams, 28 water tanks, 24 water bores, 51 water troughs were installed
Weeds were controlled on
1,502ha of land
The amount of sediment flowing into waterways was reduced on 61,091ha of land
7,882 pigs were removed from riparian areas
Approx $1,814,000 of in-kind landholder funding was leveraged consisting of labour, equipment, materials and contractor costs
These projects were delivered through the Natural Resources Investment Program, which is funded by the Queensland Government.
ENVIRONMENT
The mean amount of moisture in the soil was about above average
Average since 2000 was 452mm, in 2021 it was 483mm
Leaf area index was above average
Average since 2000 was 0.91 m2/m2 , in 2021 it was 0.98 m2/m2.
Tree cover was higher than average
Since 2000 was 7.4%, in 2021 it was 8.9%
River inflows were about average
Average since 2000 was 297.8mm, in 2021 it was 243.6mm
Vegetation

growth was above average
Average since 2000 is 302.83 gC/m2 , in 2021 it was 357.21 gC/m2.
The area of unprotected soil* was below average
Average since 2000 is 13.6%, 2021 is 11.8%.
* Annual mean of soil unprotected by vegetation or litter
The overall environmental score has been determined by a combination of environmental and climatic data sets. In 2019-20 period, the region was still grappling from the effects of floods earlier in 2019, combined with above average maximum temperatures, number of hot days and below average vegetation growth and river flows. These figures were produced by the Australian National University.

 These figures have been derived from the Centre for Water and Landscape Dynamics, Australian National University (2020)
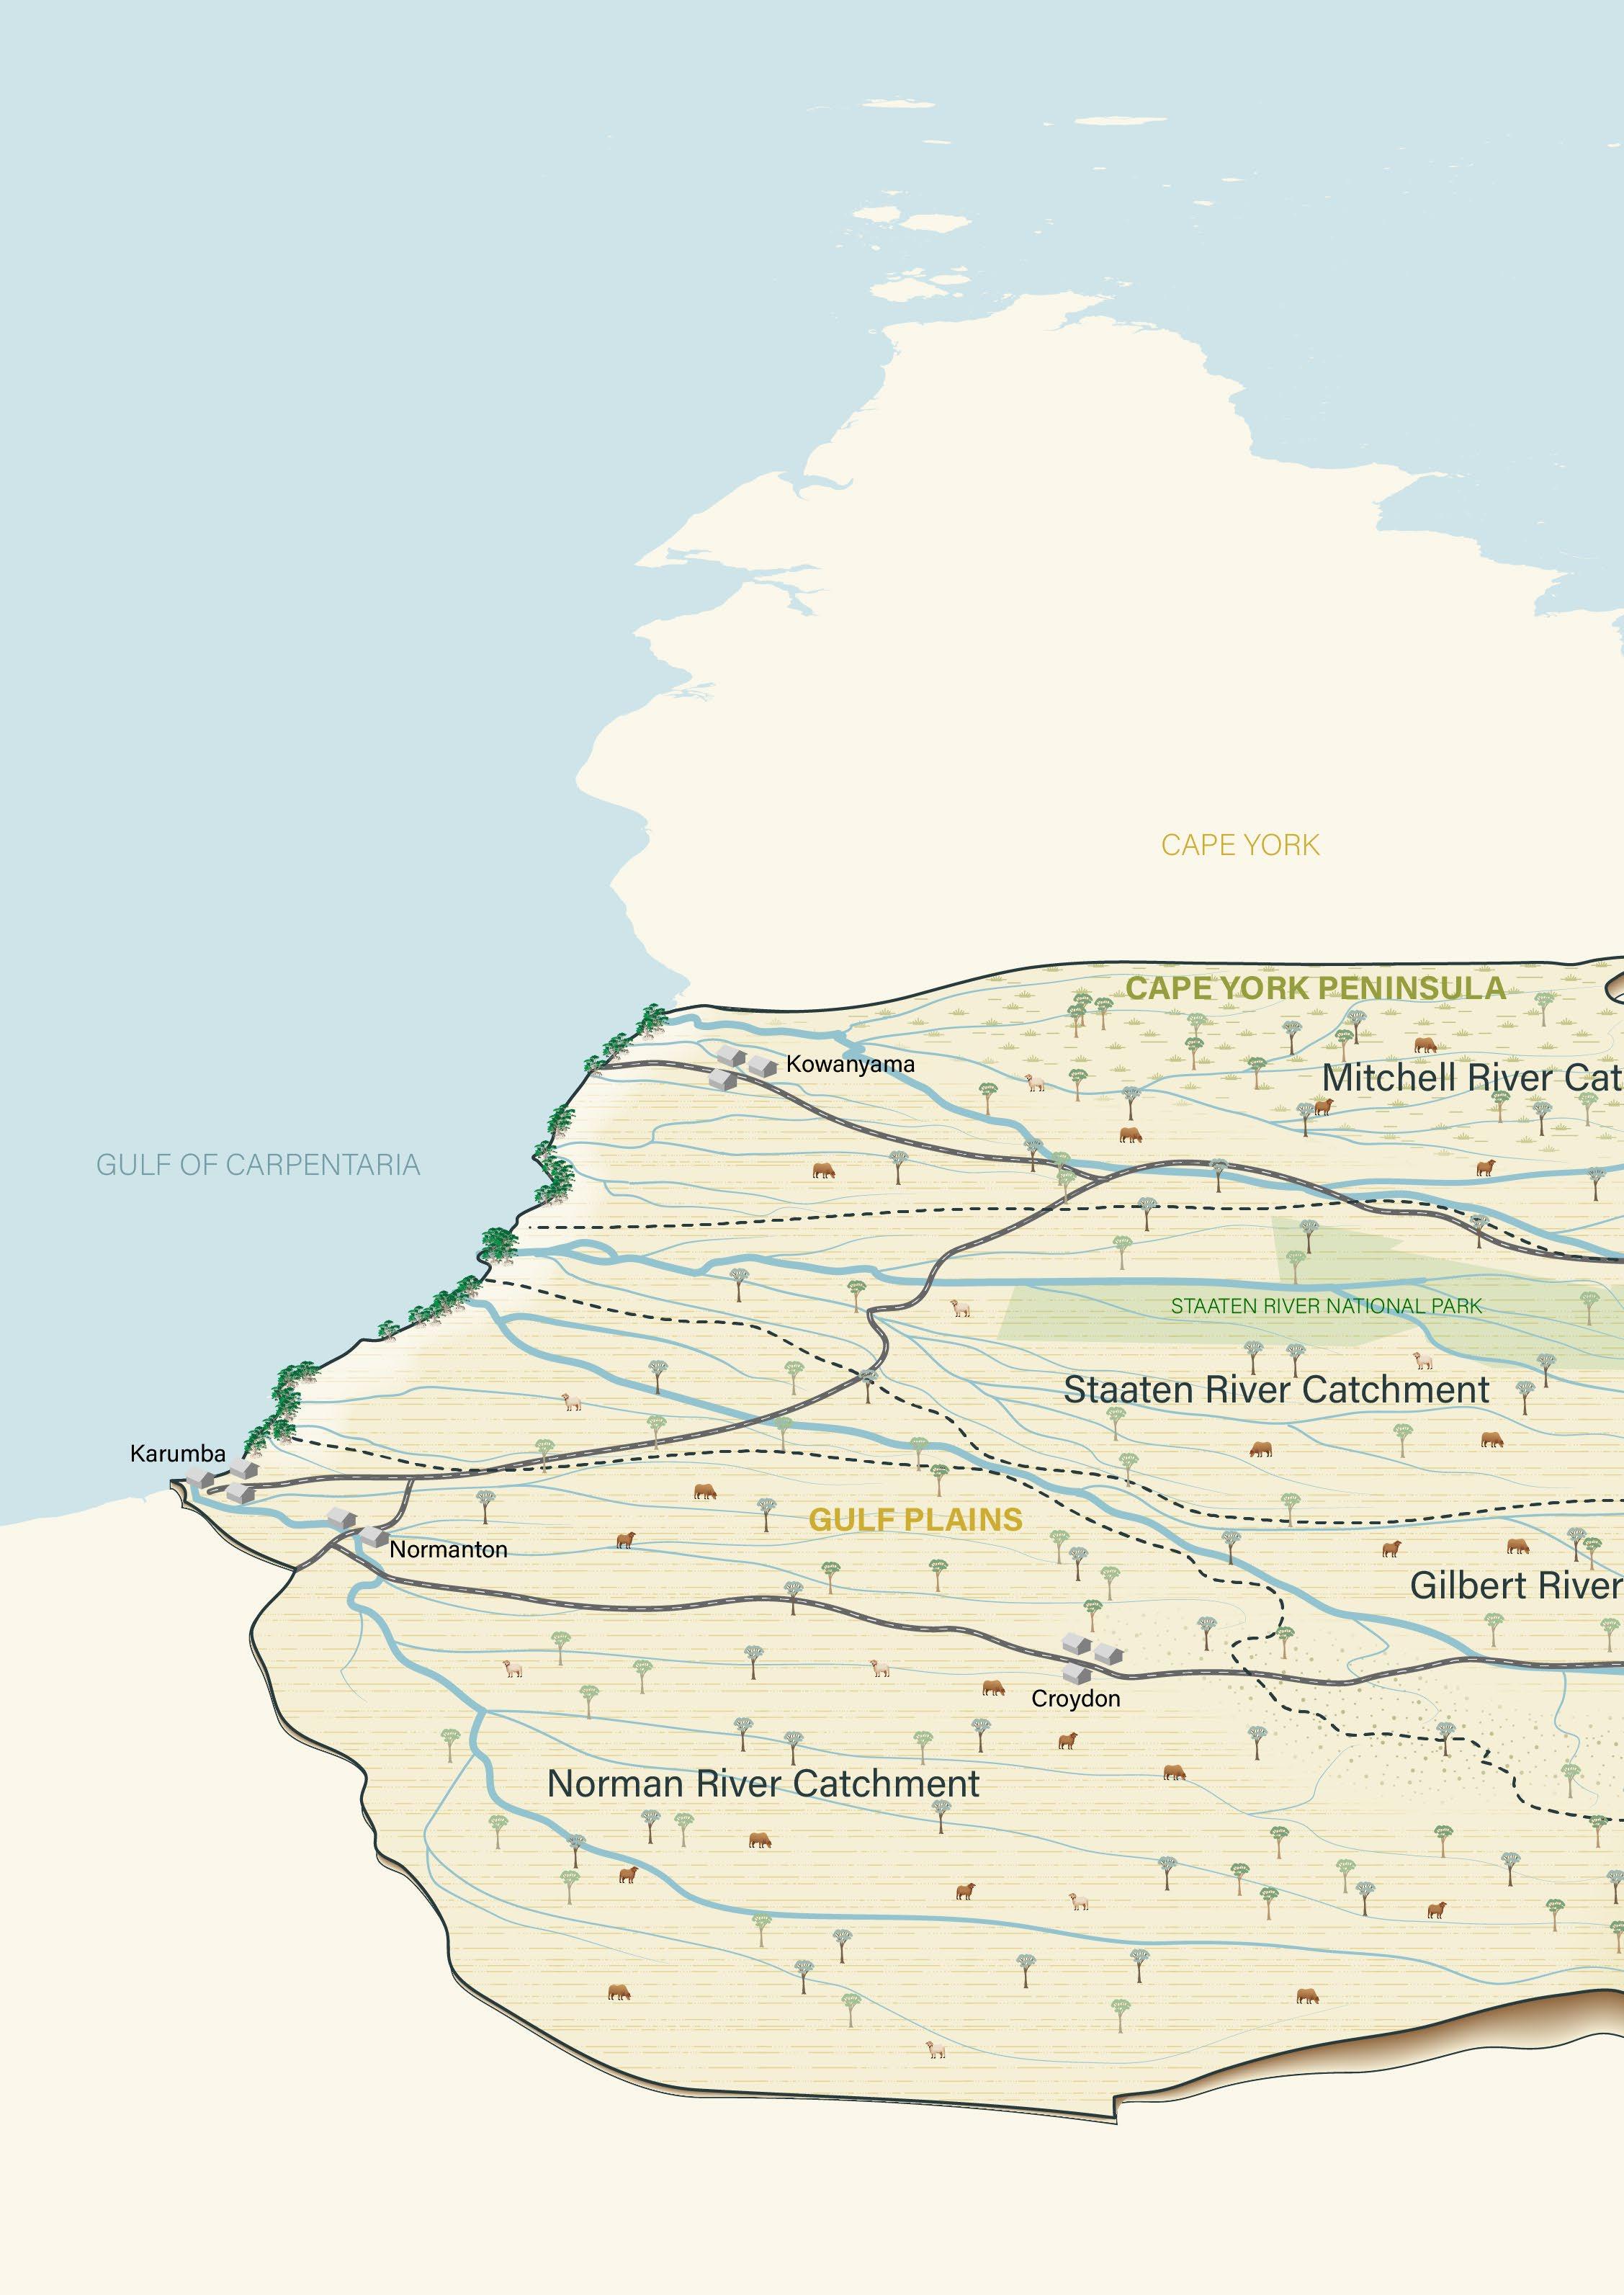
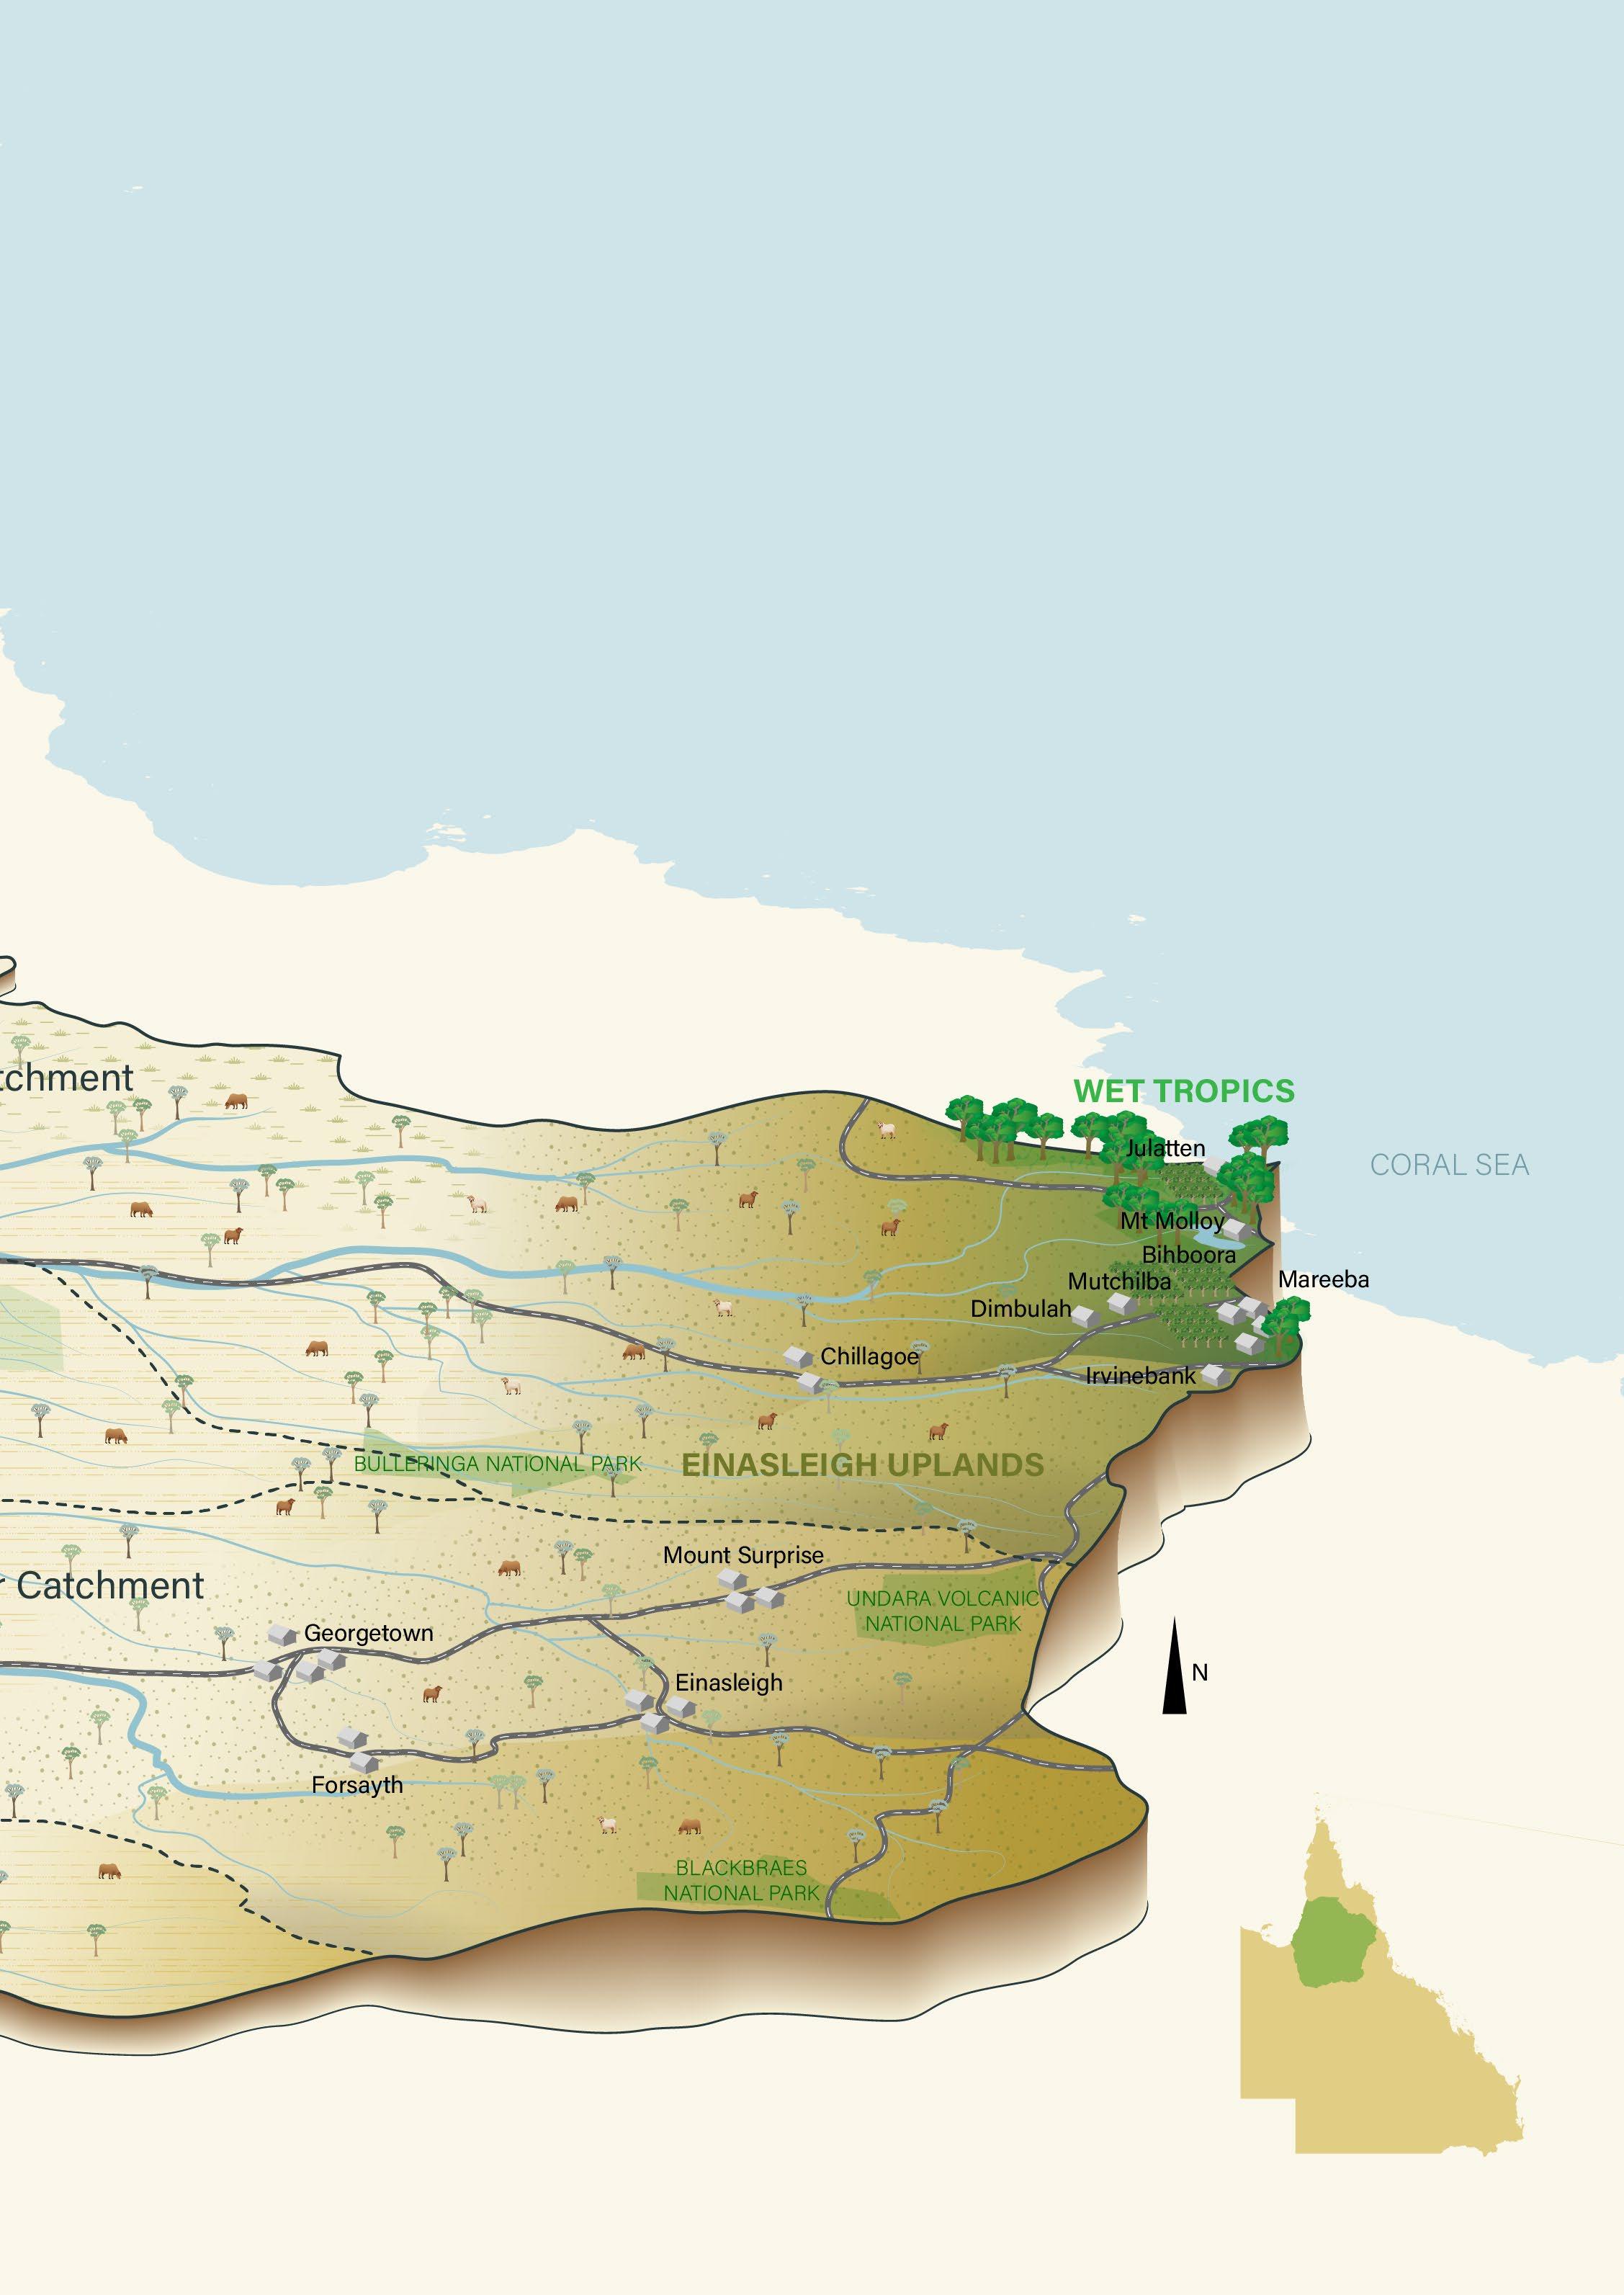
OVERVIEW OF THE NORTHERN GULF
Population
9,392
Land area
194,062 SQ KM
Total number of agricultural holdings
412
Source: ABARES AGRICULTURAL COMMODITIES BY NRM Region 2020/21 - Land mainly used for agricultural production Category Count Increase from 2021 of 0.75%. Increase since 2001 was 7.8%, Queensland population has grown by 30% in same period.
REGION
Land use
Land set aside for conservation/ protection purposes
Of the area within land holdings reported in ABARES Agricultural Commodities, 20/21
1% 94%
Land mainly used for agricultural production
Land mainly used for grazing
96.9%
2% Other areas not used for agricultural production
3%
Land not used for agricultural production
Land mainly used for crops
2.7%
Land mainly used for forestry (including plantation and native forest)
0.33%
Land mainly used for other agricultural purposes
0.02%
ECONOMIC Top 5 subdivisions by industry for employment: Agriculture, forestry and fishing 17.5% Health care and social assistance 12.2% Public administration and safety 9.1% Education and training 8.6% Retail trade 7.7% 888,410 HEAD IN 2020-21 down from 965,652 in 2019-20 Cattle price $4.85 P/KG CWT July 2019 $7.54 P/KG CWT June 2020 $9.30 P/KG CWT June 2021 $23.6 MILLION for entire Gulf inshore fishery Gross value of production 1,754 TONNES Fisheries catch for 2019-20 SOCIAL Percentage of income generated by farm Percentage of total population that is Indigenous Total median income Carpentaria and Croydon shires are in most disadvantaged 20% Mareeba and Etheridge shires are in most disadvantaged 40% Population change 2001–2021 84% 19% $40,045 +7.8% Socio-economic Disadvantage and Index of Education and Occupation (IEO) and Economic Resources (IER) 2018-19 data Average age of a land manager 54 YEARS OLD Sources: ABS 2021 Census data, Queensland regional profiles (Qld Government statistician’s office, Queensland Treasury) qgso.qld.gov.au, Local government area profiles, Tourism research Australia, Economic and social indicators for the Queensland Gulf of Carpentaria inshore fin fish fishery (publications.qld.gov.au) power plants maps of Queensland (dnrm.qld.gov.au) 62 MW EXISTING 250 MW UNDER CONSTRUCTION Renewable energy generation MW PLANNED 1045 $724,793,222 5% of Queensland production over that period Total agricultural production in 2020-21 in the Northern Gulf region was
ACKNOWLEDGEMENT OF COUNTRY
respectfully acknowledges the Traditional custodians and the First people of the land and water on which we work and live.
CLIMATE
Gulf Savannah NRM PO Box 2077 MAREEBA Qld 4881 www.gulfsavannahnrm.org Carbon emissions from fire were below average Average since 2003 is 28.33 gC/m2 , in 2021 it as 22.98 gC/m2 Inundation was above average Average since 2000 is 1.25%, in 2021 it was 1.28% Maximum temperature was about average Average since 2000 is 40.16°C, 2021 was 40.03°C. 35°C Minimum temperature was above average Average since 2000 is 8.19°C days, 2021 was 9.79°C The number of days above 35°C was above average Average since 2000 is 92.5 days, 2021 was 97.6 days.
IN 2021
Savannah NRM
Carbon uptake by vegetation was above average Average since 2000 is 302.83gC/m2 , in 2021 it was 357.21 gC/m2
Gulf