Early Childhood Community Needs Assessment Final Report 2024
Prepared for Guilford County Partnership for Children by Mary
Beth Gilbert, Evaluation Innovations, LLC
Acronyms
DIBELS………………………….. Dynamic Indicators of Basic Early Literacy Skills
ECE Educator …………………… Early Childhood Educator
ECE ……………………………… Early Childhood Education
FCCH ……………………………. Family Childcare Home
GCPC ………………………… .. Guilford County Partnership for Children
GCS …………………………....… Guilford County Schools
NC ……………………………….. North Carolina
NCPC…………………………….. North Carolina Partnership for Children
NC Pre-K ………………………… North Carolina Pre-Kindergarten
TS Gold ………………………….. Teaching Strategies Gold Assessment
The Partnership…………………... Guilford County Partnership for Children
Introduction
The Guilford County Partnership for Children began the development of a 3-year strategic road map in the spring of 2024. As part of the planning process, an Early Childhood Community Needs Assessment (Needs Assessment) was conducted. The goals of the assessment were to describe the young children, their families and those that serve them in Guilford County and identify gaps in data and knowledge about needs related to early childhood services The Needs Assessment also aimed to contribute knowledge about how the Guilford County Partnership for Children (the Partnership) is supporting it’s mission to partner with families, early childhood educator, and our community to support the diverse needs of children, prenatal to age five, ensuring their success in school and in life.
To achieve the primary goal of providing comprehensive information to inform the Partnership’s strategic planning efforts to strengthen its services, the Needs Assessment consisted of three key activities:
1) Reviewing and synthesizing existing county-level data and recent community needs assessment reports addressing the services and needs of families with children birth to age five in Guilford County, 2) conducting listening sessions with families and early childhood educators, and 3) administering a community-wide survey of parents/caregivers, early childhood educators, service providers serving the target population and other stakeholders with a voice about the needs of children ages prenatal to five years old not yet in school and their families.
This report will first describe the data collection procedures and methodology, and the demographics of Guilford County by looking at trend data and projections and comparing to the state and other similar counties when an informative comparison is available and finally, findings that were gleaned from the data analysis.
Methodology
Instrumentation and Procedures
The Partnership administration and contracted staff developed the instrumentation used for the community survey and listening session (focus group) protocols. All instrumentation tools were designed to address the goals described above. Copies of these tools are included in the Appendices, which include the following:
• Early Childhood Community Needs Assessment Survey
• Focus Group Guide for Early Childhood Educators, Directors, and Family Child Care Home Providers
• Focus Group Guide for Parents/Caregivers
Community Needs Assessment Surveys
Community Needs Assessment Surveys (community surveys) were developed to collect input from parents/guardians of children prenatal to 5 years old not yet in kindergarten, licensed and unlicensed childcare staff (including directors, early childhood educators and family childcare providers), service providers (including administrators, service providers and support staff) and other stakeholders with knowledge about needs of the target population.
Table 1: General Survey Content Areas Collected from Respondent Stakeholder Groups
Respondent Category
Parents/ Guardians Childcare Staff Service Providers/Other Stakeholders Survey Content Area
x x x experience or frequency with 29 identified issues (personally or for families served)
x x identification of most serious issues
x x x open-ended questions regarding concerns about raising children and preparing them for kindergarten and beneficial programs
x early literacy skill related questions
x childcare experience related questions
x x community resource challenges
x communication and social media usage x childcare staffing, turnover, benefits/wages, and childcare related service and training needs
x awareness of and referral to the Partnership and funded programs
x service population, type and location of service, barriers to service, identification of system strengths and weaknesses
x demographic questions x childcare demographic questions
Survey Monkey software was used to collect the online survey. All surveys for various stakeholder groups were included in one combined weblink with question item branching based on respondents’ position with questions relevant to each stakeholder group The online family survey included both English and Spanish translation. Hard copies of surveys were prepared in English, Spanish, Arabic and Urdu. The survey was designed to take each respondent less than 15 minutes to complete, although it could have taken a respondent longer if they chose to provide more in-depth responses to the open-ended questions on the survey. To encourage participation, twenty random survey respondents were selected to receive a $50 gift card to Target. In order to keep the survey responses anonymous, respondents who were interested in entering the drawing were directed to a separate form upon completion of the survey where they provided their contact information and entered the drawing. In addition, survey respondents were asked for their interest in participating in follow-up focus group listening sessions by providing their contact information at the end of the survey
Survey respondent recruitment included a combination of strategies including self-selection and snowball sampling (i.e., recruitment materials were widely distributed through such channels as the Partnership website, social media, electronic newsletter distribution list and mass media including print and local television news). The survey was launched on April 6th at the GELC (Guilford Early Learning Collaborative) conference and remained open until June 7th, 2024. An extension was included in this time frame to allow time for collection of additional second language hard copy surveys by community partner programs. The online survey link was sent via e-mail directly to all current parent/guardian program recipients through multiple community partner databases and to all licensed childcare providers served through multiple means including community partner email distribution lists and during large training events. These populations could have received multiple notices of the survey through this distribution method. In addition to sharing with current clients, Partnership administration and community partners were also asked to share with their own personal and professional networks. Two funded programs made concerted efforts to collect responses from clients with limited English and literacy skills which included Reading Connection’s Family Literacy program and Every Baby Guilford’s Adopt-A-Mom program. These programs made individual face-to-face and phone contacts with clients to ensure receipt of the survey and provided survey completion assistance as needed. Due to these concerted efforts, a large sampling of Spanish language surveys was secured
Focus Group Listening Sessions
All data collection for focus group listening sessions occurred virtually via Zoom using the appropriate focus group guide and were recorded for transcription purposes. Focus groups were approximately one and a half hours in length of time. Summary notes also were taken during the sessions. An incentive was offered to focus group participants in the form of a $100 valued gift card or check, which was sent to participants following completion of the focus group listening sessions. Recruitment for focus group listening sessions was done by emailing an interest registration form to all survey respondents that had previously expressed interest. In addition, the interest registration was also advertised on social media and broadly sent to various electronic newsletter email distribution lists. A total of 9 focus groups were scheduled, three were with Parents/Caregivers, six were with ECE Professionals (1 for NC Pre-K site Directors, 2 for Childcare Directors, 1 for Family Childcare Home providers, 1 for Early Educators of ages infant/toddler and 1 for Early Educators of ages 3–5-year-olds.) The focus group participants were asked to complete a demographic survey at the beginning of the listening sessions Characteristics of participants are to be included in the following Sample section below.
Synthesis of Three Data Sources
Once the data from the community surveys, focus group listening sessions, and county-level statistical data review were gathered, coded, and summarized, a final review and synthesis was conducted by the Partnership and contracted staff. This final step was conducted to combine the three primary data sources to create an integrated description of the early childhood landscape in Guilford County.
Sample Group Demographics of Community Needs Assessment Survey Respondents and Focus Group Participants
Four primary categories of survey respondents were prioritized for data collection: families (parents/guardians for children prenatal to age 5 not yet in school), ECE educators, ECE administrators/directors, and other types of professionals working with families and children ages prenatal to age 5
Parent/Guardian Respondents/Participants
Based on a sample size calculation, a target sample of 381 parent/guardian respondents was needed to establish a 95% confidence level +/- 5% and to reflect the target population that is representative of the of 31,550 (NC OSBM, 2024) 1 children ages 0to 5years-old not yet in school. This age group is 5.7% of Guilford County’s total population of 553,023 residents. Survey responses were cleaned to remove any survey responses considered invalid due to lack of responses to the large majority of the survey, unrealistic response patterns or repeated responses from the same IP address with matching multiple entries from the repeated names in prize entry file. While the prize drawing incentive was included in the opening of the survey, it was intentionally not advertised on social media outlets to avoid phishing devices developed for the purpose of fraudulently entering drawings such as used in this project. To ensure that any gift card drawing winners were members of the intended survey population, they were asked to verify their Guilford County mailing address before being provided with their gift card.
With 408 completed parent/guardian valid responses, the desired confidence level was exceeded. A confidence level of 95% reflects the amount of acceptable probability, or certainty, that the confidence interval would contain the true population parameter when you draw a random sample many times. However, it should be noted that the analysis and findings offered in these findings are based on the viewpoints of those able and willing to participate and may be different from those that chose not to or were unable to respond.
The sample size collected was not large enough to be statistically confident to generalize by ethnic and racial groups. Table 2 presents basic demographic information about the survey sample in this study as compared to the 2024 population projections of the NC Office of State Budget and Management (NCOSBM) and Guilford County Schools K-12 enrollment. This data is provided to evaluate the extent to which the sample is representative of these reference groups. As noted above in the methodology section of this report, there was an oversampling of Spanish speaking families as a result of survey recruitment among two funded programs that primarily serve families with limited English proficiency. In addition, due to the differences in the race and ethnicity category format among the NCOSBM and the combined race/ethnicity question on the survey, this analysis has some complexities that are difficult to tease out. For example, Hispanic respondents often respond differently depending on the format of the race/ethnicity questions. The survey responses for race are presented with non-respondent frequencies excluded. Regardless of the presentation, it appears there is somewhat of an over representation of families identifying as Hispanic and under representation of families identifying as white.
Parent/Guardian Survey Respondents*
Guilford County Population Ages 0-5 Not Yet in School1 & 2
*Excludes responses of Prefer not to answer or no response. Other includes multi-racial responses, Sudanese, Arab and African write-ins. **Ethnicity reported separately in NCOSBM data per 2010 censes categories.
K-12 Enrollment3
Table 2. Comparison of Demographic Characteristics among Parent/Guardian Survey Respondents and the Overall Guilford County Population Projections for 2024
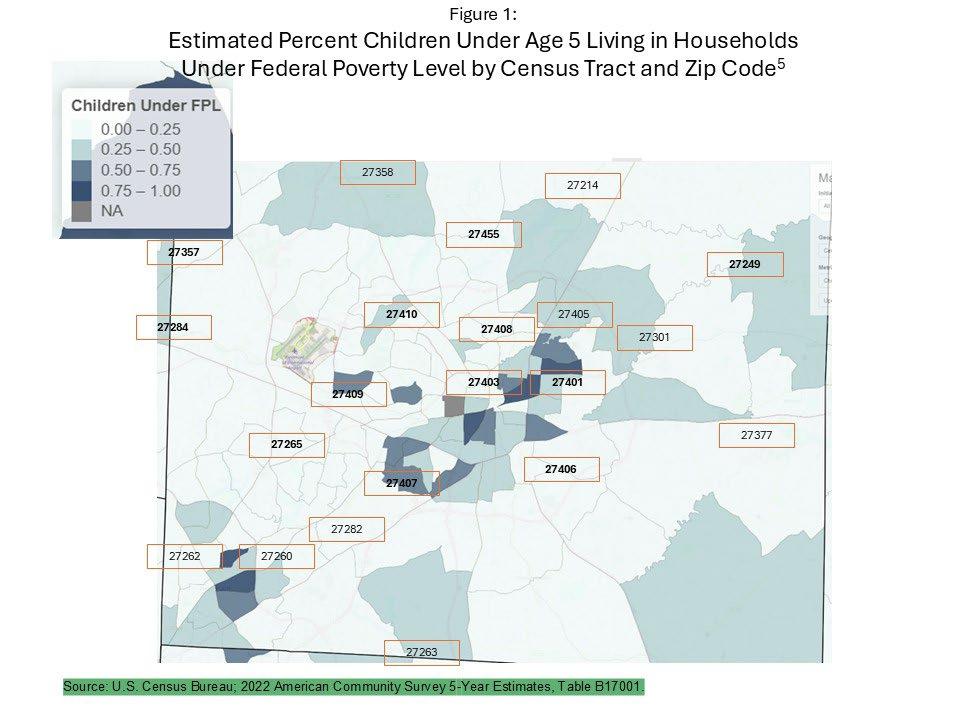
Figure 1 illustrates the percentage of children under age 5 living in households that are under the federal poverty level for each census tract across Guilford County with the highest percentages in south and east central Greensboro and High Point City.4 The map is overlayed with zip code locations
Table 3 shows the percentage of parent/guardian survey respondents and parent focus group participants by zip code compared to the distribution of total population in Guilford County by zip code. The distribution shows good coverage of the county among survey respondents. For zip codes with more than 3 percentage point difference (over or under) between survey response rates and population statistics, they are marked with gray shading. It is noted that there is an over representation of respondents from higher poverty areas and all areas of under representation of responses are in lower poverty census tracts. This over representation for higher poverty areas is considered acceptable since these families with higher risk factors associated with poverty are a higher priority for services. Note that the largest percentage of respondents choosing to complete the survey in Spanish were reported living in the zip code area, 27260 (34% of Spanish survey respondents compared to 10% of English survey respondents).
Table 3. Comparison of Zip Code Distribution of
Table 4 reports other demographics of parent/guardian respondents. The majority of respondents identified as female and were mothers/stepmothers to young children in the household.
The median household income in Guilford County is $62,880 (in 2022 dollars) according to census estimates (US Census, 2023)7. Based on the distribution of responses to the family/household income categories, it is estimated that the median income would be significantly lower among survey respondents compared to the total population with 75.8% of respondents reporting household incomes below $64,000.
When taking into account income and number of adults and children in the household, the 2024 unemployment rate for Guilford County was 4.3% (NC Department of Commerce, March 2024)8 compared to 36.0% of survey respondents indicating that they were currently unemployed. This is likely due to the percentage of young mothers responding to the survey in addition to over sampling in higher child poverty zip codes versus under sampling in lower child poverty zip codes.
Table 4. Parent/Guardian Survey Respondents Demographics
In a committed relationship, and I live with my partner.
a committed relationship, and I do not live with my partner.
(widow)
not to answer
Primary Language Spoken in the Home
(French 3, Korean, Idoma, ASL)
Family/Household Income Level
Less than $22,000/yr (less than $1,833/ month)
$22,000 up to $30,000/yr ($1,833-$2,500/ month)
$30,000 up to $40,000/yr ($2,500-$3,333/ month)
$40,000 up to $48,000/yr ($3,333-$4,000/ month) 35 8.6%
$48,000 up to $56,000/yr ($4,000-$4,666/ month) 18 4.4%
$56,000 up to $64,000/yr ($4,666-$5,333/ month) 17
$64,000 up to $72,000/yr ($5,333-$6,000/ month) 7 1.7%
$72,000 or more ($6,000/ month or more) 35 8.6%
Working Status
Child Care Professionals, Service Providers and Other Stakeholder Respondents/Participants
Tables 5 and 6 report the frequency of responses by position of respondents (childcare staff, service providers and other stakeholders). Based on a population of 1,675 caregivers in licensed facilities according to NC DCDEE childcare enrollment report (Division of Child Development, June 2024)9, the target sample size needed was 313 early childhood educator survey respondents to establish a 95% confidence level +/- 5% With 118 licensed childcare teacher responses, this falls far short of statistical reliability of the sample; therefore, caution should be used in any inferences made from this data. Similarly, the samples of family childcare home providers (FCCHs) and administrators also fall short of statistical confidence.
Table 5. Child Care Staff Survey Respondents and Focus Group Participants by Position
Table 6 reports other demographics of childcare survey respondents. The majority of respondents identified as female which is reflective of the population of the population of childcare providers in the county. Approximately two-thirds of childcare survey respondents (66.5%) and childcare staff focus group participants (65.6%) identified as African American compared to 36%. of the general population of Guilford County of females between the ages of 20 and 65 years old (NCOSBM 2024)1.
A large majority of respondents who identified as childcare teaching staff (83.1%) reported a household income below $64,000. Again, the median household income in Guilford County is $62,800 (in 2022 dollars) according to census estimates which illustrates the lower overall household income the survey population compared to the general population.
Race/Ethnicity
Table 6. Childcare Provider Staff Survey Respondents
Demographics
2023 Workforce Study Demographics for Guilford County10
Family Household Income
$40,000 up to $48,000/yr ($3,333-$4,000/ month)
$48,000 up to $56,000/yr ($4,000-$4,666/ month)
$56,000 up to $64,000/yr ($4,666-$5,333/ month)
$64,000 up to $72,000/yr ($5,333-$6,000/ month)
or more
*Race/Ethnicity question combined for GCPC Needs Assessment and separate questions for NC Workforce Study.
Tables 7 reports the position of the remainder of other stakeholder survey respondents that are not included in the parent/caregiver or childcare group respondents. And Table 8 reports the ages served by this group of survey respondents. The large majority (82%), of respondents reported serving children ages birth to five years old.
Table 7. Other Stakeholder Survey Respondents by Position
Table 8. Other Stakeholder Respondent Demographics
100 of 125 other stakeholders excluding K teachers What groups do you provide services for: (mark all that apply)
Data Analyses
To identify themes in the qualitative data gathered through the focus groups and community surveys open-ended responses, summary notes of each focus group session were examined using an iterative process of both content and thematic analysis. Project staff reviewed the identified themes throughout participants’ responses, and were used to examine how prevalent the themes emerge within the documents. For example, reference to a lack of time or resources may have emerged as a theme and frequency scale coding revealed how often this theme emerged across the data. This process then allowed the researchers to examine the data for main themes, which was then summarized in the aggregate to identify recurring themes across participants. The qualitative survey responses were again thematically analyzed for main themes and the cleaned quantitative data were coded (qualitative labels were assigned a number) and analyzed in Excel using descriptive statistics – frequency, percentage, and mean ratings.
Findings
The findings presented for the three data sources: community surveys, focus groups and existing county data are organized by the following topics:
• Population Description and Trends
• Overall Family/Child Issues
o Parent/Caregiver perspective
o Service Provider perspective
• Early Literacy, School Readiness and Kindergarten Transition
o Exceptional Needs
• Early Childhood Education
o Childcare
o Workforce
• Resource Awareness and Communication
• Social Determinants of Health
Population Description and Trends
Table 9 shows the current estimated total population for all ages for 2024 compared to NC and other large counties and growth for the last ten years, and projections for the next five years. The data indicates that Guilford County had a ten-year overall population increase of 7.9% which is less than NC and other large county comparisons (from 512,560 to 553,023). Guilford ranked 8th among all 100 counties in NC for population growth rate over the last ten years, well below Wake, Mecklenburg, and Durham counties. Similarly, Guilford County’s overall population growth rate projection for the next five years of 3.5% is somewhat below the NC projected growth rate and below all five other large county comparisons (NC OSBM, 2024)1.
Table 9. Total Population (All Ages) Trends From 2014 to 2024 for Guilford
Table 10 indicates overall population growth for young children mirrors the projected population growth rate for the overall population of all ages. The estimated population of children ages 0-5 not yet in school represents 5.7% of the total population for all age groups.
Table 10: Guilford County Five Year Population Growth Trends by Child Age and Overall Population2
Table 11 and Figure 2 report the preschool population estimated numbers and percentage of total population by race and ethnicity for 2024 for Guilford, comparison counties and NC (NC OSBM, 2024)2&4.
Table 11. Guilford County, NC, and Comparative Counties 2024 Population Estimates by Race and Ethnicity for Young Children
Figure 2:
Guilford County, NC and Comparative Counties 2024 Population Estimates by Race for Young Children Ages 0-5 Not Yet in School2
Table 12 shows current and five year estimated young children population projections for Guilford County by race and ethnicity. The population projections show a slight decline in the percentage of black population (1.3 percentage point decrease) and a 3.2 percentage point increase in Hispanic ethnicity population from 2024 to 2029.
Guilford County Five Year Population Growth Projection Trends by Race and Ethnicity for Young Children
Of the entire population 5 years and older in North Carolina (native- and foreign-born), 88% speak English at home. This 2018-2022 period estimate is a statistically significant decrease from the 89% of the population who spoke English at home during the previous 5-year period (2013-2017), but well above the 78% of the population for the nation (ACS, 2013-17)6 There were 28 counties that experienced statistically significant declines in the percentage of the population 5 years and older who spoke English at home.
Table 13 reports the estimated overall population for 2017 and 2022 with percentage change by Guilford County municipality (ACS, 2017-2022) 6. In addition, this table reports the number of under 5-year-old population estimates for 2022 for each municipality. Gibsonville, Oak Ridge, and Stokesdale municipalities had the highest growth rates of overall population over the last five years while Whitsett, Jamestown, and Sedalia had declines in population.
6
Table 12.
Table 13. Guilford County Municipality Five-Year Growth Trends
Figure 3 further illustrates the trend of an increase of percentage of Hispanic preschool population (ages 0-4) over the last ten years and continuing projections for the next ten years for Guilford County, NC, and comparative large counties. By 2034, both NC and Guilford County are projected to have nearly a quarter (24%) of their preschool population of Hispanic ethnicity (NCOSBM, 2024)4.
Figure 3: Percent of Ages 0-4 Population that is Hispanic Trends From 2014 to 2034 for Guilford, Comparison Counties and NC Statewide4
Durham Forsyth Guilford Mecklenburg Wake NC
According to the Guilford Comprehensive Plan Guiding Guilford Moving Forward Report released in July 2024, Guilford County is one of the more diverse counties in the NC with a Esri Diversity (DI) score of 70.7% (up from 62.3% in 2010)11. The report indicates that “DI represents the likelihood that two persons chosen at random from the same areas, belong to different races or ethnic groups. The index provides a measure that ranges from 0 (no diversity) -100 (complete diversity)”. Guilford County’s DI score is above NC (65.1%) and somewhat below the national average of 71.6%. Figure 4 illustrates diversity distributions by census tract in Guilford County.
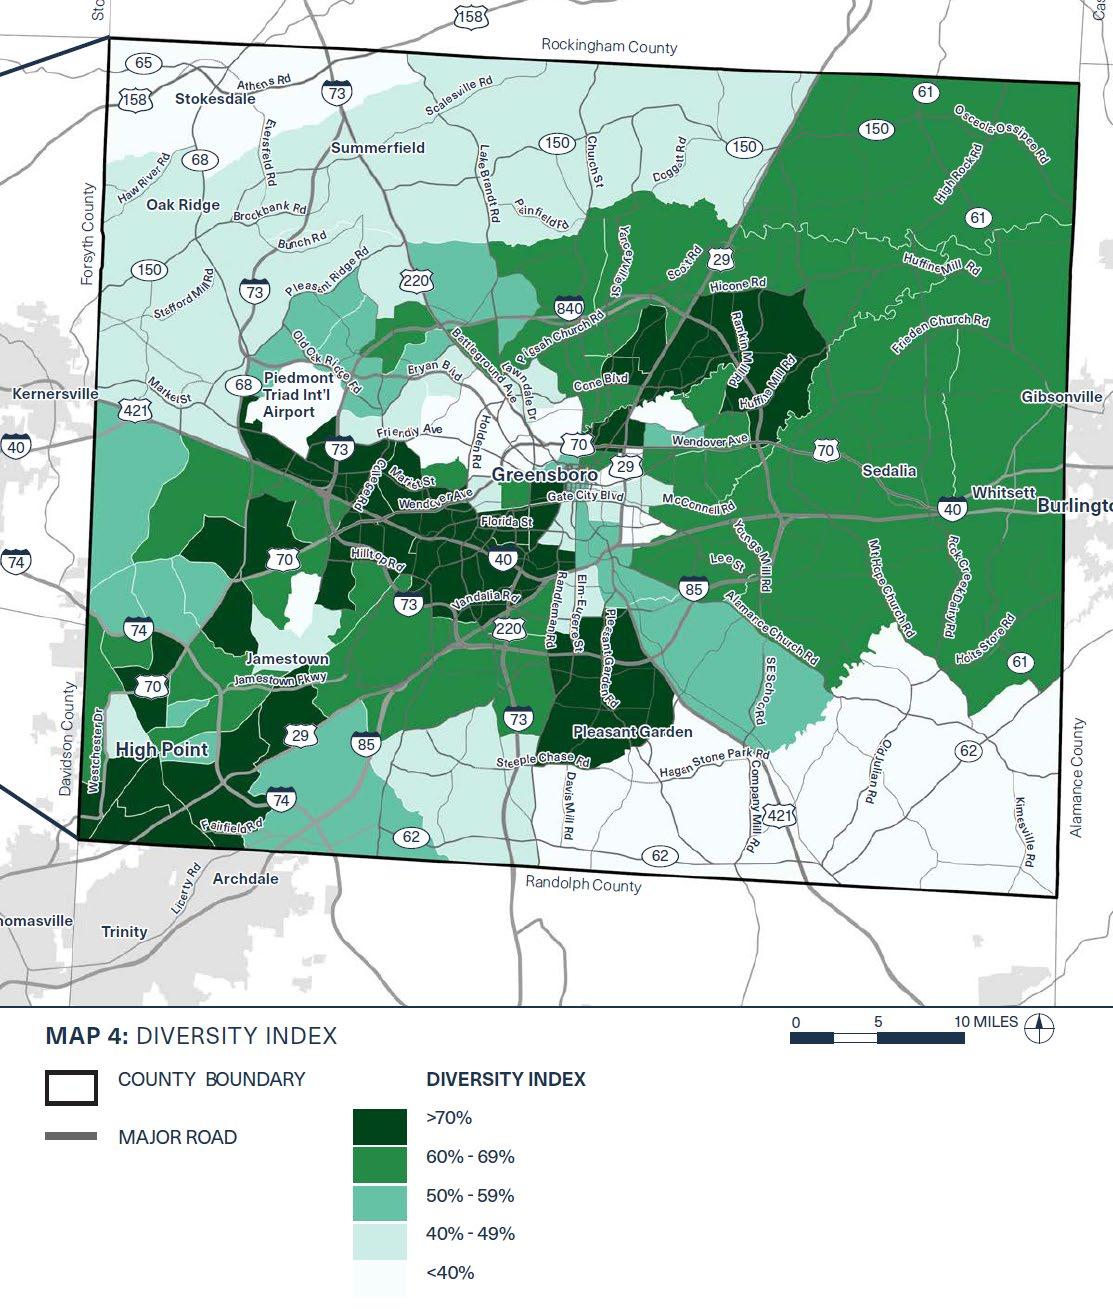
Figure 4: Esri Diversity Index (DI) score by Guilford County Census Tracts11
Table 14 reports key demographics for mothers giving birth in 2023 for Guilford County and NC residents. Nearly half (47.9%) of Guilford County mothers were unmarried, which was higher than NC resident mothers (40.7%) (NC Center for Health Statistics, 2023)12 A slightly higher percentage of mothers in Guilford County (39.8%) had a high school diploma or less education compared to NC mothers giving birth in 2023 (36.9%). There is a slightly lower percentage of teens mothers among Guilford residents (4.2%) compared to NC residents in 2023 (4.4%). All three demographics are highest among African Americans followed by Hispanic subgroup at both the county and state levels.
Table 14. Percent of Unmarried Mother's, Mother's with High School Education or Less and Mother's Younger than 20 Year's Old with Live Births in 2023 for Guilford County and NC Residents by Race/Ethnicity12
Race/Ethnicity
Unmarried Mothers
Mothers with High School Diploma or Less Education
Mother's Less than 20 Years Old
Overall Family Issues in Guilford County
Parent Respondents were asked to report the frequency of issues for themselves or members of their families. Meanwhile, Other Respondents were asked how often these same issues occurred for the families they serve. Figure 15 and Figure 16 report the ranked percentages of responses for issues occurring sometimes or often for both survey respondent groups. The top five highest priorities identified by Parent Respondents were related to family economic issues such as affordable and available childcare, recreation, and insurance coverage. Other Respondents identified challenging child behaviors, affordability and availability of childcare, children with special needs services and general parenting support or child development information as the top five priority issues.
Table 16 reflects the reporting of Other Respondents, namely the ECE stakeholders, that indicated ‘Challenging Behaviors’ as the top issue for families with children ages birth to five. This is at odds with the self-reported issues indicated by parents seen in Table 15.
Parent Respondents
Table 15: Ranked Percent of Parents/Caregivers Indicating Issues for Themselves or Family Members Sometimes or Often
12. Alcohol/drug abuse
14. Family violence/ domestic abuse/ child neglect
13. Teen pregnancy
15. Literacy, trouble reading or writing
27. Overweight children, lack of physical activity for children
10. Crime or safety issues
9. Hunger (food shortage)
25. Children with challenging behaviors
26. Lack of general parenting support or child development information
24. Services/care for children with special needs (speech, physical,…
22. Access to child mental health services
17. Access to early childhood books, learning materials and supplies
21. Access to adult mental health services
19. Access to prenatal care
11. Discrimination (Racial, ethnic, sexual orientation, pregnancy, other)
16. Communicating in English
28. Opportunities to make friends with other families with children the…
6. Transportation
29. Family-friendly workplace
3. Availability of high quality childcare or Pre-K when I need it, such as…
5. Access to affordable housing
8. Access to healthy food
7. Unemployment, underemployment or availability of jobs
18. Access to affordable medical care
20. Access to affordable dental care
23. Affordable health insurance
2. Availability of high quality childcare or Pre-K near home or work
4. Access to affordable recreational activities, parks, camps or after-…
1. Affordable high quality childcare or Pre-K
Other Respondents (ECE Stakeholders)
Table 16: Ranked Percent of Stakeholders Indicating Issues for Families with Children Ages Birth to Five that They Serve Sometimes or Often
19. Access to prenatal care 12. Alcohol/drug abuse 13. Teen pregnancy
9. Hunger (food shortage)
11. Discrimination (Racial, ethnic, sexual orientation, pregnancy,…
14. Family violence/ domestic abuse/ child neglect
27. Overweight children, lack of physical activity for children
15. Literacy, trouble reading or writing
10. Crime or safety issues
20. Access to affordable dental care
21. Access to adult mental health services
29. Family-friendly workplace.
22. Access to child mental health services
28. Opportunities to make friends with other families with children…
18. Access to affordable medical care 23. Affordable health insurance
16. Communicating in English
7. Unemployment, underemployment or availability of jobs
5. Access to affordable housing
3. Availability of high quality child care when I need it
17.Access to early childhood books, learning materials and supplies
4. Access to affordable recreational facilities, parks, camps or after-…
8. Access to healthy food
24. Services/care for children with special needs (speech, physical,… 26. Lack of general parenting support or child development… 6. Transportation
2. Availability of high quality child care near home or work 1. Access to affordable high quality child care
25. Children with challenging behaviors
Parent survey respondents were asked to report any community resource challenges they have experienced. Figure 17 illustrates that 45% of respondents indicated they have experienced waitlists for services and nearly 42% indicated they did not know what services are available.
Figure 17: Parents' Report of Community Resource Challenges You They Have Experienced
There are language and cultural barriers for my family to access services that we need.
Transportation is a barrier to my family in accessing services that we need.
I feel embarrassed when I have to reach out for help. My family was not eligible for services offered.
I don't know what resources and services are available to my family.
I have experienced long waitlists for services and resources (e.g. counseling, health care, subsidies)
In the Community Needs survey, 318 of 408 families responded to the question about childcare and educational challenges they have experienced. Figure 18 reports that slightly over half of responding families indicated the cost of their childcare was too high.
Figure 18: Parents Report of Childcare and Educational Challenges They Have Experienced
I don't know what I can do to help my child be ready for kindergarten.
I don't know what my child is supposed to do at this age to be on track.
The childcare options in this community don't match up with my work schedule.
I don't know where to go for help paying for child care.
It is hard to understand the options for childcare/preschool in Guilford County.
There are long waitlists for the childcare facility(ies) where I would like to send my child.
The cost of preschool/childcare is too high.
Early Literacy, School Readiness and Kindergarten Transition
Early Literacy
Parent and caregivers were asked how confident they feel in helping their child(ren) learn early literacy skills on a scale of 0 (not confident, unable to help) to 10 (very confident). Figure 19 indicates that both primary Englishspeaking parents and other language parents feel fairly confident in this area with English speaking parent showing slightly more confidence.
Figure 20 shows that most parents reported access to children’s books in the home with over half reporting at least over 25 children’s books available in their home.
Figure 19: Parent Confidence in Helping their Child(ren) Learn Early Literacy Skills? (from 0 to 10)
Figure 20: Percent of Parents Reporting Number of Children’s Books at Home (Include own or borrowed)
Figure 21 shows that only 30% of the parents reported reading daily to their children, and 43% reading two or fewer times each week to their child(ren). This rate is comparable to the percentage of Dolly Parton Imagination Library family survey reporting 35% daily reading prior to program participation and to 54% after program participation (Figure 22) (NC Partnership for Children, 2023)13. This implies that the availability of books for families and accompanying early literacy strategy tips can increase the occurrence of literacy activities with children.
Figure 21: Parent/Caregiver Survey Report of How often do you read to / look at books with your child(ren)?
Several times a day
Figure 22. Dolly Parton’s Imagination Library Parent Literacy Survey Results13
Outcomes from the Smart Start Literacy Programs FY2023
School Readiness
The Dynamic Indicators of Basic Early Literacy Skills (DIBELS) measures early literacy skills acquisition from kindergarten through sixth grade. Short fluency measures are used to regularly monitor the development of early literacy and early reading skills. DIBELS is a predictor of children’s acquisition of literacy strategies. Figure 24 reports the DIBELS results at the beginning of the year for Guilford County kindergarteners from 2016 to 2022 (Ready for School Ready for Life, 2022)28. The number of children who are considered ready in terms of language and communication dropped steadily from 2016 to 2022. The gap in assessments from 2019 to 2022 was due to the inability to assess during COVID. The dramatic drop in DIBELS proficiency among all Guilford County kindergarteners from 2019 to 2022 may be attributed to the impacts of distance learning during COVID.
Figure 25 reports the proficiency rates among kindergartners as the beginning of the 2022 school year by race and ethnicity. The data illustrates proficiency gaps between Black and Hispanic students compared to white and Asian students.
25: GCS Kindergarten Beginning of Year English Language/Communication Proficiency (at or above benchmark) by Race/Ethnicity28
Figure 24: Guilford County Schools Kindergarten Beginning of Year English Language/Communication Proficiency (at or above benchmark)28
Figure
Looking further along the learning path of children to third grade reading and math achievement, Figure 26 shows that 2024 Guilford County third graders scored less proficient than students statewide in reading (44.4% and 48.6%, respectively) (NC DPI, 2024)14 Similarly, GCS third graders for all comparative subgroups scored below NC statewide with exception of white students who score above NC students statewide. Racial, economic, language group disparity is seen among subgroups and females scored slightly higher that males.
Figure
26: GCS and NC 3rd Grade Reading Percent of Student Subgroups at Grade Level Proficiency 202414
Figure 27 does show improvement in reading proficiency among all subgroups and overall, for Guilford County students with exception of white students who decreased from 67% third grade reading proficiency in 2023 to 61% in 2024.
Figure 27: GCS and NC 3rd Grade Reading Percent of Student Subgroups at Grade Level Proficiency 202414
Black White Hispanic EDS
Figure 28 also shows that Guilford County Schools (GCS) 2024 third grade students were slightly less proficient in End of Grade Math.
Figure 28: GCS and NC 3rd Grade Math Percent of Student Subgroups at Grade Level Proficiency 202414
Figure 29 again shows some improvement in third grade math proficiency among most subgroups and overall.
Figure 29: GCS 3rd Grade Math Percent of Student Subgroups at Grade Level Proficiency from 2023 to 202414
Kindergarten Transition (NC Pre-K)
The Teaching Strategies Gold assessment (TS Gold) is a formative assessment that documents children’s learning over time, informs instruction, and facilitates communication with families and other key players. It is important to note that TS Gold is not intended as a screening or diagnostic measure or an achievement test. The TS Gold presents progressions of development and learning for objectives in the areas of social–emotional, physical, language, and cognitive development and in the content areas of literacy, mathematics. Table 15 and Figure 23 report the 2024 NC Pre-K population TS Gold results at the beginning and end of the school year. At the beginning of the 2024 school year, from less than a third (29.2% math) to less than half (47.9% physical) of children were at expectations for each of six subscales. At the end of the year, the percentage of children at or above expectations ranged from 76.2% in mathematics to 87.5% in literacy skills.
Table 15: Guilford County NC PreK TS Gold Performance Beginning and End of School Year 2024
Figure 23: Guilford County NC PreK TS Gold Performance (Percent Meeting or Exceeding Expectations) Beginning and End of School Year 2024
Exceptional Needs
Table 16 reports the number and percentage of the Guilford County Schools (GCS) enrollment that was identified with exceptional need for all types of disabilities as reported for autism, developmental disabilities, and serious emotional disabilities from 2015 to 2024 (NC DPI, 2024)3. The data shows a significant increase in the number of children identified with autism and a decrease in serious emotional disabilities. These trends are due in part to changes in assessment procedures and recognition. However, it should be noted that childcare providers participating in focus groups did recognize the ‘identifying issues’ to address challenging behaviors, including special needs (specific example of autism) and addressing parents’ recognition and willingness to seek services. In addition, there was anecdotal report among childcare providers regarding increases in late non-verbal, speech potty training, etc.
Table 16. Number and Percent of GCS Special Needs Students from 2015 to 2024 School Year3
Special Needs Diagnoses: ED: Serious Emotional Disability, IDSE: Intellectual Disability - Severe, OI: Orthopedic Impairment, DB: Deaf-Blindness, HI: Hearing Impairment, LD: Specific Learning Disability, SI: Speech or Language Impairment, DD: Developmental Delay, IDMI: Intellectual Disability - Mild, MU: Multiple Disabilities, TB: Traumatic Brain Injury, DF: Deafness, IDMO: Intellectual Disability - Moderate, OH: Other Health Impairment, VI: Visual Impairment incl. Blindness
Children’s Developmental Services Agency (CDSA) is the local agency for Early Intervention (EI) of special needs, under the statewide NC Infant-Toddler Program. The CDSA supports families who have children from birth to age three who have developmental delays or who are at risk of developmental concerns It is important to screen and refer for any special needs as early as possible in a child’s life to begin implementing any necessary treatment or interventions. Table 17 reports that the Guilford County saturation rate (percent of population referred and served to the CDSA) of 5.7 percent is close to the overall Greensboro catchment rate and the statewide rate (NC Smart Start, 2023)15
Table 17: Early Intervention Saturation Rates for Greensboro CDSA Catchment Areas Counties, and NC for Children Ages 0-35 Months15
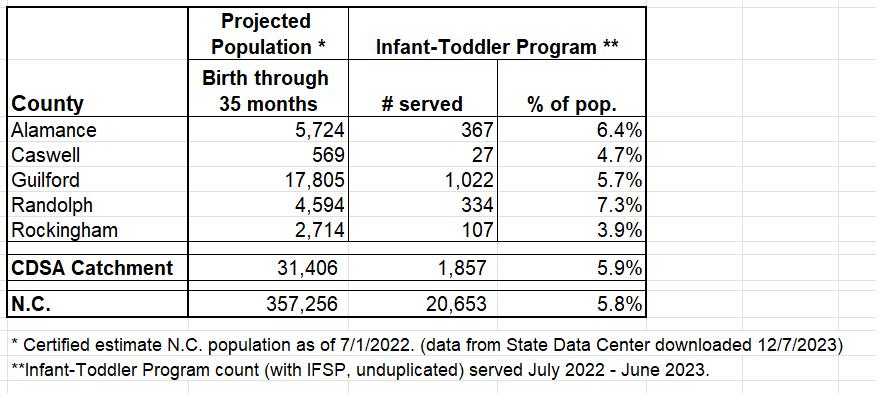
Figure 30 illustrates the positive trend in the percentage of children ages 0 to 35 months (or birth to 3 years) receiving early intervention services over the last 20 years. This is in part to the funding of Smart Start programming that has been put in place as supports for childcare and families to provide screenings of children for developmental and health issues, to educate childcare and healthcare providers, and to inform parents on risk factors associated with developmental delays. Figure 30 also illustrates that Guilford County falls within the projected saturation rate standard range of four to ten percent.
Figure 30: Percent of Children Ages 0-35 Months who Receive Early Intervention Services from 2022 to 2023 for Guilford County and NC15
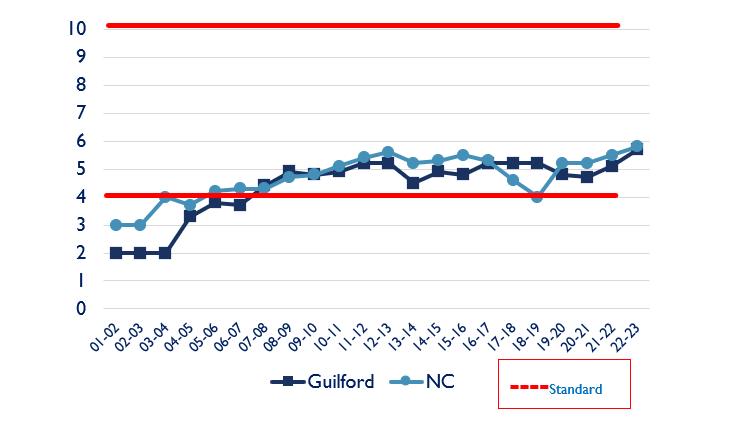
Figure 31 illustrates the trend in the percentage of children ages 3 to 5 years receiving special needs services for the past 20 years. The NC Pre-K program (formerly More at Four) began in 2021-22 and has since expanded allowing for significant numbers of children to be screened for developmental delays on an annual basis per program entry. As a result, Guilford and NC have maintained the ages 3-5 saturation rates for special needs services within the standard range of four to ten percent with the exception of 2020-21 (which was a result of lack of in-person contact during COVID). This demonstrates the need for continued programming support for childcare and families to access screenings of children for developmental and health issues and to educate childcare and health providers, parents on risk factors associated with developmental delays, and to recognize the benefits of intervention services needed.
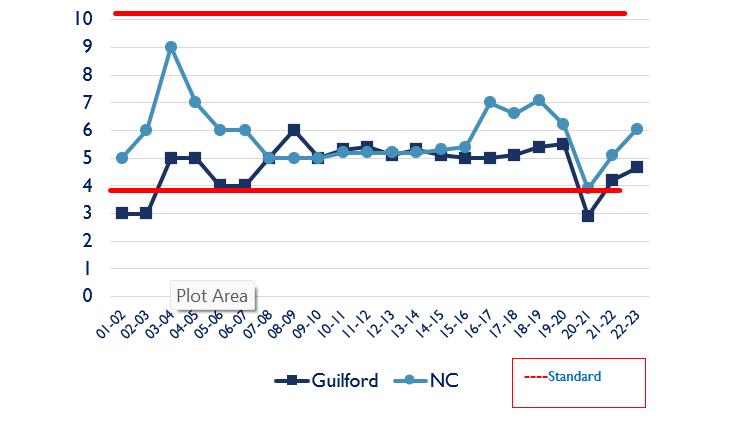
Figure 31. Percent of Children Ages 3-5 Years Old who Receive Special Education Services from 2022 to 2023 for Guilford County and NC15
Listening Session
GCPC Listening Session Themes Related to Early Literacy, School Readiness and Kindergarten Transition
Parent/Caregivers
Families desire transition activities to reduce stress of K transition.
Families strive to ensure their children are prepared and equipped to enter school.
Parents concerned about level of communication with K teachers about children’s adjustment and progress.
Recognition that Kindergarten transition can be big for both children AND families.
Social/emotional skills are one concern for families with rising kindergarteners.
Programs should have resources to address limited English language families.
Families desire activities for multiple-aged children that are more affordable, accessible, and educational activities for their children.
Early Educators (Infant/Toddler/Preschool Teachers, FCCH providers, Center Directors)
Childcare Center Directors feel that their connection with kindergarten teachers could be strengthened further to better prepare children for the transition to kindergarten and increase both childcare providers and parents understanding of essentials skills,
NC Pre-K Directors have made proactive efforts in collaboration with kindergarten teachers to prepare children for the transition to kindergarten.
Childcare Center Directors value the collaborations created between pre-kindergarten and kindergarten communities such as field trips to K classrooms, readiness brochures.
NC Pre-K Directors recognize the available resources, and they understand the challenges faced in collaboration between NC Pre-K Directors and kindergarten teachers such as time during work hours and space.
ECE Teachers desire for increased connection BETWEEN affinity groups (FCCH and kindergarten/school system) as children move from small settings to large classrooms.
ECE Teachers desire for ongoing, high-quality communication before, during, and after kindergarten transition periods and for defined, smooth processes of connection for transition periods.
FCCHs desire for greater acknowledgement by schools & reliance upon the expertise of our lived experience in decision making processes for children as they transition to kindergarten.
GCPC
Listening Session Notable Quotes Related to Early Literacy, School Readiness and Kindergarten Transition
Parent/Caregivers
“We just had a kindergarten kick off that’s making us more comfortable. They gave us a checklist of things to do which I thought was amazing. It's like a countdown every month they get. These are some things to do. Try with your child talk to them about school. Talk to them about bedtime routines. Just stuff that I kind of forgot myself."
“She's in a small childcare setting right now. So how do you go from, 10 kids to 20, or 8 kids to 30 kids”
“I would like to see a kindergarten teacher come and visit the childcares and talk to the parents or talk to the children, because some of them are really afraid when they do go to kindergarten, because it's a big school.”
Early Educators (Infant/Toddler/Preschool Teachers, FCCH Providers, Center Directors)
A Director participant shared, "I think it would also be helpful for Pre-K teachers and 3-year-old teachers to have a connection with the kindergarten teacher. For the teacher to say, 'Here's exactly what we're looking for. These are some skills that we want them to work on throughout the first year in school, or some skills that would be really helpful to already have before they come here.'"
Early Childhood Education
Childcare Availability
Table 19 compares the number of licensed childcare facilities and enrollment from 2019 to 2024. As of June 2024, there were 229 licensed centers and 63 licensed family childcare homes (FCCHs) serving 9,738 children ages 0 to five years old in Guilford County compared to 10,709 in June 2019 (pre COVID) (NCDEDEE, June 2024)9. This is a 9.1% decrease in overall childcare enrollment over a five-year period. While there was a 3.8% decrease in the number of childcare centers, DCDEE records show an 8.7% decline in center enrollment. There was a significant decrease in both the number of FCCH sites and enrollment of FCCHs, from 2019 to 2024 (27.6% and 20.5%, respectively). A similar trend was seen statewide with a 30% decrease in FCCH sites and 25% decrease in ages 0-5 enrollment in FCCH’s. However, overall enrollments ages 0-5 has only decreased by 2% statewide from over the last five years.
Table 19. Number of Guilford County Licensed Childcare Facilities and Enrollment
Table 20 reports the number of facilities and enrollment by facility type as reported by DCDEE in June 2024. Nearly three-fourths (70.9%) of facilities are private/independently owned and operated centers or FCCHs and over two-thirds of enrollment (68.6%) is in these facilities (NCDEDEE, June 2024)9.
Table 20: Number of Licensed Childcare Facilities and Enrollment
*Non-profit excludes religious based GS100 centers which are counted separately.
Childcare Enrollment
Sixty-nine percent (24,562 of 35,598) of children under the age of six living in Guilford County live in a household where the sole parent or both parents in the household work. Less than forty percent (9,738 of 24,562) children, potentially needing care while their parent(s) work, were enrolled in licensed childcare according to the Division of Child Development enrollment records in June 2024 (Early Years, 2024)23.
Approximately 12,281 infants and toddlers in Guilford County live in families where their sole or both parents work. Less than forty percent (3,758 of 12,281) of these infants/toddlers potentially needing care while their parent(s) work were enrolled in licensed childcare according to the Division of Child Development enrollment records in June 2024 (Early Years, 2024)24
Table 21 and Figure 44 show the number and percentage of each age group enrolled in various types of facilities. Overall, nearly two thirds (61.4%) of children enrolled in childcare are ages 3-5 and 38.5% of those enrolled are ages 0-1 in infant/toddler care. FCCH’s have a higher percentage of infants than other childcare settings. (NCDEDEE, June 2024)9.
Infant/Toddler (Ages 0-2) Enrollment Preschool (Ages 3-5) Enrollment Total Enrollment (Ages 0-5)
*Non-profit excludes religious based GS100 centers which are counted separately.
Table 21. Number and Percentage of Age Group Enrollment Infant/Toddler vs Preschool) by Type of Center9
Figure 44: Percentage of Each Age Group Enrollment by Type of Facility9
Infant/Toddler (Ages 0-2) Enrollment
Preschool (Ages 3-5) Enrollment
*Non-profit excludes religious based GS100 centers which are counted separately.
Figure 45 reports the percentage of each population age group that are enrolled in licensed childcare for Guilford County compared to other large NC counties and NC, overall. The total enrollment in licensed childcare represents 30.9% of Guilford County population ages zero to five (not yet enrollment in school) (NCDEDEE, June 2024)9.
Over one in five (21.1%) children ages 0-2 in Guilford County are enrolled in licensed childcare while 43.5% of ages 3-5 are enrolled. The percentage of the child population in Guilford County enrolled in licensed childcare is slightly higher but similar to that of all NC enrollments. There are typically fewer infant/toddler slots available in childcare sites due in part to the higher costs of operation related to staff/child ratio requirements. In addition, with the availability of NC Pre-K and Head Start for four- and five-year-olds (not yet in school), there is more opportunity for larger numbers of older children to attend licensed programs at no cost to parents.
Figure 45: Percentage of Population Each Age Group Enrolled in Licensed Childcare by County and NC9
Durham Forsyth Mecklenburg Wake Guilford NC
Table 22 further illustrates the percentage of the child population that is enrolled in licensed care by single age groups. The table shows comparisons of Guilford County and NC from 2019 to 2024. The population of ages 0-5 decreased by 3.0% while enrollments in licensed care decreased at a higher rate of 9.1%. Across NC, the 0 to 5 year old population had a slight increase (1.1%), and the childcare enrollment decreased by less than 2%. Table 22 also shows that there is an increase in the percentage of children enrolled in childcare as age increased from infancy to five-year-olds.
Table 22. Number and Percentage of Population and Licensed Childcare Enrollment by Age,
Childcare Affordability
Subsidy
Table 23 reports that approximately 24% of children ages 5 and younger in Guilford County live in a family whose income is below the federal poverty level. This represents an estimated 7,572 children ages zero to five not yet in kindergarten. Applying the estimated percentage of children living in families with a sole or both working families (69%) and those in poverty to the current population estimates for ages 0- to 2-year-olds and 3- to five-year-olds. Table 23 presents a rough estimate of the number of children in need of subsidized childcare. In addition, Table 23 also reports the numbers of children enrolled in NC Pre-K, Head Start and receiving subsidies in May of 2024.
Table 23. Estimated Numbers of Children Needing Subsidized Care by Child Age Groups and Subsidized Care Participation, May 2024
Estimated # of Children Needing Care and Below Poverty
Note: Services may be duplicated across programs due to dual subsidy Programs, summer care and wrap around care needed after hours.
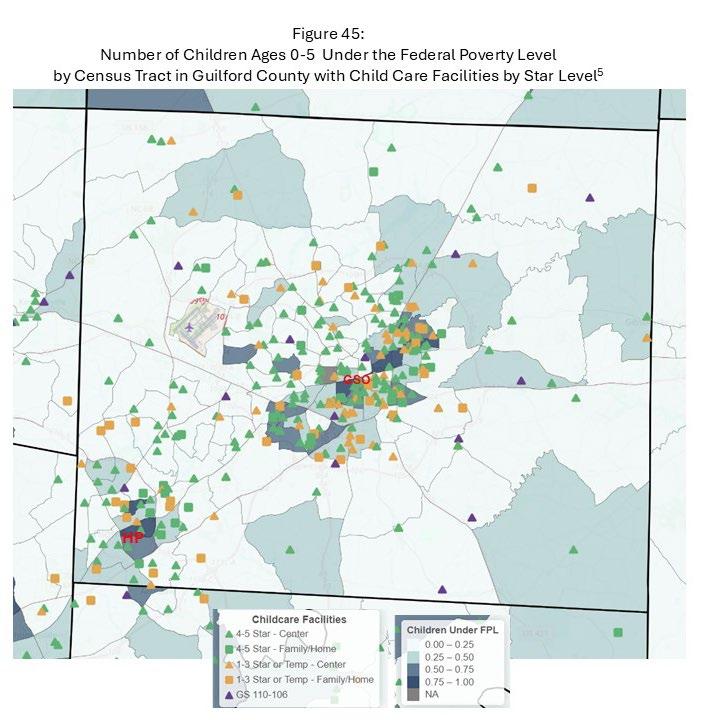
Figure 45 shows the distribution of licensed childcare facilities in Guilford County by census tract identifying areas of a high percentage of children living below the federal poverty level (NC Partnership for Children, 2024)5. Generally, poverty areas are concentrated in census tracts in central Greensboro and High Point cities. The map in Figure 45 shows that distribution of childcare facilities aligns with high poverty census areas.
Childcare Affordability
Cost
Figure 46 reports the average weekly and annual full-time childcare rates by center vs FCCH’s, star level, and age of care from the most recent NC market rate study Child Care Resources, Inc. (Aug. 2024)25. Childcare rates are typically higher for younger children due to the required child staff ratios and other costs associated with offering care for younger children Rates are also higher for higher star facilities and centers over FCCH’s.
Figure 46:
Average Weekly and Annual Full-Time Childcare Rates for Guilford County By Centers vs FCCH’s, Star Rating and Age of Children Served25
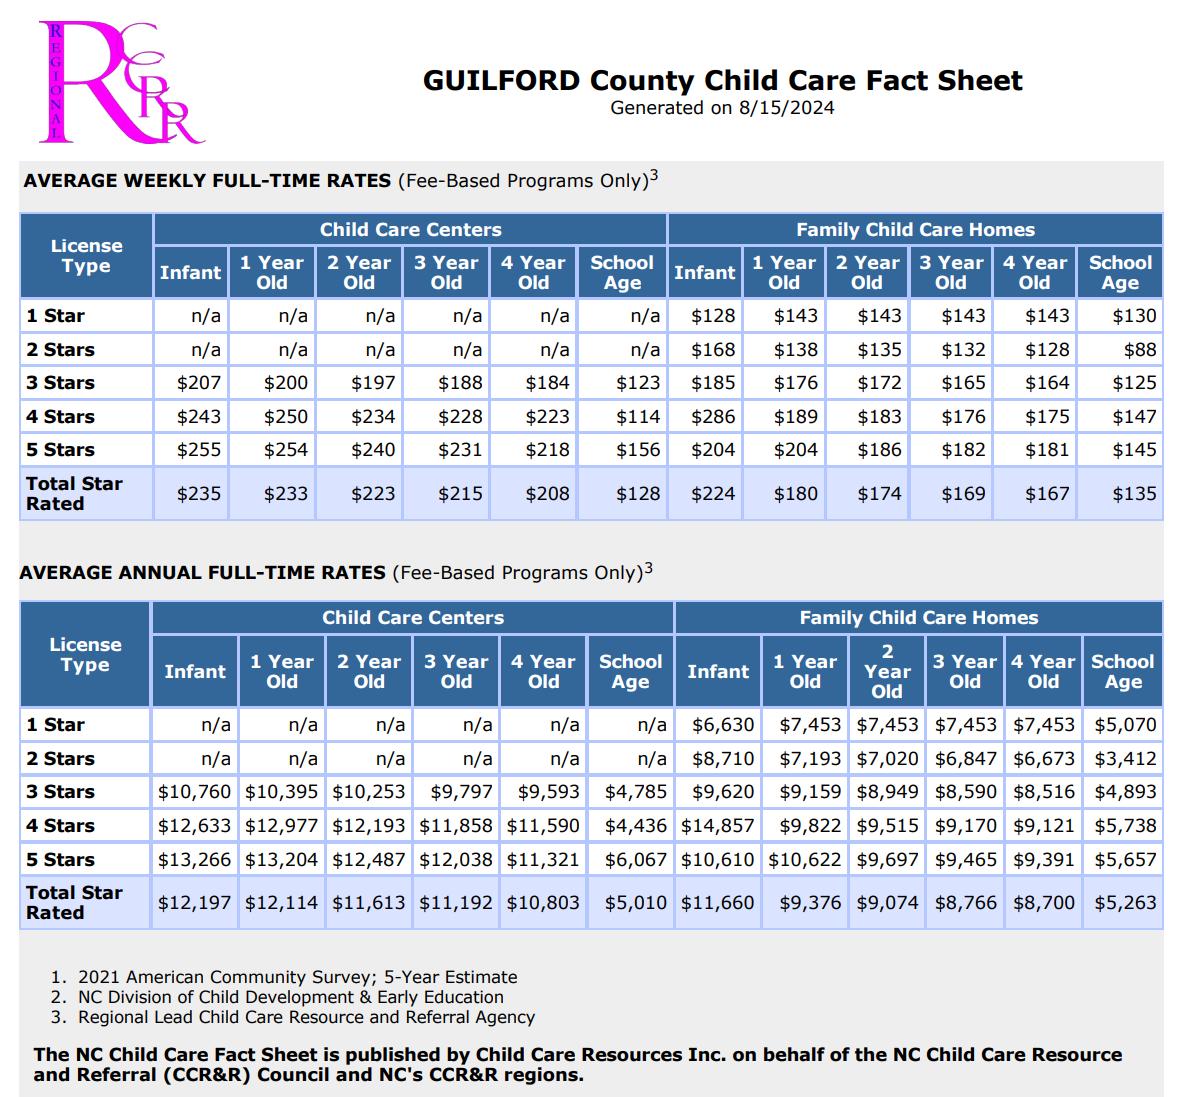
Table 24 compares Guilford County median household income, average fulltime childcare rates to NC and similar size NC counties. Guilford County has the highest average center care childcare cost to median annual household income ratio among comparative counties and is higher than the NC average rate.
Table 24. Average Annual FT Childcare Rates for 2-Year-Old 4 Star Care and Percentage of Median Household Income25
Listening Session
Parent and EC Provider listening sessions echoed the challenges faced regarding Guilford County families regarding the rising costs and availability of childcare. Below are identified themes and selected quotes related to childcare costs from focus group sessions.
GCPC Listening Session Related to Childcare Availability/Affordability Themes
Parent/Caregivers
Childcare needs include – flexible schedule (time of day or year-round, summer care), affordability, availability of quality childcare, etc.
Families struggle with finding affordable, high-quality childcare.
Intersections between employment and childcare can be a big challenge for families with children.
Early Educators (Infant/Toddler Teachers, FCCH providers, Center Directors)
Childcare Center Directors are concerned with the financial burden of rising childcare costs on families in Guilford County.
NC Pre-K Directors wish to improve the high cost of childcare. Needs for improved subsidy rates.
Specific need for flexibility for families seeking childcare outside of traditional operating hours (e.g., nights, weekends, summer care).
GCPC Listening Session Notable Quotes to Support Childcare Availability/Affordability Themes
Parent/Caregivers
"I was able to find childcare, but I'm going to have to withdraw my daughter soon. It's because of how the government operates; they say I make too much, but if I pay the full amount, I won't have any money left." She continued to share, “The more you make, the more that gets taken away.” Parent Focus Group Participant
“Stress and anxiety that can come up with just day to day struggles, decisions about what to pay for, what you can and can't pay for. How do you navigate that? The cost of living? How expensive childcare is, just how much all of these things can create a lot of anxiety for families.” Parent Focus Group Participant
Early Educators (Infant/Toddler Teachers, FCCH providers, Center Directors)
Weekends and after 7pm are challenging times when families need childcare, and it's not available. Or maybe not affordable.
Families' ability to have employment that pays them enough to manage it all. A family saying they are just now able to pay their rent. or they have a job and then lose a job or pay is delayed and then they can't pay for their own basic needs. If something happens with their car, they have a job but can't get to their employer, and it causes issues. Different things thrown their way impact them.
A participant shared that they "provide a staff discount for childcare" because they understand that their staff cannot afford full-time childcare and live sustainably on their current salaries.
Childcare Quality
Licensed childcare programs can also be described by their star level or their level of quality. As shown in Figure 47, around 68% of licensed centers in Guilford County that serve 71.4% of total enrollment of infant to five-yearolds (not yet in school), were operating over three stars, compared to NC with 69% and 70.2%, respectively (NCDCDEE, 2024)9. While Figure 48 shows that about 47% of Guilford County licensed FCCHs serving about 48% of total enrollment of infants to five-year-olds (not yet in school) were operating over three stars. Under three stars programs include 1- and 2-star centers and FCCHs, GS110 centers, and temporary, provisional or probationary license facilities.
Five Stars Four Stars Three Stars
3 Stars
Figure 47: Guilford County Centers and Enrollment by Stars9
Five Stars
Stars Three Stars
Figure 48: Guilford County FCCHs and Enrollment by Stars9
Figure 49 compares the enrollment by stars for Guilford County and similar size counties to NC overall. Guilford County is slightly above NC in the percentage of children enrolled in 4- and 5-star facilities (NCDCDEE, 2024)9.
Figure 49: Enrollment by Star Level9
It should be noted that while enrollments by star quality reported in this report are current as of June 2024, the majority of facilities have not been reassessed since prior to COVID in 2020. Only about 33% of the 292 licensed facilities in Guilford County have had any kind of reassessment of quality since pre-COVID in 2020. Therefore, some caution should be used in interpreting these results as the actual status of quality in licensed childcare facilities. Currently, the NC Division of Child Development (DCDEE) is holding harmless status for facilities operating with a star rated license until June 30, 2024. The reduced percentage of lead teachers that must meet the point levels from 75% to 50% is in place until June 30, 2026. In June 2023, the DCDEE introduced a cohort model and timeline for resuming the star rated license reassessments. This cohort model includes a preparation year and a reassessment year. Right now, DCDEE is focusing on cohort one. Facilities within this cohort are not required to do anything until the reassessment year. However, there are opportunities within the preparation year that will help prepare childcare facilities for the reassessment year
Figure 50 reports the percentage of childcare provider staff survey respondents reporting whether their facility will be going through the NC Rated License Assessment process during the next six months. Not surprisingly, with the uncertainty of the timeline and assessment process, over one-third of the respondents were not sure.
Figure 50: 2024 Childcare Staff Report of Facility's Plans to Go through Assessment with Div. of Child Development Licensing in the Next Six Months
Not applicable/ Unlicensed
As shown in Figure 60, there has been a positive trend in childcare quality since early Smart Start funding until present for both Guilford County and NC as measured by the percentage of children enrolled in four and five star rated facilities. Both Guilford and NC continue to hold quality well above the NC Partnership for Children standard of at least 60 percent. There was a slight decline in quality in Guilford over the last year (NC Partnership for Children. (2023 and previous years)26.
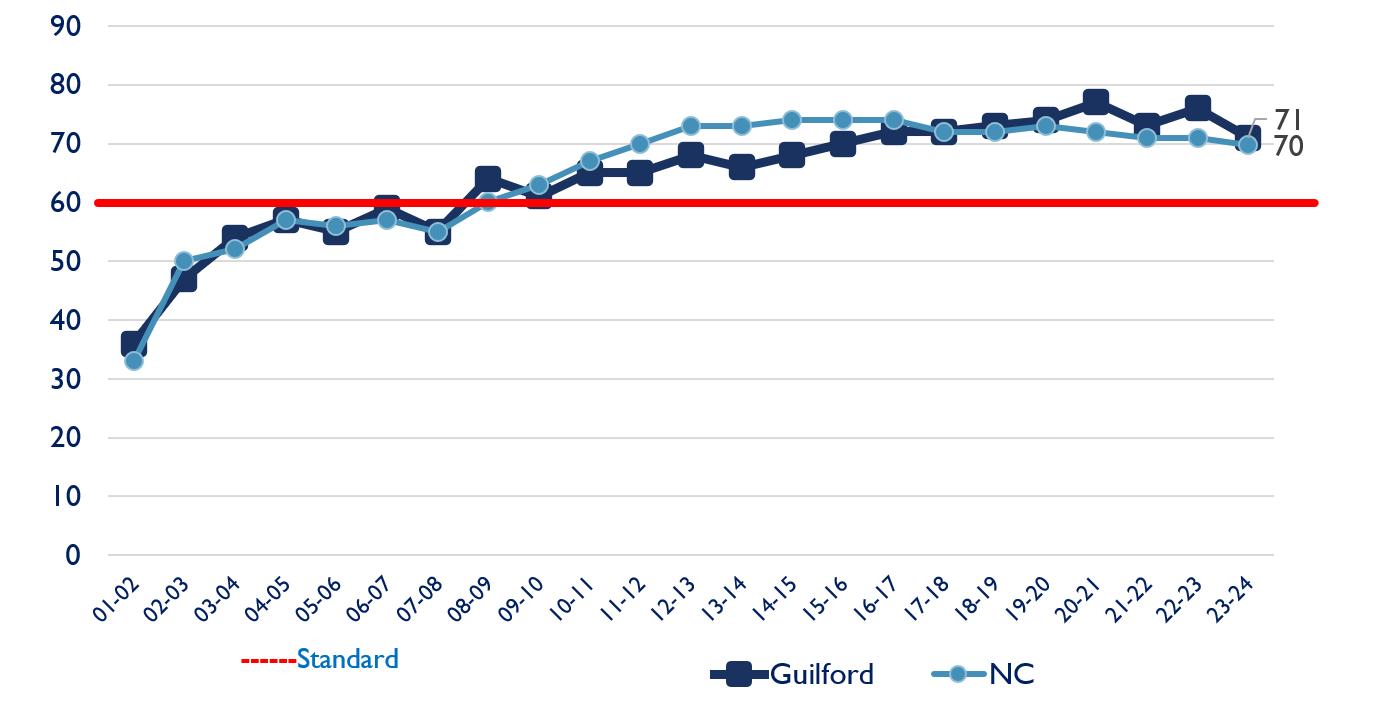
Figure 60: Quality Trend-All Children Percent of Children in 4- and 5-Star Care
In addition to meeting the overall quality of at least 60% enrollment in 4- and 5- star rated facilities, NC holds each county to the same standard of at least 60% enrollment in 4- and 5- star rated facilities and an average star rating of at least 4.0 for each age subgroup. As shown in Figure 61, both NC and Guilford County perform above both standards for all age groups with Guilford County slightly above the NC average in 2023 (NC Partnership for Children, 2023 and previous years)26. This data also shows that childcare quality is higher among four- and fiveyear-old child enrollments compared to infant/toddler enrollments quality. This is due in part because of NC Pre-K and Head Start enrollments and the quality and staffing education requirements in those classrooms.
Figure 60: PLA40: Percentage of Children in 4-5 Star Care and Average Star Rating of Child Placements by Age for FY 22-23
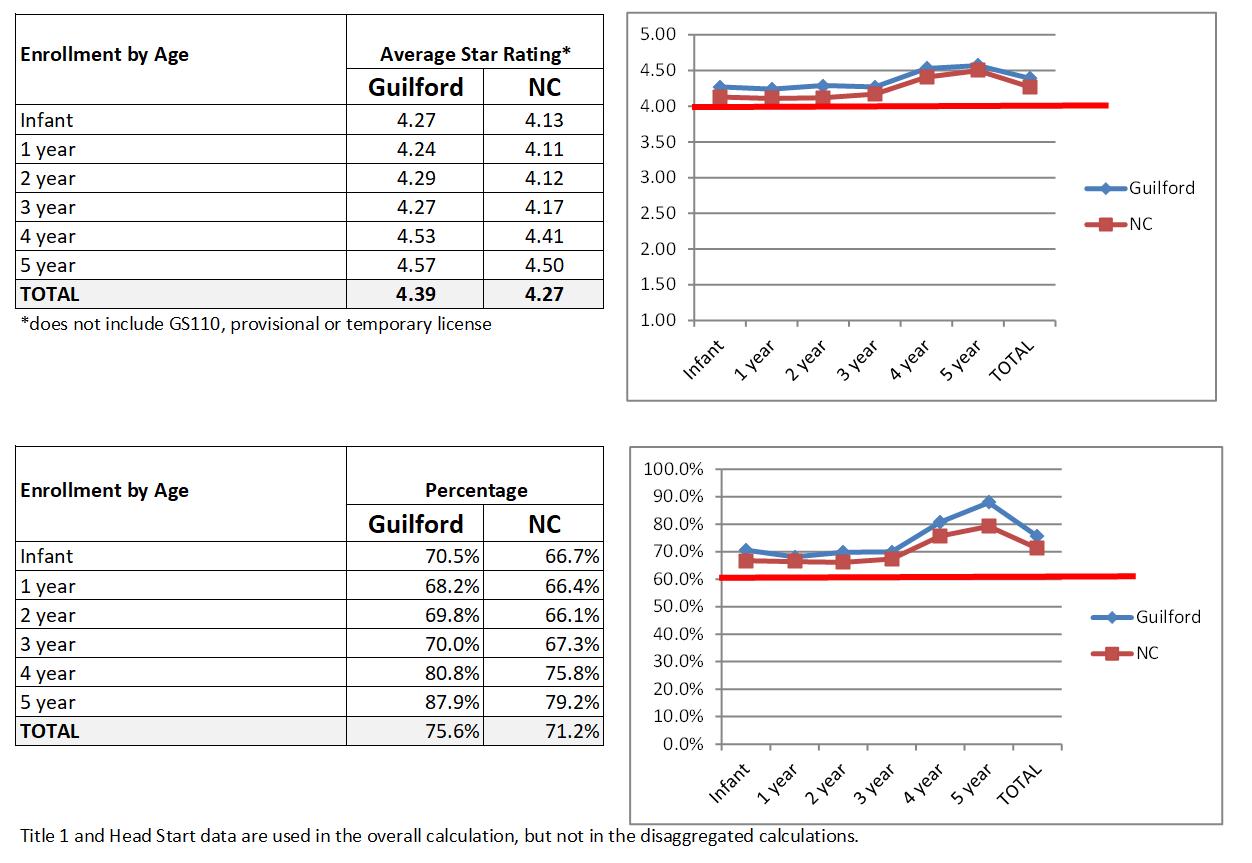
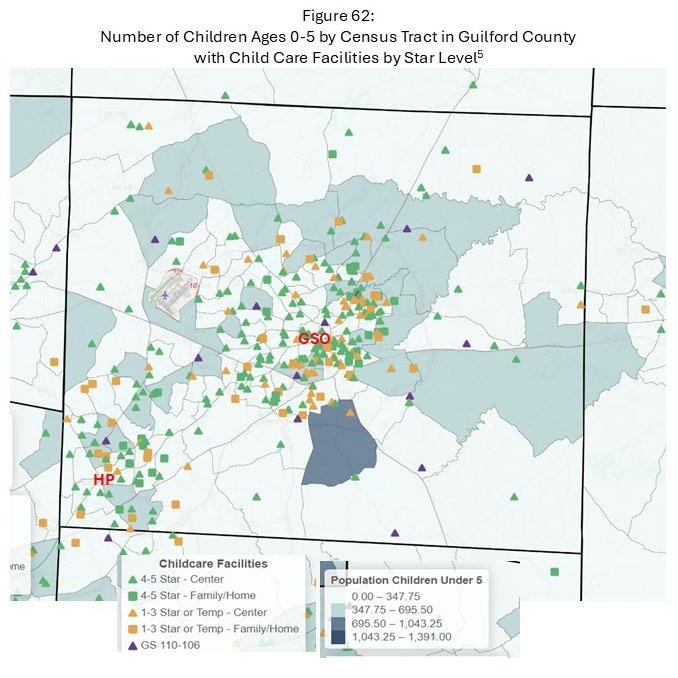
Figure 62 shows the star ratings of facilities as distributed across Guilford County census tracts identified with the number of children ages 0-5 (NC Partnership for Children, 2024)5.
In 2024, Community Needs Assessment Family Survey, 408 families responding were asked what type of childcare their child was enrolled in and for those with children enrolled in care were also asked to rate the overall quality of that care Figure 63 shows that over half (55%) of family survey respondents indicated their preschool child(ren) were enrolled in licensed childcare and another 4% were enrolled in unlicensed part-day preschool programs.
Figure 63: Percent of Preschool Aged Children by Type of Childcare Setting as Reported by 2024 Family Survey Respondents
Not enrolled in child care, stays at home with parent/guardian
Not enrolled in child care, stays with babysitter or family member
Unlicensed Part Day Preschool Program (e.g. church program)
As shown in Figure 64, over three-fourths (76.6%) of family survey respondents rated their current childcare quality as good to superior and nearly half (47%) rated their child(ren)’s care as excellent to superior while over one in five (24%) rate their care as fair to poor.
Figure 64: 2024 Parents Rating of the Overall Quality of their Child's Childcare
Early Childhood Education Workforce Demographics
Table 25 reports the numbers of staff by type of facility as of June 2024 via DCDEE enrollment records. Proportional to child enrollment (65.5%) as shown in Table 20 (Page 36), the majority (61.5%) of teachers are employed by privately operating, independent centers in Guilford County (NCDEDEE, June 2024)9.
Table 25. Number of Licensed Childcare Facilities and Staffing
*Non-profit excludes religious based GS100 centers which are counted separately
Figure 65 reports the ages served reported by the 2024 Needs Assessment survey respondents. All childcare staff report working with some combination of birth to five-year-olds at least some of the time. Respondents who reported that they only work with school-aged children were excluded from the study. Fewer respondents indicated they worked with infants compared to two-year-olds through five-year-olds.
Figure 65: 2024 Childcare Provider Staff Report of Ages they Work with Most Often
Multi-ages
School-age
4-5 years, not yet in kindergarten
Threes (3-4 years)
Twos (24-35 mos)
Toddlers (12-23 months)
Infants (birth to 11 months)
Table 26 reports other demographics of 2024 Needs Assessment (NA) childcare survey respondents and 2023 NC Workforce Study (WFS) respondents from Guilford County and across NC (Child Care Services Assoc., 2023)10. The majority of respondents identified as female which is reflective of the population of childcare providers in the county and similar to NC.
Approximately two-thirds of 2024 childcare GCPC Needs Assessment survey respondents (66.5%) and a lesser amount among 2023 Workforce Study teaching staff (55.9%) identified as African American. This compares to 36.0% of the general population of Guilford County of females between the ages of 20 and 65 years old identifying as African American according to OSBM 2024 population estimates (NCOSBM, 2024)2. Approximately 7% of 2024 childcare GCPC Needs Assessment survey respondents and (5%) of 2023 Workforce Study teaching staff identified as Hispanic. This compares to 9.1% of the general population of Guilford County of females between the ages of 20 and 65 years old identifying as Hispanic according to OSBM 2024 population estimates. It should be noted that both the 2024 GCPC Needs Assessment and 2023 Workforce study were only administered in English to childcare respondents and race/ethnicity questions were formatted slightly different than the census questions.
The median age range of 2024 GCPC NA survey teacher and FCCH respondents was 40-49 compared to a median age of 2023 WFS study Guilford County teaching staff of 37 and 57 years old for NC Urban FCCH respondents.
Table 26. 2024 Childcare Provider Staff Survey Respondents Demographics
2024 Needs Assessment Survey Responses*
for
County10
*Race/Ethnicity question combined for GCPC Needs Assessment and separate questions for NC Workforce Study.
Early Childhood Education Workforce
Education
Table 27 reports that 55% of teaching staff in centers responding to the 2024 NC survey reported they had at least an associate’s degree and 41% reported at least a bachelor’s degree. While 87% of Guilford County facility directors and 71% of FCCHs reported at least an associate’s degree. Some caution should be used in interpretation due to small sample sizes.
Table 28 compares the education levels of the 2023 ECE Workforce for Guilford County, comparable to large counties and NC statewide (Child Care Services Assoc., 2023)10. The percentage of administrators statewide with an associate degree or higher was 89% compared to 83% in Guilford County and 87% statewide in 2019 NC Workforce Study. Also, 61% of administrators statewide reported at least achieving an ECE degree compared to 67% of Guilford County administrators. Statewide, 57% of ECE workforce reported achieving an associate degree or higher in the 2023 WFS, compared to 57% of Guilford County ECE workforce. The statewide rate is down slightly from the 2019 report of 62% of ECE Educators with associate degrees.
Table 27. 2024 Guilford Childcare Provider Staff Survey Respondents’
Table 28. 2023 NC Workforce Study Report Highest Education Levels by County and Statewide10
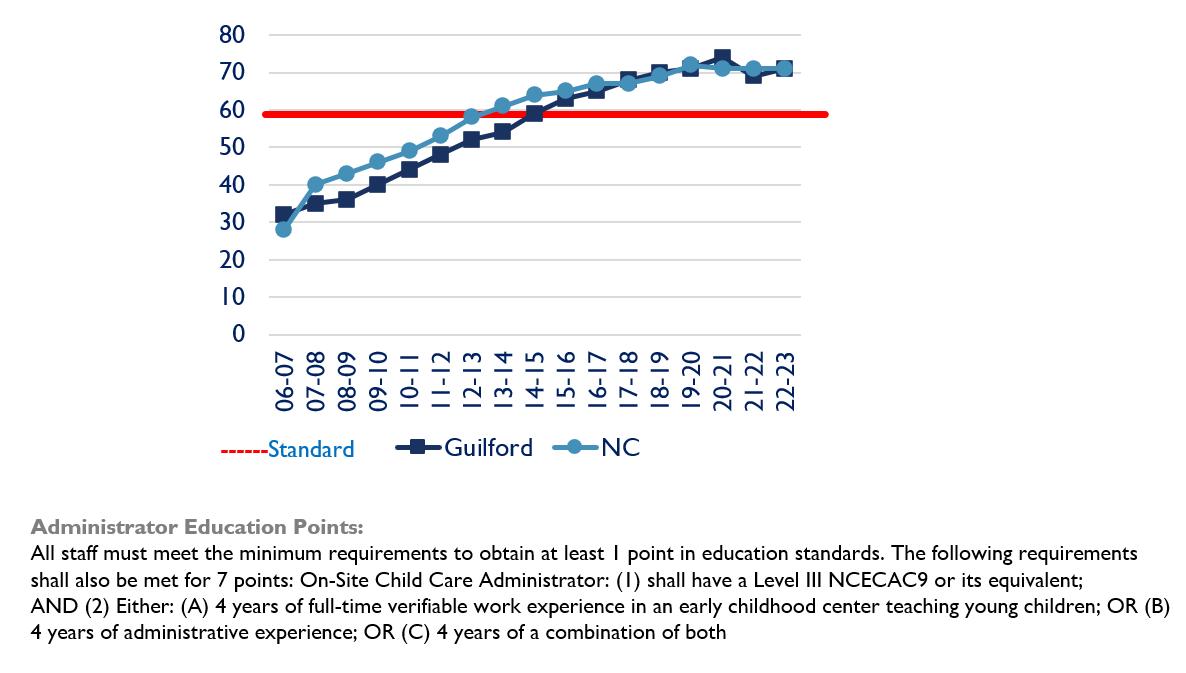
As shown in Figures 66 and 67, there has been an overall positive trend in lead teacher education and administrator education since early Smart Start funding through 2023 for both Guilford County and NC as measured by the percentage of children enrolled in 1-5 star facilities with at least 75% lead teachers with college degrees (NC Partnership for Children, 2023 and previous years)27. Both Guilford County and NC continue to hold quality well above the state standard of at least 50% for lead teachers and 60% for administrators. Official data is not yet available for 2024. Again, it should be noted that currently the NC Division of Child Development (DCDEE) is in a holding harmless status for facilities operating with a star rated license until June 30, 2024. The reduced percentage of lead teachers that must meet the point levels from 75% to 50% is in place until June 30, 2026.
Figure 66: Percentage of Children Enrolled in 1-5 Star Centers that have at least 75% of Lead Teachers with College Degrees27
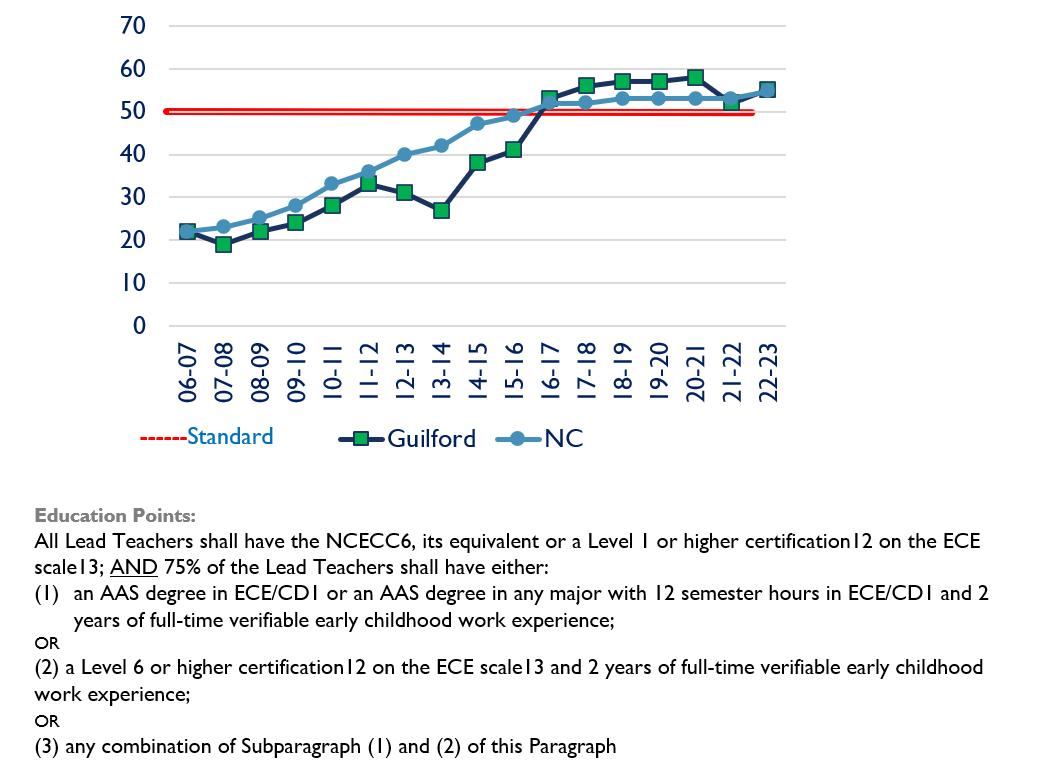
Figure 67: Percentage of Children Enrolled in 1-5 Star Centers that have Directors with College Degrees27
In addition to meeting overall lead teacher education points of at least 50% of children enrolled in 1-5 Star centers that had at least 75% of lead teachers with college degrees (i.e. 7 Lead Teacher Education Points), the NC Partnership for Children holds each county to the same standard of at least 50 percent for each age subgroup. As shown in Figure 68, both NC and Guilford County fall below the 50% standard for ages 0–2-year-olds; therefore, meeting the standard at the minimum level. The higher lead teacher education rate enrollments among older age groups are due in part because of NC Pre-K and Head Start enrollments and quality and staffing education requirements in those classrooms (NC Partnership for Children, 2023 and previous years)27.
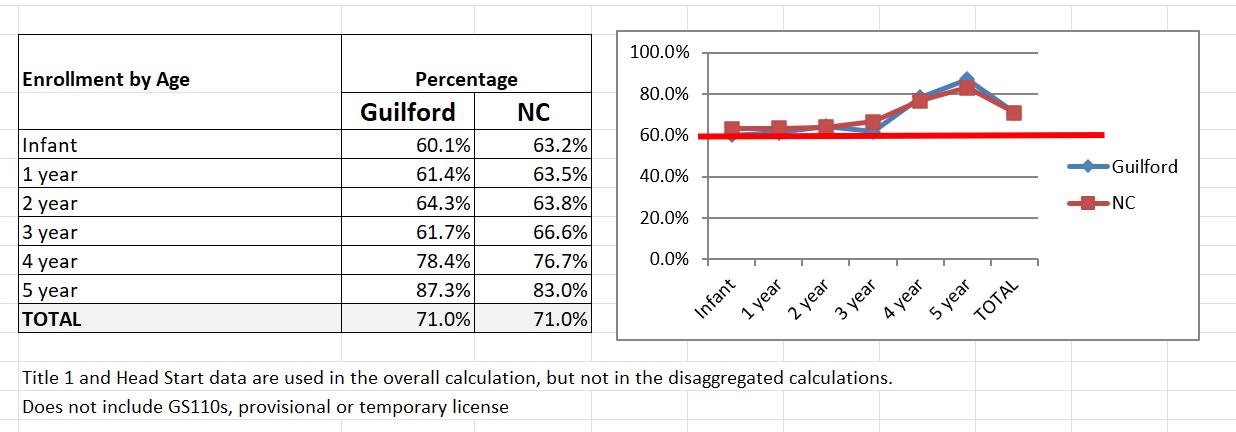
In addition to meeting the overall administrator education points of at least 60 percent of children enrolled in 1-5 Star centers with administrators with college degrees (i.e. 7 Administrator Education Points), NC holds each county to the same standard of at least 60 percent for each age subgroup. As shown in Figure 69, both NC and Guilford County perform above both standards for all age groups with Guilford equal to the NC average in 2023; therefore, meeting the high-performance standard.
Figure 68: EDU10 Percent of Children in Center with 7 Lead Teacher Education Points by Age for FY 22-2327
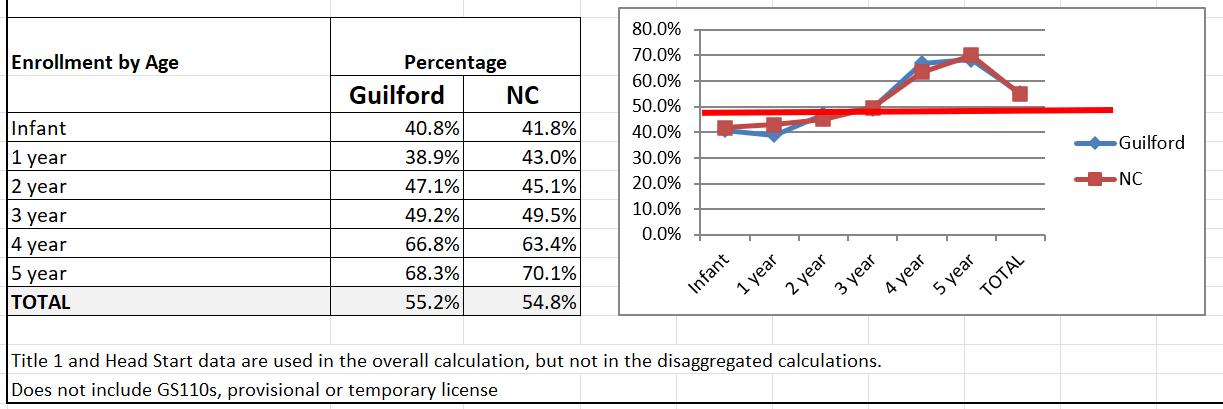
Figure 69: EDU20 Percent of Children in Center with 7 Administrator’s Education Points by Age for FY 22-2327
Early childhood educators, directors, and FCCH providers were asked if they are currently enrolled in school or plan to enroll in the near future. Figure 70 indicates that only 33% of respondents reported that they are enrolled or plan to enroll. Responses did not differ significantly between teachers, FCCH providers, and directors. This does not reflect removing those that have completed their educational attainment goals. As shown in Figure 71, the most frequently reported barriers to furthering education were cost (43.8%) and lack of time (33.2%) aside from lack of interest.
Figure 70: 2024 GCPC Survey Childcare
Provider Report of Current Enrolled in school or plan to enroll in the near future
Figure 71: 2024 Childcare Provider Report of What Keeps them from Enrolling in College Courses or Makes it Hard to Enroll?
Figure 72 shows childcare providers (in centers) report of center-based supports around training and college courses. Two-thirds (66.3%) of childcare center providers reported that their employer offered at least one of the listed supports for training and less than a third (32%) offered at least one of the supports for college course enrollment.
Figure 72: 2024 GCPC Survey Childcare Provider Report of Center-Based Supports around Training and College Courses
college courses
Offered during lunch/naptime breaks
Flex time
My employer pays part of the cost
My employer pays full cost
Paid time off
OFFERED AT LEAST ONE OF THESE SUPPORTS
Offered during lunch/naptime breaks
Flex time
My employer pays part of the cost
OFFERED AT LEAST ONE OF THESE SUPPORTS For trainings (CEUs or CHC)
My employer pays full cost
Paid time off
Early Childhood Education Workforce
Experience
The ECE workforce’s length of time working at their current childcare site and in the childcare field is presented in Figures 73 and 74. The data indicates that early childhood educators have the shortest experience at the current site, followed by center directors and FCCH providers. The majority of responding educators (77%) reported ten or fewer years of experience at their current site with 41% less than five years. Educators also report less time in the childcare field compared to both center directors and FCCH providers. FCCH providers report the most experience with 71% having twenty-one and more years at their current site and in the field of childcare.
Figure 73: 2024 GCPC Survey Childcare Provider Years of Experience in Current Childcare Site
Figure 74: 2024 GCPC Survey Childcare Provider Years of Experience in Childcare Field
Figure 75 is an excerpt from the 2023 NC Workforce study which shows similar comparative longevity statistics for educators (teachers), center directors, and FCCH providers (Child Care Services Assoc. 2023)10.
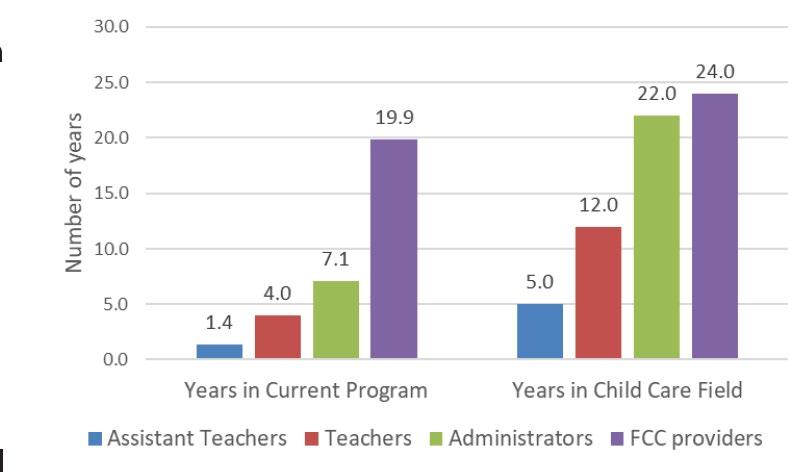
Table 29 shows center director and educator experience at their current programs and in the field as reported in the 2023 NC Workforce Study for Guilford County, comparative large counties, and statewide (Child Care Services Assoc. 2023)10. Guilford County center directors reported slightly longer experience in their current program compared to NC, 11.7 and 7.1 median years, respectively and about the same median number of years in the field as NC. In 2023 WFS, Guilford County educators reported slightly more years in their current program and in the field compared to both NC statewide and all other comparative counties.
Figure 75: 2023 NC WFS Early Care and Education Workforce Experience10
Table 29. 2023 NC Workforce Study Report Workforce Experience by County and Statewide10
Early Childhood Education Workforce
Retention
A total of 29 of 67 childcare center administrators responding to the survey completed staffing information on the survey to gauge the level of current educator (teaching staff) turnover. Responses represent 5 Head Start sites, 2 NC Pre-K sites, 2 unlicensed centers and 20 licensed centers. Much caution should be used in the interpretation of these results due to low representation (13.4% of 217 licensed centers serving ages 0-5 in Guilford County and approximately 20% of 1573 caregivers in the licensed centers). The responses reported in Table 30 indicated a quarter of total reported teaching staff vacancies (24.6%, 114 of 464 teaching staff positions (including teachers, teacher assistants and floaters/subs). One-third of the vacancies (32.5%) of all teaching staff and 91% of full-time educator vacancies occurred within the last six months, which in turn means that 66% of vacancies occurred longer than 6 months ago. According to the 2023 NC Workforce Study, the turnover rate among full-time teachers and teacher assistants increased to 38% from 21% in 2019 (pre-COVID).
Table 30: 2024 Number of Reported Childcare Center
Figure 76 indicates the reported impact of teacher turnover has impacted over half (53.1%) of centers of 38 responding center directors. Forty-seven percent indicated that they have not been able to enroll new children to meet capacity or have not been able to serve all currently enrolled children due to recent teacher turnover.
Figure 76: 2024 Center Director Report of How Teacher Turnover has Impacted their Childcare Center in the Last Six Months
We have not had a significant impact from teacher turnover in the last six months.
We have had to hire more temporary substitutes to meet coverage requirements.
We have not been able to enroll new children even though our normal capacity is higher.
We have not been able to serve all of our currently enrolled children.
Figure 77 shows some positive response with a smaller percentage (approximately 15%) of responding teachers reporting that they plan to leave the childcare field in the next three years. While there has been a significant percentage of FCCH providers closing in the last five years in Guilford County and across NC, only six percent of responding FCCH providers indicated that they plan to leave the field in the next three years.
Figure 77: 2024 GCPC Survey Childcare Provider Likelihood of Working in EC Field in Three Years
The Child Care WAGE$® Program is an education-based salary supplement program for teachers, directors and family childcare home providers. The education, position and work schedule for each applicant are assessed to determine the annual award. To encourage consistency, installments based on half of the annual award are issued after each six-month period the participant completes in the same early care and education program. Guilford WAGE$ participants received an average six-month supplement of $974.00 among 276 participants. Table 31 indicates that while Guilford met the annual turnover goal among participants of less than 25%, there was an increase in turnover rate in 2024 (19%) from 2023 rate (11%) and the rate was above NC statewide WAGE$ participant rate of 15% in 2024 (Child Care Services, Assoc. 2024)29
Table 31. WAGE$ Turnover Rate Comparisons29
Early Childhood Education Workforce
Listening Session
Early educator and director listening sessions echoed the challenges faced regarding Guilford families regarding the recruitment and retention of qualified staff. Below are identified themes and related selected quotes.
GCPC Listening Session Child Care Related Workforce Themes
Early Educators (Infant/Toddler/Preschool Teachers, FCCH providers, Center Directors)
Overwhelming need to address educator wages.
Need for smaller class sizes
Childcare Center Directors face significant challenges, particularly in staff recruitment and retention and securing adequate funding. Challenging work conditions, low pay, low appreciation, not a sustainable career path. Childcare Center Directors aim to attract qualified candidates and address staffing needs effectively through several strategic approaches. Economic drivers of recruitment, retention, and burnout issues – low salaries and rising cost of living – affect families as well.
Desire for increased supports/benefits for educators to recruit and retain qualified educators.
Director specific desire for increased personnel/human resources including substitute lists and shared substitute pool for relief time for educators (take breaks, planning, time off, etc.).
Mentoring new teachers.
Efforts and advocacy of NC Pre-K Directors to enhance support systems for early childhood educators including mental health coaches.
Enhance WAGE$ incentives and bonuses.
There is a need for increased value and the recognition of workforce professionalism to attract high quality staff.
NC Pre-K Directors struggle with underqualified staff.
Notable Quotes to Support Childcare Related Workforce Themes
“Until this month we have not been able to be fully enrolled because of lack of teachers. After 4 years we are finally fully staffed. Now we are struggling to find the children we need because of higher teacher pay equals higher tuition rates.” Licensed Center Director
"It is difficult trying to find full staff that's equipped and educated in the early childhood field.” Licensed Center Director
"Teachers who have longevity are going to other professions, nursing home, welding, etc.; I've lost 4 this week. I want to find the right fit for them, but it's a challenge. I’m trying to keep morale up for the teachers who are still there while I’m trying to fill staff, and not burn them out while I try to find the right fit. "
"Staffing is a challenge, we're getting resumes, but staffing is a challenge. EC directors and professionals aren't treated as professionals and we're losing them due to low salaries, they're leaving for other jobs for more money."
"I used to appreciate having a substitute list; that was really nice. I regretted it when that was gone. So that would be nice. But to take that a step further, I think it would be really great if there was an organization or entity that could prepare staff for entering this industry, helping them with their criminal background checks, fingerprints, and so forth."
"Teachers never have enough time. They need planned PLANNING time. PAID planning time. "
“There is not enough collaborating with others to see what you're doing, what's working at your centers, or what's working at ours. We need to put into place some professional development days where we can network on those specific days so it's not taking them away from anything like family life or work hours, and we're giving us time to network with each other.”
“We do work really hard to take care of these children all day long and I feel like a lot of people don’t even want to go into it, even if they love children, because it’s just not a sustainable career.”
“Teaching is the only profession that holds every profession under one umbrella. You’re the doctor, you’re the psychiatrist, you’re the therapist and you’re getting paid the lowest.”
“I’m tired of hearing because I love my job, I got to live paycheck to paycheck.”
“I’m not a babysitter, I am a brain builder.”
Early Childhood Education Workforce
Wages & Benefits
Figure 78 presents the reported hourly wages of 2024 childcare provider survey respondents. The highest percentage of educators (31.4%) reported receiving between $15 to $17.50 per hour while the highest percentage of directors (25%) reported a range of $20 to $22 per hour. This compares to the 2023 NC Workforce Study in which ECE teaching staff (educators) reported an average of $13.50 per hour and directors made $19.23 on average (Child Care Services Assoc. 2023)10. This was below the NC statewide reported averages of $14.42 per hour for teaching staff and $21.63 per hour among directors.
Figure 78: 2024 GCPC Survey Childcare Provider Reported Hourly Wages
$7.25/hour (40 hours/week= $1,257/monthly or $15,080/year) up to $10/hour
$10 /hr
($1,733/mon or $20,800/yr) up to $12.50 /hr
$12.50 /hr
($2,167/mon or $26,000/yr) up to $15 /hr
/hr
($2,600/mon or $31,200/yr) up to $17.50 /hr
$17.50 /hr
($3,033/mon or $36,400/yr) up to $20 /hr
$20 /hr
($3,467/mon or $41,600/yr) up to $22.50 /hr
$22.50 /hr
($3,900/mon or $46,800/hr) up to $25 /hr
$25 /hr
($4,333/mon or $52,000/hr) or more
Table 32 shows center director and educator/teacher reported average hourly wages in the 2023 NC Workforce Study for Guilford County, comparatively large counties, and statewide (Child Care Services Assoc. 2023)10. Guilford County center administrators reported median wages were proportional to the county median household income compared to other counties and NC statewide. However, teacher wages ($13.50) for Guilford County were the lowest among comparative large urban counties.
Table 33 reports 2023 data regarding lack of health insurance coverage, public assistance usage, and median hourly wages of Guilford County early childhood educators compared to other large urban counties and NC statewide (Child Care Services Assoc. 2023)10. The data further emphasizes the financial challenges the early care workforce is facing with Guilford County educators reporting a lower hourly wage and higher usage of public assistance compared to ECE statewide.
Table 32. 2023 NC Workforce Study Report Workforce
Table 33: 2023 NC Workforce Study Report Teaching Staff Hourly Wages,
Figure 79 reports the percentage of childcare providers working in centers that receive various types of employee benefits. 40% report no health/dental insurance or paid planning time offered by their childcare center employer.
Figure 79: 2024 GCPC Survey Childcare Provider Report of Employee Benefits
Figure 80 indicates that almost all childcare educators in NC Pre-K public sites and Head Start sites (95%) have health insurance benefits offered to some or all employees and the large majority (82%) of FCCH providers do not have group health insurance.
Figure 80: 2024 GCPC Survey Childcare Provider Report of Health Insurance Benefits by Type of Facility
Head Start/NCPreK sites Private, Independent Centers FCCHs
Early Childhood Education Workforce
Other Supports
Childcare providers responding to the 2024 Needs Assessment survey were asked to report their level of agreement that they have support and tools needed to address various needs in their classroom. Figure 81 reports that the majority of childcare respondents agree that they have support needed in most areas presented with exception of tools and support for children with behavior problems for classroom management with less than half (46%) agreeing. Just over half agree that they have the tools to support children’s healthy weight. Respondents were very positive about information and accessibility of training for their professional needs.
Figure 81: Childcare Provider Report of Tools & Supports Currently Offered Percent Strongly Agree/Agree
I have the tools and support needed to effectively address children's early literacy development.
I have the tools & support needed to address health and safety needs (medical administration, child health plans, sanitation, etc.)in the classroom.
I have the tools & support needed to help children with behavior issues and for classroom management.
I have the tools & support needed to help children transition smoothly to kindergarten.
I have the tools & support needed to support children having a healthy weight. (Addressing overweight/obesity)
Technical Assistance is available for early childhood professionals to improve or maintain quality child care environment.
Trainings (including CEUs) are accessible & meet early childhood professionals' needs.
I receive regular information on professional development/training offerings.
Childcare providers responding to the 2024 Needs Assessment survey were provided with a list of topics and asked to identify all areas they were interested in receiving professional development or training. Figure 82 reports that half of respondents expressed an interest in classroom and stress management. Other top ranked topics included caring for children with behavior challenges and special needs and child development and recognizing risk factors.
Figure 82: 2024 Childcare Provider Survey Report of Areas they Would be Interested in Receiving Professional Development or Training
Budgeting
Health issues (i.e. safety nutrition, saniation)
Childcare licensing regulations
Kindergarten readiness skills
Time Management
Understanding/working with agencies (DSS, DCD, etc.)
Early literacy development for children
Classroom design/layout
Conflict management
Lesson planning
Working with parents
Child development and recognizing risk behaviors
Caring for children with special needs
Caring for children with special behavior needs
Stress management
Classroom management
Childcare survey respondents were asked about their familiarity and use of current childcare related programming. Table 34 indicates mixed responses across all programs. The majority of providers have used or at least recognized all programming. However, the responses do indicate a possible need for increased program awareness efforts among childcare providers particularly around technical assistance opportunities.
Table 34: Childcare Providers' Report of Familiarity and Use of Partnership/ Smart Start Funded Programs
YES, I am familiar with this program BUT have NOT used
I
Childcare provider survey respondents were then asked to describe how the above programs have helped improve the quality of the childcare they offer. Eighty-two childcare providers that report using services gave responses.
• Over a fourth (26%) commented that WAGE$ has helped them financially and helps retain teachers.
• Over one in five (22%) commented about the positive impacts of EQuIPD programming. Sample comments included: “EQuIPD, is a bank of Early Childhood Education. Great, hands-on activities that motivates our teachers and keeping them excited to be working in this field.” “EQuIPD has provided many services for me. They are very in touch with the situations we face as early childhood professionals and are trying desperately to keep us in the field.”
• Over one in five (21%), commented about the positive impacts of Bringing Out the Best programming. Sample comments included: “Bringing Out the Best has helped parents and teachers understand child behavior. Both parents and teachers need to understand how to manage challenging behaviors.” “Bringing Out the Best has provided technical assistance with several of our challenging students and their trainings are outstanding.”
Childcare provider survey respondents were then asked to describe any barriers to services offered. The most common barrier themes mentioned included:
• Need for more Bringing Out the Best Specialist to address waiting lists to get support sooner.
• Need for awareness of the program services.
• More hands-on training and availability to come to classrooms.
• The need to raise WAGE$ eligibility due to cut off for some educators.
Childcare provider survey respondents were then asked to rank the top five program focus areas. Figure 83 indicates that of the program focus areas presented, providers ranked parent involvement, teacher wage supplements, professional development workshops and substitutes for education and sick leave as the top areas to help most with quality childcare.
Figure 83: Average Ranking of Programs that Would Provide Most Help in Improving Childcare
Access to online education classes
Provide emergency short-term child care
Scholarships for higher education
Technical assistance in the classroom
Increase program supplies/materials
Improve physical environment at my facility
Provide playground equipment and improve outdoor environment
Provide staff health and other benefits
Provide teacher substitutes for sick leave/personal leave
Provide teacher substitutes for education/training
Workshops for early childhood professionals
Supplement teacher wages
Improve parent/guardian involvement
In addition, the childcare provider survey respondents were asked an open-ended question about what kind of support or activities the Partnership could provide to improve program quality. The most common theme of responses is mentioned in the order of frequency.
• Training and technical assistance to address challenging behaviors, special needs, and classroom management.
• Improved wages and affordability of childcare.
• General hands-on training needs (some specific topics were star quality requirements, new employee training, program awareness, child development and assessing risk).
• On-site visits and technical assistance.
• Outdoor learning environment needs, including technical assistance and equipment.
• Parent education on behaviors, early intervention, and improved parent involvement.
Listening Session
Early educator and director listening sessions echoed the need for more childcare supports related to family engagement, addressing challenging behaviors and special needs, and other supports. Below are identified themes and related selected quotes.
Family Engagement/ Relations Parent/Caregivers
Parents recognized the need for increased family engagement in children’s early education.
Early Educators (Infant/Toddler Teachers, FCCH providers, Center Directors)
Desire translators support to communicate better with families with limited English. Desire for skill development in how to communicate needs to parents to increase family engagement and acceptance of child needs.
Early educators recognize the need for parent classes to understand child development, their child’s education and recognition in benefits of needed services.
Specific desire to provide families, especially new parents, with information/education on early childhood, child development, parenting education, and to increase parenting confidence & empowerment.
Cultural responsiveness and culturally sensitive programs are important for families. NC Pre-K Directors struggle with disconnected parents.
Notable Quotes to Support Themes
“Parents not being part of the child's life. Many parents are pushing them through the door without any loving words or saying, ‘have a good day.’”
Child Challenging Behaviors/ Special Needs
Early Educators (Infant/Toddler Teachers, FCCH providers, Center Directors)
Desire for additional supports (for children, families, and professionals) at more root-cause levels to address/mitigate factors that lead to challenging behaviors with children (e.g., pandemic, special needs, overwhelm from moving to larger settings in the school system, etc.).
Desire for increased access to quality professional development especially around challenging behaviors.
Desire for support from behavior specialist to address challenging behaviors. Childcare center directors face significant challenges, particularly in managing the increasing difficulties children have in group settings, despite the availability of resources to help address these issues.
Directors request support and training in managing and supporting children with autism and special needs. This may involve collaborating with special education professionals, receiving free training on inclusive practices, and accessing resources and strategies to meet the individual needs of all children in their care.
Notable Quotes and Survey Comments to Support Themes
Covid 19 caused a great deal of developmental delay in social skills among young kids. There are an alarming number of young children with behavior issues and even more alarming, lack of training for teachers dealing with these issues.
Teachers are not equipped or trained to provide some of the care to children who have different behaviors (challenging) and are overwhelmed, disappointed, burned out and are leaving and giving up on their life dream due to many failed attempts to help the youngest in our communities.
There is a need for quick/timely access to Community Services Mental-Health Disability assessment of suspected developmental diagnosis.
“Teachers are not really being taught, if they haven’t already gone through special education on how to deal with children that may have developmental delays to identify some of these aspects that happens in the classroom.”
The biggest challenge I see would be having a class that’s full of behavior issues and we don’t have the necessary resources to get them help or the parents are in denial about their behavior.
“We try to tell parents but some of them always make up excuses {for problem behaviors} ...We don’t get paid enough to get beat up.”
Too many children in one class with no screening prior to admittance. We often begin identifying behavior challenges early in the year and are often overwhelmed by the needs that impact the safety and quality of experience for the entire class.
Behavior adds extra layer of stress on staff already worked thin, adds to what they have on their plate.
Since COVID, we're seeing major behavior challenges we haven't seen before.
EC Needed Supports Early Educators (Infant/Toddler/Preschool Teachers, FCCH providers, Center Directors)
Specific desire for increased personnel/human resources: relief staff for educators (take breaks, planning, time off, etc.) especially for FCCH's.
Desire for more supports regarding self-wellness and mental health for providers.
Desire for increased access to quality professional development.
More flexibility around the curriculum, training around child development, latest techniques and trends, etc.
ECE professionals rely on both their specialized knowledge and training, and the trust they develop with children and families to support growth, learning, and development for children, families, and themselves. Early childhood educators find strengths in the relationships and bonds they have and build with families and children.
FCCH recognize continued need to support FCCH Association and increase participation and communication
Childcare Center Directors value the variety of "on-the-job" supports available to Guilford County early childhood education providers (resources mentioned include EQuIPD, PLC, CDA, NC Pre-K supports, training opportunities.)
There is significant value placed on the accessibility and proactive support provided by the NC Pre-K team at GCPC by NC Pre-K Directors.
Childcare center directors are seeking improved and sustainable methods for connecting early educators and collaborating with their peers due to barriers of schedule coordination during work hours.
Childcare center directors seek expanded opportunities for direct engagement and clearer communication channels to enhance collaboration and maximize the impact of GCPC's resources within their educational settings.
Desire for increased access to meaningful, quality professional development. Directors request assistance with organization and networking with peers.
Notable Quotes to Support Themes
EQuIPD is unbelievably helpful. Ashley Allen runs a Zoom call every Thursday for directors. it's like therapy, bonding time, learning time and Q&A, we get answers and it's so supportive. Nicole McCaskill can come into schools and give support and answer questions, and it's so helpful.
“We have mental health support that comes in to support with the challenging behaviors in the classroom.”
We need MEANINGFUL professional development. There can be classes or Zoom courses where you don't really come out with anything. It depends on the presenter and how they're presenting, and who is doing the presenting. It needs to be hands-on that you can do straight away that's beneficial.
Access to resources and materials: early childhood educators need access to a wide range of developmentally appropriate resources, materials, and equipment to create engaging learning environments. This includes age-appropriate books, educational toys, art supplies, technology tools, and learning materials that promote hands-on exploration and play-based learning.
My staff needs a person to give them a regular break. Corporate gets 2 breaks and a lunch; teachers need that more than an accountant. Need more people and more time. They need planning periods just like school. Not during naptime, but to collaborate and share ideas with each other.
Identified Priorities
Early Childhood Education Identified Priorities
• Available and affordable childcare, especially infant/toddler slots and potential FCCH settings due to significant decrease in recent years.
• Increased wages and benefits to providers.
• Increased public awareness of childcare needs with awareness and recognition of early childhood profession demands, including increased professionalism.
• Attracting, retaining qualified and educated staff with aid of the supports identified.
• Specific supports (training and technical assistance) around classroom management, children with challenging behaviors and/or exceptional needs.
• Support to improve family engagement and relations.
• Parenting education on development and help with acceptance of identified needed services.
• Other early childhood workforce supports for mental and physical health wellness to deal with demands and stress of the work including relief time and substitutes for time off, education, etc.
Family Support Identified Priorities
• Affordable high-quality childcare near home or work.
• Addressing challenging behaviors and social/emotional development
• Services/care for children with special needs (speech, autism, physical, occupational therapies, etc.).
• General parenting support and/or child development information.
• Information about community resources, school readiness expectations and Kindergarten readiness.
• Access to affordable recreational activities, parks, camps or after-school programs.
• Addressing population growth/increasing diversity of population particularly among non-English speaking families.
• Affordable health insurance, dental, and medical care.
• Unemployment, underemployment, or availability of jobs.
• Access to affordable housing, healthy food and transportation.
• Infant mortality particularly among black and Hispanic subgroups.
Resource Awareness and Communication
Parent survey respondents were asked to report their familiarity with the Guilford County Partnership or Smart Start. Figure 32 reports that over a third of respondents had not heard of the Partnership or Smart Start before completing the survey.
Figure 32: Parents' Report of Familiarity with the Guilford County Partnership for Children or Smart Start
NO, never heard of it until this survey
Yes, heard of it & programs it funds but have NOT participated
Yes, my family has participated or benefited from a program(s)
Other service providers and key informants were given a list of GCPC funded programs focused on family support and asked about their awareness and referrals for clients. Figure 33 reports percentages of responses by program for the 97 survey respondents responding to this survey item. Note that some programs only serve specialized populations and may not be open to universal services in the community and therefore not likely as recognizable.
Figure 33: Other Service Providers/Key Informants' Report of Program Awareness
Adopt-a-Mom
NICU Family Support
Guilford Family Connects
Family Literacy (Reading Connections Motheread Program)
Child Care Subsidies (Dept of Social Services)
Bringing Out the Best Parents as Teachers Healthy Start
Dolly Parton's Imagination Libary
NC PreK Program
Figure 34 reports parent survey responses regarding their regular communication usage by type of communication. The large majority (at least 90%) of respondents indicated access and usage to internet, email and texting. The 2022 five-year average American Communities Survey indicated that 93% of Guilford County households have a computer and 87% have internet subscriptions similar to statewide rates. Three-fourths of respondents (75%) reported using social media.
Figure 34: Parents' Report of Regular Communication Usage by Type
Parents responding that they use social media were asked to list the platforms they typically use. Table 18 reports the percentage of parents listing each type of social media used with Facebook as the most popular platform identified
Table 18. Parents' Reported Usage by Social Media Platform
Listening Session
GCPC Listening Session Themes Related to Resource Awareness and Communication
Parent/Caregivers
Families feel a need for resource awareness through either printed materials and/or resource hub.
Families need information on community resources (what, where, how).
Increasing family awareness of community resources and program eligibility information is a high priority.
Needs for easier ways to access information, resources and support families’ needs.
Families find social media platforms to be effective channels for disseminating information to families in the community.
Decision makers should increase awareness and understanding of families’ struggle with finding affordable, high-quality childcare and other financial burdens impacting family sustainability and the realities of income limits and accessibility of resources
Families desire for others to understand the realities of parenting and the diverse needs of each family and having their voices heard by decision makers.
Leaders need for understanding of need for integrated resources in the community.
Leadership awareness of families having issues during the summertime finding childcare and lack of funding.
Increase parent understanding of service eligibility and navigating application processes.
Parents often experience waitlists for services.
Parents wish for increased availability of cost-effective resources and assistance in navigating support systems, especially when they are in need but ineligible for certain services.
Early Educators (Infant/Toddler/PreK
Teachers, FCCH providers, Center Directors)
Childcare Center Directors appreciate communication methods that help ensure timely and widespread dissemination of information.
Email, social media (including support groups) and webinars are desired methods of communication by Directors.
Directors show willingness to be part of the chain of information – spread the word and communicate. Desire for increased communication between/among service providers (special needs services & childcare providers).
NC Pre-K Directors desire increased support and resources from the Partnership for them, their staff, and the families they serve.
NC Pre-K Directors struggle in connecting families with essential resources due to lack of awareness of resources and language barriers.
Child Care directors desire for public awareness of low wages teachers receive. Teachers desire for understanding of need for increased compensation for educators and recognition/respect of professional skills and value of ECE professionals as a critical asset necessary to communities.
GCPC Listening Session Notable Quotes to Resource Awareness and Communication
Parent/Caregivers
“When I was ready to return to work, I had to search, and it was a lot of work I had to put in to just find those resources. A resource guide is something that mothers can get when they're a new mom that would be very helpful."
Early Educators (Infant/Toddler/Preschool Teachers, FCCH providers, Center Directors)
“I wish everyone understood early childhood is not a babysitting service, they (teachers) lay the foundation as children learn everything they need to know during those first few years.”
“I’m not a babysitter, I am a brain builder.”
“Being called babysitters. It makes me feel like people really don’t know what we do. WE do more than just taking care of a child. We basically are everything for the child when they are in our care.”
Social Determinants of Health
Economics, Financial Security, Food Insecurity
The following are indicators of economic and financial need in Guilford County for families with young children.
• Less than half (48%) of Guilford County 25 - 44 year old’s are earning a living wage compared to NC (54%). A living wage is defined here as earning a family income equivalent to 300% or more of the federal poverty line (ACS, 2022)16
• There was an increase in school-aged child homelessness (including couch sleeping) according to McKinney-Vento statistics with Guilford County Schools for 2023 (3,120 children all grades, 4.7%) up from (2,525 children, 3.8%).17 The 2023 rate is also above the NC rate of 2.4%. Smart Start family support programs also recognized an increase in homelessness among families they served during 2024. The Pathways Program with Greensboro Urban Ministries reports a significant waiting list of 55 families with only 16 slots with longer residencies as of July 2024.
• Guilford County was ranked 75th out of 100 counties in the highest unemployment rates (4.3%) compared to NC rate of 3.7% (NC Department of Commerce, March 2024)8
• The median household income for Guilford County was $62,880 compared to NC ($66,186) (US Census, 2023)7.
• Guilford County was ranked 76th out of 100 counties in the highest housing cost burden rates (31%) compared to NC rate of 28% per housing cost burden. Housing cost burden is calculated as percentage of families spending more than 30 percent of their income on housing costs (NC Housing Coalition, from ACS 5 Year Estimate, 2021)30.
• 43.7% of children below age 18, live in poverty or low-income homes in Guilford County compared to 41.1% statewide. The county rate is up slightly from 2021 rate of 43.0% (ACS 2022 5 yr estimate)6
• 23.3% of children under age 18 who live in households lack consistent access to adequate food compared to 19.6% statewide. The county rate is up from the 2021 rate of 17.8% (Gunderson, et al. 2021)18
• 48% of adults (ages 25-44) in Guilford County earned a family sustaining wage compared to 54% across NC. Guilford County was also substantially lower than other large urban areas across NC (myFutureNC, 2024)22.
Listening Session
GCPC Listening Session Themes Related to Economics and Financial Security
Parent/Caregivers and ECE Professionals
Financial assistance is essential for bridging the gap between available resources and achieving a sustainable income level, alongside increased support for children with special needs or challenging behaviors.
Families struggle to balance affordability and family sustainability in Guilford County.
Families expressed that transportation for various activities and services was identified as a high need.
GCPC Listening Session Notable Quotes to Economics and Financial Security
Early Educators (Infant/Toddler/Preschool Teachers, FCCH providers, Center Directors)
A Director shared,” Families are having challenges paying for childcare. they need go to work, but they're late for care and paying fees, they try to find another place to go for care, but there are wait lists, and they're in a catch-22”.
Abuse & Safety
Figure 35 reports the 2023 percent of children ages 0-5 with an investigated report of abuse/neglect for Guilford County, NC and comparative counties. Guilford County’s rate of 5.42% (representing 1,961 children) is the highest among comparative counties but slightly less than the statewide rate. The NC Partnership for Children standard goal range is at least 5% and no more than 12%. Both Guilford and NC rates of abuse/neglect are down slightly from the previous year 2022, 5.6% (representing 2,022), and 6.0%, respectively (NC Partnership for Children, 2023)19.
Figure 35: 2023 Percent of children age 0-5 with an investigated report of child abuse/neglect
Durham Forsyth Guilford Mecklenburg Wake North Carolina
Infant Mortality & Maternal Health
Every Baby Guilford released the 2024 report on infant mortality in Guilford County. Figure 36 reports the infant mortality rates per 100 live births for the last five years. The data shows that historically, Guilford County is above NC and the nation on this indicator. There was an increase in the Guilford County rate from 2021 to 2022 from 7.6% to 8.8% (Every Baby Guilford, 2024)20.
Figure 36: Infant Mortality Rates per 1000 Live Births, 2017-2022 for US, NC and Guilford County20
Figure 37 reports the infant mortality rates per 100 live births for 2022 comparing Guilford County to comparative large counties and NC. The data shows a rate increase for Guilford County from 2021 to 2022, and that Guilford County is higher than NC and comparative counties (NC Center for Health Statistics, 2022)21
Figure 37: Infant Mortality Rates per 1000 Live Births, 2021-2022 for NC, Guilford County & Comparative Counties21
Durham Forsyth Mecklenburg Wake Guilford NC
Figure 38 reports the five-year rolling average infant mortality rates per 100 live births from 2012 to 2022 comparing race/ethnic groups for Guilford County. While the rate among black infants improved from the previous year, the data shows race disparities in infant mortality with black rates more than double Hispanic rates and nearly tripled white rates (NC Center for Health Statistics, 2022)21.
Figure 38: Rolling Five-Year Infant Mortality Rates
Per 1000 Live Births
by Race/Ethnicity for Guilford County 2006-202221
White Black Hispanic
Figure 39 through 43 reports prenatal variables that can have impacts on infant mortality rates and other long term health risks for babies. Figure 39 reports the percentage of late or no prenatal care births in Guilford County and NC for race and ethnic subgroups in 2023. Guilford County showed a slightly higher rate of late/no prenatal care. Racial disparities can be seen in Figure 39 with Hispanic births in both Guilford County and across the state having the highest rate of late or no prenatal care (NC Center for Health Statistics, 2023)12.
Figure 39: Percent of Late or No Prenatal Care Births For Guilford and NC 202312
Guilford NC
Figure 40 reports the percentage of late or no prenatal care births two-year trend in Guilford County by race and ethnicity. There was a slight improvement in the rates overall and for all subgroups with the exception of other race subgroups which increased from 32.8% to 35.6% (NC Center for Health Statistics, 2023)12
Figure 40: Percent of Late or No Prenatal Care Births
For Guilford Two Year Trend, 2002-202312
Figure 41 reports the percent of low birthweight births for Guilford County compared to NC statewide in 2023. Guilford County babies are slightly more at risk overall with a higher percentage of low birthweights. Black births in Guilford County had a slightly lower occurrence of low birthweights compared to NC (NC Center for Health Statistics, 2023)12. Some low birthweight is linked to birth of multiples.
Figure 41: Percent of Low Birthweight
(<2500 gms/5.5 lbs) Births
For Guilford and NC 202312
Guilford NC
Figure 42 reports the percent of low birthweight births two-year trend in Guilford County by race and ethnicity. There was an overall increase in low birthweight births and for all subgroups in Guilford from 2022 to 2023 (NC Center for Health Statistics, 2023)12
Figure 42: Percent of Low Birthweight (<2500 gms/5.5 lbs) Births
For Guilford Two Year Trend, 2002-202312
Figure 43 reports the percentage of NICU admissions among 2023 births by race/ethnicity compared to the population of total births by race/ethnic subgroups. Black babies were admitted to the NICU at a higher percentage than their occurrence in the population (38.9% of population is black and 46.8% of NICU population is black) (NC Center for Health Statistics, 2023)12
Figure 43: NICU Admission for New Births by Race/Ethniity Compared to Total Births by Race 202312
Listening Session
GCPC Listening Session Themes Related to Health, Safety and Nurturance
Parent/Caregivers
Families wish to place greater importance on raising awareness of mental health, promoting wellness and support among parents.
The demands of parenting and caregiving including addressing varying needs of multi-aged children.
Parents need to make taking care of themselves a priority to avoid burnout.
Families in Guilford County sometimes find it difficult to provide a safe and sustainable environment for families in public places.
Need for parent support groups for families with children with disabilities or behavioral/social emotional issues.
Need for parent support groups and parent education for both parents and grandparents.
Early Educators (Infant/Toddler/Preschool Teachers, FCCH providers, Center Directors)
Large caseloads/workloads for service providers in special needs services creating waiting lists and delays in services.
GCPC Listening Session Notable Quotes to Health, Safety and Nurturance
Parent/Caregivers
“I just noticed that a lot of people do not tap into the resources or utilize mental health services. I don't know if it's because of the stigma, transportation, or a financial situation, but that's just one of the top challenges. You've got to have your mental health strong because your kids, need you to be that way.”
Early
Educators (Infant/Toddler/Preschool
Teachers, FCCH providers, Center Directors)
A lot of the parents have to accept that the [special] need is there. That child has that disability, and then they get frustrated when they're trying to make calls and trying to get the help, and then they run into the same thing we do. The waiting list is so long, and trying to get them diagnosed. And we're getting frustrated because we are not getting any further than they're getting.
“If we wanna do a referral, we gotta do like 6 weeks of documentation before anything is done. By then by the time school is almost out, by the time you get people to come and do the evaluations, and it is just frustrating.”
“The support is there, but it just the process is so long, and their workload is so heavy. So, it's just trying to get them in in a timely fashion, so they get the services that they need prior to going to school... I just don't feel like they got full services that they need, so they are more prepared, with their special need, when going into the school system.”
1,2,4 NC Office of State Budget and Management. (see dates below). Population Estimates/Projections Data. Available at: https://www.osbm.nc.gov/facts-figures/population-demographics/state-demographer/countystatepopulation-projections#ProjectionData
1 Sex and Single Years of Age (2000 – 2050).
2 Sex, Race, Age Groups (2000-2050).
4 Hispanic Origin/Race by Sex and Age (2010-2050).
3 NC Department of Public Instruction. (2024). NC Public Schools Statistical Profile. Available at: http://apps.schools.nc.gov/ords/f?p=145:15:::NO:::
5 NC Partnership for Children. (2024). Smart Start Community Indicators. Available at: https://ncsmartstart.shinyapps.io/community_indicators/
6 United States Census Bureau. (n.d.). US Census Bureau: American Community Survey 5-Year Estimates. Available at: https://www.census.gov/acs/www/data/data-tables-and-tools/data-profiles/2018/
7 United State Census. (2023, July 1). United State Census. Retrieved May 26, 2024 from QuickFacts North Carolina: https://www.census.gov/quickfacts/NC
8 NC Department of Commerce, (March 2024) Local Area Unemployment Statistics Report, March 2024
9 North Carolina Division of Child Development and Early Childhood. (2024, June). From NCPC: DCDEE Enrollment Data_Centers_FCCH_AlphList.xls. Current and previous years available at (access required): https://ncsmartstart.sharepoint.com/sites/LPCentral/Shared%20Documents/Forms/AllItems.aspx?sw=bypass&b ypassReason=abandoned&id=%2Fsites%2FLPCentral%2FShared%20Documents%2F3%2E%20Evaluation%2 FEnrollment%20Capacity%20and%20Facilities&viewid=568fd25c%2D6766%2D4462%2Dadde%2D14a810ae bbb7
10 Child Care Services Association. (2024). Working in Early Care and Education in North Carolina 2023 Workforce Study Available at: https://www.earlyyearsnc.org/wp-content/uploads/Working-in-Early-Care-andEducation-in-North-Carolina2023-Workforce-Study-1.pdf
11 Guilford County Planning staff and board. (July, 2024). Guiding Guilford Moving Forward TogetherGuilford County Comprehensive Plan.
12 N.C. State Center for Health Statistics (2023, September 11). From Basic Automated Birth Yearbook (BABYBOOK. Available at: https://schs.dph.ncdhhs.gov/schs/births/babybook/2023/guilford.pdf
13 NC Partnership for Children. (2023). 2022-23 Reports: Guilford DPIL.pptx. Available at (access required): https://www.dpi.nc.gov/districts-schools/accountability-and-testing/school-accountability-andreporting/accountability-data-sets-and-reports#2023-24Reports-4468
14
NC Department of Public Instruction. (2024). Accountability Data Sets and Reports: 2023-2024 Disaggregated Performance Data. https://www.dpi.nc.gov/districts-schools/accountability-and-testing/schoolaccountability-and-reporting/accountability-data-sets-and-reports#2023-24Reports-4468
15 NC Partnership for Children. (2023). Data set derived from CDSA of Early Intervention Saturation Rates Ages 0-35 months and Ages 3-5. Available at (access required):
https://ncsmartstart.sharepoint.com/sites/LPCentral/Shared%20Documents/Forms/AllItems.aspx?sw=bypass&b ypassReason=abandoned&id=%2Fsites%2FLPCentral%2FShared%20Documents%2F3%2E%20Evaluation%2 FEC%20Profile%20Data%2F2022%2D23%20EC%20Profile&viewid=568fd25c%2D6766%2D4462%2Dadde %2D14a810aebbb7
16 United States Census Bureau. (n.d.). US Census Bureau: American Community Survey 5-Year Estimates: Table B17024: Age by Ratio of Income to Poverty Level in the Past 12 Months.
17 Guilford County Schools, (2023). Homeless Services & Community Support: McKinney-Vento. Available at: https://www.gcsnc.com/Page/30118
18 Gundersen, C., Strayer, M., Dewey, A., Hake, M., & Engelhard, E. (2021). Map the Meal Gap 2021: An Analysis of County and Congressional District Food Insecurity and County Food Cost in the United States in 2019. Feeding America.
19 NC Partnership for Children. (2023). Data set of Child Abuse/Neglect Investigations by County . Available at (access required): https://ncsmartstart.sharepoint.com/sites/LPCentral/Shared%20Documents/Forms/AllItems.aspx?sw=bypass&b ypassReason=abandoned&id=%2Fsites%2FLPCentral%2FShared%20Documents%2F3%2E%20Evaluation%2 FEC%20Profile%20Data%2F2022%2D23%20EC%20Profile&viewid=568fd25c%2D6766%2D4462%2Dadde %2D14a810aebbb7
20 Every Baby Guilford. (2024). 2024 Crucial Conversations: The State of Infant and Maternal Health in Guilford County.
21 NC Center for Health Statistic, NCDHHS Division of Public Health. (2022). NC Infant Mortality Report, TABLE 1B, NC Resident Infant Deaths (per 1,000 live births), 2018-2022. Available at: https://schs.dph.ncdhhs.gov/data/vital/ims/2022/2022-IMR-TABLE-1B-FINAL.html
22 My Future NC. (2024). 2024 myFutureNC Attainment Profiles. Available at: https://dashboard.myfuturenc.org/wp-content/uploads/county-profiles/Guilford_County.pdf
23 Early Years (formerly Child Care Services Association) (June 2024).NC ECE Data Repository, Data Fact Sheets, Factsheet 2 Young Children and Their Families in North Carolina, Available at: https://www.earlyyearsnc.org/research/nc-ece-data-repo/
24 Early Years (formerly Child Care Services Association) (June 2024).NC ECE Data Repository, Data Fact Sheets, Factsheet 5 Infant and Toddler Care in North Carolina, Available at: https://www.earlyyearsnc.org/research/nc-ece-data-repo/
25 Child Care Resources, Inc. (Aug. 2024). Guilford County Child Care Fact Sheet. Available at: https://stage.worklifesystems.com//NorthCarolina?county=Guilford
26 NC Partnership for Children. (2023 and previous years). Data set of PLA40 for LPC (DCDEE enrollment in 4 and 5 star facilities). Available at (access required):
https://ncsmartstart.sharepoint.com/:x:/r/sites/LPCentral/_layouts/15/Doc.aspx?sourcedoc=%7BF8FFB30A5CCD-41C7-BB5B-
5CF55C8B0A93%7D&file=PLA40%20for%20LPC.xlsx&action=default&mobileredirect=true
27 NC Partnership for Children. (2023 and previous years). Data set of EDU10 and EDU20 for LPC (DCDEE enrollment in facilities with at least 7 teacher and administrator education points). Available at (access required):
https://ncsmartstart.sharepoint.com/:x:/r/sites/LPCentral/_layouts/15/Doc.aspx?sourcedoc=%7BF8FFB30A5CCD-41C7-BB5B5CF55C8B0A93%7D&file=PLA40%20for%20LPC.xlsx&action=default&mobileredirect=true
28 Ready for School Ready for Life. (2022) derived from Guilford County Schools data. Kindergarten Readiness: GCS DIBELS data.
29 Child Care Services Association. (2024). Child Care WAGE$® Program Guilford Final Report Fiscal Year 2024.
30 NC Housing Coalition. (2024). 2024 Housing Need in Guilford County. Available at: https://nchousing.org/county-fact-sheets/