The Impact of Diversity on Longevity Fitness: A
Life-Course Perspective


Richard W. Johnson, PhD (Chair)
Senior Fellow
Director, Program on Retirement Policy Urban Institute
James Johnson Jr., PhD
William R. Kenan Jr. Distinguished Professor of Strategy and Entrepreneurship
Director, Urban Investment Strategies Center
Kenan-Flagler Business School University of North Carolina
ChangHwan Kim, PhD Professor
Director, Graduate Studies Department of Sociology University of Kansas
Maricruz Rivera-Hernandez, PhD Assistant Professor
Department of Health Services, Policy, and Practice
School of Public Health Brown University
Diane Ty, MBA, MA
Senior Partner, Business for Impact Director, Portion Balance Coalition
Interim Director, AgingWell Hub McDonough School of Business Georgetown University
Surya Kolluri, MBA
Managing Director, Thought Leadership Retirement and Personal Wealth Solutions Bank of America
This report was developed by The Gerontological Society of America and supported by Bank of America.
The Gerontological Society of America (GSA) is the oldest and largest international, interdisciplinary scientific organization devoted to research, education, and practice in the field of aging. The principal mission of the Society —and its 5,500+ members—is to advance the study of aging and disseminate information among scientists, decision makers, and the general public.
GSA’s policy institute, the National Academy on an Aging Society, conducts and compiles research on issues related to population aging and provides information to the public, the press, policymakers, and the academic community. It publishes the quarterly Public Policy & Aging Report as well as a public policy e-newsletter.

Great wall of China. China China, 1936. [or 1937] Photograph. https://www.loc.gov/ item/2016887866/.
“Better to be a dog in times of tranquility than a human in times of chaos.”
Ancient Chinese proverb
The increased lifespans and added years of healthy living people enjoy today are the result of unprecedented world stability since World War II along with advances in public health and medical care over the past century. Since the devastating influenza pandemic that spread as soldiers returned from World War I, global populations have swelled, reaching nearly 8 billion in 2020. Home for most people has shifted to urban areas, coinciding with a historic move from agriculture to industrial and knowledge-based jobs as people’s primary occupations.
In the city, people have enjoyed more stability in their daily lives. Droughts, boll weevils, and dust bowls were left behind, and many parts of life became more manageable and predictable. With public health measures such as better sanitation and vaccines—along with antibiotics and new treatments for the inflictions of humanity—lives were extended, and health-related quality of life improved.
Enter the coronavirus disease 2019 (COVID-19) pandemic. Everything changed; nothing was stable. Things were not like they were before the pandemic. Talk of a “new normal” meant people were realizing little was likely to return to the way it was. Change accelerated, with additional people discovering the advantages and disadvantages of working from home and online shopping.
For those unable to work from home— or even stay employed when businesses closed—the COVID-19 pandemic laid bare stark gaps in the social and financial support systems that threaten long, healthy, financially secure lives in the United States. From this, two Americas emerged. White-collar jobs that today can be done anywhere with an internet connection went on relatively unimpeded; salaries and benefits continued. Essential workers, including some of those in health
care, continued working, albeit at great personal risk of acquiring the virus.
In many service industries, work stopped as stay-at-home orders took hold. When businesses reopened, capacity was reduced, and with it fewer employees were needed. Some previous customers were no longer comfortable going out to dine, drink, fly, or stay overnight. Benefits, poor to begin with, disappeared, leaving millions with only unemployment payments and little health insurance coverage.
Those with blue-collar jobs were caught in the middle; many were able to get back to work after a few weeks of staying at home, but only if they were willing to risk contracting the virus and bringing COVID-19 back home. Health protocols became polarized, and social unrest reminded 21st-century America that systemic racism still existed.
This report seeks to explore these changing times through the lens of “Longevity Fitness”—a term that describes how people can thrive, not just survive, throughout increasingly long lifespans by achieving social, health, and wealth equity. This concept was developed in a recent report, Longevity Fitness: Financial and Health Dimensions Across the Life Course (Gerontological Society of America, 2019). Issues related to the economic aspects of longer lives were detailed in Longevity Economics: Leveraging the Advantages of an Aging Society (Gerontological Society of America, 2018).
The pandemic has already altered the landscape in ways unimaginable when 2020 dawned. Geography, race and ethnicity, disability, body size, gender, and sexual orientations and gender identities were already important. COVID-19 has taught all who would notice the importance of these factors
in the cold hard realities of caseloads and mortality rates. Just as they affect everything else in a person’s life, demographics are important variables in who gets COVID-19 and how they handle the virus.
P-TECH—a public–private partnership of IBM, the New York City Department of Education, and The City University of New York—was launched in 2011 with an eye on the projected need for 16 million skilled workers with associate degrees in STEM areas—science, technology, engineering, and mathematics—by 2024 in the United States. An important force behind this recognition that 4-year baccalaureate degrees were not equipping young people with 21st-century skills was Ginni Rometty, IBM’s chief executive officer when the program was launched.
Rometty has long been a proponent for correcting the broad gap in educational achievement and job opportunities for minorities in the United States. “My passion for this just grows,” Rometty said in a recent interview on CNBC. Now the executive chair at IBM, she said, “I believe the private sector has the ability to create a movement. I think this could be the greatest mobilization of the private sector for the benefit of society.”
P-TECH has expanded beyond New York City into more than 100 schools in eight U.S. states as well as into Australia, Morocco, and Taiwan. The effort now includes more than 500 large and small companies that are partnering with schools across a wide range of sectors, including health information technology, advanced manufacturing, and energy technology.
Sources: P-TECH, n.d.; CNBC, 2020.
Research into population-level differences in health status and life expectancy can be grouped under four domains: environmental, sociocultural, behavioral, and biological. The National Institute on Aging (NIA) developed a research framework that is useful for categorizing the expression of fundamental factors as part of life in the 21st century (Figure 1)
(Hill et al., 2015). In this report, the interprofessional structure provided by this framework is used to discuss factors across the continuum of demographics that can shape a person’s Longevity Fitness.
This report uses the life-course perspective of the earlier report on Longevity Fitness, which focused on
wealth, health, and social equity needed to thrive, not just survive, across the lifespan (Gerontological Society of America, 2019). Figure 2 lists key aspects of life that individuals, employers, and policymakers can focus on to improve the ability of older adults to achieve a key purpose of The Gerontological Society of America: To add life to years, not just years to life.
• Geographical and political factors (urban/rural, immigration/documentation, toxins/exposures)
• Socioeconomic factors (education, income/wealth, occupation, English proficiency)
• Health care (access, insurance, quality, literacy, numeracy)
• Physiological indicators (comorbidities, cardiovascular, sympathetic nervous system, hypothalamus-pituitary-adrenal axis, inflammation)
• Genetic stability (telomere attrition, epigenetic alteration, loss of proteostasis)
• Cellular function and communication (deregulated nutrient sensing)
Fundamental Factors
Ethnicity, Gender, Age, Race, Disability Status, Sexual/Gender Identity
• Cultural factors (values, prejudice, norms, traditions, religion)
• Social factors (institutional racism, family stress, occupational stress, residential stress, social mobility, social network)
• Psychological factors (self-concepts, stigma, bias, loneliness, stereotypes)
• Coping factors (active coping, stress management)
• Psychosocial risk/resilience (social support, discrimination, pessimism)
• Health behaviors (smoking, anger/violence, alcohol/drug, nutrition, physical activity)
Source: Hill et al., 2015.
Relationships
• Connections to career, workplace
• Marital stability
• Family and friends
• How you live at 45 affects whether you can thrive at 65 and 85
• Challenges in midlife: obesity, opioids, suicide, violence
• Socioeconomic factors affect rates of health decline
• Financial knowledge and behaviors
• Planning early, taking action in young adulthood
• Thriving, not just surviving, while aging
• “To add life to years, not just years to life”
Source: Gerontological Society of America, 2019.


“The United States is often hailed as the ‘land of opportunity,’ a society in which a child’s chances of success depend little on his family background. Is this reputation warranted? We show that this question does not have a clear answer because there is substantial variation in intergenerational mobility across areas within the U.S. The U.S. is better described as a collection of societies, some of which are ‘lands of opportunity’ with high rates of mobility across generations, and others in which few children escape poverty.”
Raj Chetty, Nathaniel Hendren, Patrick Kline, and Emmanuel Saez, in National Bureau of Economic Research Working Paper 19843, copyright © 2014 by the authors
As in other parts of life, the COVID-19 pandemic illustrates the importance of place on Longevity Fitness. Finding oneself in close quarters in New York City or nursing homes carved from the peanut fields of southwest Georgia was associated with getting the virus during the pandemic’s earliest phase in the United States, becoming ill, and especially for those in minority groups or without money or insurance, too often dying from the disease.
One factor that was common in both New York and Georgia was the greater impact of the disease, the pandemic, and the resulting economic crisis on people of
16,233
May 2020
color and those of little means. People in lower-paying jobs in restaurants, hotels, and bars were laid off. Others in lowerpaying positions couldn’t do their jobs
from home, avoid public transportation, or afford to stop working. This put them at greater risk of infection with the coronavirus, which they brought back to homes that were more likely to be crowded and filled with multiple generations. They lacked access to health care when symptoms began. Illness and deaths followed disproportionately.
The animal slaughtering and processing industry provides an example of employees who continued working—in fact, they were forced to do so after being declared essential workers. In this industry, 16,233 COVID-19 cases were reported in 23 states in April and May 2020, resulting in 86 related deaths.
Source: Waltenburg et al., 2020.
All but 13% of cases were in people of color even though 39% of workers in these processing plants were White (Figure 3) (Waltenburg et al., 2020).
In a multistate survey of 350 U.S. adults who had been hospitalized or tested positive for COVID-19, people of color and those with annual household income of less than $25,000 were significantly more likely than other people to require inpatient care. (Tenforde et al., 2020).
Among the elements that drive Longevity Fitness, wealth is critical. Without sufficient income and the accumulation of wealth, healthy aging is difficult as health and relationship challenges present difficulties in older adulthood.
As reflected in the quotation at the beginning of this section, where an American child was raised makes a big difference in that person’s chances of overcoming poverty. Intergenerational mobility—defined as the probability of a child in the lowest income quintile in 1980–1982 reaching the highest quintile in 2011–2012—varies based on residential segregation, income inequality, school quality, social capital, and family structure in the geographic areas where they were raised (Chetty et al., 2014).
Translated for 50 metropolitan areas, these data show that the odds of a child moving from the lowest to the highest quintile are lowest when raised in southeastern cities such as Atlanta or Charlotte or Raleigh, North Carolina. The highest mobility percentages were found in several California cities (San Jose, San Francisco, and San Diego), Seattle, Salt Lake City, Boston, Washington DC, New York City, Manchester, New Hampshire, and Newark, New Jersey (Chetty et al., 2014).
The 10% of Americans living in the 97% of the country defined as “rural” certainly face similar challenges as those
in impoverished urban and suburban areas along with unique ones. Elements of basic infrastructure such as clean water can be compromised, internet connections poorer, health care resources lacking, and obesity and drug use more common. As people age, the lack of mass transit and food options in rural areas is difficult to overcome when ability to drive or physical and mental acumen decline. The problems of rural poverty have been reduced by Social Security (the great income leveler), Medicare, and Medicaid and other safetynet programs. But in many ways, life is not much better than in the early 1960s when Michael Harrington linked poverty in rural areas and urban ghettos in The Other America (Harrington, 1962; Dickerson et al., 2017).
Rural areas are incredibly diverse yet often not inclusive. Population statistics are useful for showing the gender, racial/ ethnic, and income divides in rural areas, but there are also immigrants, gay men, lesbians, transgender individuals, and people with disabilities. Limited communities are available to provide social support, and health care professionals can lack both expertise and empathy for addressing their physical and psychological needs (Ajilore & Willingham, 2019). In the COVID-19 pandemic, educational opportunities vary greatly even in urban areas, depending on one’s zip code (Abou-Sabe et al., 2020).
As European settlers and early Americans forced Native Americans from their homelands and took the best lands for themselves, reservations were created, often in arid and sometimes desolate areas. Native Americans who move off these often-impoverished reservations have to leave the home they love, give up their rights as citizens of a sovereign nation, and forgo access to free services provided by the tribes and Indian Health Service. Most Native Americans opt to live off-reservation—78% in the 2010 U.S. Census (U.S. Department of Health and Human Services Office of Minority Health, 2018)—including the children and grandchildren of those who were forced to leave by U.S. Government policies of the 1950s (Koppisch, 2011; Whittle, 2014).
of Native Americans lived off-reservation in 2010 78%
The decline of manufacturing in the Rust Belt states—a trend that started a half century ago—has transformed life and economic health of this region. Both automation and less expensive labor costs in other countries have reduced manufacturing jobs, and it remains to be seen whether economic nationalism, trade wars, or other factors can stop the loss of positions or restore segments of the manufacturing-based economy.
Suburban areas are today a far cry from the stereotypical image from the 1950s of places where well-to-do people lived in bliss with above-average children. As explained by Scott Allard in Places in Need, poverty trends since 1990 show that suburbs of the largest metropolitan areas in the United States have more poor people than do the urban cores, and more of those in deep poverty are in the suburbs. Suburban communities have become more racially diverse; lowincome Whites are more likely to reside in suburbs than the urban core. Urban and suburban poverty worsened after the Great Recession a dozen years ago—and now the COVID-19 pandemic has created economic hardships for many. Crucially, Allard warned, the structural economic and demographic realities producing poverty in the central cities are having the same effects in the collar communities and counties surrounding the great American cities (Allard, 2017).
To support the physical strength and mental acuity needed for Longevity Fitness, people need access to clean air and water, nutritious foods, quality health care services and educational systems, a safe environment in which to sleep, exercise, and share life with family and friends, and the income and wealth needed to pay for these needs. While the Rev. Dr. Martin Luther King Jr. is best remembered for his impact on civil rights, he also recognized and talked frequently about the economic opportunities needed for Blacks to truly achieve the American dream (King, n.d.).
A half century after his death, the racial equality movement is testament to the lack of progress made and the need for
society and its systems, as the Rev. Al Sharpton said in the Minneapolis eulogy for George Floyd, to “get your knee off our neck” (Sharpton, 2020).
Diversity and inclusion programs in American corporations and society can help address this systemic racism, which permeates all aspects of life and affects Blacks and other people of color and those of different genders, sexual identities, and economic backgrounds. Addressing the economic shackles placed on Blacks after slavery ended could provide a roadmap on dealing with inequities endured by many disadvantaged people in the United States.
Opportunity begins at home—the quality of health care, the cleanliness of water and air, avoidance of pathogens and allergens, the ability and availability of parents and caregivers to provide guidance and values,
and the availability of talented teachers and safe schools. The primary path for most Americans to build wealth is through home ownership. Without the wealth needed to get into the housing market, renters become cost-burdened, and this problem grows as people age into fixed income (primarily Social Security). This has worsened as the best jobs have been located in large cities where affordable housing is scarce. Nothing is saved for a rainy day, and when income drops or is interrupted by a recession or pandemic— or both at once—no financial cushion is available and the equity loans that homeowners can get are not possible.
Nationally, only 59% of households can afford the typical monthly payments in their metropolitan area, according to the Harvard Joint Center for Housing Studies (Figure 4). Among renters, this figure
or more of family income is consumed by rent
drops to 39% (Figure 5) (Joint Center for Housing Studies of Harvard University, 2015). Renters are also often cost burdened (rent consumes 30% or more of family income), particularly people of color (Figure 6) (Joint Center for Housing Studies of Harvard University, 2020). Renting has become more common among those traditionally more likely to own
their home, including people aged 35 to 64 years, older adults, and married couples with children. Families with children now make up a larger share of renter households (29%) than owner households (26%) (Joint Center for Housing Studies of Harvard University, 2020).
Because children cost money, family obligations and indebtedness are other important factors in determining whether people are able to build wealth. Early pregnancy, cultural views, and religious beliefs affect the number of children in a family, and that has direct effects on the monthly budget as well as longterm prospects for home ownership and accumulation of wealth. The financial costs of additional children varies considerably among the socioeconomic classes; they are quantified for those at the poverty level, which is defined in the
United States by family size. For a singleperson household, this figure is $12,760 for 2020; it rises to $44,120 for a family of 8 (Assistant Secretary for Planning and Evaluation, U.S. Department of Health and Human Services, 2020).
With food and housing taking up a sizable portion of after-tax earnings, families with limited income must engage in trade-offs between housing and food costs—the more meals per week the family needs, the less can be spent on housing. For people in poverty or with low incomes, the result is often a large family crammed into a small space (Kraft, 2019). Adult siblings may combine their families into a single home, and some 64 million Americans—20% of the U.S. population—were living in multigenerational households in 2018, including higher percentages of Asian
Figure 5. Percentage of Renter Households That Can Afford Median-Priced SingleFamily Homes in Their Metropolitan Area
Share of Renter Households (%)
Source: Joint Center for Housing Studies of Harvard University, 2020.
Figure 7. Percentage of Racial/Ethnic Groups Owning Home—United States, Second Quarter 2020, and Net Worth—United States, 2016
Source: U.S. Census Bureau, 2020; Dettling et al., 2017.
(29%), Hispanic (27%), and Black (26%) households (Cohn & Passel, 2018). Add a coronavirus, and the result is rapid spread of illness and increased mortality in communities in need, which are disproportionately people of color.
Housing costs in cities, towns, and different parts of the United States differ greatly, and patterns of home ownership also vary among the races and ethnicities. However, these two factors do not always coincide—and systemic racism is one explanation for the variance. Home ownership by race for the second quarter of 2020—before the COVID-19 pandemic led to widespread job layoffs and furloughs—is shown in Figure 7 (U.S. Census Bureau, 2020; Dettling et al., 2017). Data from Redfin (2020) show that the Washington DC area has a high median sale price for homes, at $440,000 in April 2020. Despite this
high cost of housing, this area has the smallest gap between Whites and Blacks for home ownership; the largest gap is in the moderately priced Minneapolis area (Figure 8)—the origin of social unrest following the death of George Floyd during an arrest by the city’s police (Anderson, 2020).
Numerous factors contribute to low home ownership, including the Home Owners’ Loan Corporation “redlining” of minority or immigrant neighborhoods in the early to mid-20th century. This practice denied mortgages and loans that would have permitted minority and immigrant families to purchase or improve their homes (Leger, 2019). Over time, such practices perpetuated the Black–White wealth gap and decreased children’s economic, educational, and social opportunities (McIntosh et al., 2020).
The Urban Institute has identified these ongoing contributors to the gap in low home ownership among Blacks (Choi et al., 2019):
• Lower median household income among Blacks ($38,183 in 2017, compared with $61,363 for Whites).
• Greater availability of parental financial support for young lowincome Whites.
• Low credit scores, insufficient credit, and no credit history among Blacks.
• In areas with higher levels of segregation, White households
Minneapolis, MN
Grand Rapids, MI
Salt Lake City, UT
Milwaukee, WI
Rochester, NY
Buffalo, NY
Pittsburgh, PA
Cincinnati, OH
Cleveland, OH
Phoenix, AZ
San Francisco, CA
Philadelphia, PA
Jacksonville, FL
San Antonio, TX
New Orleans, LA
Orlando, FL
Richmond, VA
Los Angeles, CA
Austin, TX
Washington, DC
have higher home ownership rates; ownership scores are better for Black households in areas with more new construction.
• Unexplained factors, possibly related to “vestiges of policies that have made it difficult” for Blacks to own homes.
The Nine Nations of North America, published in 1981, is a classic text on the regionalization of the United States (and other parts of the continent) into areas that make more sense than most national and state boundaries. The values, work habits, religions and religious beliefs, and views on history are influenced by where people are raised and where they now live (Garreau, 1981).
Despite the “melting pot” effects of combining people from all over the world, patterns of obesity, physical activity, poor dietary choices, and television viewing (Figure 9) track one another closely across Appalachia, much of the Deep South, and extending into Texas, Oklahoma, Arkansas, and Missouri. Scores on these determinants are slightly better across New England and the formerly industrialized states of the Rust Belt west to the Great Plains. The Far West also tends to have better scores on these measures (Centers for Disease Control and Prevention, National Center for Chronic Disease Prevention and Health Promotion, 2020).
In many of these same areas, recent patterns of opioid use and abuse, related deaths, suicide, and health effects of obesity have caused an increase in mortality among both young and middleaged adults. White women in midlife seem to be especially affected by opioidrelated deaths. Completed suicides are more common in middle-aged men, but these have also increased among women, adolescents, and even children. Victims of fatal motor vehicle accidents and homicides are more frequently men. These trends reduced Americans’ life expectancy
at birth—78.6 years—and moved the United States into last place among 18 high-income countries (Arias & Xu, 2019; Ho & Hendi, 2018).
The workplace is a prime place for interventions designed to increase healthy behaviors among adults. Workplace wellness programs can encourage employees to take actions that can prevent illnesses and lead to longer, healthier lives, including these benefits as compiled by the Society for Human Resource Management (2019):
• Vaccination clinics.
• Nutrition education.
• Exercise programs and activities.
• Fitness centers and fitness club memberships.
• Health screenings.
• Health risk assessments.
• Weight loss programs.
• Smoking cessation programs.
• Stress reduction programs.
• Health and wellness incentives.
Data from 2012 show that employee wellness programs are more commonly offered in the Northeast than in other regions of the United States. RAND Health’s Workplace Wellness Programs Study showed that about half of employers across the country offer such programs, but government employers and those with more than 100 employees are more likely to have employee wellness programs. In the Northeast, 66% of employers reported having these programs, compared with 49%, 51%, and 42% of employers in the Midwest, South, and West, respectively (Mattke et al., 2013).
In the Workplace Health in America Survey, fewer than one-third of worksites were offering some type of program to address physical activity, fitness, or sedentary behavior. The survey, conducted by the Centers for Disease Control and Prevention (CDC) in conjunction with the University of North Carolina at Chapel Hill, found that 19% of worksites had a program to help employees stop using tobacco products, and about 17% of worksites were offering a program to address obesity or weight management (Linnan et al., 2019).
Likelihood of employee wellness programs by region
Figure 9. Prevalence of (a) Adult Obesity, (b) Adult Physical Activity, (c) Adult Consumption of Fruits, and (d) Television Viewing by Teenagers—United States, 2017–2018
(a) Adult Obesity as Defined as Body Mass Index ≥30
Data unavailable
49.6-53.9
Data unavailable
29.7-33.0
33.1-36.4
36.5-38.6
38.7-56.0
Data unavailable
Data unavailable VALUE (%)
23.6-28.7
(d) Teenagers Viewing Television ≥3 Hours on School Days
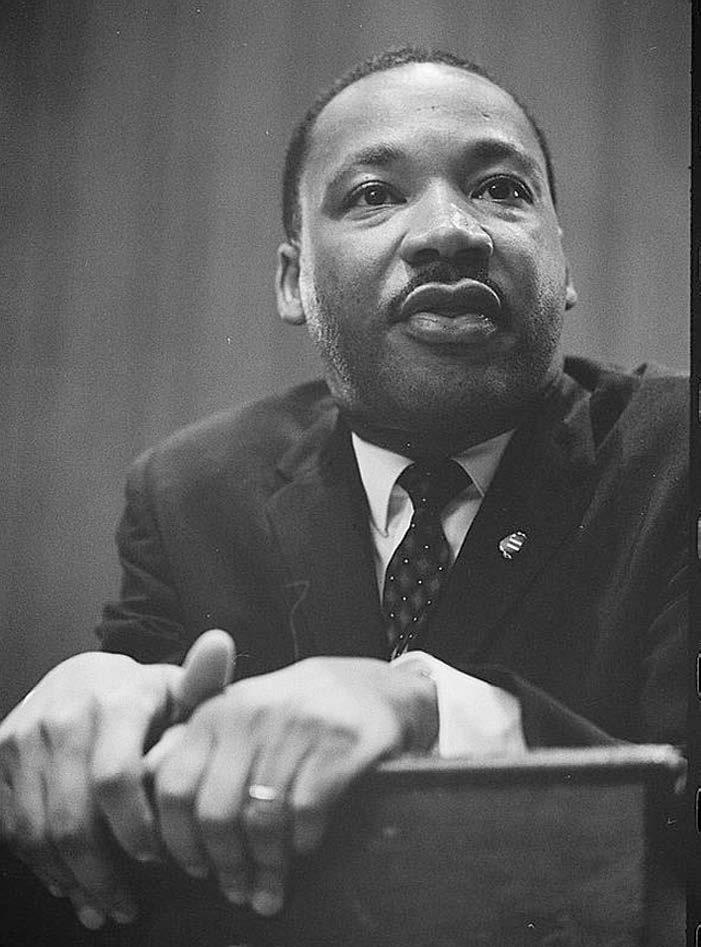
Photograph. https://www.loc.gov/ item/2003688129/.
“Perhaps a more tragic recognition of reality took place when it became clear to me that the [Vietnam] war was doing far more than devastating the hopes of the poor at home. It was sending their sons and their brothers and their husbands to fight and to die in extraordinarily high proportions relative to the rest of the population. We were taking the Black young men who had been crippled by our society and sending them eight thousand miles away to guarantee liberties in Southeast Asia which they had not found in southwest Georgia and East Harlem. So we have been repeatedly faced with the cruel irony of watching Negro and White boys on TV screens as they kill and die together for a nation that has been unable to seat them together in the same schools. So we watch them in brutal solidarity burning the huts of a poor village, but we realize that they would hardly live on the same block in Chicago. I could not be silent in the face of such cruel manipulation of the poor.”
The Rev. Dr. Martin Luther King Jr., April 4, 1967, in his “Beyond Vietnam” speech in New York City
Given the long-standing and ongoing segregation of many American neighborhoods, the place-based considerations for Longevity Fitness carry over to social, health, and wealth challenges faced by people of color. But the obstacles that push people down and keep them from thriving are not all explained by place—race and systemic racism built into economic, educational, and health care structures have a demonstrable impact on people’s lives.
In 2020, the COVID-19 pandemic has made social determinants of health a common phrase in the cable news echo chamber, and the racial equality movement has shown how systemic racism created and sustains inequality of opportunity and justice. In the workplace, diversity and inclusion programs can help even the playing field, but can these efforts succeed without extending into the community where people live and breathe? Can the programs work as long as people of color live entire lives dealing with built-in disadvantages in the paths of education, the choices for food and health care, affordable transportation and housing options, and the safety of walking along the street?
When a pandemic closes offices and retail businesses, those who can work from home and are in a neighborhood with a good internet connection keep making money; those who can’t and don’t have those advantages need to figure out how to live on a one-time $1,200 federal stimulus check and limited unemployment payments. The illogical connection of health insurance to employment has been exposed (Agarwal & Sommers, 2020). Corporate America has a better appreciation for what parents have long realized: when schools can’t reopen, the lack of an affordable child care option is an intractable problem and childhood hunger increases (Bauer, 2020).
The chronic neglect of the long-term care system is exposed by the predominance of deaths among residents in assisted living facilities and nursing homes.
This situation creates challenges for companies and organizations seeking to focus on diversity and inclusion. People of color and others trying to make do at the poverty line are not able to adjust to working from crowded homes with no or poor internet connections. The cutbacks in public transportation affect their options for getting to work while exposing them to COVID-19 on the way. Food insecurity rises, including for children who are not physically attending schools. Health options are fewer if they become ill. The cascade of inequities faced by people of color may have been highlighted by COVID-19, but they’re not new. Let’s look at the problems in the environmental, sociocultural, and behavioral domains.
The United States is a country where Blacks were enslaved for nearly two and a half centuries. Antebellum racism was built into the post–Civil War economic and cultural systems in the American South, and the northern cities adopted some of these systemic elements when Blacks fled from the Jim Crow South during the Great Migration. The result is the inequality in rights, education, opportunities, and health care that we see today; this systemic racism is a core target of the racial equality movement (Bertocchi, 2016).
In the American West, racism and discrimination thrived but with different targets. Asians were discriminated against and exploited during construction of the transcontinental railroad and the building of the levees that control flooding around the San Francisco Bay and Sacramento River. In decisions that parallel the racism of Dred Scott v. Sandford in 1857, the U.S. Supreme Court in the late 1800s ruled against citizenship for Asians, interpreting the Fourteenth Amendment to cover only “free white persons” and those of African descent who had been slaves. The Chinese Exclusion Act of 1882 barred immigration from China into the United States and excluded Chinese immigrants from employment by governments, and this ban stayed in place in one form or another until the Immigration and Nationality Act lifted quotas on immigration. In California, the Alien Land Law of 1913 restricted leasing or owning land in that state to natural born citizens (those born in the United States); it survived court challenges until 1952 (Advancing Justice–LA, 2019; Locke, California, n.d.; Morgado, 2018).
Today, many Hispanic immigrants are paid minimal wages without health benefits during a pandemic that is decimating communities. The fact that people of color are more often living in areas with limited resources, poorer educational facilities, more pollution and toxins, and high rates of crime is not by chance—it is a direct outcome of decisions made long ago and investments made or not made in infrastructure and educational systems.
From these historical burdens and present realities spins the fate of people of color. Without a quality primary and secondary education, people of color have limited postsecondary educational opportunities and are more likely to end up in lower-
Median earnings for people aged 55 to 64 years
$62,000 White men
$45,600 White women
$44,000 Black men
$36,000 Black women
$39,000 Hispanic men
$30,000 Hispanic women
paying jobs. Without adequate income, Blacks and Hispanics have been unable to make the transition from rental to ownership of homes and related wealth accrual (Figures 7 and 10). Without real estate as the basis for wealth—and with the bulk of wealth in lower- and moderateincome groups made up of home equity— Blacks and Hispanics have experienced little wealth accrual over the past three decades, even as the net worth of Whites soared (Figure 11). Notably, Blacks as a group have more consumer credit debt than home mortgage debt (Figure 12) (Board of Governors of the Federal Reserve System, 2020).
Among people aged 55 to 64 years in 2020, White men (median earnings, $62,000) continue to earn more than White women and most people of color: White women ($45,600), Black men ($44,000), Black women ($36,000), Hispanic men ($39,000), and Hispanic women ($30,000) (Joint Economic Committee, U.S. Congress, 2019).
While the median income of Asian Americans is now the highest of U.S. racial and ethnic groups (Figure 13) (Semega et al., 2019), this trend is misleading in several ways. Because most of the growth among Asian Americans has come from immigrants and their children, differences in education, skills, and wealth at the time of entry—combined with the opportunities afforded by declining discrimination—account for all of the growth in the financial resources held by some in the Asian American community (Kim & Sakamoto, 2010). There is a yawning gap between highand low-earning Asians, with those in the top decile making 10.7 times as much as Asians in the lowest decile (Figure 14) (Kochhar & Cilluffo, 2018). For less-educated Asian Americans, the “model minority” image of Asian Americans is harmful; at the low end of the earnings distribution, less educated Asian Americans earn substantially and significantly less than equally qualified Whites (Kim & Sakamoto, 2014).
1989:Q3 2019:Q4
Source: Board of Governors of the Federal Reserve System, 2020.
Source: Board of Governors of the Federal Reserve System, 2020.
As reflected in the gap for Whites shown in Figure 14, they too are not exempt from low-paying jobs and the accompanying economic woes. The percentages of Whites with low incomes are lower than for Blacks and Hispanics, but their much larger numbers often mean that a greater number of Whites are at or below the poverty level, on nutrition assistance programs, and receiving Medicaid coverage (Kochhar & Cilluffo, 2018).
Source: Semega et al., 2019.
Figure 14. Growth in Income Inequality in the United States by Race, 1970–2016
Notes: Whites, Blacks and Asians include only non-Hispanics and are single-race only 2016. Hispanics are of any race. Asians include Pacific Islanders. Income is adjusted for household size. “Income Inequality in the U.S. Is Rising Most Rapidly Among Asians”
PEW RESEARCH CENTER
Source: Kochhar & Cilluffo, 2018. Reproduced courtesy of Pew Research Center.
With lower-paying jobs comes less job security during layoffs, furloughs, and economic downturns. For example, during the COVID-19 pandemic, Hispanic workers were initially hard hit, with unemployment rates jumping to 18.2% in April 2020 from 6.3% a month earlier. Smaller but sizable increases between March and April were also recorded for Whites (from 3.6% to 12.8%), Blacks (from 7.2% to 16.6%), and Asians (4.0% to 13.7%) (Couch et al., 2020).
Because of the link in the United States between health insurance and employment, job loss (including retiring before the Medicare benefit becomes available at age 65 years) usually means the loss of health insurance. Many people who lose their jobs cannot afford to continue their group coverage as permitted under the Consolidated Omnibus Budget Reconciliation Act, or COBRA. Families USA reports record losses of health insurance in the United States during the pandemic, with the number of uninsured adults ages 18 to 64 years increasing by 39%, the highest annual increase ever recorded. The organization also noted high numbers of cases in several states where more than 20% of residents have no health insurance, including Florida (25%), Georgia (23%), Mississippi (22%), Nevada (21%), North and South Carolina (both at 20%), and Texas (29%, highest in the country). By May 2020, 5.4 million Americans had lost health insurance, more than the 3.9 million who lost coverage in 2009 as a result of the Great Recession. The
pandemic losses reverse much of the gain in insured American adults since 2010 under the Affordable Care Act (Families USA/National Center for Coverage Innovation, 2017).
A report from the Congressional Joint Economic Committee highlights the three-legged stool of retirement—Social Security, pensions, and individual savings—that has historically supported Americans in their older years. Social Security benefits are lower for people of color and women (Figure 15), pensions have disappeared for many people (Figure 16), and retirement savings are limited for people without employersponsored defined contribution plans such as 401(k) accounts (Figure 17) (Joint Economic Committee, U.S. Congress, 2019).
Blacks and Hispanics are less likely to participate in employer-sponsored voluntary savings plans such as 401(k)
benefits. When they begin putting away a percentage of each paycheck under these plans, they save lower percentages of their income and thus accrue less wealth. In addition, Blacks and Hispanics are more likely to make hardship withdrawals, which temporarily remove savings from potential growth through investments. A 2012 report showed that 6.3% of Blacks made hardship withdrawals in 2007 and 8.8% took these in 2010 owing to the Great Recession; this compared with 2.0% and 3.2% of Hispanics, 1.1% and 1.7% of Whites, and 0.7% and 1.2% of Asians during those years, respectively (Ariel Education Initiative & Aon Hewitt, 2012).
Lower participation in retirement plans and fewer or no benefits are also associated with lower-paying jobs. The pay gap between White men and others persists in the last few years of employment when many enjoy their highest earnings and savings periods. This results in higher retirement insecurity for White women and people of color. Early retirements can further decimate the ability of people of color to maintain
their standard of living into retirement, but these are necessary for some because of physical limitations or chronic conditions. These may have resulted from years of physical labor or repetitive motions on the job, chronic diseases (such as hypertension, heart disease, respiratory decline), or consequences of conditions such as alcoholism (liver disease), smoking (lung cancer or chronic obstructive pulmonary disease), or complications and costs associated with diabetes and other metabolic conditions.
Retirement prospects for women of color—and women in general— are affected by unpaid caregiving responsibilities, which lower current income and future retirement and Social Security benefits. Cultural issues come into play. Asians, Blacks, and Hispanics are more likely to be living in multigenerational households, and beliefs about taking care of the family in the home versus institutions lead to women dropping out of the workforce to provide care. In addition, people of color have higher rates of obesity and other
Source: Joint Economic Committee, U.S. Congress, 2019.
Figure 16. Share of Workers Participating in Defined Contribution Plans Versus Defined Benefit Plans, U.S. Workers Aged 21–64 Years, 1989–2016
Defined Contribution Plan
Defined Benefit Plan
Source: Joint Economic Committee, U.S. Congress, 2019.
Figure 17. Share of American Workers With Retirement Accounts by Income Quintile, 2016
Source: Joint Economic Committee, U.S. Congress, 2019.
diet-related conditions, including type 2 diabetes, cardiovascular disease, certain types of cancers, and dementia, and these lead to a need for care (Age Wave & Merrill Lynch, 2017).
Correcting inequities in retirement benefits requires a societal approach to the problem of entrenched systemic racism. Small steps in the corporate realm can begin this process, including the following:
• Provide full benefits to all employees, including options for health care and retirement savings.
• Use employee assistance programs to help those facing difficulties identify solutions and find ways of communicating needs to managers and corporate leaders.
• Enhance financial education programs for all employees. In such programs, address distrust in financial systems as well as the basic information on the importance of savings and investing in stocks, bonds, and mutual funds.
• Provide age-specific advice about optimization of retirement savings based on income level, years of expected employment remaining, and expectations for retirement.
• Make voluntary retirement programs opt-out rather than opt-in to increase the percentage of employees who are enjoying contribution matches and saving for retirement. In one classic study, changing to automatic enrollment in 401(k) plans increased participation rates from 37% to 86% (Madrian & Shea, 2001).
Health is another area in which people of color have many disadvantages that can affect their Longevity Fitness. Owing to lack of health care access that flows from the structural racism in the health financing and care systems (lacking
insurance and/or availability of providers and the transportation needed to get to them) and funds for out-of-pocket payments or associated nonmedical costs, people can live with health problems until these become too severe to ignore. Particularly in the Black community, past abuses in care and research have produced distrust in medical providers, vaccines, and the system in general. Physicians and other health professionals do not have to be racist for structural racism to place their patients in danger because the systems in which they practice are inherently racist. The violence and other factors that produce premature death in people of color are just as important for health professionals to address as clinical causes (Hardman et al., 2016), and that principle extends to employers and human resources departments.
Pregnancy-related deaths and adverse perinatal outcomes provide a window
into structural racism in the health care system. Among the 700 women who die each year in the United States as a result of pregnancy or childbirth, Black and Native American women are disproportionately affected (Figure 18) (Peterson et al., 2019). Perinatal outcomes are disproportionately worse among Blacks, but one study showed neonatal mortality was halved when a Black physician cared for the baby, in comparison with a White physician (Greenwood et al., 2020).
These and other racial determinants of health have produced shorter lifespans and years of healthy life for most people of color as well as Whites on the lower end of the socioeconomic scale. Health challenges, combined with greater risks of death through accident and violence, produces lower longevity for Blacks. Linking fewer expected years of life with race or ethnicity is difficult though, as a very strong association with income has
Figure 18. Pregnancy-Related Deaths per 100,000 Live Births—United States, 2007–2016
been established across all races, as shown in Figure 19 (Chetty et al., 2016; Health Inequality Project, n.d.).
An increased longevity observed in Hispanics has been called the Hispanic Health Paradox (Figure 20) (Dominguez et al., 2015). A “salmon effect” may be responsible, with healthier people immigrating to the United States and some people returning to their country of origin when they become ill or before they die (Medina et al., 2020). Similar differences in life expectancy among foreign-born individuals have been found for Whites and Asians (male life expectancy at birth in 2017, 81.6 years when foreign born versus 77.3 years for native-born individuals) and Blacks (80.6 years versus 72.1 years, respectively, for foreign-born versus nativeborn individuals).
These data and anomalies reinforce the need to look at specific factors that can affect an individual’s health and longevity. Particularly relevant to Longevity Fitness are weight and nutrition, chronic diseases, and cognition.
The adage “you are what you eat” reflects the impact nutrition has on people, beginning in utero and continuing throughout life. In the United States, availability of healthy foods varies greatly, obesity is common, and malnutrition is a concern among families living at the poverty level. Driving factors include both equity issues at the societal level, including systemic racism and poverty, and social determinants of health variables that can affect food choices and food security as well as availability of safe places to exercise. These factors have implications for corporations seeking to make a real difference in the lives of employees and their families through diversity and inclusion programs but also for those in their communities.
The marked differences in obesity rates among people of different races start early and continue into adulthood (Figure 21) ( Hales et al., 2017). Blacks and Hispanics
in the United States are disproportionately overweight or have obesity across all age segments. As discussed in the next section, obesity is the primary driver for several chronic diseases that are also more common in these groups (Trust for America’s Health, 2019).
Because Asians are often in what medical professionals view as the “normal” body mass index (BMI) range, overweight and obesity in this group can be overlooked. Their BMI should be assessed using a lower range for normal than in the other races (Joslin Diabetes Center Asian American Diabetes Initiative, n.d.; Yoon et al., 2006).
In developing health and fitness programs for employees, companies should remember that many people who are overweight or obese are satisfied with their body size. Companies
19. Life Expectancy at Age 40 Years by Income Levels in the United States, 2001–2014
can take a variety of approaches to address the sensitive issue of weight, including providing healthy choices in company cafeterias and at events, having alternatives to sugary drinks in vending machines, allowing or encouraging employees to have onsite voluntary weight-loss programs, and reducing employee contributions to health insurance for participation in wellness challenges. Beyond those inthe-workplace efforts, companies must confront directly the systemic racism in their communities and its structures and systems. With many if not most people now working from home during the COVID-19 pandemic—and perhaps likely to continue doing so—local businesses and corporations can take this historic opportunity to do the next right thing in addressing root causes.
Source: Centers for Disease Control and Prevention, National Center for Health Statistics, 2017.
Problems with diet, lack of exercise, and obesity lead directly to a host of conditions that are also common in people of color, including diabetes, hypertension, and cardiac conditions. Chronic conditions drive up the cost of health care, accounting for nearly half of all direct health care costs in the United States (Waters & Graf, 2018).
Blacks and Hispanics have higher rates of diabetes, hypertension, and cardiac conditions as well as stroke and certain cancers. When the sources of these disparities in disease were examined, nutrition- and health-related psychosocial factors explained relatively little of the variance; instead, socioeconomic status was a much more important determinant of poor health (Wang & Chen, 2011).
Asians and Whites, with overall higher incomes and socioeconomic status, do not develop these conditions as often, but the obesity epidemic is leading to increased disease and premature deaths in these groups too, especially in middle-aged Whites. Combined with the opioid crisis of the past several years, Whites in middle adulthood must be especially mindful of their habits and their weights. Increased mortality in Whites in recent years has been attributed to violence and drug overdoses, metabolic and cardiovascular diseases, and mental and behavioral causes, including use of psychoactive drugs (Woolf et al., 2018).
and Alzheimer’s disease in particular, older adults need greater support from family and friends—which is often unpaid and predominantly provided by women in middle or older adulthood. This commitment can affect the health of these caregivers and put their income and wealth for retirement in jeopardy if, as often happens, the unpaid responsibilities lead to their dropping out of the employed workforce (Butrica & Karamcheva, 2014). In addition, older adults with these conditions require greater institutional care as the disease progresses, depleting household wealth and often increasing costs for programs funded by state and federal governments (Alzheimer’s Association, 2019; African American Network Against Alzheimer’s, n.d.; Wu et al., 2016).
The evolving structures of contemporary families also present challenges in caring for relatives with dementia. Caregivers are often the spouse, and usually women since they tend to live longer and develop dementias in later years. Divorces among people after age 50—dubbed “gray divorces”—and other forms of marital dissolution eliminate the spouse as a potential caregiver and reduce the likelihood of children assisting with care, particularly of the father (Lin, 2008). The trend to single parenthood also often means that no spouse is available in later years.
When Blacks and Hispanics need care, they are more likely than others to lack a medical home and to seek care in emergency departments. In a study of diverse zip codes, researchers looked at rates of emergency department use by White, Black, and Hispanic older adults in the Medicare program. Compared with use by Whites, Blacks were 34% more likely to seek care in the emergency department, and Hispanics needed care in this setting 23% more frequently. These increased rates were significant even when analyzed based on age, comorbidity, zip code poverty rate, urban/rural area, and primary care–treatable and disposition status (Hanchate et al., 2019).
Dementia, particularly Alzheimer’s disease, is a major mortality threat to older adults. Those who live into their 80s
are at high risk of developing Alzheimer’s or other dementias, and this is one of the most common causes of death in the United States.
Thus, despite the greater longevity of Whites and Asians, it is striking that Alzheimer’s disease occurs more commonly in Blacks (2-fold increased risk compared with Whites) and Hispanics (1- to 1.5-fold increased risk). Lower educational attainment contributes to an increased risk of Alzheimer’s disease in this group, as do diabetes and stroke. Genetic factors are strongly associated with development of the disease, with higher frequencies of the detrimental ε4 variant of the apolipoprotein E gene (Steenland et al., 2015; Gurland et al., 1999; Haan et al., 2003).
Because of the functional deficits associated with dementias of all types
Families who live in intergenerational households, particularly Asian and Hispanic families, are more likely to have available family members to care for those with dementia. Black caregivers frequently juggle job with family responsibilities, as two-thirds are employed full- or parttime (AARP Public Policy Institute & National Alliance for Caregiving, 2015). The Alzheimer’s Association reports that 1 in 6 caregivers either quit working when they became a provider or because of the burden of caregiving duties (Alzheimer’s Association, 2020).
Availability of multiple children living nearby is another positive factor in caring for older adults, but the emotional, physical, and economic tolls on the caregiver are not lessened. About onefourth of caregivers for people with Alzheimer’s disease or other dementias
are “sandwich generation” caregivers who are responsible for both an aging parent and children younger than 18 years (National Alliance for Caregiving & Alzheimer’s Association, 2017).
Given the precarious financial and health foundations faced by many people of color, it is not surprising that resulting stresses can be detrimental in the sociocultural realm of Longevity Fitness. Being married has long been associated with lower mortality rates and better health behaviors, especially for men, and the need for a strong social support system in older adulthood begins with a romantic partner or intergenerational family member who can provide care during times of infirmity. Cultural differences found among people of different races produce differing choices and stresses across the life course (Umberson, 1992).
Family structures in the 21st century can range from people who remain single throughout life and have few relatives living near to those with numerous children born during multiple marriages. The resulting plethora of possible relationships affect the way core and extended family members react to challenges experienced during life. For Black families, children are often raised by single mothers or grandmothers, and as adults, they currently have less education and fewer opportunities to be hired into well-paying jobs, and financial stress results when they need to add caregiving responsibilities to an already-stressed life. Hispanic families face similar challenges, but larger family sizes provide more intergenerational possibilities for care.
As the Baby Boomer generation has approached and now entered older adulthood, marital dissolutions in later life have become increasingly common, and approximately 15% of divorces today involve one or more partners aged 50 years or older. These gray divorces are particularly detrimental for women of color when they were married for fewer than 10 years (spouses divorced after 10 or more years of marriage are entitled
to a portion of their former partners’ Social Security). Black and Hispanic women who are divorced at older ages are less likely than White women to have college degrees, to have worked in the labor force, to be receiving Social Security, or to have pensions, retirement accounts, or assets (Butrica & Smith, 2012).
Discrimination and resulting stressors in the daily lives of people of color is the major driver of adverse outcomes in the behavioral domain, and these are important to recognize when building diversity and inclusion programs in society and the workplace. Unless the root causes of systemic and longstanding racism are addressed, adverse outcomes in the behavioral realm will continue complicating and compromising Longevity Fitness for people of color (Feagin & Bennefield, 2014).
While race-related differences can be demonstrated in areas such as smoking, violence, alcohol and substance use, nutrition, and physical activity, these are more closely related to psychosocial stress secondary to socioeconomic status, income and wealth, and inequities in housing, nutrition, and health care (Salihu et al., 2020). Few race-related differences have been linked with problematic health behaviors outside those more associated with environmental and socioeconomic factors. Common to all races are the lifelong consequences of trauma during adverse childhood experiences, including emotional, physical, or sexual abuse; emotional or physical neglect; violent treatment of the mother; household substance abuse or mental illness; parental separation or divorce; or incarceration of any household members (American Academy of Pediatrics, 2014).
That said, systemic racism and discrimination of many types are damaging insults to a person’s resilience and resistance to intractable problems
such as chronic poverty, food insecurity, lack of quality health care, lack of opportunities to find meaningful employment that pays a living wage, and fear of violence from crimes in one’s neighborhood and persistent police presence that those crimes attract. As discussed earlier, Whites in geographic areas with limited economic opportunities are also affected by this psychosocial stress, as shown by the rampant morbidity and mortality caused by the opioid epidemic of the past two decades. All racial and ethnic groups except Asians were affected by increased use and related deaths, with Whites in rural areas, Hispanics near the fringes of large cities, and Blacks in small cities experiencing increased rates of drug-related mortality (Muennig et al., 2018).
Alcohol use in the Black community illustrates some of the racism-related problems faced by people of color and the difficulties of analyzing their causes (Vaeth et al., 2017). While rates of alcohol use disorder are similar among Whites, Blacks, and Hispanics, problem drinking is higher among Blacks than Whites. This is likely related to the presence of more alcohol-selling businesses in Black neighborhoods, greater police activity in those areas and the severity with which police deal with Blacks, less stable social homes and support systems (particularly for young Black men), and fewer positive influences that help to prevent drinking (American Addiction Centers, 2019). These higher rates of problem drinking lead to increased adverse childhood experiences, including abuse and violence, and the lifelong impact those can have on adult functioning (American Academy of Pediatrics, 2014).
Alcoholism has been associated with life in the Native American community, and American Indians historically have had higher lifetime rates of alcoholism (43.4%) than Whites (32.6%), Hispanics (22.9%), Blacks (22.0%), or Asians (15.0%) (Vaeth et al., 2017). However, alcohol use disorder in this group is firmly correlated with poverty, poor housing, relatively poor health, and academic failures (Fisher, 1987).
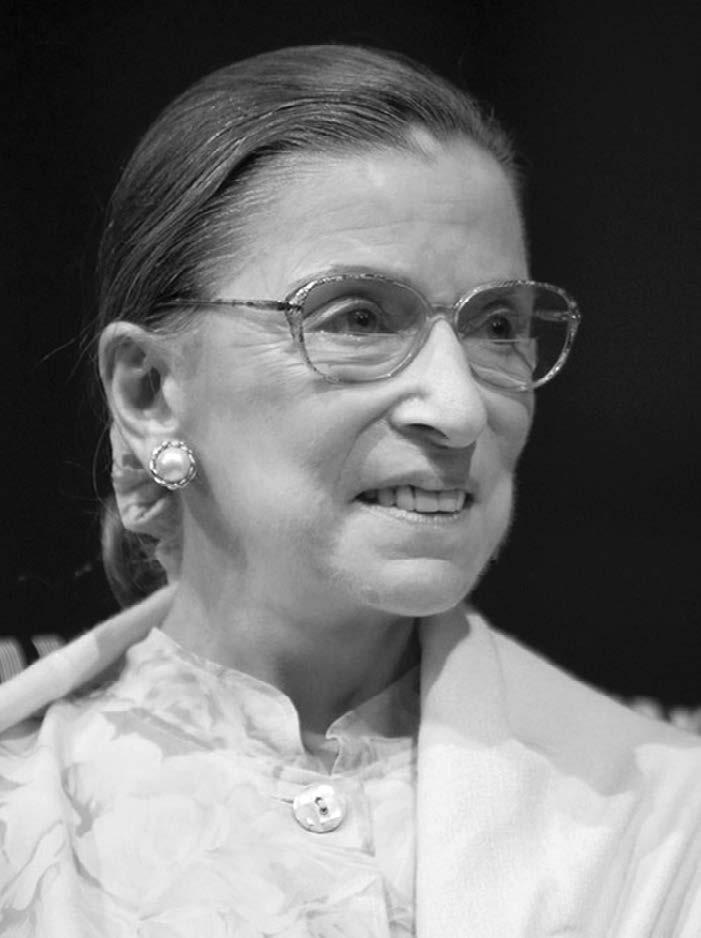
"Associate Supreme Court Justice Ruth Bader Ginsburg Visits WFU" by WFULawSchool is licensed with CC BY-NCND 2.0. To view a copy of this license, visit https://creativecommons.org/licenses/bync-nd/2.0/
“I have often said that women will not achieve true equality until men are as concerned as women are with the raising of the next generation.”
U.S. Supreme Court Justice Ruth Bader Ginsburg, in the Inaugural Justice Ruth Bader Ginsburg Distinguished Lecture on Women and the Law, New York City Bar Association, November 2000
During the initial response to the COVID-19 pandemic, unemployment rates skyrocketed in the United States as retail businesses closed and employees not able to work from home were laid off. As shown in Figure 22, the situation improved considerably within 3 months, with about one-third of those unemployed in the peak month of April 2020 returning to work by July. But unemployment remained high, and the recovery was not even for men and women. Jobs in education and health care did not recover as quickly as those in male-dominated professions. Children were stuck at home because of school closures and child care was unavailable or inadvisable. An unemployment gap emerged of more than 2 percentage points between married men and women with partners present and nearly 1 percentage point between
men and women overall (U.S. Bureau of Labor Statistics, 2020a). In The Wall Street Journal, a news article reported that “women’s careers often take a back seat when duty calls at home” (Weber, 2020).
The shift of modern culture from patriarchy to a balanced society is proving difficult. To some degree, it’s understandable that the patriarchal culture that has dominated life in the United States for four centuries and life around the world for millennia would be difficult to change. More women and people of color are in the workforce and responsible for American success, but White men remain in many positions of power. It is increasingly clear, though, that the power enjoyed by men is diminishing as women break one glass ceiling after another, bringing new perspectives to
business, new views to government, and new approaches to the world.
Even as more women attend college, enter the workforce, and climb corporate ladders, inequities remain. Women— who comprise the bulk of our nation’s caregivers—earn less throughout their careers, accrue less wealth over their lifetimes, and as a direct result, enjoy less financial security in older adulthood. Yet women live longer on average than men. Women have advantages that give them more years of life, even as their Longevity Fitness is compromised.
Source: U.S. Bureau of Labor Statistics, 2020a.
Writing off insults and harassment as just another day at the office may be ending, with the #MeToo movement and the increasing power of women in government at all levels accelerating this trend. Yet much more change is required, from the frames instilled in children’s minds by folk tales from the past and Disney movies of just a few decades ago. Division of labor in the home is becoming more equitable, even though at a glacial pace (Donner, 2020; Rao, 2019). Initiatives are exploring ways that people can create work–life balance to maintain jobs and careers at the same time. In a diverse and inclusive society, women must be able to pursue a career and maintain their livelihoods even as children are born and reared and parents age and require care.
Throughout their careers, women face unique choices that ultimately affect their Longevity Fitness. With the United States lacking social insurance programs common in other Western democracies and an income gap between the genders, women are more likely to stay home with children or take less demanding, lowerpaying jobs, while men are free to pursue more job opportunities, work longer hours and volunteer for overtime, and climb into higher salaries.
On the wealth side, similar disadvantages limit access to venture capital and other funds needed for women (and minorities) to pursue entrepreneurial dreams and turn those into financial success (Stoner, 2019; Beasley, 2020).
Thus, even as women now perform academically at higher levels and complete their college degrees at higher rates than men, the bump in women’s salaries and upward mobility has been slow in coming. In one study that used job applications with manipulated information on applicants’ grade point average, gender, and college major, women benefited from moderate achievement but not high achievement. In politics, the status quo is that people see men as “strong” but women who speak out or stand up for themselves and their constituents as “too
older working-age
aggressive” or even “nasty, very nasty.” In the study, high-achieving men were called back significantly more often than high-achieving women at a ratio of 2:1, and this figure reached 3:1 in the field of mathematics (Quadlin, 2018).
This penalty for high-achieving women is reflected in income data, particularly among those advanced in their careers. As shown in Figure 23, men in 2018 were earning $200 to nearly $300 more per week than women for full-time work in older working-age groups (U.S. Bureau of Labor Statistics, 2019). Trends are hopeful though. In younger cohorts, women earn about 90% of what men make—possibly reflecting a generational improvement driven by women’s recent and current higher educational achievements but also increased equity in pay in retail and service industries in which younger people often work— women in middle and older adulthood earn 75% to 80% of what men do.
Income differences between the genders are also driven by the preponderance of women in education and health services, fields that overall have lower salaries than positions in science, engineering, and technology where men currently
women earn about 90% of what men make in younger cohorts
predominate. Of the 157,500,000 employed Americans in 2019, 47% were women. Nearly half of employed American women are in the retail trade, educational services, and health services sectors (Figure 24). In education, women are more likely employed in elementary and secondary schools rather than colleges and universities where men are employed in greater numbers and salaries are higher. In health care, times are changing as women make up increasingly high percentages of professional schools whose graduates earn high salaries, but for now, women are disproportionately found in lower-paying positions (U.S. Bureau of Labor Statistics, 2020b).
Despite the lack of equity between the genders, the trends are toward women being paid more than in the past. The gap has closed over the past four decades, and earnings data for those without a 4-year college degree show that inflationadjusted income for men has fallen in all groups. Women are outpacing men in all educational categories (Figure 25) (U.S. Bureau of Labor Statistics, 2019).
47%
of the 157,500,000 employed Americans in 2019 were women.
In the United States, the provision of benefits such as paid leave and health insurance through a person’s job means that interruptions in employment and divorce often create coverage gaps, and these affect women more than men. The trends toward gray divorce and earlier retirements for women can leave them in an insurance gap until they qualify for Medicare at age 65, and as previously discussed in the section on race, gray divorce is especially detrimental for Black
Figure 23. Median Usual Weekly Earnings of Women and Men Who Are Full-Time Wage and Salary Workers, by Age, 2018 Annual Averages
Source: U.S. Bureau of Labor Statistics, 2020b.
Figure 25. Percentage Change in Inflation-Adjusted Median Usual Weekly Earnings of Women and Men, by Educational Attainment, 1979–2018
Less than a high school diploma
High school graduates, no college
Some college or associates degree
Bachelor’s degree and higher
Note: Data relate to earnings of full-time wage and salary workers age 25 and older.
and Hispanic women. Women who leave the workforce to take care of loved ones often do so during their peak earning years; if they try to find employment later, ageism-related discrimination limits their opportunities. Women live longer than men (Figure 19), yet a woman living alone at age 67 is more likely divorced than widowed. One-fifth of divorced and nevermarried women live in poverty (21%), substantially higher than the proportions of married (5%) and widowed (18%) women (Butrica & Iams, 2000).
With Social Security as the primary (and for many, the only) source of income in retirement, the gaps in employment during women’s working years reduces
these payments once the benefit is claimed. More women than men claim this benefit at age 62, when they first qualify, a choice that is especially detrimental for their Social Security payments since they have more years of expected life remaining (Johnson et al., 2013). For beneficiaries born in 1960 or later, monthly benefits are 30% lower if they claim them at age 62 rather than their normal retirement age of 67. Waiting until age 70 currently increases the monthly benefit by 8% per year of delay (Social Security Administration, 2008).
Stressors in life can affect anyone. Life in low-opportunity neighborhoods, lack of safe drinking water and adequate
Source: U.S. Bureau of Labor Statistics, 2019.
sanitation, insufficient income or wealth, systemic racism and other types of discrimination, poor educational systems, drug and alcohol abuse, lack of quality, affordable health care, and poverty, particularly in retirement, are problems common to people regardless of their demographic characteristics.
Moreover, women face an additional set of stressors across the life course. In their childbearing years, women face health risks associated with pregnancy and childbirth, breastfeed, and usually are the primary caregivers for young children. Women are more commonly caught than men in the “sandwich” when their parents and their children need care, and grandmothers are more often caregivers for grandchildren than are grandfathers. Women in lower-paying jobs are less likely to have paid
family and medical leave, and women disproportionately provide unpaid care to relatives and friends. Because women live longer than men on average, they are more likely to provide care to a spouse in declining health, deal with the isolation and loneliness of widowhood, and later to require institutionalized long-term care because they do not have family caregivers who can help. These years of added life also place women at increased risk of outliving retirement funds and needing to liquidate assets to afford care or qualify for Medicaid during their final years. Women also respond differently to the stressors of older adulthood and more often experience reduced emotional well-being, including depression and disability (Carr & Utz, 2020).
The National Academy of Social Insurance (NASI) is looking at models of universal family care at the state level that would address many of these gaps. Built around the existing models for Medicare and Medicaid, NASI issued an extensive report in 2019 that details social insurance approaches in California, Connecticut, the District of Columbia, Hawaii, Massachusetts, New Jersey, New York, Rhode Island, and Washington State. These could be adopted in a national approach to universal family care with core or expanded benefits funded through contributory (similar to Social Security) or comprehensive (near universal) designs (Veghte et al., 2019).


"LB1_9585.jpg" by LBJLibraryNow is marked under CC PDM 1.0. To view the terms, visit https://creativecommons.org/publicdomain/ mark/1.0/
“Sometimes small gestures can have unexpected consequences. Major initiatives practically guarantee them. In our time, few pieces of federal legislation rank in significance with the Civil Rights Act of 1964. There, in Title VII, Congress outlawed discrimination in the workplace on the basis of race, color, religion, sex, or national origin. Today, we must decide whether an employer can fire someone simply for being homosexual or transgender. The answer is clear. An employer who fires an individual for being homosexual or transgender fires that person for traits or actions it would not have questioned in members of a different sex. Sex plays a necessary and undisguisable role in the decision, exactly what Title VII forbids.”
U.S. Supreme Court Justice Neil Gorsuch, in Bostock v. Clayton County, No. 17-1618, Decided June 15, 2020
Given the diversity of people’s sexual behaviors and practices—and the increasing recognition of gender identity in addition to sexual orientations and experiences—it is impossible to generalize about the special Longevity Fitness challenges faced by the diverse group whose wide variety of sexual and gender identities are encompassed in the LGBTQ+ shorthand: lesbian, gay, bisexual, transgender, queer, and other sexual orientations and gender identities, including some that have not yet been recognized. Within each of these terms are many variations. Just as it is not useful to stereotype Whites, Blacks, Hispanics, or Asians, gay men can be young individuals whose orientations are emerging or older adults facing discrimination in nursing homes (Gold, 2018).
Despite the dangers in generalizing too much, some patterns and trends have emerged in the environmental, sociocultural, and behavioral aspects of life that can affect Longevity Fitness in the half century since the gay rights movement focused a research lens on people who had often lived in society’s shadows. Here are some top-line observations as they relate to Longevity Fitness.
Nearly 1 million same-sex households were counted by the U.S. Census Bureau in its 2017 estimates. Just over half (51.7%) were female–female partnerships nationally, but most large cities have more male–male households (Figure 26) (Taylor, 2019). The number of same-sex households has increased from 777,000 in 2005 to 995,420 in 2018. The percentage
of these households reporting same-sex married partners is increasing, a reflection of the rapid legal recognition of gay marriage during this time period (U.S. Census Bureau, 2019).
4.5%
of the U.S. population are lesbian, gay, bisexual, or transgender
Data compiled by the Williams Institute at the University of California at Los Angeles School of Law indicate that 4.5% of the U.S. population are lesbian, gay, bisexual, or transgender. In this group, 58% are female, 25% have incomes of less than $24,000 annually, and 29% have children. Compared with non-LGBTQ+ individuals, LGBTQ+ people are more likely to be unemployed, uninsured, or food insecure (Williams Institute at UCLA School of Law, 2019).
Compared with opposite-sex couples, same-sex couples are more likely to have higher incomes, have both people
employed, and be more educated. The income differential is stronger for male–male couples, given the higher incomes of men, than for female–female couples. Same-sex couples are more likely to be interracial. They are less likely to have children living with them. Fewer children means lower expenses and more disposable income for most of life but also a lack of caregivers if disability or aging creates functional deficits. Compared with opposite-sex married couples, same-sex married couples tend to be younger and less likely to own their home. Same-sex unmarried partners tend to be older and more likely to own their home, compared with opposite-sex unmarried partners (Taylor, 2019).
Where people with minority sexual orientations and gender identities live affects their lives in a number of ways. Discrimination is widespread, and sexual orientation and identity produce strong responses among many in the majority. This may explain the tendency for gay men, lesbians, and transgendered individuals to live in urban areas and in specific neighborhoods in those regions. This, however, does not necessarily eliminate mistreatment; in fact, those intending to inflict harm on these minorities may come to these areas expressly to find targets (Lee et al., 2018). Yet many gay men, lesbians, and other sexual minorities live in rural areas and small towns, where their economic and housing options may be constrained, and their health, social, and support resources are often limited and discrimination is common (Movement Advancement Project, 2019; Stone, 2018).
Female couple households Male couple households
San Francisco, CA
Washington, DC
Portland, OR
Seattle, WA
Denver, CO
Boston, MA
Phoenix, AZ
Columbus, OH
San Diego, CA Austin, TX
Indianapolis, IN Chicago, IL
Los Angeles, CA Dallas, TX
New York, NY
San Antonio, TX
Philadelphia, PA
Houston, TX
The unique health needs of LGBTQ+ individuals present challenges for many health professionals. Outside neighborhoods with high concentrations of gay men and lesbian residents, physicians and other primary care providers often have a small number of LGBTQ+ patients, limiting their ability to care for young people as their orientations and identities emerge (Halkitis et al., 2020; Whitlock et al., 2019); knowledge about the health effects of sexual practices and risks for human immunodeficiency virus (HIV) infection (Ackerley et al., 2019), high rates of tobacco and alcohol
use in sexual minorities (Matthews et al., 2018; Madhombiro et al., 2019), the use of chemical stimulants during sex (Maxwell et al., 2019), and management of hormonal treatments in transgendered individuals undergoing reassignment therapy (Lapinski et al., 2018) add to the complexities of patient care.
Sexual Orientation and Discrimination: The Sociocultural Domain
Life for LGBTQ+ individuals is complicated by a number of factors:
whether they have “come out” in their personal or professional life, rejection by family and friends, availability of a supportive social network, local and state laws where they live and travel, discrimination in community and workplace, and the adequacy and availability of health care services for both the mind and the body.
The unique journey leading people to realize that their sexual and gender identity is in a minority category is associated with increased risk for mental health conditions, particularly depression
and anxiety disorders, according to the National Alliance on Mental Illness (NAMI). Compared with heterosexual adults, LGBTQ+ people have twice the rate of mental health conditions, and transgender individuals are 4 times as likely to have a mental health condition as are those who are cisgender (National Alliance on Mental Illness, 2020).
NAMI lists these aspects of mental health as pertaining in unique ways to the LGBTQ+ community (National Alliance on Mental Illness, 2020):
• Rejection: The process of and reaction to “coming out” is stressful and risky for LGBTQ+ people. As many as 40% experience rejection by friends and family, youth are harassed physically and verbally at schools, and individuals may experience stigma, bias, or absolute rejection by faith communities and in the workplace.
• Trauma: LGBTQ+ individuals are among the most targeted groups with traumatizing discrimination, shaming, and outright violence. When individuals also are in racial or ethnic minorities, the abuse can be even worse. The lifelong impact of this type of discrimination leads to a greater risk of posttraumatic stress disorder among LGBTQ+ people compared with heterosexual and cisgender individuals.
• Substance use: Whether used for coping or self-medication, alcohol and drug abuse is more common by a factor of 2-fold in individuals who identify as LGB and 4-fold in transgender groups than among other heterosexual and cisgender adults.
• Homelessness: An especially pervasive problem among LGBTQ+ people is homelessness, and the risk is further elevated for Black youth. Family rejection can lead to youth
being kicked out the family home, and discrimination in housing and employment can prevent LGBTQ+ people from finding and affording suitable homes.
• Suicide: Across the lifespan, suicide is a greater risk of LGBTQ+ people than those who are heterosexual and cisgender. In high school, a 5-fold increase in suicidal thoughts and attempts has been documented among gay men, lesbians, and bisexual people, and the lifetime risk of attempted suicide is 40% for transgender people, compared with 5% for cisgender people.
• Inadequate mental health care: Because of these separate and overlapping mental health challenges, the LGBTQ+ community needs care that is often not available. Even when mental health services are ostensibly available, LGBTQ+ people may encounter hostility, rejection, or discrimination when they seek care because of provider bias, or they may not be able to afford the costs of care.
In the workplace, laws in most states as well as federal statutes and regulations that protect the rights of LGBTQ+ people have now been supplemented by the protections recognized in the Bostock v. Clayton County decision handed down by the U.S. Supreme Court in June 2020. Employers and unions should be sure that employee health insurance plans cover different health care coverage needs of these employees, including gender transition–related care and HIV prevention and treatment (Pride at Work, n.d.).
As with systemic racism and misogyny, being an “other” with respect to sexual
orientations and gender identities in the United States is associated with elevated levels of stress and anxiety resulting from unconscious bias and outright discrimination and harassment. To cope with minority stress, LGBTQ+ individuals can draw on innate mechanisms of resilience and healthy practices such as mindfulness, yoga, and exercise. When available, social and support groups can help individuals make it through trying times. However, others turn to selfmedicating with alcohol or drugs of abuse, putting them on a path toward health problems and possibly legal problems and associated outcomes (Meyer, 2003).
Differences in sexual practices also expose LGBTQ+ individuals to potential harm, exploitation, and legal risks. These vary widely, given the inherent differences in ways of sexual expression in this group; they include exposure to pathogens during sex, increased numbers of sex partners, engaging in voluntary or exploitive sex work, and sex trafficking of LGBTQ+ individuals, including abuse of individuals younger than 18 years of age (Dank et al., 2015; Centers for Disease Control and Prevention, 2014; Martinez & Kelle, 2013).
Mental health care of LGBTQ+ people should consider these special risks. Providers can address these concerns (National Alliance on Mental Illness, 2020):
• Challenges involved in coming out and living as LGBTQ+.
• Lack of family, community, and workplace support.
• Implicit and explicit bias and stereotyping.
Health care providers should also ask for patients’ pronouns during the first visit, use gender-inclusive language, display a nondiscrimination policy prominently, and offer local resources and informational material (National Alliance on Mental Illness, 2020).

https://www.nasi.org/currentacademy-interns.
“Life is wonderfully and frighteningly unpredictable. No matter how much we plan for our future, nothing protects us from experiencing things that are out of our control.... We cannot protect ourselves from uncontrollable aspects of living, but we can prepare for the consequences.”
Naomi Shin, 2020 Rashi Fein Intern on Health Policy, Medicaid and CHIP Payment and Access Commission, and student at Carnegie Mellon University
Billions of dollars have been invested in diversity and inclusion programs in workplaces in an effort to improve opportunities for employees at all levels of corporations and organizations. By making the world a more stable, predictable place, remarkable advances in Longevity Fitness have been achieved over the past century. Now, with a pandemic threatening health and other institutions around the world, people must bring a new talent to the table—their ability to react to challenges when the predictable becomes uncertain.
To make real progress in empowering all people to thrive, not just survive, across the life span in the social, health, and wealth aspects of Longevity Fitness, deep cultural shifts are needed in the place, race, gender, and sexual orientation/identity aspects of life. Real opportunities must be created and seized. The inherent biases in the ways people look at one another and treat each other must be addressed. Finding solutions to these challenges will require efforts by all people, working together in solidarity and with open minds when considering the best solutions. A difficult task for sure, but a necessary one to achieve genuine diversity and inclusion in a nation and a world where a diverse population can contribute many different talents, if the people can find ways of truly working together.
Companies can be diverse without achieving inclusiveness. In a work-from-home world that is likely to stay that way for many companies after the pandemic, neither diversity nor inclusion means much without a level playing field in terms of where a person lives and what opportunities that person is afforded within the organization.
Leaders who take inclusivity to heart are essential for companies looking to make meaningful progress. Six behaviors exhibited by such leaders have been identified at the Center for Talent Innovation: ensuring that team members speak up and are heard; creating an environment where novel ideas can be proposed safely; empowering team members to make decisions; taking advice and implementing feedback; giving actionable feedback; and sharing credit for team success. Combined with authenticity, networking and visibility, and clear career paths for all employees, inclusive leaders “can elicit real change,” Sherbin and Rashid wrote in a 2017 article in the Harvard Business Review. “Diversity without inclusion is a story of missed opportunities, of employees so used to being overlooked that they no longer share ideas and insights. But diversity with inclusion provides a potent mix of talent retention and engagement.”
In a 2020 Harvard Business Review article, Pedulla describes five simple, evidenced-based ideas for increasing diversity, equity, and inclusion in the workplace:
1. Collect, count, and compare data on diversity over time.
2. Deploy alternative complaint systems to address the problem of retaliation when employees file discrimination and harassment complaints.
3. Test for biased technology in the hiring process and evaluation systems.
4. Beware of ignoring groups of employees who are seriously underrepresented in the organization, including racial minorities and women.
5. Involve managers from the start in an effort to address a company’s unique internal logics, culture, and dynamics.
Sources: Pedulla, 2020; Sherbin & Rashid, 2017.
AARP Public Policy Institute & National Alliance for Caregiving. (2015). Caregiving in the U.S. 2015 report. Retrieved from https://www.aarp.org/content/dam/aarp/ ppi/2015/caregiving-in-the-united-states2015-report-revised.pdf
Abou-Sabe, K., Romo, C., McFadden, C., & Abdel-Baqui, O. (2020, June 8). A tale of two ZIP codes: COVID-19 exposes deep disparities in U.S. schools. NBC News. Retrieved from https:// www.nbcnews.com/news/us-news/taletwo-zip-codes-covid-19-exposes-deepdisparities-u-n1227646
Ackerley, C. G., Poteat, T., & Kelley, C. F. (2019). Human immunodeficiency virus in transgender persons. Endocrinology and Metabolism Clinics of North America, 48(2), 453–464. doi: 10.1016/j.ecl. 2019.02.007
Advancing Justice–LA. (2019, May 10). 150 years later and the forgotten history of the transcontinental railroad. Medium. Retrieved from https://medium.com/@ AAAJ_LA/150-years-later-and-theforgotten-history-of-the-transcontinentalrailroad-ca294151cdcc
African American Network Against Alzheimer’s. (n.d.). Key findings and policy recommendations: The costs of Alzheimer’s and other dementia for African Americans. Retrieved from https://www. usagainstalzheimers.org/sites/default/ files/2018-03/Costs_of_Alzheimers_ for_African_Americans_Report.pdf
Agarwal, S. D., & Sommers, B. D. (2020). Insurance coverage after job loss—the importance of the ACA during the COVID-associated recession. New England Journal of Medicine, [Epub ahead of print]. doi: 10.1056/NEJMp2023312
Age Wave & Merrill Lynch. (2017). The journey of caregiving: Honor, responsibility and financial complexity. Retrieved from https://www.ml.com/financialgoals-and-priorities/caregiver-benefitschallenges.html
Ajilore, O., & Willingham, Z. (2019). Redefining rural America. Center for American Progress. Retrieved from https://www. americanprogress.org/issues/economy/ reports/2019/07/17/471877/redefiningrural-america/
Allard, S. W. (2017). Places in need: The changing geography of poverty. New York, NY: Russell Sage Foundation.
Alzheimer’s Association. (2019). 2019 Alzheimer’s disease facts and figures. Alzheimers & Dementia, 15(3), 321–387. doi: 10.1016/j.jalz.2019.01.010
Alzheimer’s Association. (2020). 2020 Alzheimer’s disease facts and figures. Retrieved from https://www.alz.org/ media/Documents/alzheimers-facts-andfigures.pdf
American Academy of Pediatrics. (2014). Adverse childhood experiences and the lifelong consequences of trauma. Retrieved from https://www.aap.org/en-us/ Documents/ttb_aces_consequences.pdf
American Addiction Centers. (2019). Figures on alcohol use and the Black community. Retrieved from https://www. alcohol.org/alcoholism-and-race/black/
Anderson, D. (2020, June 29). Minneapolis, Milwaukee & Salt Lake City have the lowest Black homeownership rates in the U.S., with just one-quarter of Black families owning their home. Retrieved from https://www.redfin.com/ blog/black-homeownership-rate-acrossunited-states
Arias, E., & Xu, J. (2019). United States life tables, 2017. National Vital Statistics Reports, 68(7), 1–65. Retrieved from https://www.cdc.gov/nchs/data/nvsr/ nvsr68/nvsr68_07-508.pdf
Ariel Education Initiative & Aon Hewitt. (2012, April 3). 401(k) plans in living color: A study of 401(k) savings disparities across racial and ethnic groups. Retrieved from https://www. arielinvestments.com/401k-Study-2012/
Assistant Secretary for Planning and Evaluation, U.S. Department of Health and Human Services. (2020). HHS poverty guidelines for 2020. Retrieved from https://aspe.hhs.gov/poverty-guidelines
Bauer, L. (2020, May 6). The COVID-19 crisis has already left too many children hungry in America. Brookings Institution. Retrieved from https://www.brookings. edu/blog/up-front/2020/05/06/thecovid-19-crisis-has-already-left-too-manychildren-hungry-in-america/
Beasley, K. (2020, August 9). Black entrepreneurs can tap new markets—but only with VC backing. Venture Beat. Retrieved from https://venturebeat. com/2020/08/09/black-entrepreneurscan-tap-new-markets-but-only-with-vcbacking/
Bertocchi, G. (2016). The legacies of slavery in and out of Africa. IZA Journal of Development and Migration. 5(1), 24. doi: 10.1186/s40176-016-0072-0
Board of Governors of the Federal Reserve System. (2020, June 19). Enhanced financial accounts. Retrieved from https:// www.federalreserve.gov/releases/efa/ enhanced-financial-accounts.htm
Bostock v. Clayton County. (2020, June 15). No. 17-1618. Retrieved from https://www.supremecourt.gov/ opinions/19pdf/17-1618_hfci.pdf
Butrica, B., & Karamcheva, N. (2014). The impact of informal caregiving on older adults’ labor supply and economic resources. Washington, DC: Urban Institute. Retrieved from https://www.dol.gov/ sites/dolgov/files/ebsa/researchers/ analysis/retirement/the-impact-ofinformal-caregiving-on-older-adultslabor-supply-and-economic-resources.pdf
Butrica, B. A., & Iams, H. M. (2000). Divorced women at retirement: Projections of economic well-being in the near future. Social Security Bulletin , 63 (3), 3–12.
Butrica, B. A., & Smith, K. E. (2012). Racial and ethnic differences in the retirement prospects of divorced women in the Baby Boom and Generation X cohorts. Social Security Bulletin, 72 (1), 23–36.
Carr, D., & Utz, R. L. (2020). Families in later life: A decade in review. Journal of Marriage and Family, 82(1), 346–363. doi: 10.1111/jomf.12609
Centers for Disease Control and Prevention. (2014, March 24). Lesbian, gay, bisexual, and transgender health: About LGBT health. Retrieved from https://www.cdc. gov/lgbthealth/about.htm
Centers for Disease Control and Prevention, National Center for Chronic Disease Prevention and Health Promotion, Division of Nutrition, Physical Activity, and Obesity. (2020, July 8). Data, trends and maps. Retrieved from https://www.cdc.gov/nccdphp/dnpao/ data-trends-maps/index.html
Centers for Disease Control and Prevention, National Center for Health Statistics. (2017). Table 15. Life expectancy at birth, at age 65, and at age 75, by sex, race, and Hispanic origin: United States, selected years 1900–2016. Retrieved from https://www.cdc.gov/ nchs/data/hus/2017/015.pdf
Chetty, R., Hendren, N., Kline, P., & Saez, E. (2014). Where is the land of opportunity? The geography of intergenerational mobility in the United States. National Bureau of Economic Research, Working Paper 19843. Retrieved from http://www.nber.org/ papers/w19843
Chetty, R., Stepner, M., Abraham, S., Lin, S., Scuderi, B., Turner, N., … Cutler, D. (2016). The association between income and life expectancy in the United States, 2001–2014. JAMA, 315(16), 1750–1766.
Choi, J. H., McCargo, A., Neal, M., Goodman, L., & Young, C. (2019). Explaining the Black–White homeownership gap: A closer look at disparities across local markets. Urban Institute. Retrieved from https:// www.urban.org/sites/default/files/ publication/101160/explaining_the_ black-white_homeownership_gap_2.pdf
Cohn, D., & Passel, J. S. (2018, April 5). A record 64 million Americans live in multigenerational households. Pew Research Center. Retrieved from https://www.pewresearch.org/facttank/2018/04/05/a-record-64-millionamericans-live-in-multigenerationalhouseholds
Couch, K. A., Fairlie, R. W., & Xu, H. (2020). The impacts of COVID-19 on minority unemployment: First evidence from April 2020 CPS microdata. Center for Economic Studies and Ifo Institute, Working Paper No. 8327. Retrieved from https://www.econstor.eu/ bitstream/10419/219145/1/cesifo1_ wp8327.pdf
CNBC. (2020, October 8). Full interview with IBM CEO Arvind Krishna and Executive Chair Ginni Rometty. Squawk on the Street. Retrieved from https:// www.cnbc.com/video/2020/10/08/fullinterview-with-ibm-ceo-arvind-krishnaand-executive-chair-ginni-rometty.html
Dank, M., Yahner, J., Madden, K., Banuelos, I., Yu, L., Ritchie, A., … Conner, B. (2015). Surviving the streets of New York: Experiences of LGBTQ youth, YMSM, and YWSW engaged in survival sex. Urban Institute. Retrieved from https:// www.urban.org/sites/default/files/ publication/42186/2000119-Survivingthe-Streets-of-New-York.pdf
Dettling, L. J., Hsu, J. W., Jacobs, L., Moore, K. B., & Thomas, J. P. (2017, September 27). Recent trends in wealth-holding by race and ethnicity: Evidence from the Survey of Consumer Finances. Retrieved from https://www.federalreserve.gov/ econres/notes/feds-notes/recent-trendsin-wealth-holding-by-race-and-ethnicityevidence-from-the-survey-of-consumerfinances-20170927.htm
Dickerson, A. E., Molnar, L. J., Bédard, M., Eby, D. W., Berg-Weger, M., Choi, M., … Silverstein, N. M. (2017). Transportation and aging: An updated research agenda to advance safe mobility among older adults transitioning from driving to non-driving. The Gerontologist, 59(2), 215–221. doi: 10.1093/geront/gnx120
Dominguez, K., Penman-Aguilar, A., Chang, M.-H., Moonesinghe, R., Castellanos, T., Rodriguez-Lainz, A., …Centers for Disease Control and Prevention. (2015). Vital signs: Leading causes of death, prevalence of diseases and risk factors, and use of health services among Hispanics in the United States—2009–2013. Morbidity and Mortality Weekly Report, 64(17), 469–478.
Donner, F. (2020, February 12). The household work men and women do, and why. The New York Times. Retrieved from https://www.nytimes.com/2020/02/12/ us/the-household-work-men-andwomen-do-and-why.html
Families USA/National Center for Coverage Innovation. (2017, July 17).
The COVID-19 pandemic and resulting economic crash have caused the greatest health insurance losses in American history. Retrieved from https:// www.familiesusa.org/wp-content/ uploads/2020/07/COV-254_CoverageLoss_Report_7-17-20.pdf
Feagin, J., & Bennefield, Z. (2014). Systemic racism and U.S. health care. Social Science & Medicine, 103(1), 7–14. doi: 10.1016/j.socscimed.2013.09.006
Federal Reserve System. (2020). Survey of Consumer Finances and Financial Accounts of the United States. Retrieved from https://www.federalreserve.gov/ releases/z1/dataviz/dfa/index.html
Fisher, A. D. (1987). Alcoholism and race: The misapplication of both concepts to North American Indians. Canadian Review of Sociology and Anthropology, 24(1), 81–98. doi: 10.1111/j.1755-618X.1987. tb01072.x
Garreau, J. (1981). The nine nations of North America. Boston, MA: Houghton Mifflin.
Gerontological Society of America. (2018). Longevity economics: Leveraging the advantages of an aging society. Retrieved from https://www.geron.org/ images/gsa/documents/gsa-longevityeconomics-2018.pdf
Gerontological Society of America. (2019). Longevity fitness: Financial and health dimensions across the life course. Retrieved from https://www.geron. org/images/gsa/documents/GSA_ Longevity_Fitness.pdf
Gold, M. (June 21, 2018). The ABCs of L.G.B.T.Q.I.A.+. The New York Times. Retrieved from https://www.nytimes. com/2018/06/21/style/lgbtq-genderlanguage.html
Greenwood, B. N., Hardeman, R. R., Huang, L., & Sojourner, A. (2020). Physician–patient racial concordance and disparities in birthing mortality for newborns. Proceedings of the National Academy of Sciences, 117(35), 21194–21200. doi: 10.1073/pnas.1913405117
Gurland, B. J., Wilder, D. E., Lantigua, R., Stern, Y., Chen, J., Killeffer, E. H., & Mayeux, R. (1999). Rates of dementia in three ethnoracial groups. International Journal of Geriatric Psychiatry, 14(6), 481–493.
Haan, M. N., Mungas, D. M., Gonzalez, H. M., Ortiz, T. A., Acharya, A., & Jagust, W. J. (2003). Prevalence of dementia in older Latinos: The influence of type 2 diabetes mellitus, stroke and genetic factors. Journal of the American Geriatrics Society, 51(2), 169–177. doi:10.1046/j. 1532-5415.2003.51054.x
Hales, C. M., Carroll, M. D., Fryar, C. D., & Ogden, C. L. (2017). Prevalence of obesity among adults and youth: United States, 2015–2016. NCHS Data Brief, No. 288. Hyattsville, MD: National Center for Health Statistics. Retrieved from https:// www.cdc.gov/nchs/data/databriefs/ db288.pdf
Halkitis, P. N., Maiolatesi, A. J., & Krause, K. D. (2020). The health challenges of emerging adult gay men: Effecting change in health care. Pediatric Clinics of North America, 67(2), 293–308. doi: 10.1016/j. pcl.2019.12.003
Hanchate, A. D., Dyer, K. S., PaascheOrlow, M. K., Banerjee, S., Baker, W. E., Lin, M., … Feldman, J. (2019). Disparities in emergency department visits among collocated racial/ethnic Medicare enrollees. Annals of Emergency Medicine, 73(3), 225–235. doi: 10.1016/j. annemergmed.2018.09.007
Hardman, R. R., Medina, E. M., & Kozhimannil, K. B. (2016). Structural racism and supporting Black lives—the role of health professionals. New England Journal of Medicine, 375(22), 2113–2115. doi: 10.1056/NEJMp1609535
Harrington, M. (1962). The other America: Poverty in the United States. New York, NY: Simon & Schuster.
Health Inequality Project. (n.d.). How can we reduce disparities in health? Retrieved from https://healthinequality.org
Hill, C. V., Pérez-Stable, E. J., Anderson, N. A., & Bernard, M. A. (2015.) The National Institute on Aging health disparities research framework. Ethnicity & Disease, 25(3), 245–254. doi: 10.18865/ed.25.3.245
Ho, J. Y., & Hendi, A. S. (2018). Recent trends in life expectancy across high income countries: Retrospective observational study. BMJ, 362, k2562. doi: 10.1136/bmj.k2562
Johnson, R. W., Smith, K. E., & Haaga, O. (2013). How did the great recession affect Social Security claiming? Washington, DC: Urban Institute. Retrieved from https://www.urban.org/research/ publication/how-did-great-recessionaffect-social-security-claiming
Joint Center for Housing Studies of Harvard University. (2015). Who can afford the median-priced home in their metro? Retrieved from https://www. jchs.harvard.edu/son2017-housingaffordability-table
Joint Center for Housing Studies of Harvard University. (2020.) America’s rental housing 2020. Retrieved from https://www.jchs.harvard.edu/americasrental-housing-2020
Joint Economic Committee, U.S. Congress. (2019). Retirement insecurity. Retrieved from https://www.jec.senate. gov/public/_cache/files/bafb9923-7f9a40ad-b287-4722b8b979cd/retirementinsecurity-jec.pdf
Joslin Diabetes Center Asian American Diabetes Initiative. (n.d.). What is body mass index? Retrieved from https://aadi. joslin.org/en/am-i-at-risk/asian-bmicalculator
Kim, C., & Sakamoto, A. (2010). Have Asian American men achieved labor market parity with White men? American Sociological Review, 75(6), 934–957. doi: 10.1177/0003122410388501
Kim, C., & Sakamoto, A. (2014). The earnings of less educated Asian American men: Educational selectivity and the model minority image. Social Problems, 61(2), 283–304. doi: 10.1525/ sp.2014.12029
King, M. L., Jr. (n.d.) Martin Luther King Jr. saw three evils in the world. The Atlantic. Retrieved from https:// www.theatlantic.com/magazine/ archive/2018/02/martin-luther-kinghungry-club-forum/552533/
Kochhar, R., & Cilluffo, A. (2018, July 12). Key findings on the rise in income inequality within America’s racial and ethnic groups. Pew Research Center. Retrieved from https://www.pewresearch. org/fact-tank/2018/07/12/key-findingson-the-rise-in-income-inequality-withinamericas-racial-and-ethnic-groups/
Koppisch, J. (2011, December 11). Why are Indian reservations so poor? A look at the bottom 1%. Forbes. Retrieved from https://www.forbes.com/sites/ johnkoppisch/2011/12/13/why-areindian-reservations-so-poor-a-look-at-thebottom-1/#62213cae3c07
Krafft, C. (2019). The economics of poverty. In Economics for the greater good: An introduction to economic thinking for public policy (chapter 5). Minnesota Libraries Publishing Project. Retrieved from https://mlpp.pressbooks.pub/ economicsforthegreatergood/chapter/ the-economics-of-poverty/
Lapinski, J., Covas, T., Perkins, J. M., Russell, K., Adkins, D., Coffigny, M. C., & Hull, S. (2018). Best practices in transgender health: A clinician’s guide. Primary Care, 45(4), 687–703. doi: 10.1016/j.pop.2018.07.007
Lee, J. G. L., Wimark, T., Ortiz, K. S., & Sewell, K. B. (2018). Health-related regional and neighborhood correlates of sexual minority concentration: A systematic review. PLoS One, 13(6), e0198751. doi: 10.1371/journal. pone.0198751
Leger, M. (2019, October 9). Mapping the modern-day impact of early 20th century housing discrimination. Ash Center of the Harvard Kennedy School. Retrieved from https://datasmart.ash. harvard.edu/news/article/mappingmodern-day-impact-early-20th-centuryhousing-discrimination
Lin, I.-F. (2008). Consequences of parental divorce for adult children’s support of their frail parents. Journal of Marriage and Family, 70(1), 113–128. doi: 10.1111/j.1741-3737.2007.00465.x
Linnan, L. A., Cluff, L., Lang, J. E., Penne, M., & Leff, M. S. (2019). Results of the Workplace Health in America Survey. American Journal of Health Promotion, 33(5), 652–665. doi: 10.1177/0890117119842047
Locke, California. (n.d.). More Locke history. Retrieved from https://www. locketown.com/more_history.htm
Madhombiro, M., Musekiwa, A., January, J., Chingono, A., Abas, M., & Seedat, S. (2019). Psychological interventions for alcohol use disorders in people living with HIV/AIDS: a systematic review. Systematic Reviews, 8(1), 244. doi: 10.1186/s13643-019-1176-4
Madrian, B. C., & Shea, D. F. (2001). The power of suggestion: Inertia in 401(k) participation and savings behavior. The Quarterly Journal of Economics, 116(4), 1149–1187. doi: 10.1162/003355301753265543
Martinez, O., & Kelle, G. (2013). Sex trafficking of LGBT individuals: A call for service provision, research, and action. International Law News, 42(4): sex_ trafficking_lgbt_individuals
Matthews, A. K., McCabe, S. E., Lee, J. G. L., & Veliz, P. (2018). Differences in smoking prevalence and eligibility for low-dose computed tomography (LDCT) lung cancer screening among older U.S. adults: Role of sexual orientation. Cancer Causes and Control, 29(8), 769–774. doi: 10.1007/s10552-018-1044-x
Mattke, S., Liu, H., Caloyeras, J. P., Huang, C. Y., Van Busum, K. R., Khodyakov, D., & Shier, V. (2013). Workplace Wellness Programs Study: Final report. Retrieved from https://www.rand.org/content/ dam/rand/pubs/research_reports/ RR200/RR254/RAND_RR254.pdf
Maxwell, S., Shahmanesh, M., Gafos, M. (2019). Chemsex behaviours among men who have sex with men: A systematic review of the literature. International Journal of Drug Policy, 63(1), 74–89. doi: 10.1016/j.drugpo.2018.11.014
McIntosh, K., Moss, E., Nunn, R., & Shambaugh, J. (2020, February 27). Examining the Black–White wealth gap. Brookings Institution. Retrieved from https://www.brookings.edu/blog/upfront/2020/02/27/examining-the-blackwhite-wealth-gap/
Medina, L., Sabo, S., & Vespa, J. (2020). Living longer: Historical and projected life expectancy in the United States, 1960 to 2060. Current Population Reports, P25-1145. U.S. Census Bureau. Retrieved from https://www.census.gov/content/ dam/Census/library/publications/2020/ demo/p25-1145.pdf
Meyer, I. H. (2003). Prejudice, social stress, and mental health in lesbian, gay, and bisexual populations: Conceptual issues and research evidence. Psychological Bulletin, 129(5), 674–697. doi: 10.1037/0033-2909.129.5.674
Morgado, D. (2018, April 6). A history of Locke: The oldest rural Chinatown in the US. Culture Trip. Retrieved from https:// theculturetrip.com/north-america/usa/ california/articles/a-history-of-locke-theoldest-rural-chinatown-in-the-us
Movement Advancement Project. (2019, April). Where we call home: LGBT people in rural America. Retrieved from http://www.lgbtmap.org/rural-lgbt
Muennig, P., Reynolds, M., Fink, D., Zafari, Z., & Geronimus, A. (2018). America’s declining well-being, health, and life expectancy: Not just a White problem. American Journal of Public Health, 108(12), 1626–1631. doi: 10.2105/AJPH.2018.304585
National Alliance for Caregiving & Alzheimer’s Association. (2017). Dementia caregiving in the U.S. Retrieved from https://www.caregiving.org/wpcontent/uploads/2020/05/DementiaCaregiving-in-the-US_February-2017.pdf
National Alliance on Mental Illness. (2020). LGBTQI. Retrieved from https://www.nami.org/Your-Journey/ Identity-and-Cultural-Dimensions/ LGBTQI
Pedulla, D. (2020, May 12). Diversity and inclusion efforts that really work. Harvard Business Review. Retrieved from https:// hbr.org/2020/05/diversity-and-inclusionefforts-that-really-work
Peterson, E. E., Davis, N. L., Goodman, D., Cox, S., Syverson, C., Seed, K., … Barfield, W. (2019). Racial/ethnic disparities in pregnancy-related deaths— United States, 2007–2016. Morbidity and Mortality Weekly Report, 68(35), 762–765. doi: 10.15585/mmwr.mm6835a3
Pride at Work. (n.d.). Workplace discrimination. Retrieved from https:// www.prideatwork.org/issues/workplacediscrimination/
P-TECH. (n.d.). Learn about P-TECH’s history. Retrieved from https://www. ptech.org/about/history/
Quadlin, N. (2018). The mark of woman’s record: Gender and academic performance in hiring. American Sociological Review, 83(2), 331–360. doi: 10.1177/0003122418762291
Rao, A. H. (2019, May 12). Even breadwinning wives don’t get equality at home. The Atlantic. Retrieved from https://www.theatlantic.com/family/ archive/2019/05/breadwinning-wivesgender-inequality/589237/
Redfin. (2020). Home prices, sales & inventory. Retrieved from https://www. redfin.com/blog/data-center/
Salihu, H. M., Salinas-Miranda, A. A., King, L. M., Dongarwar, D., Yusuf, K. K., Ibrahimi, S., … Berry, E. L. (2020). Racism, psycho-social stress, and healthrelated quality of life. International Journal of MCH and AIDS, 9(1), 73–76. doi: 10.21106/ijma.339
Semega, J., Kollar, M., Creamer, J., & Mohanty, A. (2019). Income and poverty in the United States: 2018. Retrieved from https://www.census.gov/library/ publications/2019/demo/p60-266.html
Sharpton, A. (2020, June 4). Reverend Al Sharpton eulogy transcript at George Floyd’s memorial services. Rev website. Retrieved from https://www.rev.com/ blog/transcripts/reverend-al-sharptoneulogy-transcript-at-george-floydmemorial-service
Sherbin, L., & Rashid, R. (2017, February 1). Diversity doesn’t stick without inclusion. Harvard Business Review. Retrieved from https://hbr.org/2017/02/ diversity-doesnt-stick-without-inclusion
Social Security Administration. (2008, November 25). Social Security benefits: Early or late retirement? Retrieved from https://www.ssa.gov/oact/quickcalc/ early_late.html
Society for Human Resource Management. (2019). Designing and managing wellness programs. Retrieved from https://www.shrm.org/ resourcesandtools/tools-and-samples/ toolkits/pages/designingandmanaging wellnessprograms.aspx
Steenland, K., Goldstein, F. C., Levey, A., Wharton, W. (2015). A meta- analysis of Alzheimer’s disease incidence and prevalence comparing African-Americans and Caucasians. Journal of Alzheimers Disease, 50(1), 71–76. doi: 10.3233/ JAD-150778
Stone, A. L. (2018). The geography of research on LGBTQ life: Why sociologists should study the South, rural queers, and ordinary cities. Sociology Compass, 12(11), e12638. doi: 10.1111/soc4.12638
Stoner, K. (2019, July 3). How we can beat venture capital’s diversity problem. Entrepreneur. Retrieved from https:// www.entrepreneur.com/article/336143
Taylor, D. (2019, September 18). Male couples make up majority of same-sex households in large cities but not nationwide. U.S. Census Bureau. Retrieved from https://www.census.gov/ library/stories/2019/09/where-samesex-couples-live.html
Tenforde, M. W., Rose, E. B., Lindsell, C. J., Shapiro, N. I., Files, D. C., Gibbs, K. W., … CDC COVID-19 Response Team. (2020). Characteristics of adult outpatients and inpatients with COVID-19—11 academic medical centers, United States, March–May 2020. Morbidity and Mortality Weekly Report, 69(26), 841–846. doi: 10.15585/mmwr. mm6926e3
Trust for America’s Health. (2019). The state of obesity: 2019. Retrieved from https://www.tfah.org/report-details/ stateofobesity2019
Umberson, D. (1992). Gender, marital status and the social control of health behavior. Social Science & Medicine, 34(8), 907–917. doi: 10.1016/02779536(92)90259-s
U.S. Bureau of Labor Statistics. (2019, November). Highlights of women’s earnings in 2018. Retrieved from https:// www.bls.gov/opub/reports/womensearnings/2018/home.htm
U.S. Bureau of Labor Statistics. (2020a, September 4). Labor force statistics from the current population survey. Retrieved from https://www.bls.gov/web/empsit/ cpseea10.htm
U.S. Bureau of Labor Statistics. (2020b, January 22). Labor force statistics from the current population survey, household data, annual averages, employed persons by detailed industry, sex, race, and Hispanic or Latino ethnicity. Retrieved from https:// www.bls.gov/cps/cpsaat18.htm
U.S. Census Bureau. (2019, November 25). Characteristics of same-sex couple households: 2005 to present. Retrieved from https://www.census.gov/content/ census/en/data/tables/time-series/ demo/same-sex-couples/ssc-housecharacteristics.html
U.S. Census Bureau. (2020). Quarterly residential vacancies and homeownership, first quarter 2020. Release No. CB20-58. Retrieved from https://www.census.gov/ housing/hvs/files/currenthvspress.pdf
U.S. Department of Health and Human Services Office of Minority Health. (2018, March 28). Profile: American Indian/ Alaska Native. Retrieved from https:// minorityhealth.hhs.gov/omh/browse. aspx?lvl=3&lvlid=62
Vaeth, P. A. C., Wang-Schweig, M., Caetano, R. (2017). Drinking, alcohol use disorder, and treatment access and utilization among U.S. racial/ ethnic groups. Alcoholism, Clinical and Experimental Research, 41(1), 6–19. doi: 10.1111/acer.13285
Veghte, B. W., Bradley, A. L., Cohen, M., & Hartmann, H. (Eds.). (2019). Designing universal family care: State-based social insurance programs for early child care and education, paid family and medical leave, and long-term services and supports. Washington, DC: National Academy of Social Insurance.
Waltenburg, M. A., Victoroff, T., Rose, C. E., Butterfield, M., Jervis, R. H., Fedak, K. M., … COVID-19 Response Team. (2020). Update: COVID-19 among workers in meat and poultry processing facilities—United States, April–May 2020. Morbidity and Mortality Weekly Report, 69(27), 887–892. doi: 10.15585/ mmwr.mm6927e2
Wang, Y., & Chen, X. (2011). How much of racial/ethnic disparities in dietary intakes, exercise, and weight status can be explained by nutrition- and health-related psychosocial factors and socioeconomic status among US adults? Journal of the American Dietetic Association, 111(12), 1904–1911. doi: 10.1016/j. jada.2011.09.036
Waters, H., & Graf, M. (2018). The costs of chronic disease in the U.S. Milken Institute. Retrieved from https://milkeninstitute. org/sites/default/files/reports-pdf/ ChronicDiseases-HighRes-FINAL_0.pdf
Weber, L. (2020, July 15). Women’s careers could take long-term hit from coronavirus pandemic. The Wall Street Journal. Retrieved from https://www. wsj.com/articles/womens-careers-couldtake-long-term-hit-from-coronaviruspandemic-11594814403
Whitlock, B. L., Duda, E. S., Elson, M. J., Schwab, P. P., Uner, O. E., Wen, S., & Schneider, J. S. (2019). Primary care in transgender persons. Endocrinology and Metabolism Clinics of North America, 48(2), 377–390. doi: 10.1016/j. ecl.2019.02.004
Whittle, J. (2014, September 4). Most Native Americans live in cities, not reservations. Here are their stories. The Guardian. Retrieved from https://www. theguardian.com/us-news/2017/sep/04/ native-americans-stories-california
Williams Institute at UCLA School of Law. (2019, January). LGBT Demographic Data Interactive. Retrieved from https://williamsinstitute. law.ucla.edu/visualization/lgbtstats/?topic=LGBT#about-the-data
Woolf, S. H., Chapman, D. A., Buchanich, J. M., Bobby, K. J., Zimmerman, E. B., & Blackburn, S. M. (2018). Changes in midlife death rates across racial and ethnic groups in the United States: Systematic analysis of vital statistics. BMJ, 362, k3096. doi: 10.1136/bmj.k3096
Wu, S., Vega, W. A., Resendez, J., Jin, H. (2016). Latinos & Alzheimer’s disease: New numbers behind the crisis. USC Edward R. Roybal Institute on Aging and the Latinos Against Alzheimer’s Network. Retrieved from https://www. usagainstalzheimers.org/sites/default/ files/Latinos-and-AD_USC_UsA2Impact-Report.pdf
Yoon, K. H., Lee, J. H., Kim, J. W., Cho, J. H., Choi, Y. H., Ko, S. H., … Son, H. Y. (2006). Epidemic obesity and type 2 diabetes in Asia. Lancet, 368(9548), 1681–1688. doi: 10.1016/S01406736(06)69703-1