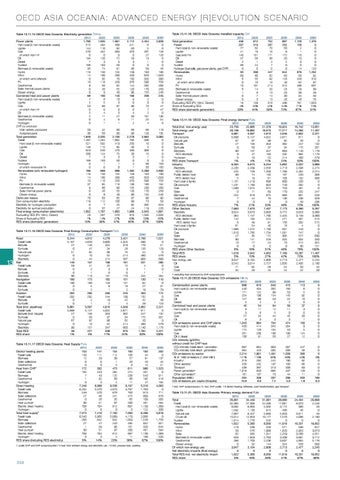
o e c d a s i a o c e a n i a : a d va n c e d e n e r gy [ r ] e vo lu t i o n s c e n a r i o table 13.11.15 Oecd asia Oceania: electricity generation twh/a 2012 2020 1,780 1,935 515 494 144 110 570 452 0 0 194 120 7 3 166 163 35 74 116 150 14 160 0 35 10 118 9 56 0 26 0 9 69 100 7 8 2 5 53 68 0 0 5 4 2 11 0 4 0 1
power plants hard coal (& non-renewable waste) lignite gas of which from H2 oil diesel nuclear biomass (& renewable waste) hydro wind of which wind offshore pv geothermal solar thermal power plants ocean energy combined heat and power plants hard coal (& non-renewable waste) lignite gas of which from H2 oil biomass (& renewable waste) geothermal hydrogen CHP by producer main activity producers autoproducers total generation fossil hard coal (& non-renewable waste) lignite gas oil diesel nuclear hydrogen of which renewable H2 renewables (w/o renewable hydrogen) hydro wind pv biomass (& renewable waste) geothermal solar thermal power plants ocean energy distribution losses own consumption electricity electricity for hydrogen production electricity for synfuel production final energy consumption (electricity) fluctuating res (pv, wind, ocean) share of fluctuating res res share (domestic generation)
13
33 36 1,849 1,497 521 146 623 200 7 166 0 0 186 116 14 10 37 9 0 0 78 119 0 0 1,652 23 1% 10%
42 58 2,035 1,264 502 115 520 124 3 163 1 0 608 150 160 118 85 60 26 9 83 112 7 37 1,797 287 14% 30%
2025 1,961 408 92 383 0 72 3 50 91 155 280 70 250 82 55 40 140 10 3 87 0 3 27 8 1
2030 2,112 241 50 370 0 29 3 0 88 159 450 150 370 144 120 90 166 9 0 90 0 4 50 11 2
2040 2,454 8 5 267 27 13 1 0 59 163 820 320 590 205 170 155 208 2 0 73 7 2 101 25 4
2050 2,838 0 0 128 128 0 0 0 48 180 1,020 380 758 206 250 248 245 0 0 47 47 0 136 54 8
60 80 2,100 1,062 419 95 470 75 3 50 1 0 988 155 280 250 118 90 55 40 85 100 25 27 1,863 570 27% 47%
68 98 2,278 795 250 50 460 33 3 0 2 1 1,482 159 450 370 138 155 120 90 87 90 92 24 1,986 910 40% 65%
88 120 2,662 336 10 5 306 15 1 0 38 33 2,288 163 820 590 160 230 170 155 90 73 335 119 2,045 1,565 59% 87%
110 135 3,083 0 0 0 0 0 0 0 183 183 2,900 180 1,020 758 184 260 250 248 90 59 823 220 1,891 2,026 66% 100%
table 13.11.16 Oecd asia Oceania: final energy consumption transport pj/a 2012 2020 2025 2030 road 5,244 4,912 4,276 3,421 fossil fuels 5,167 4,628 3,600 2,325 biofuels 27 146 322 319 synfuels 0 47 34 28 natural gas 51 84 88 75 hydrogen 0 10 52 214 electricity 0 44 214 487 rail 149 157 160 191 fossil fuels 59 41 25 15 biofuels 0 2 3 3 synfuels 0 1 0 0 electricity 90 113 131 173 navigation 180 173 162 151 fossil fuels 180 166 153 131 biofuels 0 5 9 18 synfuels 0 2 1 2 aviation 292 295 265 245 fossil fuels 292 292 244 199 biofuels 0 2 19 42 synfuels 0 1 2 4 total (incl. pipelines) 5,881 5,597 4,910 4,046 fossil fuels 5,698 5,127 4,022 2,671 biofuels (incl. biogas) 27 156 353 382 synfuels 0 50 37 34 natural gas 67 97 98 82 hydrogen 0 10 52 214 electricity 90 157 347 663 total res 36 221 558 975 res share 1% 4% 11% 24% table 13.11.17 Oecd asia Oceania: heat supply pj/a 2012 153 140 12 0 0 172 165 7 1 0 7,249 6,234 249 27 0 30 708 0 7,573 6,540 268 27 1 30 708 0 5%
district heating plants fossil fuels biomass solar collectors geothermal heat from chp1 fossil fuels biomass geothermal hydrogen direct heating fossil fuels biomass solar collectors geothermal heat pumps2 electric direct heating hydrogen total heat supply3 fossil fuels biomass solar collectors geothermal heat pumps2 electric direct heating hydrogen res share (including res electricity)
2020 141 111 29 0 0 302 223 43 32 3 6,968 5,570 570 46 26 51 704 0 7,410 5,905 642 47 59 51 704 3 14%
2025 154 112 39 1 2 473 284 125 60 4 6,536 4,673 678 241 35 97 812 0 7,163 5,069 842 243 96 97 812 4 23%
2040 2,156 590 178 126 24 460 903 231 4 1 1 225 130 84 27 19 203 132 42 29 2,852 811 247 175 20 460 1,140 1,794 63%
2030 192 108 57 20 8 611 274 238 88 11 6,197 3,797 763 475 65 200 897 0 7,000 4,179 1,059 495 161 200 897 11 36%
1 public chp and chp autoproduction / 2 heat from ambient energy and electricity use / 3 incl. process heat, cooking
358
2040 193 44 91 43 15 986 201 543 195 47 5,316 1,763 913 809 109 461 1,139 122 6,496 2,008 1,548 852 320 461 1,139 169 67%
2050 1,521 0 51 129 0 579 890 285 0 0 1 284 110 0 31 79 172 0 49 123 2,221 0 132 331 0 579 1,178 2,221 100%
2050 202 0 137 45 21 1,523 0 911 418 194 4,093 0 711 876 205 594 1,369 338 5,818 0 1,758 921 645 594 1,369 533 100%
table 13.11.18: Oecd asia Oceania: installed capacity gw 2012 2020 total generation 458 612 fossil 297 319 hard coal (& non-renewable waste) 77 82 lignite 21 19 gas (w/o h2) 140 161 oil 57 56 diesel 2 1 nuclear 68 24 hydrogen (fuel cells, gas power plants, gas chp) 0 0 renewables 93 268 hydro 69 80 wind 6 55 of which wind offshore 0 10 pv 10 101 biomass (& renewable waste) 6 14 geothermal 1 8 solar thermal power plants 0 7 ocean energy 0 3 fluctuating res (pv, wind, ocean) 16 159 share of fluctuating res 4% 26% res share (domestic generation) 20% 44% table 13.11.19: Oecd asia Oceania: final energy demand pj/a 2012 2020 total (incl. non-energy use) 23,756 22,985 total energy use1 20,108 19,882 transport 5,881 5,597 oil products 5,698 5,127 natural gas 67 97 biofuels 27 156 synfuels 0 50 electricity 90 157 RES electricity 9 47 hydrogen 0 10 res share transport 1% 4% industry 6,564 6,615 electricity 2,235 2,439 RES electricity 225 728 public district heat 89 74 RES district heat 5 19 hard coal & lignite 1,161 1,219 oil products 1,231 1,193 gas 1,590 1,015 solar 0 11 biomass 252 619 geothermal 7 44 hydrogen 0 0 res share industry 7% 21% other sectors 7,663 7,670 electricity 3,624 3,873 RES electricity 364 1,157 public district heat 142 194 RES district heat 8 49 hard coal & lignite 81 54 oil products 1,886 1,572 gas 1,810 1,785 solar 27 35 biomass 80 141 geothermal 13 17 hydrogen 0 0 res share other sectors 6% 18% total res 1,018 3,042 res share 5% 15% non energy use 3,647 3,104 oil 3,542 3,014 gas 71 62 coal 34 28
2025 752 297 70 16 171 38 2 7 0 447 82 92 19 214 20 13 14 13 318 42% 59%
2025 21,379 18,570 4,910 4,022 98 353 37 347 163 52 11% 6,254 2,556 1,203 150 61 898 953 874 69 675 79 0 33% 7,407 3,803 1,790 224 91 40 1,180 1,734 172 229 24 0 31% 4,952 27% 2,808 2,727 56 25
2030 897 252 50 9 172 20 2 0 0 644 83 143 40 315 23 23 30 28 486 54% 72%
2030 19,924 17,211 4,046 2,671 82 382 34 663 432 214 24% 5,992 2,713 1,766 187 108 600 740 753 170 693 136 0 48% 7,173 3,772 2,455 271 156 16 831 1,581 305 325 73 0 46% 7,160 42% 2,713 2,635 54 24
2040 1,120 130 2 1 116 10 0 0 14 976 83 248 82 496 29 39 34 48 791 71% 87%
2040 16,742 14,265 2,852 811 20 247 175 1,140 994 460 63% 5,022 2,598 2,264 220 182 233 332 461 232 661 236 50 72% 6,390 3,623 3,159 401 332 4 243 747 577 504 212 80 76% 10,267 72% 2,477 2,405 50 22
2050 1,376 0 0 0 0 0 0 0 123 1,252 92 310 97 637 39 49 50 76 1,023 74% 91%
2050 13,651 11,407 2,221 0 0 132 331 1,178 1,178 579 100% 3,889 2,274 2,274 308 308 0 0 0 247 526 329 206 100% 5,297 3,360 3,360 515 515 0 0 0 630 320 322 151 100% 11,407 100% 2,245 2,180 45 20
1 excluding heat produced by chp autoproducers
table 13.11.20 Oecd asia Oceania: cO2 emissions mill t/a 2012 condensation power plants 998 hard coal (& non-renewable waste) 440 lignite 171 gas 254 oil 127 diesel 5 combined heat and power plants 45 hard coal (& non-renewable waste) 9 lignite 3 gas 27 oil 6 co2 emissions power and chp plants 1,043 hard coal (& non-renewable waste) 450 lignite 174 gas 281 oil & diesel 138 co2 intensity (g/kWh) without credit for chp heat co2 intensity fossil electr. generation 697 co2 intensity total electr. generation 564 co2 emissions by sector 2,214 % of 1990 emissions (1,566 mill t) 141% industry1 319 other sectors1 258 transport 439 power generation2 1,016 other conversion3 181 population (mill.) 204 co2 emissions per capita (t/capita) 10.9
2020 810 404 122 196 86 2 54 11 6 34 3 864 414 128 230 91
2025 640 332 99 154 53 2 64 14 5 44 3 704 345 104 198 58
2030 415 193 53 145 22 2 59 11 0 45 3 474 204 53 190 27
2040 113 6 5 92 10 0 37 3 0 33 1 150 9 5 124 12
2050 0 0 0 0 0 0 0 0 0 0 0 0 0 0 0 0
684 425 1,861 119% 292 232 397 833 107 206 9.0
663 335 1,491 95% 242 197 313 665 73 207 7.2
597 208 1,039 66% 190 160 209 437 44 206 5.0
447 56 360 23% 92 66 63 128 11 203 1.8
0 0 0 0% 0 0 0 0 0 199 0.0
1 incl. chp autoproducers / 2 incl. chp public / 3 district heating, refineries, coal transformation, gas transport
table 13.11.21: Oecd asia Oceania: primary energy demand pj/a 2012 2020 total 35,801 34,449 fossil 32,365 27,306 hard coal (& non-renewable waste) 8,092 6,863 lignite 1,592 1,133 natural gas 7,667 6,457 crude oil 15,014 12,853 nuclear 1,814 1,778 1,622 5,365 renewables hydro 419 539 wind 50 576 solar 62 565 biomass (& renewable waste) 826 1,949 geothermal 266 1,703 ocean energy 0 32 of which non-energy use 3,647 3,104 net electricity imports (final energy) 0 0 total res incl. net electricity import 1,622 5,365 res share 5% 16%
2025 31,081 22,486 5,505 915 5,889 10,177 545 8,050 558 1,008 1,341 2,763 2,236 144 2,808 0 8,050 26%
2030 28,680 17,061 3,172 466 5,853 7,570 0 11,619 571 1,620 2,259 3,209 3,637 324 2,713 0 11,619 41%
2040 24,404 8,073 380 46 3,611 4,036 0 16,331 586 2,953 3,588 3,691 4,955 558 2,477 0 16,331 67%
2050 20,898 2,246 20 0 46 2,180 0 18,652 647 3,673 4,551 3,712 5,176 893 2,245 0 18,652 89%