APRIL MARKET REPORT
IN APRIL 2024, WE SAW 16 HOUSE SALES, 2 LAND SALES, AND 1 COMMERCIAL SALE TOTALING $50.34M ON THE 19 TRANSACTIONS.
Comparing 2024’s April dollar volume and transaction volume to 2023, the numbers were nearly equal, 19 vs 20 prior. April 2023 saw 14 house sales and 6 land sales, totaling $51.76M in dollar volume.
As of April 30, 2024, there have been 63 transactions YTD. The YTD dollar volume is $253.65M, which is essentially flat to 2023’s $260.39M.
2023 was Nantucket’s 4th largest year on record, and while Real Estate markets nationwide have seemingly begun to soften, Nantucket has not shown signs of slowing down. Barring any significant macroeconomic shift, 2024 is on pace to be another $1B+ year for island real estate.
As we typically see, April brought us an abundance of new listings. In a low-inventory environment. t has been refreshing to see some new houses available for sale. In the month of April, we saw 43 new houses listed. Meanwhile, as we write this, there are 141 houses available for sale. Thus, inventory increased nearly 30% this month as buyers began looking for homes to occupy this summer. This is the highest number of homes we have seen on the market in April since 2020. This increase in inventory is still well below our pre-COVID average. Pre-COVID, we averaged 251 homes on the market at the end of April. Since 2020, that average has hovered around 100. Additionally, the market continues to prove that while Nantucket has been active over the last few years, buyers remain savvy. When you take a look at the days on market of listed properties vs. properties that have sold, there is a story to tell. Of the homes currently listed for sale, the average DOM is 140. Meanwhile, of the homes that sold in April, the average DOM was 76, nearly half. This continues to show that there is still a high demand for properties that are marketed and priced appropriately. We look forward to seeing how this higher inventory affects transactions as we progress toward the summer months.
*Market data and analysis provided by GPP agent Ethan Ulmer*
YEAR TO DATE SALES AS OF APRIL 30

HOUSE SALES AS OF APRIL 30

LAND SALES AS OF APRIL 30

COMMERCIAL SALES AS OF APRIL 30

THE CURRENT MARKET AT A GLANCE
$5.8M
AVERAGE ASKING PRICE OF AVAILABLE HOMES
147
AVERAGE DAYS ON MARKET OF AVAILABLE PROPERTIES
73
AVERAGE DAYS ON MARKET OF PENDING PROPERTIES
141 SINGLE-FAMILY HOMES AVAILABLE
25 NUMBER OF PENDING SALES
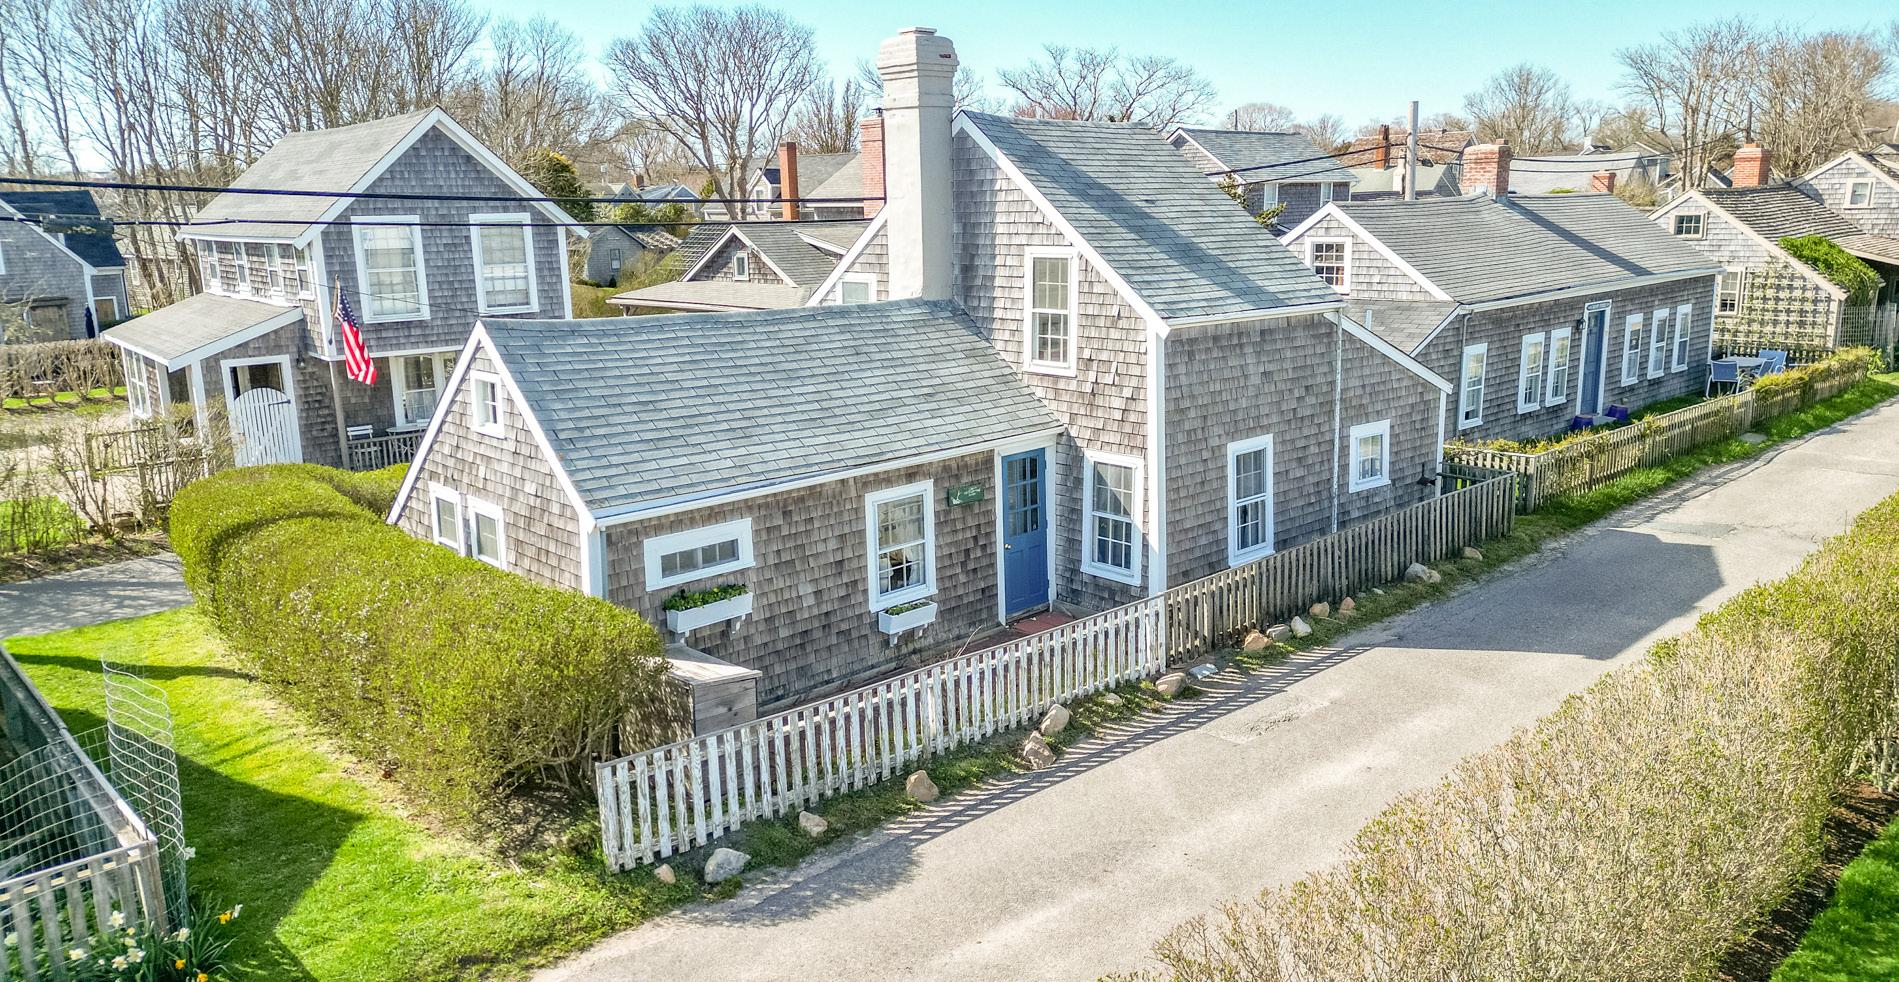
10 CENTER STREET | $1,795,000


To join our weekly newsletter, please scan the the flowcode!
