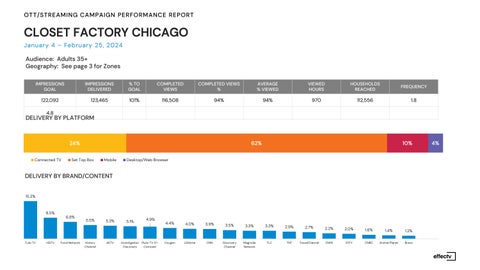
CLOSET FACTORY CHICAGO
January 4 – February 25, 2024
Audience: Adults 35+
Geography: See page 3 for Zones
24% 62% 10% 4% Connected TV Set Top Box Mobile Desktop/Web Browser IMPRESSIONS GOAL IMPRESSIONS DELIVERED % TO GOAL COMPLETED VIEWS COMPLETED VIEWS % AVERAGE % VIEWED VIEWED HOURS HOUSEHOLDS REACHED FREQUENCY 122,092 123,465 101% 116,508 94% 94% 970 112,556 1.8 4.8
BY PLATFORM
BY BRAND/CONTENT
DELIVERY
DELIVERY
OTT/STREAMING CAMPAIGN PERFORMANCE REPORT 15.2% 8.5% 6.8% 5.5% 5.3% 5.1% 4.9% 4.4% 4.0% 3.9% 3.5% 3.3% 3.3% 2.9% 2.7% 2.2% 2.0% 1.6% 1.4% 1.2% Tubi TV HGTV Food Network History Channel AETV Investigation Discovery Pluto TV X1Comcast Oxygen Lifetime CNN Discovery Channel Magnolia Network TLC TNT TravelChannel OWN SYFY CNBC Animal Planet Bravo
CLOSET FACTORY CHICAGO
2
CLOSET FACTORY CHICAGO
3
Impression Goal: Total Impressions booked for the entire flight of the selected campaign(s)
2. Impressions Delivered: Each instance that the ad was served to a user as defined by the IAB
3. % of Impression Goal: This calculation displays as a percentage of the Impressions Delivered against the Impression Goal for the campaign(s) selected
4. Completed Views: Total number of views of the end of the video ad
5. Completed Views %: This calculation displays as a percentage of the number of views of the end of the ad against the impressions delivered
6. Viewed 75%: This calculation displays as a percentage of the number of views of the 3/4th of the duration of the ad against the impressions delivered
7. Viewed 50%: This calculation displays as a percentage of the number of views of the 1/2 of the duration of the ad against the impressions delivered
8. Viewed 25%: This calculation displays as a percentage of the number of views of the 1/4th of the duration of the ad against the impressions delivered
9. Avg % Viewed: This calculation takes the average of all viewing durations displayed as a percentage
10. Viewed Mins: This calculation shows the cumulative minutes viewed of the ad over the time period selected
11. Platform: A set of devices that support content viewing, through which Comcast delivers advertising
12. CTV: (Connected TV) An internet-enabled device used to watch content on television screen. Examples include gaming consoles, streaming sticks
13. Web Browser: Verified impressions served on web browser, when the device is not mappable. Could include desktop, TV, mobile
14. Mobile: Verified impressions served on a mobile web browser or a mobile in-app experience
15. Desktop: Verified impressions served on any application including web browser on desktop
16. STB: (Set-Top Box) Verified impressions served on a device used in the home to watch on-demand content. This could include Xfinity and other affiliate cable subscription services
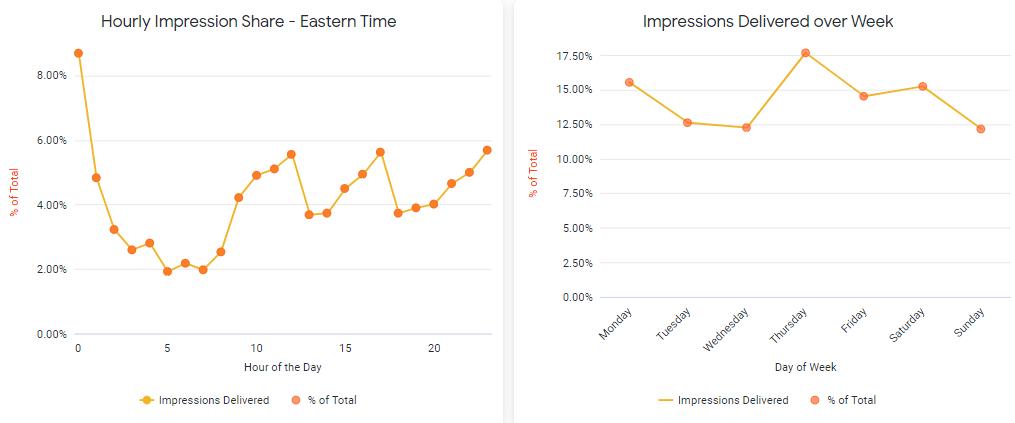
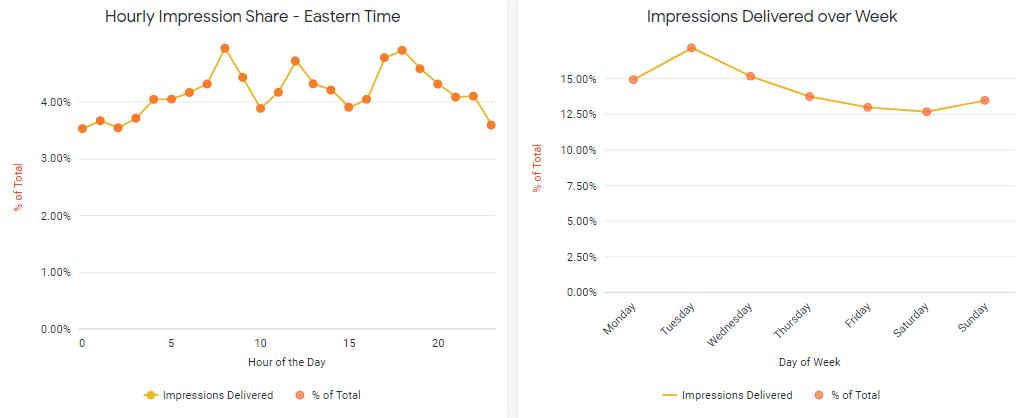
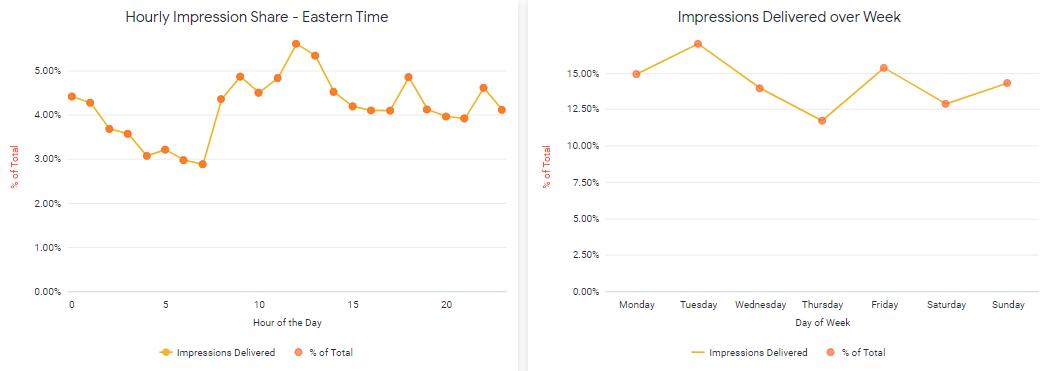
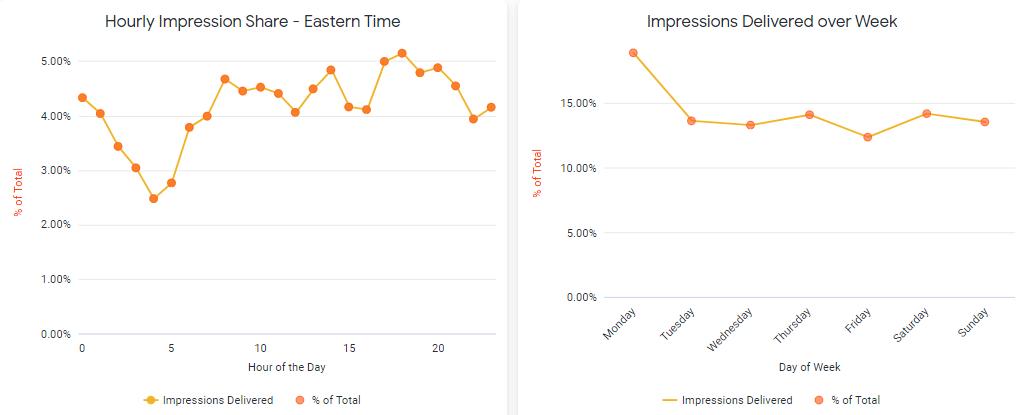
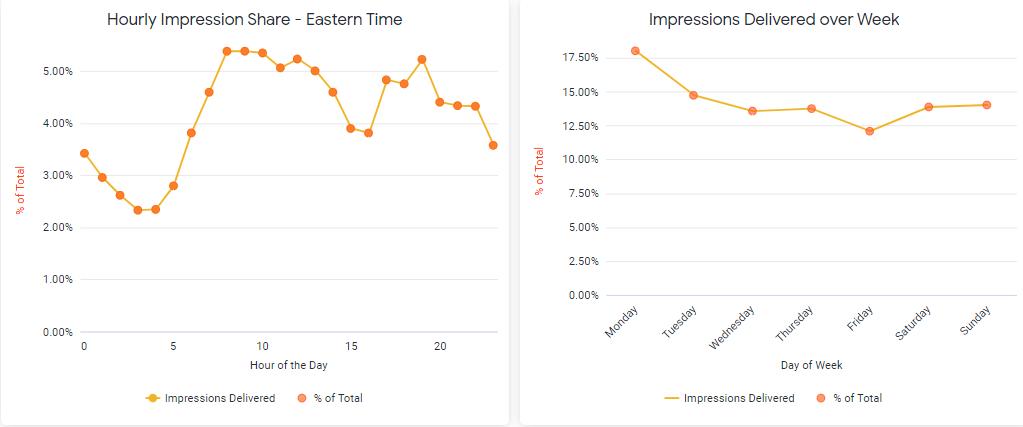
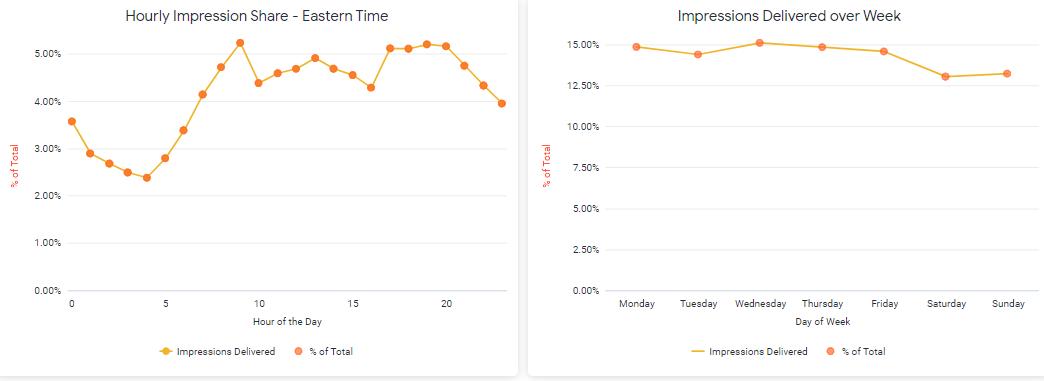
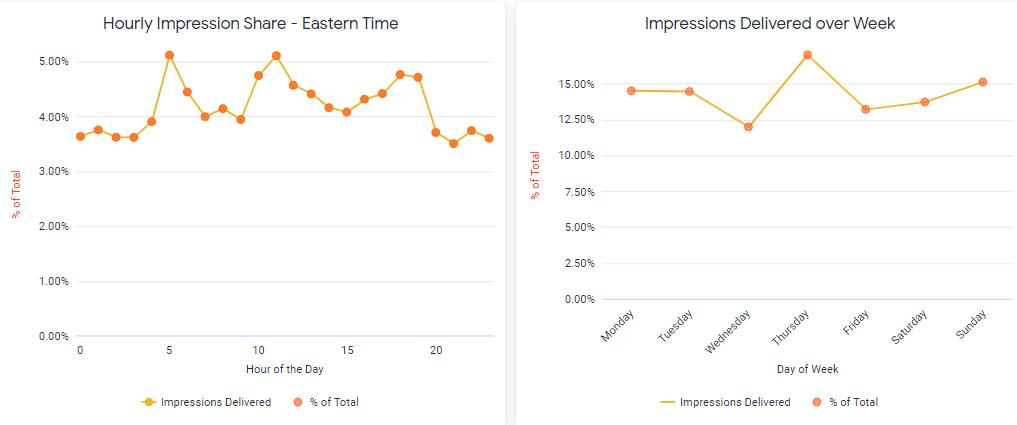
17. Delivery by Time: This calculation shows the Impressions delivered throughout the time period selected. For example by hour (displayed in Eastern Time) or day of week
18. FEP Geo Targeting: Campaigns are delivered in non-skippable, full episodic programming on VOD, OTT and TV Everywhere apps and sites within a selected geography - full market, zone or zip code (available on an exception basis)
19. FEP Audience Targeting: Campaigns are delivered in non-skippable, full episodic programming on VOD, OTT and TV Everywhere apps and sites, over-indexing against a targeted audience segment built using insights from aggregated Comcast data and blue-chip third-party data at the full market or zone level
20. TV Audience Targeting: Campaigns are primarily delivered within full episodic programming, supplemented by long- and short-form TV content across VOD, OTT and TV Everywhere apps and sites, over-indexing against a targeted audience segment built using insights from aggregated Comcast data and third-party data at the full market or zone level
21. TV & Premium Video Audience Targeting: Campaigns are delivered in a mix of long- and short-form TV and premium video content on OTT platforms, plus brand-safe apps and sites, over-indexing against a targeted audience segment built using insights from aggregated Comcast data and third-party data at the full market or zone level
22. Content Targeting: Campaigns are delivered to specifically selected networks in non-skippable, full episodic programming on VOD, OTT and TV Everywhere apps and sites within a selected geography - full market, zone or zip code (available on an exception basis)
23. Other Verified: Verified impressions served on the relevant dimension (example device, content/brands) that cannot be reported due to data privacy limitations.
24. Unique HHs: Estimated total number of households exposed to the Ad.
25. Frequency: Estimated average number of times a unique household was exposed to the Ad.
26. Unique HHs and FrequencyMethodology: Comcast subscriber HH ad exposure data is overlaid with Tapad ID graph to extrapolate missing data.
4
CLOSET FACTORY CHICAGO
January 4 – February 25, 2024
Audience: Adults 35+
Geography: See page 3 for Zones
24% 62% 10% 4% Connected TV Set Top Box Mobile Desktop/Web Browser IMPRESSIONS GOAL IMPRESSIONS DELIVERED % TO GOAL COMPLETED VIEWS COMPLETED VIEWS % AVERAGE % VIEWED VIEWED HOURS HOUSEHOLDS REACHED FREQUENCY 122,092 123,465 101% 116,508 94% 94% 970 112,556 1.8
BY
BY BRAND/CONTENT
DELIVERY
PLATFORM DELIVERY
OTT/STREAMING CAMPAIGN PERFORMANCE REPORT 15.2% 8.5% 6.8% 5.5% 5.3% 5.1% 4.9% 4.4% 4.0% 3.9% 3.5% 3.3% 3.3% 2.9% 2.7% 2.2% 2.0% 1.6% 1.4% 1.2% Tubi TV HGTV Food Network History Channel AETV Investigation Discovery Pluto TV X1Comcast Oxygen Lifetime CNN Discovery Channel Magnolia Network TLC TNT TravelChannel OWN SYFY CNBC Animal Planet Bravo
CLOSET FACTORY CHICAGO
2
CLOSET FACTORY CHICAGO
3
CLOSET FACTORY CHICAGO
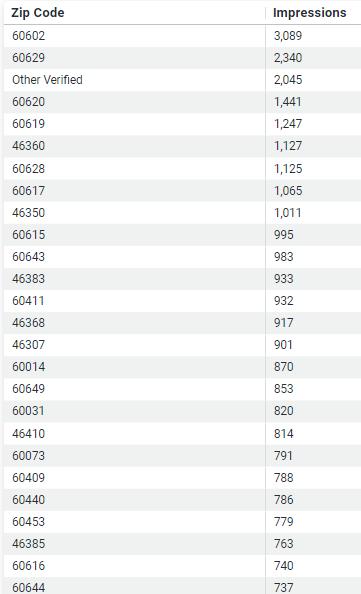
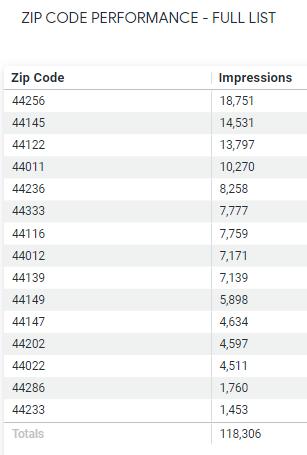
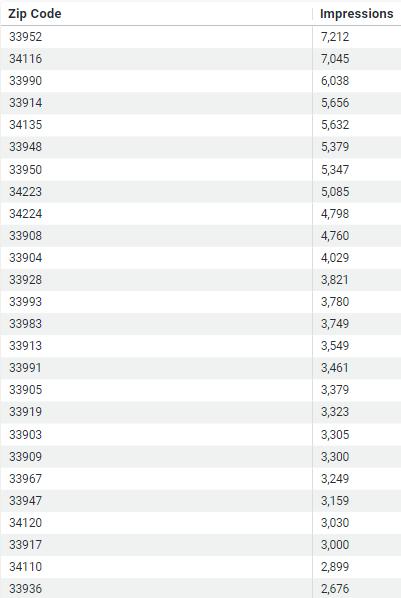
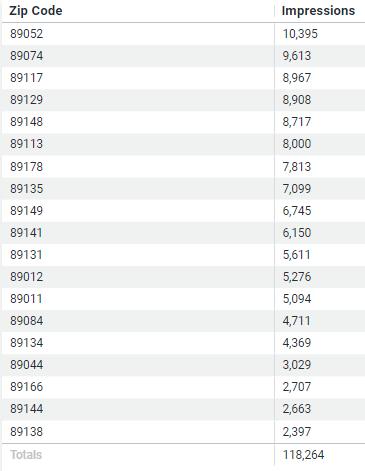
PARTIAL ZIP CODE LIST –
SEE ATTACHED EXCEL SPREADSHEET FOR FULL LIST
RECOMMEND FOCUSING ON THE TOP 10-15 ZIP CODES FOR THE FRANCHISE
4
Impression Goal: Total Impressions booked for the entire flight of the selected campaign(s)
2. Impressions Delivered: Each instance that the ad was served to a user as defined by the IAB
3. % of Impression Goal: This calculation displays as a percentage of the Impressions Delivered against the Impression Goal for the campaign(s) selected
4. Completed Views: Total number of views of the end of the video ad
5. Completed Views %: This calculation displays as a percentage of the number of views of the end of the ad against the impressions delivered
6. Viewed 75%: This calculation displays as a percentage of the number of views of the 3/4th of the duration of the ad against the impressions delivered
7. Viewed 50%: This calculation displays as a percentage of the number of views of the 1/2 of the duration of the ad against the impressions delivered
8. Viewed 25%: This calculation displays as a percentage of the number of views of the 1/4th of the duration of the ad against the impressions delivered
9. Avg % Viewed: This calculation takes the average of all viewing durations displayed as a percentage
10. Viewed Mins: This calculation shows the cumulative minutes viewed of the ad over the time period selected
11. Platform: A set of devices that support content viewing, through which Comcast delivers advertising
12. CTV: (Connected TV) An internet-enabled device used to watch content on television screen. Examples include gaming consoles, streaming sticks
13. Web Browser: Verified impressions served on web browser, when the device is not mappable. Could include desktop, TV, mobile
14. Mobile: Verified impressions served on a mobile web browser or a mobile in-app experience
15. Desktop: Verified impressions served on any application including web browser on desktop
16. STB: (Set-Top Box) Verified impressions served on a device used in the home to watch on-demand content. This could include Xfinity and other affiliate cable subscription services
17. Delivery by Time: This calculation shows the Impressions delivered throughout the time period selected. For example by hour (displayed in Eastern Time) or day of week
18. FEP Geo Targeting: Campaigns are delivered in non-skippable, full episodic programming on VOD, OTT and TV Everywhere apps and sites within a selected geography - full market, zone or zip code (available on an exception basis)
19. FEP Audience Targeting: Campaigns are delivered in non-skippable, full episodic programming on VOD, OTT and TV Everywhere apps and sites, over-indexing against a targeted audience segment built using insights from aggregated Comcast data and blue-chip third-party data at the full market or zone level
20. TV Audience Targeting: Campaigns are primarily delivered within full episodic programming, supplemented by long- and short-form TV content across VOD, OTT and TV Everywhere apps and sites, over-indexing against a targeted audience segment built using insights from aggregated Comcast data and third-party data at the full market or zone level
21. TV & Premium Video Audience Targeting: Campaigns are delivered in a mix of long- and short-form TV and premium video content on OTT platforms, plus brand-safe apps and sites, over-indexing against a targeted audience segment built using insights from aggregated Comcast data and third-party data at the full market or zone level
22. Content Targeting: Campaigns are delivered to specifically selected networks in non-skippable, full episodic programming on VOD, OTT and TV Everywhere apps and sites within a selected geography - full market, zone or zip code (available on an exception basis)
23. Other Verified: Verified impressions served on the relevant dimension (example device, content/brands) that cannot be reported due to data privacy limitations.
24. Unique HHs: Estimated total number of households exposed to the Ad.
25. Frequency: Estimated average number of times a unique household was exposed to the Ad.
26. Unique HHs and FrequencyMethodology: Comcast subscriber HH ad exposure data is overlaid with Tapad ID graph to extrapolate missing data.
5
January 6 – February 25, 2024
Audience: Booming With Confidence Lifestyle Group
Geography: Custom Zip Code Zone
65% 26% 10% 7% Connected TV Mobile Desktop Web Browser DELIVERY BY PLATFORM DELIVERY BY BRAND/CONTENT
OTT/STREAMING CAMPAIGN PERFORMANE REPORT 22.1% 16.4% 14.0% 9.8% 5.7% 5.5% 4.4% 3.1% 2.0% 1.8% 1.7% 1.6% 1.5% 1.1% 1.0% 1.0% 1.0% 1.0% 1.0% 1.0% Paramount StreamingSports Paramount StreamingEntertainment Paramount StreamingNews XUMOAudience News CNN Investigation Discovery Paramount HGTV TLC Food Network Comedy Central Discovery Channel TNT Lifetime TBS TV Land History Channel NBC News Travel Channel tru TV
CLOSET FACTORY CLEVELAND
IMPRESSIONS GOAL IMPRESSIONS DELIVERED % TO GOAL COMPLETED VIEWS COMPLETED VIEWS % AVERAGE % VIEWED HOURS INTERACTING WITH YOUR COMMERCIAL HOUSEHOLDS REACHED FREQUENCY 117,326 118,306 101% 104,247 88% 91% 896 42,665 3.9
2
CLOSET FACTORY CLEVELAND
3
1. Impression Goal: Total Impressions booked for the entire flight of the selected campaign(s)
2. Impressions Delivered: Each instance that the ad was served to a user as defined by the IAB
3. % of Impression Goal: This calculation displays as a percentage of the Impressions Delivered against the Impression Goal for the campaign(s) selected
4. Completed Views: Total number of views of the end of the video ad
5. Completed Views %: This calculation displays as a percentage of the number of views of the end of the ad against the impressions delivered
6. Viewed 75%: This calculation displays as a percentage of the number of views of the 3/4th of the duration of the ad against the impressions delivered
7. Viewed 50%: This calculation displays as a percentage of the number of views of the 1/2 of the duration of the ad against the impressions delivered
8. Viewed 25%: This calculation displays as a percentage of the number of views of the 1/4th of the duration of the ad against the impressions delivered
9. Avg % Viewed: This calculation takes the average of all viewing durations displayed as a percentage
10. Viewed Mins: This calculation shows the cumulative minutes viewed of the ad over the time period selected
11. Platform: A set of devices that support content viewing, through which Comcast delivers advertising
12. CTV: (Connected TV) An internet-enabled device used to watch content on television screen. Examples include gaming consoles, streaming sticks
13. Web Browser: Verified impressions served on web browser, when the device is not mappable. Could include desktop, TV, mobile
14. Mobile: Verified impressions served on a mobile web browser or a mobile in-app experience
15. Desktop: Verified impressions served on any application including web browser on desktop
16. STB: (Set-Top Box) Verified impressions served on a device used in the home to watch on-demand content. This could include Xfinity and other affiliate cable subscription services
17. Delivery by Time: This calculation shows the Impressions delivered throughout the time period selected. For example by hour (displayed in Eastern Time) or day of week
18. FEP Geo Targeting: Campaigns are delivered in non-skippable, full episodic programming on VOD, OTT and TV Everywhere apps and sites within a selected geographyfull market, zone or zip code (available on an exception basis)
19. FEP Audience Targeting: Campaigns are delivered in non-skippable, full episodic programming on VOD, OTT and TV Everywhere apps and sites, over-indexing against a targeted audience segment built using insights from aggregated Comcast data and blue-chip third-party data at the full market or zone level
20. TV Audience Targeting: Campaigns are primarily delivered within full episodic programming, supplemented by long- and short-form TV content across VOD, OTT and TV Everywhere apps and sites, over-indexing against a targeted audience segment built using insights from aggregated Comcast data and third-party data at the full market or zone level
21. TV & Premium Video Audience Targeting: Campaigns are delivered in a mix of long- and short-form TV and premium video content on OTT platforms, plus brand-safe apps and sites, over-indexing against a targeted audience segment built using insights from aggregated Comcast data and third-party data at the full market or zone level
22. Content Targeting: Campaigns are delivered to specifically selected networks in non-skippable, full episodic programming on VOD, OTT and TV Everywhere apps and sites within a selected geography - full market, zone or zip code (available on an exception basis)
23. Other Verified: Verified impressions served on the relevant dimension (example device, content/brands) that cannot be reported due to data privacy limitations.
2. Unique HHs: Estimated total number of households exposed to the Ad.
25. Frequency: Estimated average number of times a unique household was exposed to the Ad.
26. Unique HHs and FrequencyMethodology: Comcast subscriber HH ad exposure data is overlaid with Tapad ID graph to extrapolate missing data.
4
CLOSET FACTORY FT. MYERS
January 4 – February 25, 2024
Audience: Homeowners; HHI $100K+
Geography: See page 3 for Zones
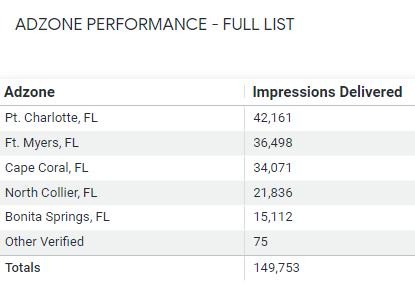
55% 33% 8% 4% Connected TV Set Top Box Mobile Desktop/Web Browser IMPRESSIONS GOAL IMPRESSIONS DELIVERED % TO GOAL COMPLETED VIEWS COMPLETED VIEWS % AVERAGE % VIEWED VIEWED HOURS HOUSEHOLDS REACHED FREQUENCY 132735 149,753 113% 138,504 92% 94% 1,168 59,411 3.2 4.8 DELIVERY BY PLATFORM DELIVERY BY BRAND/CONTENT
OTT/STREAMING CAMPAIGN PERFORMANCE REPORT 12.6% 6.7% 6.4% 5.3% 4.8% 3.3% 3.0% 2.8% 2.7% 2.7% 2.6% 2.1% 1.9% 1.5% 1.4% 1.4% 1.2% 1.1% 1.1% 1.0% XUMOAudience News Pluto TV X1Comcast History Channel Pluto TV HGTV Tubi TV Food Network Discovery Channel Paramount StreamingSports Investigation Discovery Lifetime AETV Paramount StreamingNews CNN TLC TNT TBS Paramount StreamingEntertainment Animal Planet Travel Channel
CLOSET FACTORY FT. MYERS
2
CLOSET FACTORY FT. MYERS
3
Impression Goal: Total Impressions booked for the entire flight of the selected campaign(s)
2. Impressions Delivered: Each instance that the ad was served to a user as defined by the IAB
3. % of Impression Goal: This calculation displays as a percentage of the Impressions Delivered against the Impression Goal for the campaign(s) selected
4. Completed Views: Total number of views of the end of the video ad
5. Completed Views %: This calculation displays as a percentage of the number of views of the end of the ad against the impressions delivered
6. Viewed 75%: This calculation displays as a percentage of the number of views of the 3/4th of the duration of the ad against the impressions delivered
7. Viewed 50%: This calculation displays as a percentage of the number of views of the 1/2 of the duration of the ad against the impressions delivered
8. Viewed 25%: This calculation displays as a percentage of the number of views of the 1/4th of the duration of the ad against the impressions delivered
9. Avg % Viewed: This calculation takes the average of all viewing durations displayed as a percentage
10. Viewed Mins: This calculation shows the cumulative minutes viewed of the ad over the time period selected
11. Platform: A set of devices that support content viewing, through which Comcast delivers advertising
12. CTV: (Connected TV) An internet-enabled device used to watch content on television screen. Examples include gaming consoles, streaming sticks
13. Web Browser: Verified impressions served on web browser, when the device is not mappable. Could include desktop, TV, mobile
14. Mobile: Verified impressions served on a mobile web browser or a mobile in-app experience
15. Desktop: Verified impressions served on any application including web browser on desktop
16. STB: (Set-Top Box) Verified impressions served on a device used in the home to watch on-demand content. This could include Xfinity and other affiliate cable subscription services
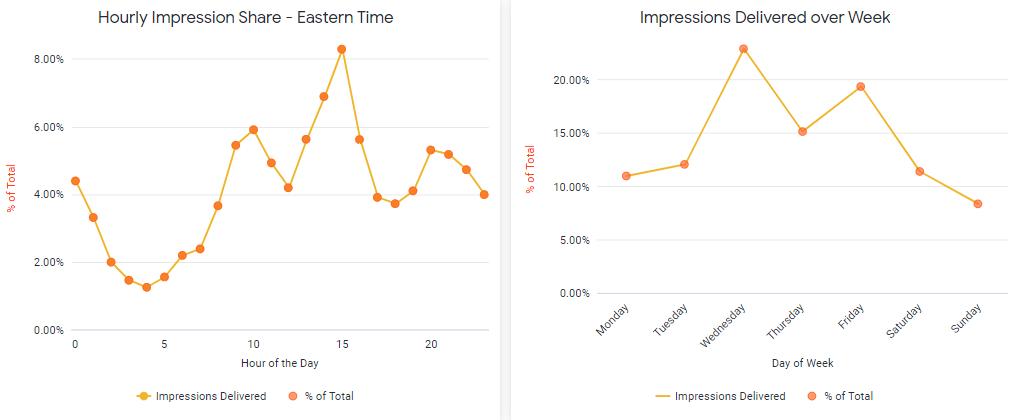
17. Delivery by Time: This calculation shows the Impressions delivered throughout the time period selected. For example by hour (displayed in Eastern Time) or day of week
18. FEP Geo Targeting: Campaigns are delivered in non-skippable, full episodic programming on VOD, OTT and TV Everywhere apps and sites within a selected geography - full market, zone or zip code (available on an exception basis)
19. FEP Audience Targeting: Campaigns are delivered in non-skippable, full episodic programming on VOD, OTT and TV Everywhere apps and sites, over-indexing against a targeted audience segment built using insights from aggregated Comcast data and blue-chip third-party data at the full market or zone level
20. TV Audience Targeting: Campaigns are primarily delivered within full episodic programming, supplemented by long- and short-form TV content across VOD, OTT and TV Everywhere apps and sites, over-indexing against a targeted audience segment built using insights from aggregated Comcast data and third-party data at the full market or zone level
21. TV & Premium Video Audience Targeting: Campaigns are delivered in a mix of long- and short-form TV and premium video content on OTT platforms, plus brand-safe apps and sites, over-indexing against a targeted audience segment built using insights from aggregated Comcast data and third-party data at the full market or zone level
22. Content Targeting: Campaigns are delivered to specifically selected networks in non-skippable, full episodic programming on VOD, OTT and TV Everywhere apps and sites within a selected geography - full market, zone or zip code (available on an exception basis)
23. Other Verified: Verified impressions served on the relevant dimension (example device, content/brands) that cannot be reported due to data privacy limitations.
24. Unique HHs: Estimated total number of households exposed to the Ad.
25. Frequency: Estimated average number of times a unique household was exposed to the Ad.
26. Unique HHs and FrequencyMethodology: Comcast subscriber HH ad exposure data is overlaid with Tapad ID graph to extrapolate missing data.
4
CLOSET FACTORY FT. MYERS
January 4 – February 25, 2024
Audience: Homeowners; HHI $100K+
Geography: See page 3 for Zones
55% 33% 8% 4% Connected TV Set Top Box Mobile Desktop/Web Browser IMPRESSIONS GOAL IMPRESSIONS DELIVERED % TO GOAL COMPLETED VIEWS COMPLETED VIEWS % AVERAGE % VIEWED VIEWED HOURS HOUSEHOLDS REACHED FREQUENCY 132735 149,753 113% 138,504 92% 94% 1,168 59,411 3.2 4.8 DELIVERY BY PLATFORM DELIVERY BY BRAND/CONTENT
OTT/STREAMING CAMPAIGN PERFORMANCE REPORT 12.6% 6.7% 6.4% 5.3% 4.8% 3.3% 3.0% 2.8% 2.7% 2.7% 2.6% 2.1% 1.9% 1.5% 1.4% 1.4% 1.2% 1.1% 1.1% 1.0% XUMOAudience News Pluto TV X1Comcast History Channel Pluto TV HGTV Tubi TV Food Network Discovery Channel Paramount StreamingSports Investigation Discovery Lifetime AETV Paramount StreamingNews CNN TLC TNT TBS Paramount StreamingEntertainment Animal Planet Travel Channel
CLOSET FACTORY FT. MYERS
2
CLOSET FACTORY FT. MYERS
3
CLOSET FACTORY FT. MYERS
Partial list of zip codes. Full list on attached spreadsheet
Recommendation – review the zip codes with the franchise owner to determine if you want to narrow the zip codes
4
Impression Goal: Total Impressions booked for the entire flight of the selected campaign(s)
2. Impressions Delivered: Each instance that the ad was served to a user as defined by the IAB
3. % of Impression Goal: This calculation displays as a percentage of the Impressions Delivered against the Impression Goal for the campaign(s) selected
4. Completed Views: Total number of views of the end of the video ad
5. Completed Views %: This calculation displays as a percentage of the number of views of the end of the ad against the impressions delivered
6. Viewed 75%: This calculation displays as a percentage of the number of views of the 3/4th of the duration of the ad against the impressions delivered
7. Viewed 50%: This calculation displays as a percentage of the number of views of the 1/2 of the duration of the ad against the impressions delivered
8. Viewed 25%: This calculation displays as a percentage of the number of views of the 1/4th of the duration of the ad against the impressions delivered
9. Avg % Viewed: This calculation takes the average of all viewing durations displayed as a percentage
10. Viewed Mins: This calculation shows the cumulative minutes viewed of the ad over the time period selected
11. Platform: A set of devices that support content viewing, through which Comcast delivers advertising
12. CTV: (Connected TV) An internet-enabled device used to watch content on television screen. Examples include gaming consoles, streaming sticks
13. Web Browser: Verified impressions served on web browser, when the device is not mappable. Could include desktop, TV, mobile
14. Mobile: Verified impressions served on a mobile web browser or a mobile in-app experience
15. Desktop: Verified impressions served on any application including web browser on desktop
16. STB: (Set-Top Box) Verified impressions served on a device used in the home to watch on-demand content. This could include Xfinity and other affiliate cable subscription services
17. Delivery by Time: This calculation shows the Impressions delivered throughout the time period selected. For example by hour (displayed in Eastern Time) or day of week
18. FEP Geo Targeting: Campaigns are delivered in non-skippable, full episodic programming on VOD, OTT and TV Everywhere apps and sites within a selected geography - full market, zone or zip code (available on an exception basis)
19. FEP Audience Targeting: Campaigns are delivered in non-skippable, full episodic programming on VOD, OTT and TV Everywhere apps and sites, over-indexing against a targeted audience segment built using insights from aggregated Comcast data and blue-chip third-party data at the full market or zone level
20. TV Audience Targeting: Campaigns are primarily delivered within full episodic programming, supplemented by long- and short-form TV content across VOD, OTT and TV Everywhere apps and sites, over-indexing against a targeted audience segment built using insights from aggregated Comcast data and third-party data at the full market or zone level
21. TV & Premium Video Audience Targeting: Campaigns are delivered in a mix of long- and short-form TV and premium video content on OTT platforms, plus brand-safe apps and sites, over-indexing against a targeted audience segment built using insights from aggregated Comcast data and third-party data at the full market or zone level
22. Content Targeting: Campaigns are delivered to specifically selected networks in non-skippable, full episodic programming on VOD, OTT and TV Everywhere apps and sites within a selected geography - full market, zone or zip code (available on an exception basis)
23. Other Verified: Verified impressions served on the relevant dimension (example device, content/brands) that cannot be reported due to data privacy limitations.
24. Unique HHs: Estimated total number of households exposed to the Ad.
25. Frequency: Estimated average number of times a unique household was exposed to the Ad.
26. Unique HHs and FrequencyMethodology: Comcast subscriber HH ad exposure data is overlaid with Tapad ID graph to extrapolate missing data.
5
CLOSET FACTORY LAS VEGAS
January 6 – February 25, 2024
Audience: Booming With Confidence Lifestyle Group
Geography: Custom Zip Code Zone
77% 14% 4% 5% Connected TV Mobile Desktop
Browser IMPRESSIONS GOAL IMPRESSIONS DELIVERED % TO GOAL COMPLETED VIEWS COMPLETED VIEW % AVERAGE % VIEWED HOURS INTERACTING WITH YOUR COMMERCIAL UNIQUE HOUSEHOLDS REACHED FREQUENCY 117,326 118,264 101% 107,316 91% 93% 913 41,399 3.9
BY
Web
DELIVERY BY PLATFORM DELIVERY
BRAND/CONTENT
OTT/STREAMING CAMPAIGN PERFORMANCE REPORT 34.2% 15.4% 15.2% 12.2% 5.4% 5.2% 3.3% 1.2% 1.2% 1.0% 1.0% 1.0% 1.0% 1.0% 1.0% 1.0% 1.0% 1.0% 1.0% 1.0% XUMOAudience News Paramount StreamingSports Paramount StreamingNews Paramount StreamingEntertainment CNN Investigation Discovery NBC News Paramount Discovery Channel HGTV Lifetime Food Network TLC History Channel TBS Animal Planet Travel Channel TNT Science Channel Oxygen
CLOSET FACTORY LAS VEGAS
2
CLOSET FACTORY LAS VEGAS
3
Impression Goal: Total Impressions booked for the entire flight of the selected campaign(s)
2. Impressions Delivered: Each instance that the ad was served to a user as defined by the IAB
3. % of Impression Goal: This calculation displays as a percentage of the Impressions Delivered against the Impression Goal for the campaign(s) selected
4. Completed Views: Total number of views of the end of the video ad
5. Completed Views %: This calculation displays as a percentage of the number of views of the end of the ad against the impressions delivered
6. Viewed 75%: This calculation displays as a percentage of the number of views of the 3/4th of the duration of the ad against the impressions delivered
7. Viewed 50%: This calculation displays as a percentage of the number of views of the 1/2 of the duration of the ad against the impressions delivered
8. Viewed 25%: This calculation displays as a percentage of the number of views of the 1/4th of the duration of the ad against the impressions delivered
9. Avg % Viewed: This calculation takes the average of all viewing durations displayed as a percentage
10. Viewed Mins: This calculation shows the cumulative minutes viewed of the ad over the time period selected
11. Platform: A set of devices that support content viewing, through which Comcast delivers advertising
12. CTV: (Connected TV) An internet-enabled device used to watch content on television screen. Examples include gaming consoles, streaming sticks
13. Web Browser: Verified impressions served on web browser, when the device is not mappable. Could include desktop, TV, mobile
14. Mobile: Verified impressions served on a mobile web browser or a mobile in-app experience
15. Desktop: Verified impressions served on any application including web browser on desktop
16. STB: (Set-Top Box) Verified impressions served on a device used in the home to watch on-demand content. This could include Xfinity and other affiliate cable subscription services
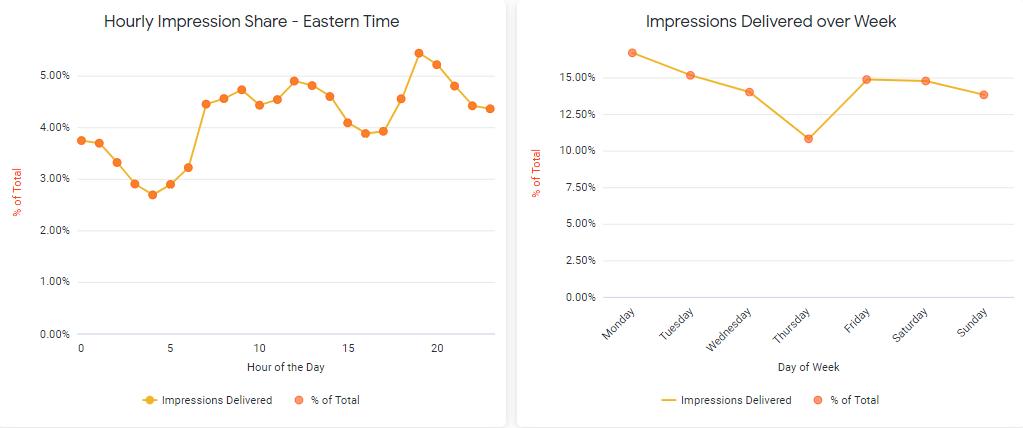
17. Delivery by Time: This calculation shows the Impressions delivered throughout the time period selected. For example by hour (displayed in Eastern Time) or day of week
18. FEP Geo Targeting: Campaigns are delivered in non-skippable, full episodic programming on VOD, OTT and TV Everywhere apps and sites within a selected geography - full market, zone or zip code (available on an exception basis)
19. FEP Audience Targeting: Campaigns are delivered in non-skippable, full episodic programming on VOD, OTT and TV Everywhere apps and sites, over-indexing against a targeted audience segment built using insights from aggregated Comcast data and blue-chip third-party data at the full market or zone level
20. TV Audience Targeting: Campaigns are primarily delivered within full episodic programming, supplemented by long- and short-form TV content across VOD, OTT and TV Everywhere apps and sites, over-indexing against a targeted audience segment built using insights from aggregated Comcast data and third-party data at the full market or zone level
21. TV & Premium Video Audience Targeting: Campaigns are delivered in a mix of long- and short-form TV and premium video content on OTT platforms, plus brand-safe apps and sites, over-indexing against a targeted audience segment built using insights from aggregated Comcast data and third-party data at the full market or zone level
22. Content Targeting: Campaigns are delivered to specifically selected networks in non-skippable, full episodic programming on VOD, OTT and TV Everywhere apps and sites within a selected geography - full market, zone or zip code (available on an exception basis)
23. Other Verified: Verified impressions served on the relevant dimension (example device, content/brands) that cannot be reported due to data privacy limitations.
24. Unique HHs: Estimated total number of households exposed to the Ad.
25. Frequency: Estimated average number of times a unique household was exposed to the Ad.
26. Unique HHs and FrequencyMethodology: Comcast subscriber HH ad exposure data is overlaid with Tapad ID graph to extrapolate missing data.
4
January 6 – February 25, 2024
Audience: Booming With Confidence Lifestyle Group
Geography: Custom Zip Code Zone
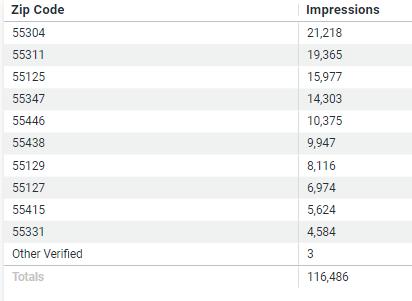
51% 27% 14% 7% Connected TV Set Top Box Mobile Desktop/Web Browser IMPRESSIONS GOAL IMPRESSIONS DELIVERED % TO GOAL COMPLETED VIEWS COMPLETED VIEWS % AVERAGE % VIEWED VIEWED HOURS HOUSEHOLDS REACHED FREQUENCY 115,298 116,486 101% 106,432 91% 93% 898 28,767 5.6
BY BRAND/CONTENT
DELIVERY BY PLATFORM DELIVERY
OTT/STREAMING CAMPAIGN PERFORMANCE REPORT 21.1% 12.3% 9.6% 9.5% 6.1% 5.1% 4.5% 4.5% 3.7% 3.2% 2.7% 2.1% 2.0% 1.8% 1.4% 1.2% 1.0% 1.0% 1.0% 1.0% Paramount StreamingNews Paramount StreamingSports XUMOAudience News Paramount StreamingEntertainment Pluto TV X1Comcast HGTV Investigation Discovery History Channel Food Network Lifetime Discovery Channel CNN TLC Paramount TBS TNT Travel Channel Animal Planet AMC NBC News
CLOSET FACTORY MINNEAPOLIS
CLOSET FACTORY MINNEAPOLIS
2
CLOSET FACTORY MINNEAPOLIS
3
Impression Goal: Total Impressions booked for the entire flight of the selected campaign(s)
2. Impressions Delivered: Each instance that the ad was served to a user as defined by the IAB
3. % of Impression Goal: This calculation displays as a percentage of the Impressions Delivered against the Impression Goal for the campaign(s) selected
4. Completed Views: Total number of views of the end of the video ad
5. Completed Views %: This calculation displays as a percentage of the number of views of the end of the ad against the impressions delivered
6. Viewed 75%: This calculation displays as a percentage of the number of views of the 3/4th of the duration of the ad against the impressions delivered
7. Viewed 50%: This calculation displays as a percentage of the number of views of the 1/2 of the duration of the ad against the impressions delivered
8. Viewed 25%: This calculation displays as a percentage of the number of views of the 1/4th of the duration of the ad against the impressions delivered
9. Avg % Viewed: This calculation takes the average of all viewing durations displayed as a percentage
10. Viewed Mins: This calculation shows the cumulative minutes viewed of the ad over the time period selected
11. Platform: A set of devices that support content viewing, through which Comcast delivers advertising
12. CTV: (Connected TV) An internet-enabled device used to watch content on television screen. Examples include gaming consoles, streaming sticks
13. Web Browser: Verified impressions served on web browser, when the device is not mappable. Could include desktop, TV, mobile
14. Mobile: Verified impressions served on a mobile web browser or a mobile in-app experience
15. Desktop: Verified impressions served on any application including web browser on desktop
16. STB: (Set-Top Box) Verified impressions served on a device used in the home to watch on-demand content. This could include Xfinity and other affiliate cable subscription services
17. Delivery by Time: This calculation shows the Impressions delivered throughout the time period selected. For example by hour (displayed in Eastern Time) or day of week
18. FEP Geo Targeting: Campaigns are delivered in non-skippable, full episodic programming on VOD, OTT and TV Everywhere apps and sites within a selected geography - full market, zone or zip code (available on an exception basis)
19. FEP Audience Targeting: Campaigns are delivered in non-skippable, full episodic programming on VOD, OTT and TV Everywhere apps and sites, over-indexing against a targeted audience segment built using insights from aggregated Comcast data and blue-chip third-party data at the full market or zone level
20. TV Audience Targeting: Campaigns are primarily delivered within full episodic programming, supplemented by long- and short-form TV content across VOD, OTT and TV Everywhere apps and sites, over-indexing against a targeted audience segment built using insights from aggregated Comcast data and third-party data at the full market or zone level
21. TV & Premium Video Audience Targeting: Campaigns are delivered in a mix of long- and short-form TV and premium video content on OTT platforms, plus brand-safe apps and sites, over-indexing against a targeted audience segment built using insights from aggregated Comcast data and third-party data at the full market or zone level
22. Content Targeting: Campaigns are delivered to specifically selected networks in non-skippable, full episodic programming on VOD, OTT and TV Everywhere apps and sites within a selected geography - full market, zone or zip code (available on an exception basis)
23. Other Verified: Verified impressions served on the relevant dimension (example device, content/brands) that cannot be reported due to data privacy limitations.
24. Unique HHs: Estimated total number of households exposed to the Ad.
25. Frequency: Estimated average number of times a unique household was exposed to the Ad.
26. Unique HHs and FrequencyMethodology: Comcast subscriber HH ad exposure data is overlaid with Tapad ID graph to extrapolate missing data.
4
STREAMING RECAP
January 1 – February 25, 2024
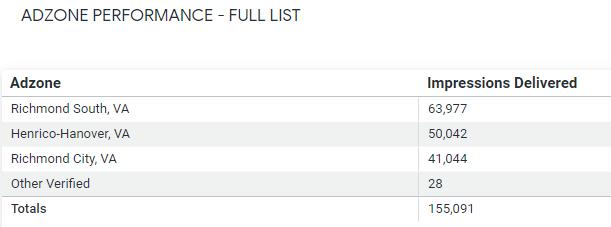
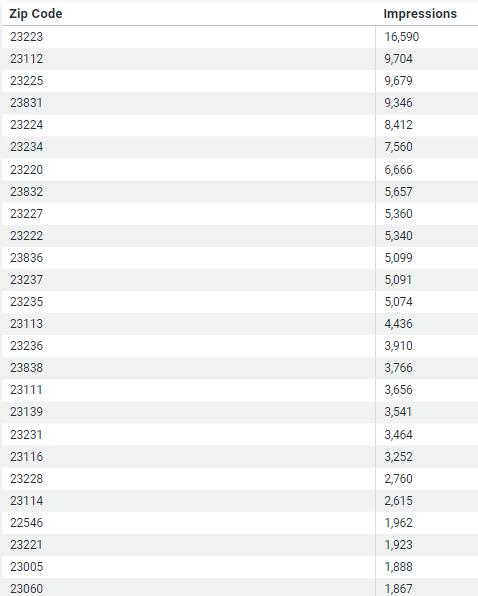
Zones: Chesterfield, Henrico/Hanover & Richmond City
Audiences: Booming With Confidence; HHI $200K+

45% 46% 5% Connected TV Set Top Box Mobile IMPRESSIONS GOAL IMPRESSIONS DELIVERED % TO GOAL COMPLETED VIEWS COMPLETED VIEWS % AVERAGE % VIEWED UNIQUE HOUSEHOLDS REACHED FREQUENCY VIEWED HOURS 150,656 155,091 102% 143,770 93% 93% 50,256 4.4 1,206
BY PLATFORM
BY BRAND/CONTENT
DELIVERY
DELIVERY
CLOSET FACTORY RICHMOND 14.0% 11.9% 6.9% 6.6% 6.0% 5.1% 5.1% 4.1% 3.5% 3.2% 2.9% 2.9% 2.8% 2.7% 2.4% 2.1% 1.9% 1.9% 1.3% 1.3% Pluto TV X1Comcast XUMOAudience News HGTV History Channel Investigation Discovery Lifetime AETV Food Network Paramount StreamingNews Paramount StreamingSports Paramount StreamingEntertainment ESPN Discovery Channel CNN TLC Travel Channel TBS TNT OWN Magnolia Network Source: iVerify Reporting 12/30/2019 – 3/29/2020. Reference Appendix, Definitions & Methodologies section for calculation details on various metrics
CLOSET FACTORY – RICHMOND MARKET
INSIGHTS
CLOSET FACTORY – RICHMOND MARKET
CLOSET FACTORY – RICHMOND MARKET

January
Audiences: Booming With Confidence; HHI $200K+
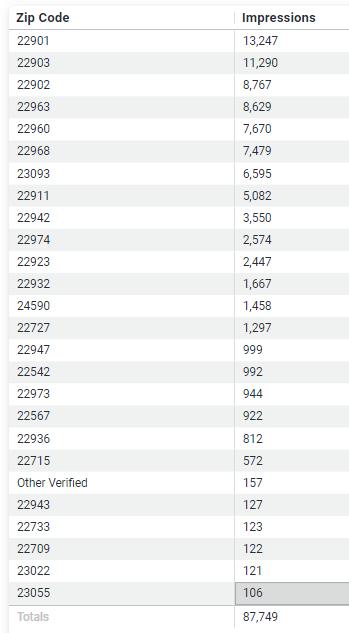
62% 26% 8% Connected TV Set Top Box Mobile IMPRESSIONS GOAL IMPRESSIONS DELIVERED % TO GOAL COMPLETED VIEWS COMPLETED VIEWS % AVERAGE % VIEWED UNIQUE HOUSEHOLDS REACHED FREQUENCY VIEWED HOURS 86,148 87,749 102% 81,590 93% 94% 18,845 6.6 686 DELIVERY BY PLATFORM DELIVERY BY BRAND/CONTENT
RECAP CLOSET FACTORY RICHMOND – CHARLOTTESVILLE DMA 25.3% 8.7% 7.0% 5.3% 4.9% 4.3% 3.7% 3.6% 3.4% 3.0% 3.0% 2.6% 2.6% 2.5% 2.3% 2.3% 1.8% 1.4% 1.2% 1.2% XUMOAudience News Newsy Paramount StreamingNews History Channel Paramount StreamingSports Investigation Discovery AETV NBC News Paramount StreamingEntertainment CNN HGTV Lifetime Pluto TV X1Comcast Fox News Discovery Channel Food Network ESPN TLC Travel Channel TBS Source: iVerify Reporting 12/30/2019 – 3/29/2020. Reference Appendix, Definitions & Methodologies section for calculation details on various metrics
1 – February 25, 2024 STREAMING
CLOSET FACTORY – CHARLOTTESVILLE MARKET
INSIGHTS
CLOSET FACTORY – CHARLOTESVILLE MARKET

January
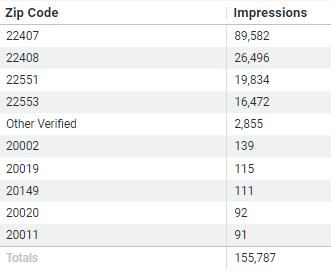
63% 19% 13% Connected TV Set Top Box Mobile IMPRESSIONS GOAL IMPRESSIONS DELIVERED % TO GOAL COMPLETED VIEWS COMPLETED VIEWS % AVERAGE % VIEWED UNIQUE HOUSEHOLDS REACHED FREQUENCY VIEWED HOURS 152,652 155,787 102% 142,016 91% 92% 28,784 7.6 1,198 DELIVERY BY PLATFORM DELIVERY BY BRAND/CONTENT
1 – February 25, 2024
RECAP CLOSET FACTORY RICHMOND – SPOTSYLVANIA/FREDERICKSBURG 15.6% 9.0% 6.3% 5.2% 5.1% 5.0% 4.8% 4.5% 3.9% 3.5% 3.4% 3.3% 2.8% 2.7% 2.3% 1.8% 1.8% 1.7% 1.5% 1.1% XUMOAudience News Paramount StreamingNews Paramount StreamingEntertainment Newsy CNN Pluto TV X1Comcast Paramount StreamingSports Investigation Discovery Fox News AETV History Channel Food Network HGTV Lifetime ESPN Discovery Channel NBC News TLC Comedy Central VizioAudience Homeowners Source: iVerify Reporting 12/30/2019 – 3/29/2020. Reference Appendix, Definitions & Methodologies section for calculation details on various metrics Audiences: News Content; HHI $200K+; Flourishing Families; New Homeowner Last 12 Months
STREAMING
CLOSET FACTORY – SPOTSYLVANIA/FREDERICKSBURG
INSIGHTS
CLOSET FACTORY – SPOTSYLVANIA/FREDERICKSBURG

11 THANK YOU! Leslie Libby Strategic Advertising & Media Partner Leslie_Libby@comcast.com (804) 292-5242
STREAMING RECAP
January 1 – February 25, 2024
Zones: Chesterfield, Henrico/Hanover & Richmond City
Audiences: Booming With Confidence; HHI $200K+
45% 46% 3% Connected TV Set Top Box Web IMPRESSIONS GOAL IMPRESSIONS DELIVERED % TO GOAL COMPLETED VIEWS COMPLETED VIEWS % AVERAGE % VIEWED UNIQUE HOUSEHOLDS REACHED FREQUENCY VIEWED HOURS 150,656 155,091 102% 143,770 93% 93% 50,256 4.4 1,206
BY PLATFORM
BY BRAND/CONTENT
DELIVERY
DELIVERY
CLOSET FACTORY RICHMOND 14.0% 11.9% 6.9% 6.6% 6.0% 5.1% 5.1% 4.1% 3.5% 3.2% 2.9% 2.9% 2.8% 2.7% 2.4% 2.1% 1.9% 1.9% 1.3% 1.3% Pluto TV X1Comcast XUMOAudience News HGTV History Channel Investigation Discovery Lifetime AETV Food Network Paramount StreamingNews Paramount StreamingSports Paramount StreamingEntertainment ESPN Discovery Channel CNN TLC Travel Channel TBS TNT OWN Magnolia Network Source: iVerify Reporting 12/30/2019 – 3/29/2020. Reference Appendix, Definitions & Methodologies section for calculation details on various metrics
CLOSET FACTORY – RICHMOND MARKET
INSIGHTS
CLOSET FACTORY – RICHMOND MARKET
January
Audiences: Booming With Confidence; HHI $200K+
62% 26% 8% Connected TV Set Top Box Mobile IMPRESSIONS GOAL IMPRESSIONS DELIVERED % TO GOAL COMPLETED VIEWS COMPLETED VIEWS % AVERAGE % VIEWED UNIQUE HOUSEHOLDS REACHED FREQUENCY VIEWED HOURS 86,148 87,749 102% 81,590 93% 94% 18,845 6.6 686 DELIVERY BY PLATFORM DELIVERY BY BRAND/CONTENT
RECAP CLOSET FACTORY RICHMOND – CHARLOTTESVILLE DMA 25.3% 8.7% 7.0% 5.3% 4.9% 4.3% 3.7% 3.6% 3.4% 3.0% 3.0% 2.6% 2.6% 2.5% 2.3% 2.3% 1.8% 1.4% 1.2% 1.2% XUMOAudience News Newsy Paramount StreamingNews History Channel Paramount StreamingSports Investigation Discovery AETV NBC News Paramount StreamingEntertainment CNN HGTV Lifetime Pluto TV X1Comcast Fox News Discovery Channel Food Network ESPN TLC Travel Channel TBS Source: iVerify Reporting 12/30/2019 – 3/29/2020. Reference Appendix, Definitions & Methodologies section for calculation details on various metrics
1 – February 25, 2024 STREAMING
CLOSET FACTORY – CHARLOTTESVILLE MARKET
INSIGHTS
CLOSET FACTORY – CHARLOTESVILLE MARKET
January
63% 19% 13% Connected TV Set Top Box Mobile IMPRESSIONS GOAL IMPRESSIONS DELIVERED % TO GOAL COMPLETED VIEWS COMPLETED VIEWS % AVERAGE % VIEWED UNIQUE HOUSEHOLDS REACHED FREQUENCY VIEWED HOURS 152,652 155,787 102% 142,016 91% 92% 28,784 7.6 1,198 DELIVERY BY PLATFORM DELIVERY BY BRAND/CONTENT
1 – February 25, 2024
RECAP CLOSET FACTORY RICHMOND – SPOTSYLVANIA/FREDERICKSBURG 15.6% 9.0% 6.3% 5.2% 5.1% 5.0% 4.8% 4.5% 3.9% 3.5% 3.4% 3.3% 2.8% 2.7% 2.3% 1.8% 1.8% 1.7% 1.5% 1.1% XUMOAudience News Paramount StreamingNews Paramount StreamingEntertainment Newsy CNN Pluto TV X1Comcast Paramount StreamingSports Investigation Discovery Fox News AETV History Channel Food Network HGTV Lifetime ESPN Discovery Channel NBC News TLC Comedy Central VizioAudience Homeowners Source: iVerify Reporting 12/30/2019 – 3/29/2020. Reference Appendix, Definitions & Methodologies section for calculation details on various metrics Audiences: News Content; HHI $200K+; Flourishing Families; New Homeowner Last 12 Months
STREAMING
CLOSET FACTORY – SPOTSYLVANIA/FREDERICKSBURG
INSIGHTS
CLOSET FACTORY – SPOTSYLVANIA/FREDERICKSBURG
10 THANK YOU! Leslie Libby Strategic Advertising & Media Partner Leslie_Libby@comcast.com (804) 292-5242
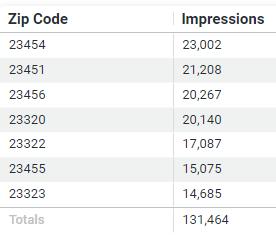
CLOSET FACTORY VA BEACH
January 4 – February 25, 2024
Audience: Booming With Confidence & Flourishing Families Lifestyle Groups
Geography: Custom Zip Code Zone
72% 19% 5% 5% Connected TV Mobile Desktop Web Browser DELIVERY BY PLATFORM DELIVERY BY BRAND/CONTENT
OTT/STREAMING CAMPAIGN PERFORMANE REPORT 17.7% 17.0% 15.4% 10.8% 7.9% 4.9% 3.8% 2.6% 2.0% 1.9% 1.8% 1.6% 1.5% 1.2% 1.2% 1.0% 1.0% 1.0% 1.0% 1.0% Paramount StreamingNews Paramount StreamingSports Paramount StreamingEntertainment XUMOAudience News Investigation Discovery CNN ESPN HGTV Food Network NBC News Discovery Channel TLC Lifetime Paramount History Channel Bravo ESPN2 AETV Animal Planet Travel Channel
IMPRESSIONS GOAL IMPRESSIONS DELIVERED % TO GOAL COMPLETED VIEWS COMPLETED VIEWS % AVERAGE % VIEWED VIEWED HOURS HOUSEHOLDS REACHED FREQUENCY 130,316 131,464 101% 117,914 90% 91% 1,001 40,350 4.6
CLOSET FACTORY VA BEACH
2
CLOSET FACTORY VA BEACH
3
1. Impression Goal: Total Impressions booked for the entire flight of the selected campaign(s)
2. Impressions Delivered: Each instance that the ad was served to a user as defined by the IAB
3. % of Impression Goal: This calculation displays as a percentage of the Impressions Delivered against the Impression Goal for the campaign(s) selected
4. Completed Views: Total number of views of the end of the video ad
5. Completed Views %: This calculation displays as a percentage of the number of views of the end of the ad against the impressions delivered
6. Viewed 75%: This calculation displays as a percentage of the number of views of the 3/4th of the duration of the ad against the impressions delivered
7. Viewed 50%: This calculation displays as a percentage of the number of views of the 1/2 of the duration of the ad against the impressions delivered
8. Viewed 25%: This calculation displays as a percentage of the number of views of the 1/4th of the duration of the ad against the impressions delivered
9. Avg % Viewed: This calculation takes the average of all viewing durations displayed as a percentage
10. Viewed Mins: This calculation shows the cumulative minutes viewed of the ad over the time period selected
11. Platform: A set of devices that support content viewing, through which Comcast delivers advertising
12. CTV: (Connected TV) An internet-enabled device used to watch content on television screen. Examples include gaming consoles, streaming sticks
13. Web Browser: Verified impressions served on web browser, when the device is not mappable. Could include desktop, TV, mobile
14. Mobile: Verified impressions served on a mobile web browser or a mobile in-app experience
15. Desktop: Verified impressions served on any application including web browser on desktop
16. STB: (Set-Top Box) Verified impressions served on a device used in the home to watch on-demand content. This could include Xfinity and other affiliate cable subscription services
17. Delivery by Time: This calculation shows the Impressions delivered throughout the time period selected. For example by hour (displayed in Eastern Time) or day of week
18. FEP Geo Targeting: Campaigns are delivered in non-skippable, full episodic programming on VOD, OTT and TV Everywhere apps and sites within a selected geographyfull market, zone or zip code (available on an exception basis)
19. FEP Audience Targeting: Campaigns are delivered in non-skippable, full episodic programming on VOD, OTT and TV Everywhere apps and sites, over-indexing against a targeted audience segment built using insights from aggregated Comcast data and blue-chip third-party data at the full market or zone level
20. TV Audience Targeting: Campaigns are primarily delivered within full episodic programming, supplemented by long- and short-form TV content across VOD, OTT and TV Everywhere apps and sites, over-indexing against a targeted audience segment built using insights from aggregated Comcast data and third-party data at the full market or zone level
21. TV & Premium Video Audience Targeting: Campaigns are delivered in a mix of long- and short-form TV and premium video content on OTT platforms, plus brand-safe apps and sites, over-indexing against a targeted audience segment built using insights from aggregated Comcast data and third-party data at the full market or zone level
22. Content Targeting: Campaigns are delivered to specifically selected networks in non-skippable, full episodic programming on VOD, OTT and TV Everywhere apps and sites within a selected geography - full market, zone or zip code (available on an exception basis)
23. Other Verified: Verified impressions served on the relevant dimension (example device, content/brands) that cannot be reported due to data privacy limitations. 2. Unique HHs: Estimated total number of households exposed to the Ad.
25. Frequency: Estimated average number of times a unique household was exposed to the Ad.
26. Unique HHs and FrequencyMethodology: Comcast subscriber HH ad exposure data is overlaid with Tapad ID graph to extrapolate missing data.
4