
2023
Parks&Recreation MasterPlan Grandview
MAYOR AND BOARD OF ALDERMAN
Leonard Jones - Mayor
Damon Randolph - Ward 1
Debbie Bibbs - Ward 1
Joe Runions - Ward 2
Dan Hartman - Ward 2
John T. Maloney - Ward 3

Thomas J. Rousey - Ward 3
CITY CLERK
Becky Schimmel - City Clerk
PARKS & RECREATION
Credits STEERING TEAM

Cemal Gungor
Dave McCumber
Kim Curtis
Rodney Schmidt
Sara Keleher
Douglas Wesselschmidt
Annette Turnbaugh
Rosalyn Sykes
Charles Iseman
Ron Graham
TJ Rousey
Andy Larson
Justin Wieberg
Luis Benavides
Liz Gordon
Jared Elbert - Parks & Recreation Director
Justin Wieberg - Business Development Manager

Andy Larson - Parks & Facilities Manager
Mike McLawhon - Asst. Parks Manager
Kenny Pulce - Recreation Coordinator
Dana Johnson - Aquatics Coordinator
Alyssa Cedro - Customer Care Supervisor
Luis Benavides - Fitness Coordinator
Kirk Decker
CONSULTANT TEAM
01 02 Recreation & Program Analysis.................................10 03 04 Community Engagement............75 05 Action Plan............................................100 Statistically Valid Survey Report A Public Engagement Notes B Demographics & Trends..................5 table of contents Appendix Park Inventory, Assessment, & Analysis.....................20
Introduction
PURPOSE
The purpose of this Parks Master Plan is to develop a community-supported comprehensive plan that provides guidance on parks in Grandview for the next 10 years. The Plan sets out to prioritize demands and opportunities, generate a strategic action plan, and guide policy development. Moreover, this Plan will create a clear set of goals and objectives providing direction to the Parks and Recreation Department, Park Board, and City Council.
PROCESS
The process for developing this Master Plan was a collaborative approach including input from the community, Parks and Recreation Staff, Steering Team, and the Consultant Team. The following tasks were included in development of this Plan:
• Data Gathering & Background Review
• Public Engagement
• Demographics and Trends Analysis
• Park Inventory, Assessment, and Analysis
• Park Concept Plans
• Level of Service Analysis and Mapping
• Recreation Programming Inventory & Analysis
• Action Plan
• Capital Improvement Cost Suggestions
Overview
Grandview is a community of 26,252 residents located in Jackson County, Missouri. The median age of Grandview residents is slightly younger than both the state and national figures at 35.7. Analysis of the City's demographic profile revealed some interesting population shifts that will be important for park facilities to respond to.
Community involvement guided the development of this Plan and extensive efforts were made to reach out in a variety of ways. Input from over 500 residents and users of Grandview parks influenced the recommendations found within this plan.
Using the expressed interests and desires of the community, Park Staff have created a vision they
can diligently and wisely allocate resources and tax dollars to implement. Future allocation of resources towards this vision should be commensurate with the growth of Grandview and the interests of its citizens.
RESULTS
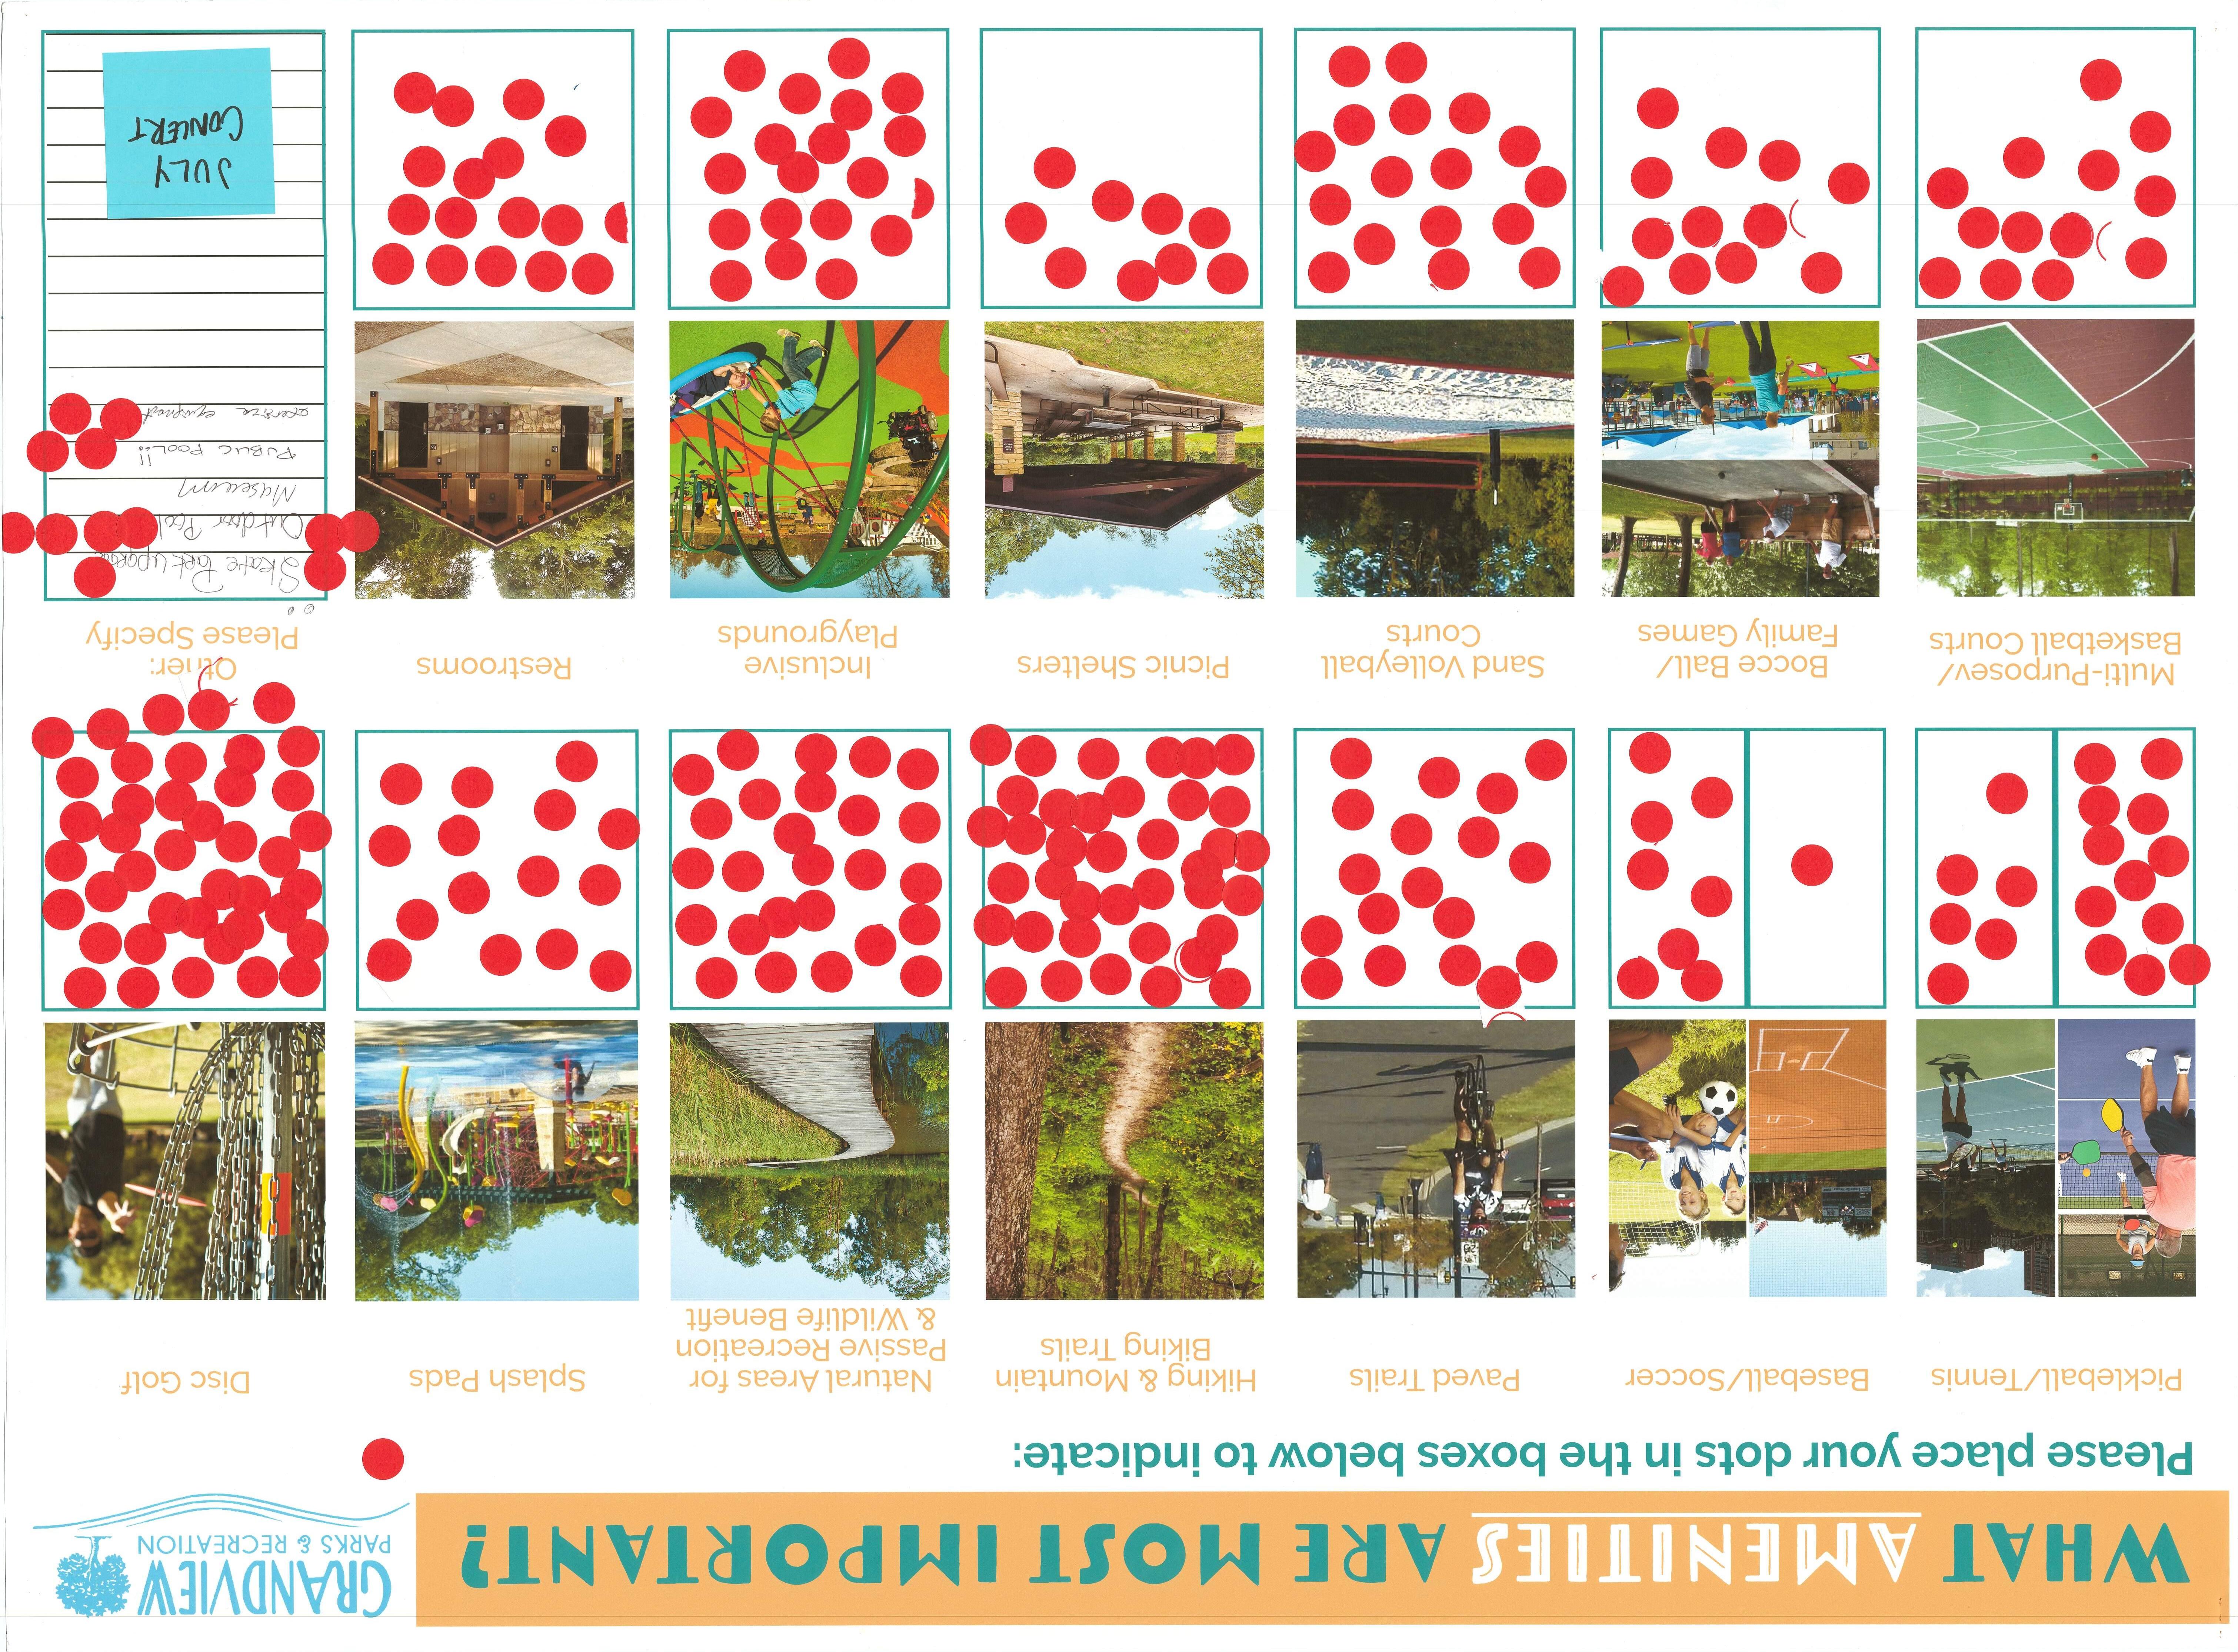
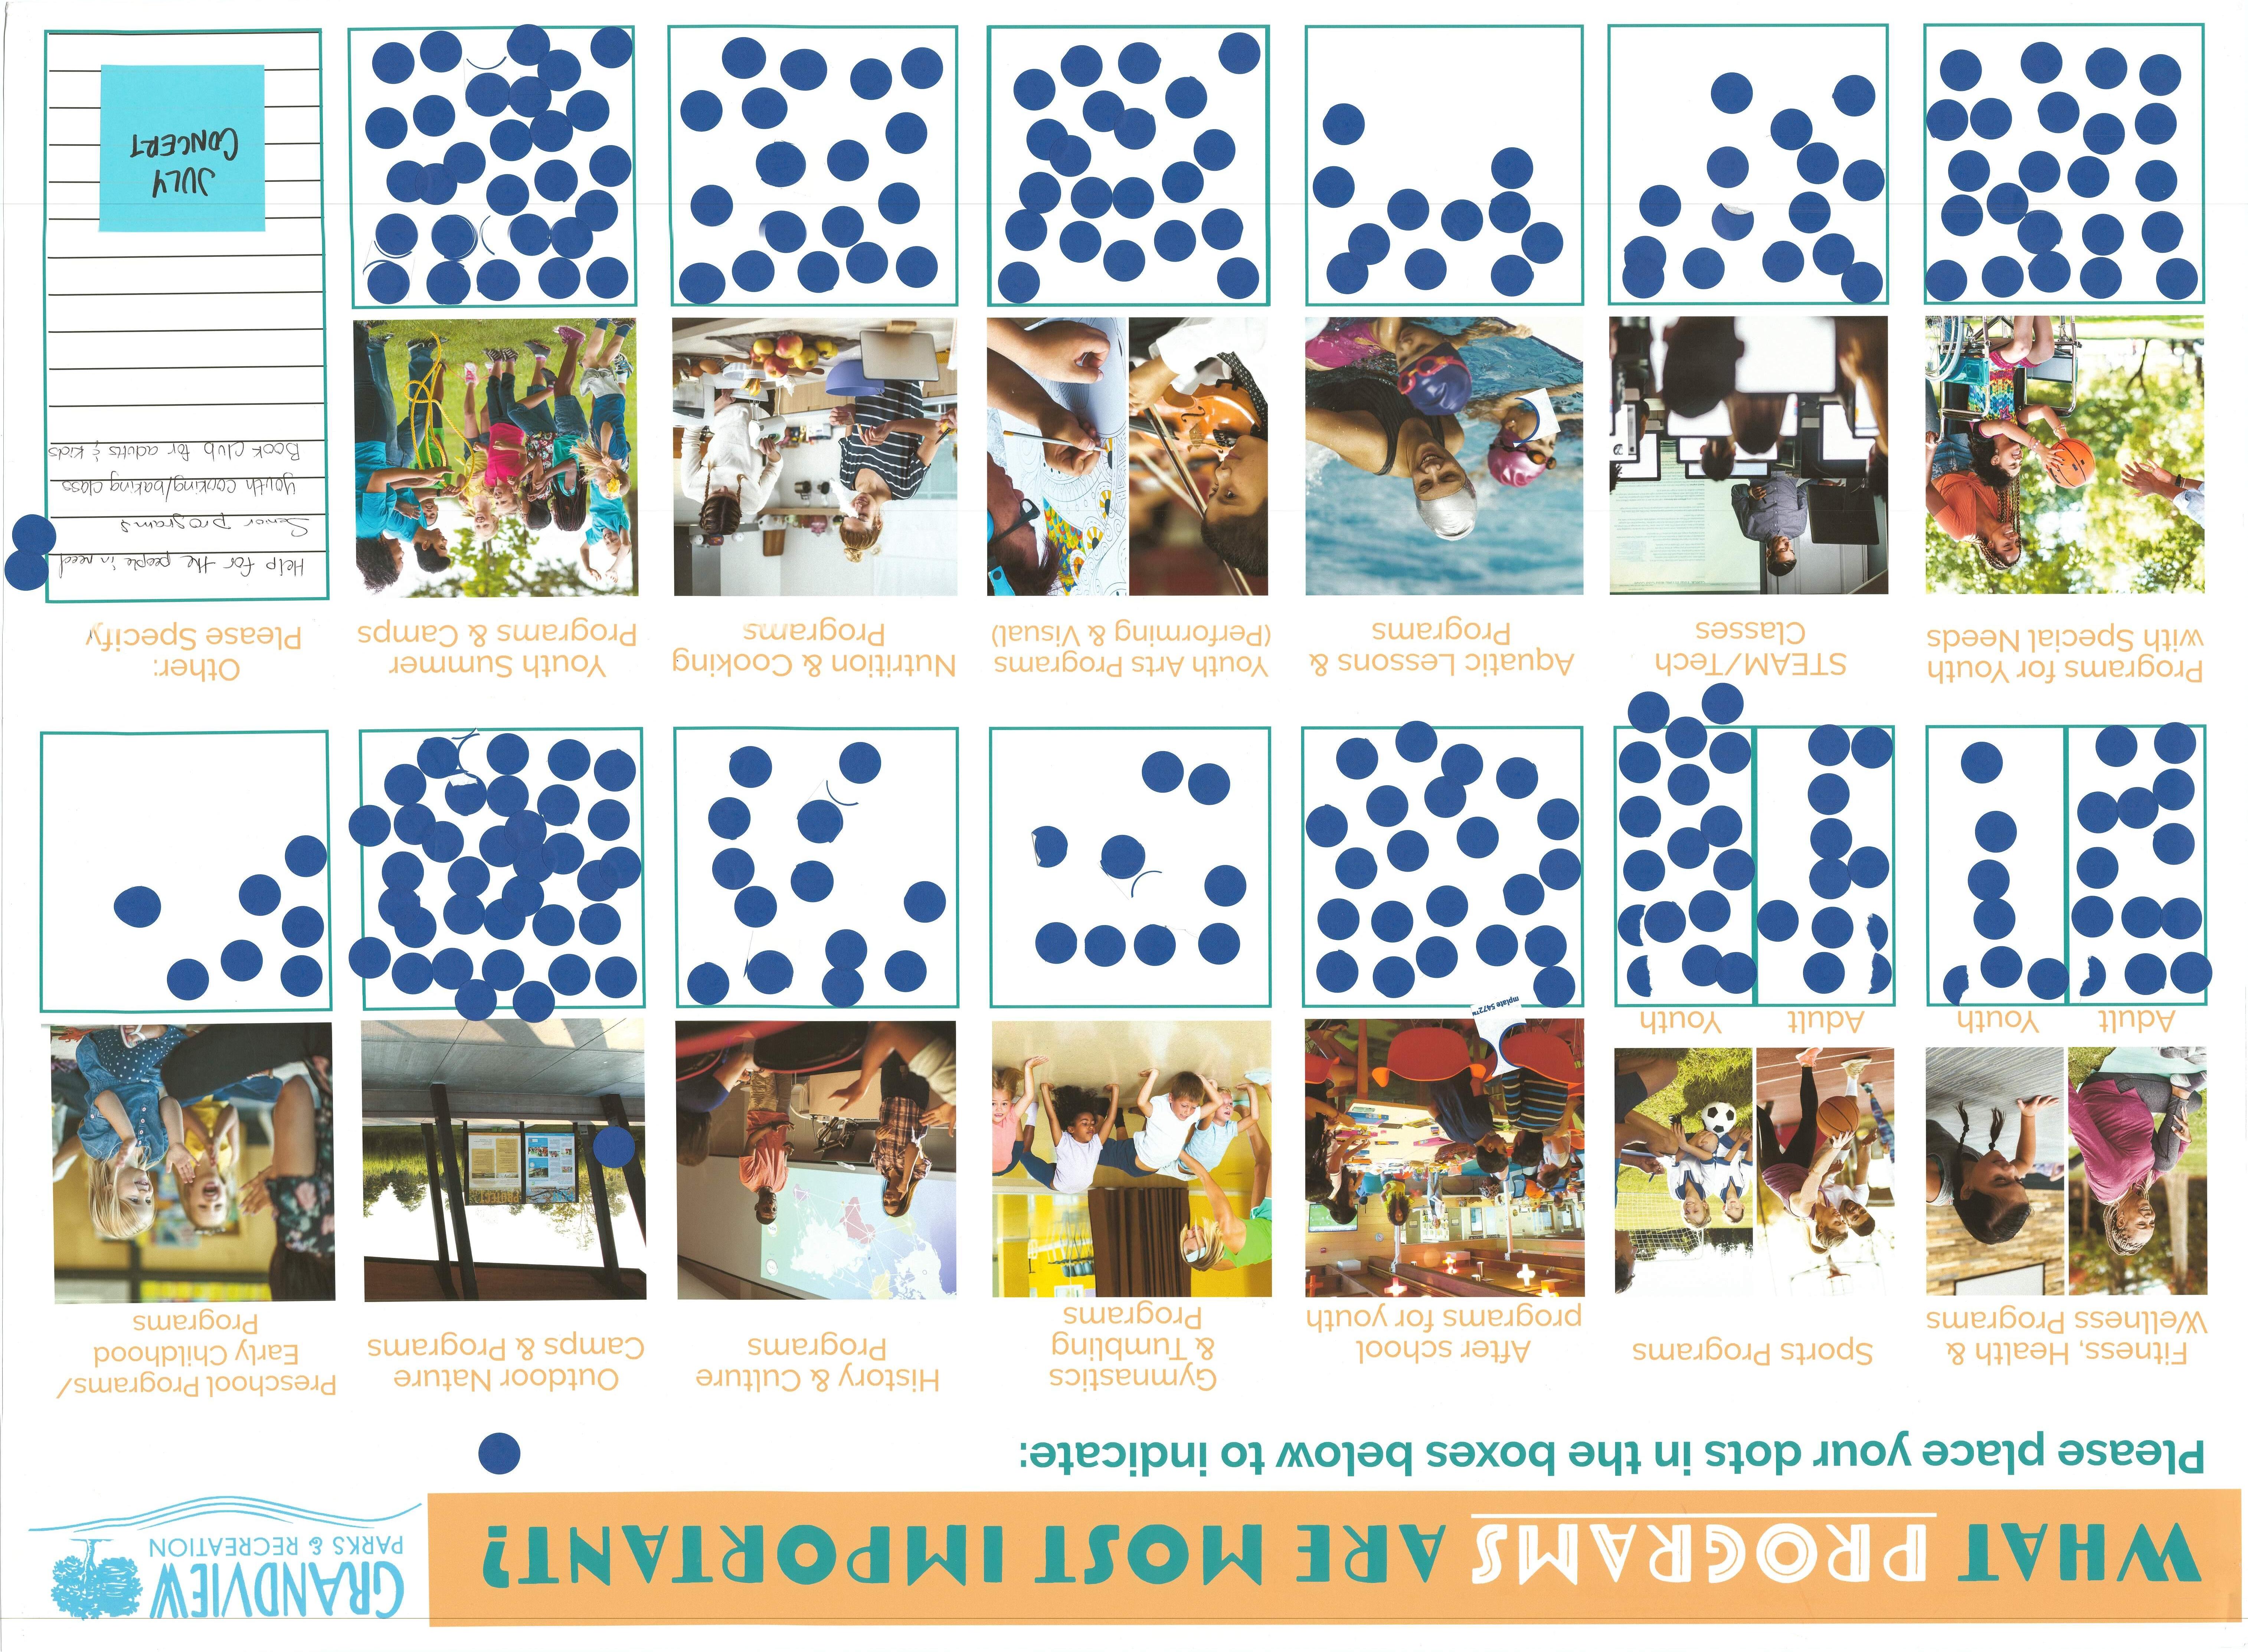
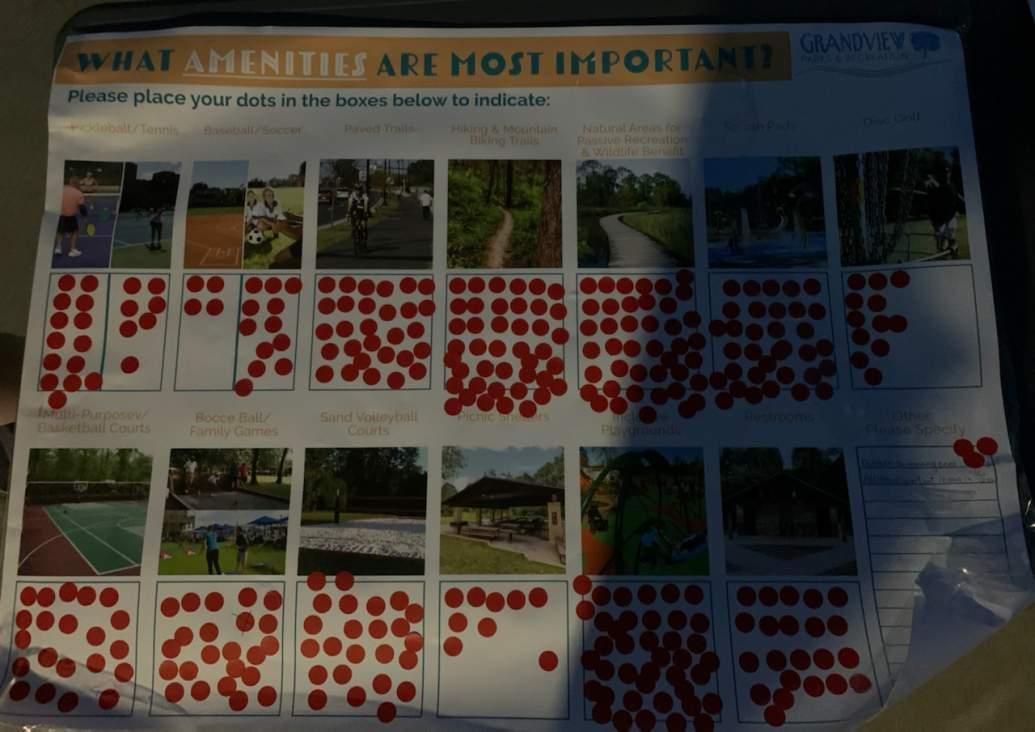
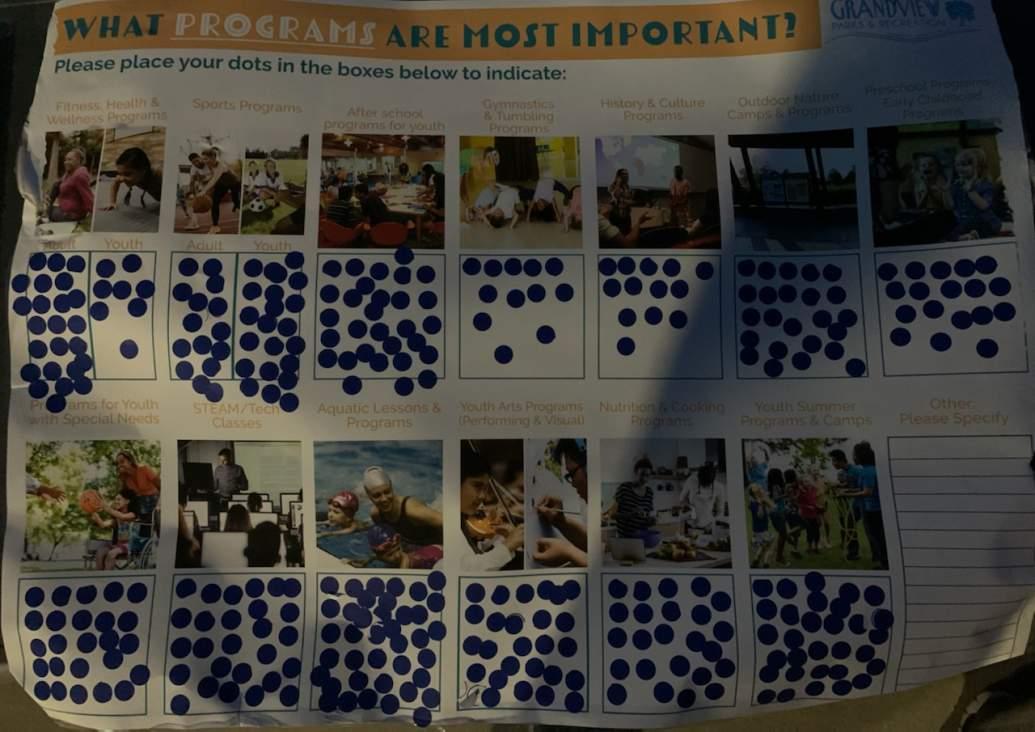
Results from the overall community engagement effort revealed a consistent and clear message about what residents would like to see prioritized in the coming years. Below are lists of the top 5 priorities, park amenities, and recreation programs that are most important to the community. Improvements in these areas are likely to have a positive impact on the greatest number of households:
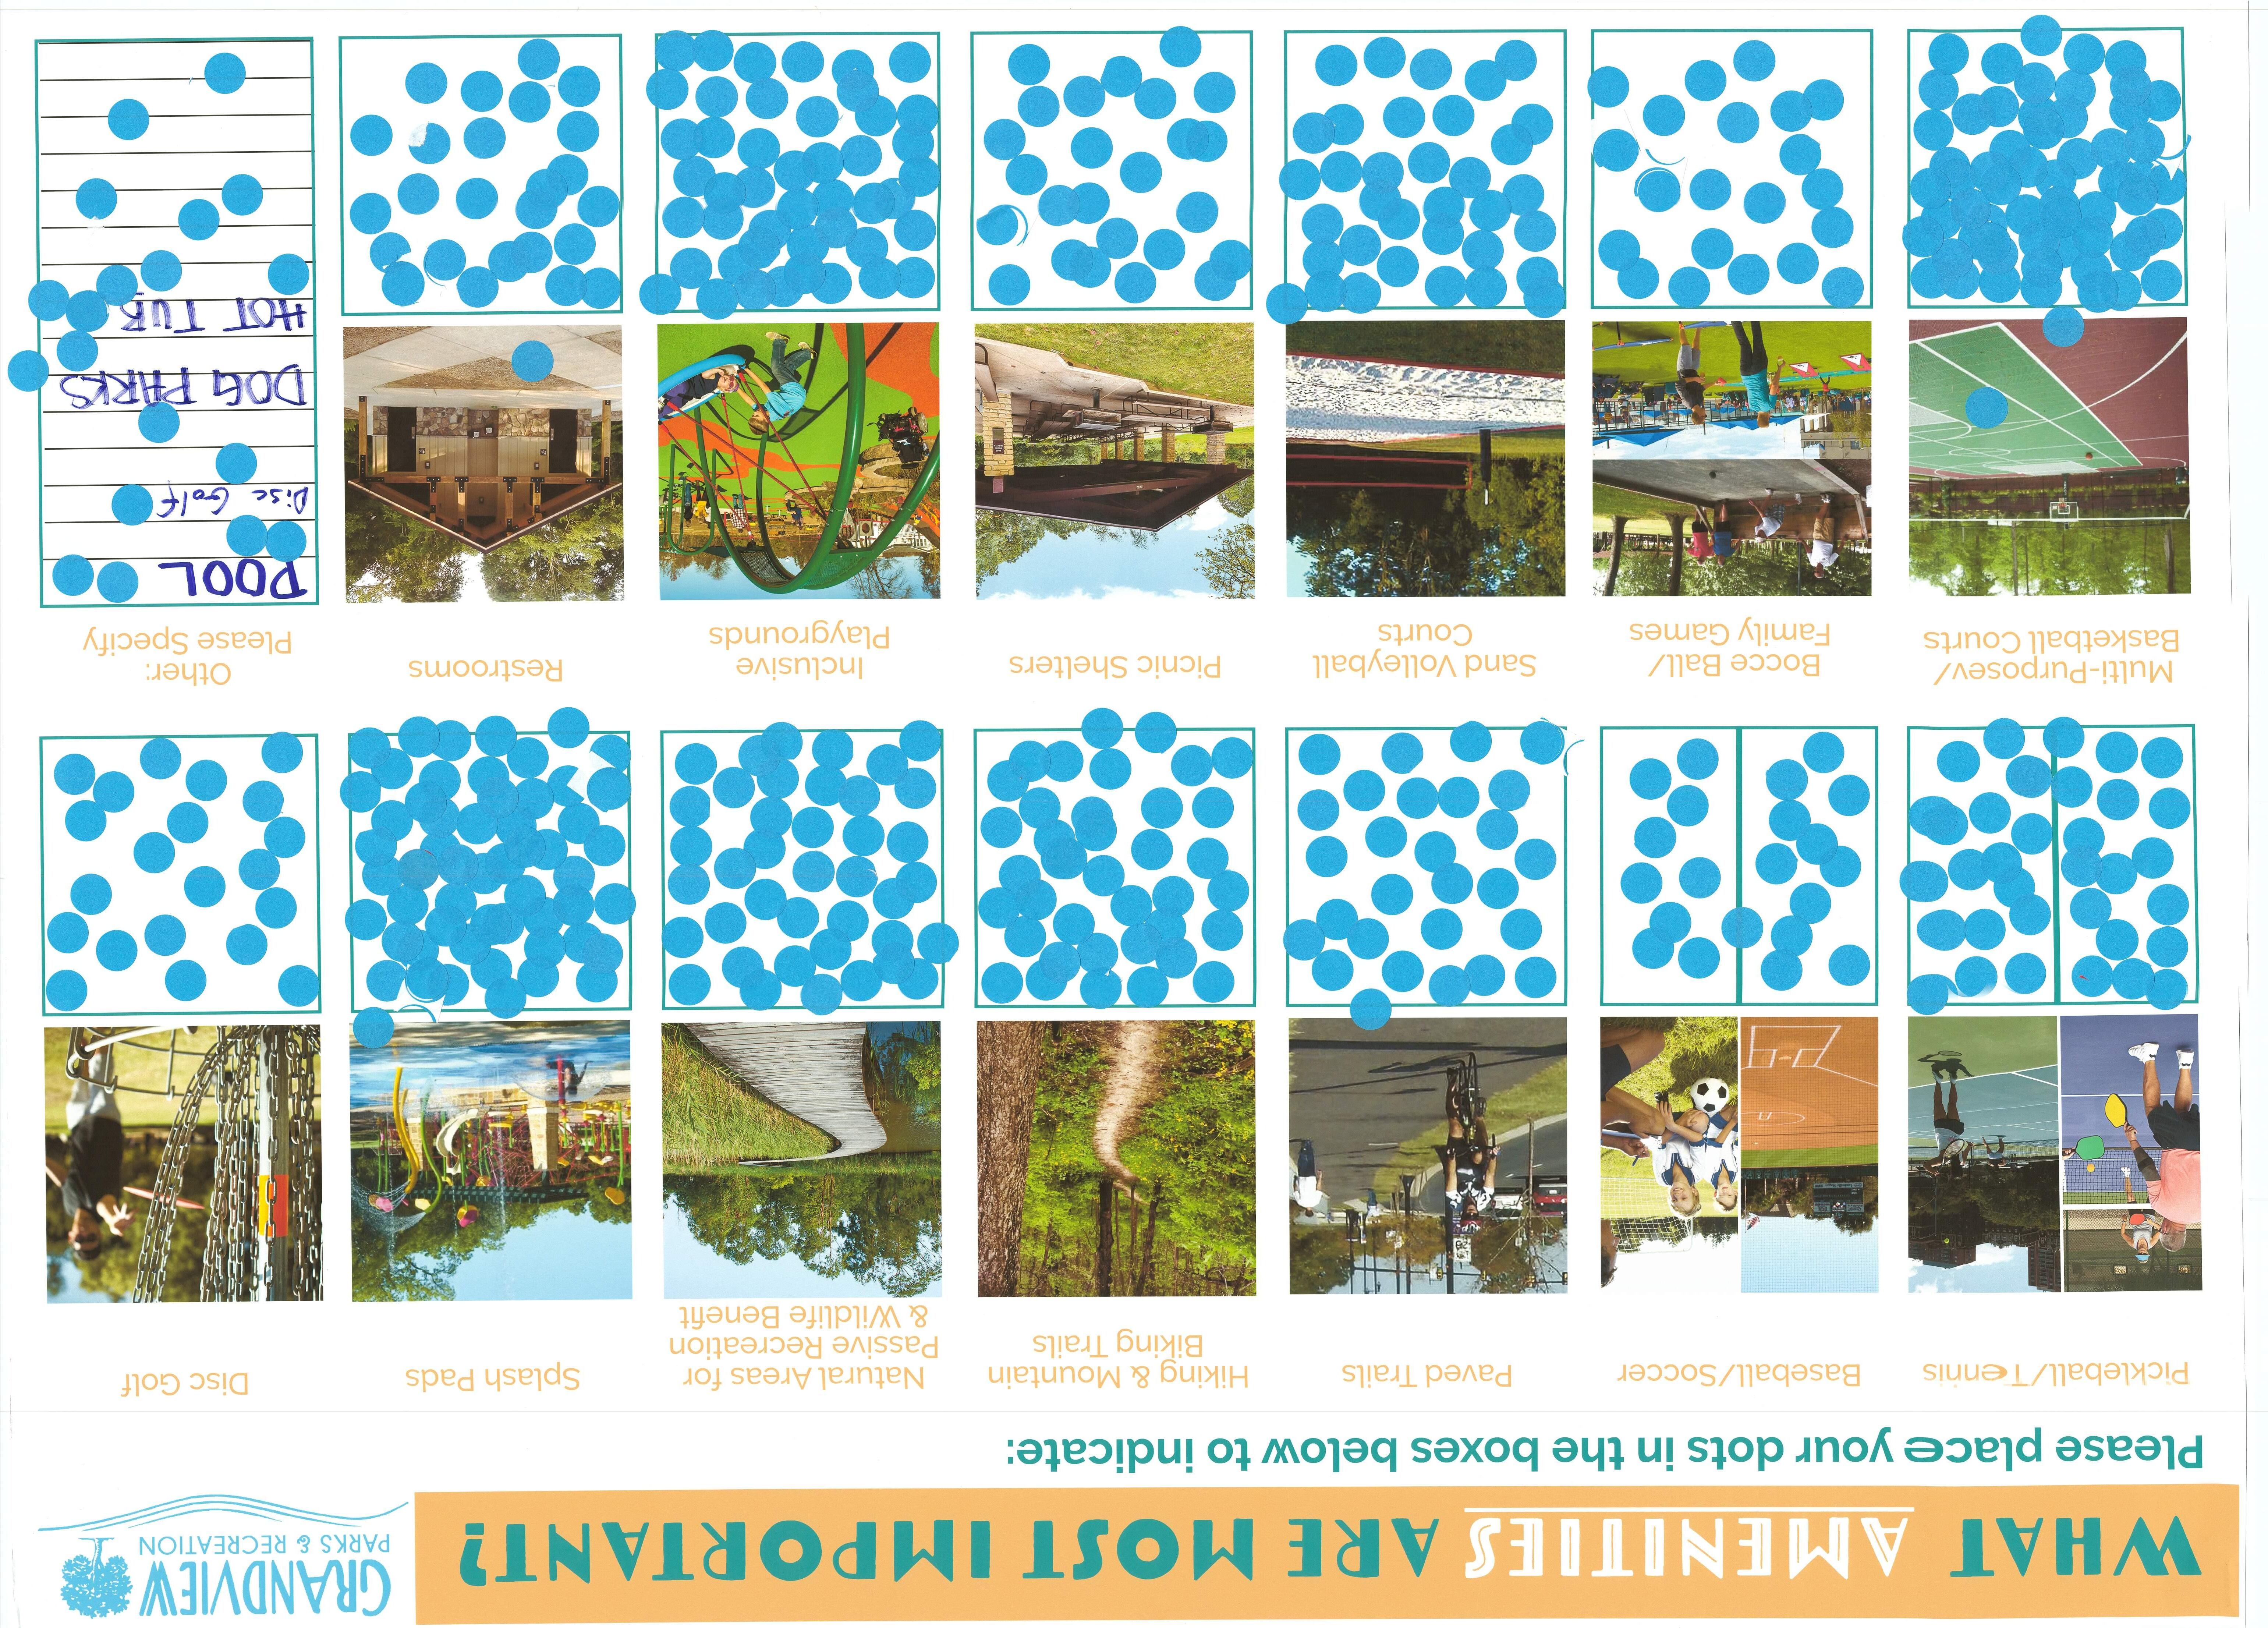
Park Amenities
1. Nature/hiking trails
2. Restrooms
3. Paved trails
4. Natural areas for passive recreation and wildlife benefit
5. Family games
Recreation Program Amenities
1. Adult fitness & wellness programs
2. Community special events
3. Senior health & wellness programs
4. Outdoor water recreation
5. Water fitness programs/lap swimming
Systemwide Priorities
1. Update aging amenities.
2. Enhance trail networks.
3. Improve the perception of security in parks.
4. Elevate recreation program services.
5. Add new park amenities.
1 High Level Maintenance
01 Demographics & Trends
Demographics
INTRODUCTION
The City of Grandview’s (the City) Parks and Recreation Department (Department) demographic profile was developed to provide an analysis of household and economic data in the area, helping to understand the historical and projected changes that may impact the community. The demographics analysis provides insight into the potential market for the Department’s recreation programs and services.
SOURCES
Data points throughout this report including population, age distribution, income, race/ ethnicity, and other household characteristics were sourced from Esri Business Analyst in November 2022. At the time of this report, Esri’s primary source for demographic information was the 2020 Census with estimates generated in July 2022. According to their website, Esri Business Analyst is “a solution that applies geographic information systems (GIS) to extensive demographic, consumer spending, and business data to deliver on-demand analysis.”
POPULATION
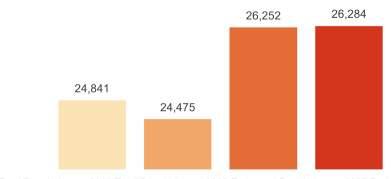
Grandview is MO’s 28th most populated City with an estimated 2022 population of 26,252. This is an increase from the 2010 population of 24,475; however, looking towards 2027 the population remains stable with an estimated population of 26,284. The compound annual growth rate between 2010 and 2022 was 7.2%. The estimated growth rate between 2022 and 2027 is 0.02%.
HOUSEHOLD INFORMATION
Analyzing the household characteristics within the City indicates that the area had a lower median income and more residents living below the poverty level than both MO and the U.S. The following facts (Esri 2022) demonstrate the key highlights regarding household information compared to MO and the U.S.
• The City’s median household income was $53,734, lower than MO ($61,811) and the U.S. ($72,414).
• The City’s average home value was $175,317, significantly less than the average home value in MO ($247,563) and the U.S. ($347,078).
• 15.3% of the City’s population lived below the poverty level in 2020, compared to 12.9% in MO and 12.5% in the U.S.
• The average household size in the City (2.43) was just between MO the (2.41) and the U.S. (2.55).
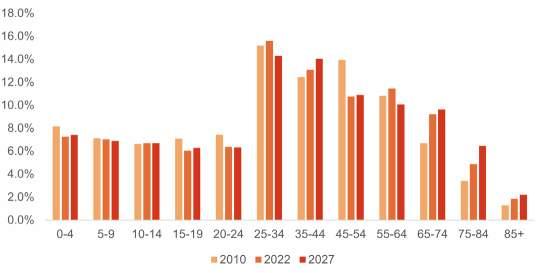
AGE
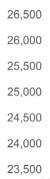
The median age in the City in 2022 was 36 years, which is also the expected median age in 2027. Age cohorts are fairly evenly distributed (between 20% and 27%) among youth (0 to 19 years), young adults (20 to 34 years), adults (35 to 54 years), and active adults (55 to 74 years).
3 High Level Maintenance
Figure 2: Age Distribution
2000 Total Population 2010 Total Population 2022 Total Population 2027 Total Population
Figure 1: Historical and Projected Population
Hispanic Origin
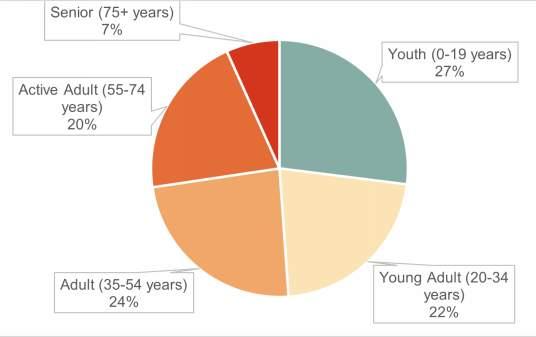
According to the U.S. Census, Hispanic origin differs from race/ethnicity because it “…can be viewed as the heritage, nationality, lineage, or country of birth of the person or the person’s parents or ancestors before arriving in the United States. People who identify as Hispanic, Latino, or Spanish may be any race.” As of 2022, 13.5% of Grandview residents identify as Hispanic, which is an increase from 9.7% in 2010. This is twice MO’s 2022 Hispanic population of 5%.
Between 2010 and 2027 there was a 4% decrease of residents ages 45 to 54 years old. The age distribution change from 2010 to 2027 will be minimal, apart from residents 65 and over which is expected to increase by 2%.
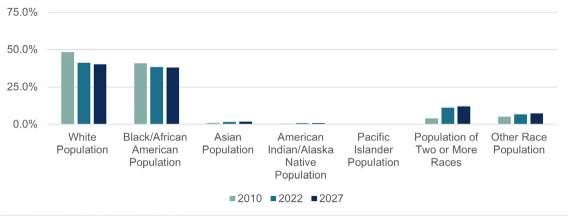
RACE & DIVERSITY
The City has experienced a 7.2% decrease in white residents from 2010 to 2022, making up 41.2% as of 2022. Among the non-white populations, Black or African American residents make up 38.4%, residents of two or more races make up 11.2%, and 6.7% of residents identify as being another race population (not listed in Figure 5).
TRENDS ANALYSIS
The following sections summarize regional and national trends that are relevant to the City. The information contained in this report can be used by Department staff when planning new programs, considering additions to parks and new park amenities, and creating the annual budget and capital improvement plan. Understanding trends can help an organization reach new audiences. and determine where to direct additional data collection efforts within an organization.
A wide variety of sources were used in gathering information on trends for this report, including:
• American College of Sports Medicine (ACSM)
• American Council on Exercise (ACE)
• Forbes
• Harris Poll Results/The Stagwell Group
• Impacts Experience
• National Recreation and Park Association (NRPA)
• The Aspen Institute
• The Learning Resource Network (LERN)
• The New York Times
4 High Level Maintenance
Figure 4: Adult Distribution Change
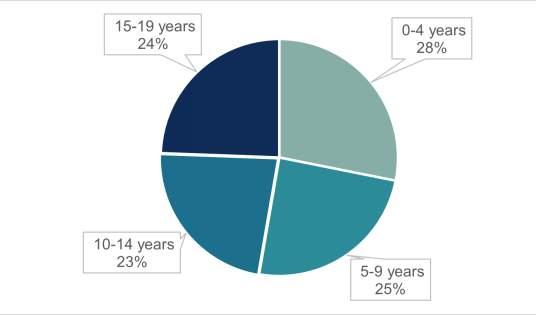
Figure 3: Youth Age Distribution
Figure 5: Change in Population Race/Ethinicity
Figure 6: Hispanic Population Growth
• The Outdoor Industry Association
• The Society of Health and Physical Educators (SHAPE America)
• USA Pickleball website
ESTIMATED LOCAL PARTICIPATION
This section showcases the participation in fitness activities, outdoor recreation, and sports teams for adults 25 and older in the area compared to the state. Activity participation and consumer behavior are based on a specific methodology and survey data to makeup what Esri terms “Market Potential Index.”
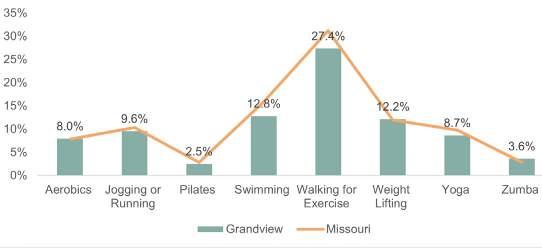
Regarding fitness activities, walking for exercise was the most popular, with 27.4% of adult participation. Swimming followed next, with 12.8% of adult participation. Weightlifting followed closely behind with 12.2% of adult participation.
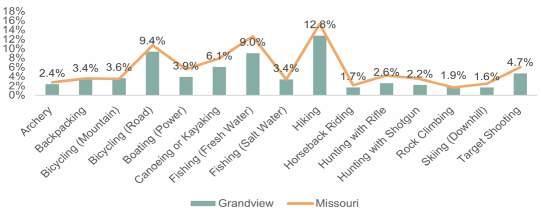
The most popular sport in the City among adults in
in 2022 was hiking (12.8%) and bicycling (9.4%) followed closely by freshwater fishing (9%).
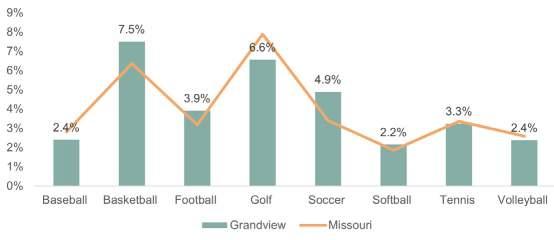
The most popular leisure activities among City
2022 was basketball with 7.5% adult participation. The other two most popular spots were golf (6.6%) and soccer (4.9%).
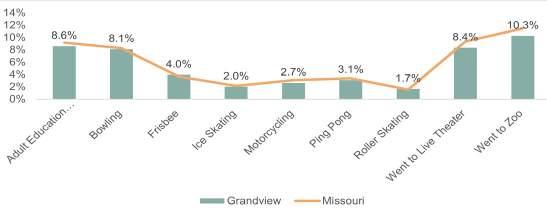
The most popular outdoor recreation activities
adults included visiting the zoo (10.3%), attending an adult education course (8.6%), and going to a live theater show (8.4%).
Recreation Expenditures
It was estimated that in 2022, the average expenditure on membership fees for social, recreation, and/or health clubs was an estimated $184.53, totaling over $1.9 million for the City. Expenses for sports, recreation, and exercise equipment totaled over $1.4 million with an average of $134.10 per person. Additional information regarding amounts spent on fees for participant sports, recreational lessons, tickets to parks or museums, and bicycles are detailed in Table 1. The total amount spent by City residents is included in Table 2.
5 High Level Maintenance
Figure 7: Adult Participation for Fitness Activities
Figure 8: Adult Participation in Sports
Figure 9: Adult Participation in Outdoor Rec Activities
Figure 10: Adult Participation in Leisure Activities
AQUATIC TRENDS
Pool Design
Municipal pools have moved away from the traditional rectangular shape, and instead have shifted to facilities that include zero-depth entry, play structures with multiple levels, spray features, small-to-medium slides, and separate play areas segmented by age/ability.
Indoor warm water therapy pools continue to grow in popularity with the aging population. Creating a shallow space for low-impact movement at a comfortable temperature enhances recreational programming options. “Endless” or current pools that are small and allow for “low-impact, highintensity movement” are becoming popular, as well.
Water Fitness
The concept of water exercise is a popular trend in the fitness industry, with many new programs emerging such as aqua yoga, aqua Zumba, aqua spin, aqua step, and aqua boot camp. Whether recovering from an injury, looking for easeof-movement exercise for diseases such as arthritis, or simply shaking up a fitness routine, all demographics are gravitating toward the water for fitness. Partnerships can be important for parks and recreation agencies, such as working with hospitals to accommodate cardiac patients and those living with arthritis or multiple sclerosis.
Youth Programming
Swim lessons generally include the most significant number of participants and highest revenues for public pool operations. Programs can be offered for all ages and levels, in private, semi-private, and group formats. Access to swimming pools is a popular amenity for summer day camp programs, too.
Spray Parks
Spray parks (also known as spray grounds or spray pads) are now a common replacement for aging swimming pools, particularly because it provides the community with an aquatic experience without the high cost of traditional pools. Spray parks do not require high levels of staffing, require only minimal maintenance, and offer a no-cost (or low-cost) alternative to a swimming pool or aquatic complex. A spray park typically appeals to children ages 2 –12 and can be a stand-alone facility in a community or incorporated inside a family aquatic center.
6 High Level Maintenance Category of Recreational Expenditure City of Grandview State of Missouri Membership Fees for Social/ Recreational/Health Clubs $184.53 $228.26 Fees for Participant Sports Exclusding Tips $88.11 $105.44 Tickets to Parks or Museums $26.09 $31.64 Fees for Recreational Lessons $98.19 $119.54 Sports/Rec/Exercise Equipment $134.10 $180.78 Bicycles $23.09 $29.47 Admission to Sports Events Excluding Trips $45.42 $60.37 Camping Equipment $17.04 $18.82 Hunting and Fishing Equipment $35.15 $54.16 Other Sports Equipment $5.24 $9.30 Water Sports Equipment $5.43 $6.64
Category of Recreational Expenditure City of Grandview State of Missouri Membership Fees for Social/ Recreational/Health Clubs $1,980,367 $570,298,316 Fees for Participant Sports Exclusding Tips $945,649 $263,422,124 Tickets to Parks or Museums $280,039 $79,044,288 Fees for Recreational Lessons $1,053,791 $298,657,055 Sports/Rec/Exercise Equipment $1,439,171 $451,656,958 Bicycles $247,778 $73,627,087 Admission to Sports Events Excluding Trips $487,479 $150,826,243 Camping Equipment $182,833 $47,027,517 Hunting and Fishing Equipment $377,214 $135,322,665 Other Sports Equipment $56,241 $23,240,623 Water Sports Equipment $58,281 $16,593,504
Table 1: Estimated Average Recreational Expenditures Per Resident 2022
Table 2: Estimated Total Recreational Expenditures
Water-Related Activities
Each year, the Sports and Fitness Industry Association (SFIA) releases a Sports, Fitness, and Leisure Activities Topline Participation Report. The SFIA report indicates that water sports had the largest overall growth in participation among all seven sports categories.
The table below demonstrates the change in time from over the past five years (2016 to 2021) for water-related activities. The 1-year, 2-year, and 5-year average annual growth (AAG) are charted in the tables to indicate the level of change for boardsailing/windsurfing, canoeing, jet skiing, kayaking, sailing, stand-up paddling, and water skiing.
Between 2020 and 2021, the water sports with the highest overall growth were boarding sailing/ windsurfing (+9.9%), kayaking – sea/touring (+5.6%), and water skiing (+4.7%). The water sports that experienced the highest decreases in participation between 20202 and 2021 were kayaking –recreational (-14.6%), canoeing (-6.4%), and sailing (-3.6%).
1. Wearable Technology
Wearable technology, which includes activity trackers, smartwatches, heart rate monitors, GPS tracking devices, and smart eyeglasses (designed to show maps and track activity), has been one of the top three trends since 2016. Examples include fitness and activity trackers such as those from Misfit, Garmin, Pebble Time, Samsung, Basis, Jawbone, Fitbit, and Apple. These devices can track heart rate, calories, sitting time, and much more. It is estimated that wearable technology is a $95 billion industry.
2. Strength Training with Free Weights
Strength training remains popular in all sectors of the health and fitness industry and for many kinds of clients. Free weights, barbells, kettlebells, dumbbells, and medicine ball classes do not just incorporate equipment into another functional class or activity. Instructors begin by teaching the proper form and technique for each exercise and then progressively increasing the resistance. New exercises are added periodically, starting with proper form and technique. Many younger clients of both community-based programs and commercial clubs train almost exclusively using weights. In today’s gyms, however, there are many others (men and women, youth and seniors, and patients with stable chronic diseases) whose focus is using weight training to improve or maintain strength.
3. Body Weight Training
Body weight training uses minimal equipment, which makes it an inexpensive way to exercise effectively. Although body weight training is commonly thought of as simply push-ups and pullups, it can be much more than that. This type of training first appeared in the ACSM trends survey in 2013, debuting at number three.
4. Online Live and On-Demand Exercise Classes
FITNESS TRENDS
Each year, the ACSM circulates an electronic survey to thousands of fitness professionals around the world to determine global health and fitness trends. Now in its 16th year, the ACSM’s Worldwide Survey of Fitness Trends identified the following top 10 trends of 2022.
Previously this category had been limited to “virtual online training” or “online training”; however, this changed in 2022 to specify what type of online classes are trending. COVID-19 forced closures of exercise programming in many spaces, which resulted in an increase in online training for athome exercise classes. This trend can be offered live or prerecorded to groups and individuals. Prerecorded sessions offer clients the chance to partake in these classes according to their own schedule.
7 High Level Maintenance
1-year change 2021 2-year change 2020 5-year AAG 2016 Boardsailing/ Windsurfacing 2.3% -7.6% -5.5% Canoeing -4.1% 2.3% -1.6% Jet Skiing 3.3% -0.9% -2.6% Kayaking (recreational) 2.7% 17.3% 6.0% Kayaking (Sea/ Touring) 3.1% -2.5% -3.6% Sailing -0.7% -4.3% -3.3% Stand-Up Paddling 1.8% 5.0% 3.0% Water Skiing 0.2% -4.5% -3.7%
Table 3: Water Sport Overall Participation, 2016-2021
5. Home Exercise Gyms
The trend in home exercise gyms has risen because of the COVID-19 pandemic and researchers expect this trend to continue. Home gyms allows participants to choose what equipment they invest in at various price points and can be used by individuals or as a family. However, for this trend to continue, it is noted that home gym businesses will need to lower equipment costs to keep participants working out at home instead of a gym outside the home.
6.
Outdoor Activities
Likely because of the COVID-19 pandemic, outdoor activities such as group walks, group rides, or organized hiking groups are gaining in popularity. These can be short events, daylong events, or planned weeklong excursions. Typically, people meet at a local park, hiking area, or bike trail with a designated leader. The trend for health and fitness professionals to offer outdoor activities to clients began in 2010 and has been in the top 20 since 2012. This has become even more popular in recent months as agencies work to offer fitness programs outdoors that help to ensure physical distancing.
7. High-Intensity Interval Training (HIIT)
HIIT involves short bursts of high-intensity exercise followed by a short period of rest or recovery, and typically takes fewer than 30 minutes to perform (although it is not uncommon for these programs to be much longer in duration). HIIT has been a topfive trend since 2014. Despite warnings by some fitness experts of the potential for increased injury using HIIT, this form of exercise is popular in fitness centers all over the world.
8. Exercise for Weight Loss
Another trend that has increased because of the COVID-19 pandemic is exercising for weight loss. This trend has been in the top 20 since the beginning of the ACSM survey, but peaked at number 5 in 2022, a rise from number 16 in 2021. Participants are moving toward this trend because the pandemic caused perceived or real weight gain and weightloss programs generally recommend incorporating exercise to build fitness.
9. Health and Wellness Coaching
Health and wellness coaching bridges behavioral science by promoting a healthy lifestyle and programs to support that lifestyle. Typically, this
coaching is one-on-one, and coaching consists of goal setting and providing support, guidance, and encouragement. The coach focuses on the specific needs and wants of the client’s lifestyle and values.
10. Personal Training
Personal training is a one-on-one workout with a trainer that begins with fitness testing and goal setting. The trainer then works with the client and prescribes workouts specific to their needs. The profession of personal training is becoming more accessible online, in clubs, in the home, and in worksites that have fitness facilities. Many fitness centers continued to offer personal training during the COVID-19 outbreak. Since this ACSM survey was first published in 2006, personal training has been ranked in the top 10.
PROGRAM-RELATED TRENDS
Niche Programming
Decades ago, recreation agencies focused on offering an entire set of programs for a general audience. Since that time, market segments have been developed, such as programming specifically for youth or seniors. Recently, more market segments have been developed for specialty audiences, such as the LGBTQ community, retirees, military veterans, cancer patients, people needing mental health support, and individuals with visible and invisible disabilities. Organizations are taking a much more holistic approach to program and service offerings, beyond what is typically thought of as a recreation program.
Before- and After-School Care Programs
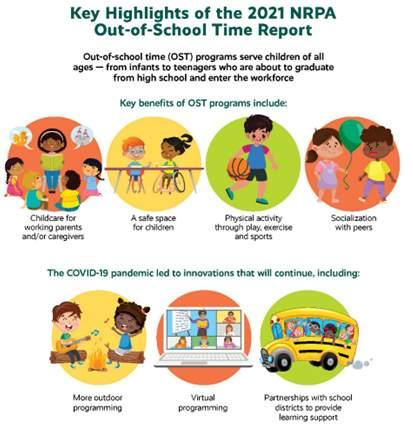
Many park and recreation agencies offer before- and after-school care programs. These programs may include fitness/play opportunities, healthy snacks, and tutoring/homework services. According to an NRPA poll, 85% of U.S. adults believe that beforeand after-school programs offered by local park and recreation agencies are important.
According to NRPA’s 2021 Out-of-School Time Report, approximately 83% of local parks and recreation agencies offer after-school programming. Figure 9 demonstrates the top four benefits of after-school programs for youth determined by parks and recreation professionals.
8 High Level Maintenance
Community and Special Events
Community-wide events and festivals often act as essential place-making activities for residents, economic drivers, and urban brand builders. This phenomenon is described in Governing Magazine: “Municipal officials and entrepreneurs see the power of cultural festivals, innovation-focused business conferences, and the like as a way to spur shortterm tourism while shaping an image of the host city as a cool, dynamic location where companies and citizens in modern, creative industries can thrive” (2013).
According to the 2022 Event Trends Report by Eventbrite, the following trends are expected to impact event planners and community builders in the coming years:
• Strength in Diverse Communities: The pandemic built a different source of community through virtual events. Virtual events enabled audiences to expand in terms of being able to include broader reach to different ages, ethnicities, geographic locations, rural communities, and those who are differently abled. Event organizers are also looking to diversify entertainers and presenters.
• Go Green: The trend of hosting “green events”
is a trend that is here to stay. Although the pandemic impacted responses around making events environmentally friendly a priority, with a return to in person events it will certainly make a turn around. Virtual events have had a major impact on the carbon footprint of events. In a 2021 Nature Communications study, they found that virtual events decreased those footprints by 94% and energy use was cut by 90%.
• Optimism, Resiliency, and Creativity: Event organizers are still feeling some uncertainty around a resurgence in COVID-19 cases, however 75% of respondents indicated they are optimistic about future events. The pandemic has left organizers feeling more adaptable, innovative, and creative. Half of organizers around the globe indicated COVID-19 made their teams more resilient.
Performing Arts and Cultural Programming
Agencies across the country use indoor and outdoor facilities for art, cultural, musical experiences. Parks and recreation professionals and artists partnering create a community atmosphere that bolsters creativity and accessibility while encouraging physical activity. The Centers for Disease Control and Prevention (CDC) recommends the following strategies for building these partnerships:
• Join a community-based group that plan and develop projects designed to make an activityfriendly community.
• Partner with city leaders and community-based groups to increase the use of parks by adding design elements that reflect local cultural traditions.
• Include creative place-making when developing a strategy for community development. Creative place-making integrates arts, culture, and design into public spaces to promote wellbeing and increase physical activity.
• Create inclusive ways for community members to be involved with community development decision making.
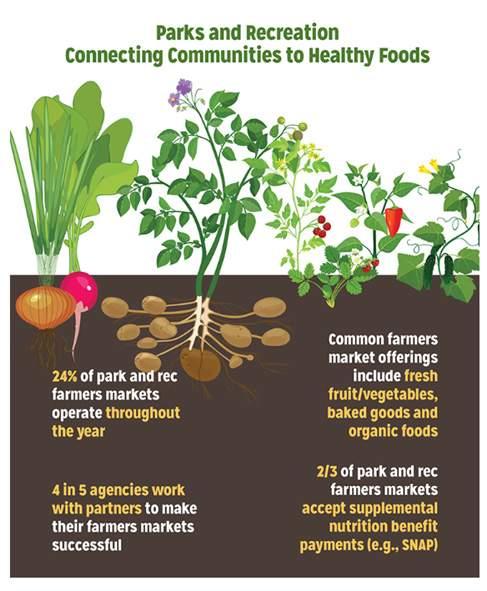
Farmer’s Market
Park and recreation agencies often have the role of connecting communities to local, fresh foods. In fact, many local agencies are the largest providers of federally funded meals for the public. One in five agencies manage a farmer’s market program.
9 High Level Maintenance
Figure 11: Overview of Key Highlights from NRPA's 2021 Out-of-School Time Report
There are many benefits in providing farmers markets in the community. Beyond providing fresh foods to the public and promoting agricultural and economic benefits for farmers and vendors, they also bring culture building and engagement on a consistent basis. According to a 2019 study by NRPA of 296 agencies, approximately 67% of organizations host farmer’s markets once a week, with 21% offering it two or three times a week. Roughly four in five agencies use partnerships with non-profits, farmers’ organizations, other local government departments, community development organizations, and the local university extension offices to enhance the success of the farmer’s market.
life for all citizens, including children, youth, and adults with disabilities:
1 2 3 4 5 6
Provide affordable, appropriate, accessible housing
Ensure accessible, affordable, reliable, safe transportation
Adjust the physical environment for inclusiveness and accessibility
Provide work, volunteer, and education opportunities
Ensure access to key health and support services
Encourage participation in civic, cultural, social, and recreational activities
Therapeutic Services bring two forms of services for people with disabilities into play: specific programming and inclusion services. Individuals with disabilities need not only functional skills, but to have physical and social environments in the community that are receptive to them and accommodate individual needs. Inclusion allows individuals to determine their own interests and pursue them.
Many parks and recreation departments around the country are offering specific programming for people with disabilities, but not as many offer inclusion services. “Play for All‒Therapeutic Recreation Embraces All Abilities”, an article in Recreation Management Magazine, describes how therapeutic recreation includes a renewed focus on serving people with the social/emotional challenges associated with “invisible disabilities” such as ADHD, bipolar disorders, spectrum disorders, and sensory integration disorders.
Therapeutic Recreation
The Americans with Disabilities Act (ADA) of 1990 established that people with disabilities have the right to the same access to parks and recreation facilities and programming as those without disabilities. In 2004, The National Council on Disability (NCD) issued a comprehensive report titled Livable Communities for Adults with Disabilities. This report identified six elements for improving the quality of
A growing number of park and recreation departments are making services for those with invisible disabilities a successful part of their programming as well. When done well, these same strategies improve the recreation experience for everyone.
10 High Level Maintenance
Figure 12: Overview of NRPA's 2019 Farmer's Market Report
SPORT PARTICIPATION
The following tables demonstrate the change in participation over a five year period (2015 to 2020) for sports that are relevant to the Department’s planning, taken from the Sports and Fitness Industry Association (SFIA) 2021 Topline Report. There is additional information on eSports and adult participation in sports.
For each sport, there are two categories, which define the level of activity. “Casual” refers to users that participated in the study between 1 and 12 times in the past 12 months. “CORE” refers to users that participated more than 13 times in the last 12 months. A weighting technique was used to reflect participation rates for U.S. population ages six and above.
The one-year, two-year, and five-year average annual growth (AAG) is charted in the tables to indicate the level of change for the following sports:
• Baseball/Softball
• Football
• Lacrosse
• Pickleball
• Soccer
• Volleyball
Baseball/Softball
Casual participation in baseball saw a decrease in participation of 8.6% in one year. However, fast pitch softball saw a huge increase in one year with an increase of 43.8% participation. Slow pitch softball participation trends have decreased over the last several years.
Football
Casual participation for tackle football and touch football have seen a 6-10% increase in 2021 with flag football participation deceasing by 3.5%. Participation in flag football and tackle football increased more than nine percent. CORE participation in tackle and touch have decreased –particularly for touch football.
Lacrosse
Casual participation in lacrosse increased significantly in 2021 (11.9%). However, CORE Participation decreased 10.1%. Overall, the 5-year AAG was -1.8% but participation trends indicate that casual participation is increasing.
Pickleball
With 4.8 million people in the country playing pickleball, it is a trend not to be taken lightly. Though not at its peak, pickleball is still trending nationwide as the fastest growing sport in America with the active aging demographic, as 75% of core players are age 55 or older. Considered a mix between tennis, ping pong, and badminton, the sport initially grew in popularity with older adults but is now
11 High Level Maintenance Definition 1-year Change 2021 2-year Change 2020 5-year AAG 2016 Baseball -0.9% -1.4% 1.1% Casual 1-12 times -8.6% 11.1% 5.9% CORE 13+ times 7.2% -10.4% -1.7% Softball (Fast Pitch) 15.3% -6.9% -2.6% Casual 1-12 times 43.8% -5.9% -1.7% CORE 13+ times -0.6% -7.6% -1.8% Softball (Slow Pitch) -5.4% -15.0% -4.7% Casual 1-12 times -0.9% -9.7% -4.0% CORE 13+ times -8.8% -19.0% -5.3% Definition 1-year Change 2021 2-year Change 2020 5-year AAG 2016 Football (Flag) -1.6% 1.6% 2.3% Casual 1-12 times -3.5% 9.0% 5.1% CORE 13+ times 1.4% -7.9% -1.1% Football (Tackle) 3.4% 2.4% -0.9% Casual 1-12 times 10.6% 9.5% 3.5% CORE 13+ times -3.0% -4.0% -4.4% Football (Touch) 0.8% -5.5% -3.0% Casual 1-12 times 6.1% 3.4% -0.7% CORE 13+ times -7.7% -18.6% -6.3%
Table 4: Sport Participation for Baseball/Softball 2016-2021
Table 5: Sport Participation for Football 2016-2021
Definition 1-year Change 2021 2-year Change 2020 5-year AAG 2016 Lacrosse 0.4% -10.6% 1.8% Casual 1-12 times 11.9% -1.2% -2.3% CORE 13+ times -10.1% -19.3% -0.9%
Table 6: Sport Participation for Lacrosse 2016-2021
expanding to other age groups. It can be played as singles or doubles, indoors or out, and it is easy for beginners to learn but can be very competitive for experienced players. The game has developed a passionate following due to its friendly, social nature, and its multi-generational appeal. Recreation facilities such as tennis or basketball courts can be temporarily or permanently converted to pickleball courts through lining a court. One consideration before lining tennis courts is potential inference with competitive tennis requirements. Best practices regarding pickleball setup and programming can be found on usapa. com, the official website for the United States Pickleball Association.
Volleyball
Volleyball generally has seen a decline in participation over the five year span, with both casual and CORE participation decreasing. However, interest and participation in sports vary by region, age group, and other factors. This national perspective provides just one indication that volleyball may be on the decline.
Soccer
The SFIA report indicates that indoor and outdoor soccer has increased slightly over the past five years, however in 2021 , there was a notable 14.1% increase for CORE participation for both indoor and outdoor soccer.
12 High Level Maintenance Definition 1-year Change 2021 2-year Change 2020 5-year AAG 2016 Pickleball 14.8% 39.3% 11.5% Casual 1-12 times 21.9% 56.5% 15.4% CORE 13+ times 0.1% 9.0% 4.4%
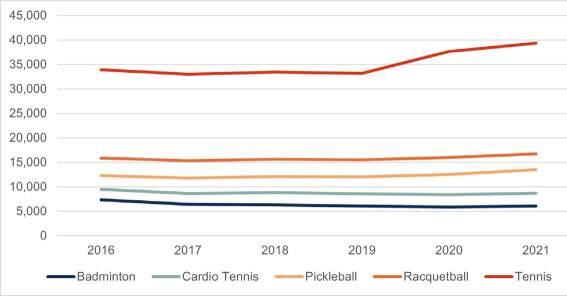
Table 8: Racquet Sport Participation from 2016-2021
Table 7: Sport Participation for Pickleball 2016-2021
Definition 1-year Change 2021 2-year Change 2020 5-year AAG 2016 Soccer (Indoor) -0.6% 1.4% 1.2% Casual 1-12 times -9.6% 18.3% 6.4% CORE 13+ times 14.1% -14.5% -2.3% Soccer (Outdoor) 0.9% 5.4% 1.1% Casual 1-12 times -9.3% 10.5% 4.2% CORE 13+ times 21.7% -1.6% -1.4%
Table 9: Sport Participation for Soccer 2016-2021
Definition 1-year Change 2020 2-year Change 2019 5-year AAG 2015 Volleyball (Beach/ Sand) -3.2% -4.9% -5.2% Casual 1-12 times -6.0% 0.4% -5.8% CORE 13+ times 4.2% -15.2% -2.9% Volleyball (Court) 8.1% -9.8% -0.8% Casual 1-12 times 11.9% -16.8% -2.0% CORE 13+ times 5.5% -4.0% 0.2% Volleyball (Grass) 2.5% -10.5% -7.8% Casual 1-12 times 2.5% -14.2% -9.6% CORE 13+ times 2.7% -1.8% -3.1%
Table 10: Sport Participation for Volleyball 2016-2021
Basketball
The SFIA report indicates that casual and CORE participation in basketball has mostly grown steadily over the last five years. In 2021, however, there has been an almost 8% decrease in casual basketball participation.
agencies' recreation is expected to continue. The childcare workforce is one of the only occupations that has not rebounded from the COVID-19 pandemic.
• Pickleball has exploded onto the recreation scene, however, the loud volume coming from pickleball courts is unpleasant for those living nearby.
• Digital twin mapping is used to provide 3D models of the actual physical environment and is compatible with geographic information systems (GIS). The result of the two maps is a virtual image showing spatial relationships between objects, buildings, and elements of nature.
NRPA TOP TRENDS
Each year, the NRPA publishes an article about industry trends and predictions in Parks and Recreation Magazine. In the 2023 edition of the article, Top Trends in Parks and Recreation for 2023 (written by Richard Dolesh—former Vice President of Strategic Initiatives for NRPA), the trends identified for 2023 focused on technology, health and wellness, worker satisfaction, and recreation program trends. Below are a few highlights from Dolesh’s article:
• Parks and recreation agencies will be able to reduce their carbon footprint through the electrification of business elements such as buildings, vehicles, and equipment. The switch to electronic power is healthier, cheaper, more efficient, and more environmentally friendly for our communities.
• Five state park systems and one national park implemented programs that loan persons with disabilities access to off-road, tracked, and powered wheelchairs. This is just one of many ways parks and recreation agencies are looking to provide opportunities for inclusion.
• Worker satisfaction is more important now than ever and should be a top goal for your organization’s culture. Employees who feel a sense of genuine care for their well-being from their employer are more engaged and productive.
• The lack of childcare workers and lifeguards and the impact that has on parks and recreation
• Anchor institutions, typically universities and hospitals, are non-profit organizations that create strong bonds within their community. Parks and recreation agencies operate similarly and should be viewed as vital pieces of our communities.
• Parks and recreation agencies across the nation relaxed the use and sale of alcohol at parks, typically during special events. Recreational use of cannabis is now on the rise, with 21 states allowing recreational use, and may not be far behind the recreational use of alcohol in parks.
• Single-use plastic utensils are easy to use in a park setting, however, some parks are looking for a more sustainable solution – edible utensils. Various companies now have items like edible straws, spoons, and forks that can help make agencies with food services more environmentally friendly.
13 High Level Maintenance
Definition 1-year Change 2021 2-year Change 2020 5-year AAG 2016 Basketball -2.2% 8.9% 4.1% Casual 1-12 times -7.9% 14.0% 8.6% CORE 13+ times 2.1% 5.7% 1.6%
Table 11: Sport Participation for Basketball 2016-2021
02 Recreation & Program Analysis
Recreation & Program Analysis
RECREATION PROGRAMS ASSESSMENT
The recreation programs assessment reviews the Department’s recreation program and service offerings through a series of individual analyses. The consultant team reviewed the results of these analyses from a global perspective. This recreation assessment report offers detailed insight into the Department’s recreation program offerings and helps identify strengths, weaknesses, and opportunities for future program direction. This report also assists with identifying core program categories, programming gaps, and future program considerations.
The report and data that informed the recreation assessment included the Department’s seasonal program guides, participation data, and program and expenses. Internal meetings and interviews with staff also provided insight.
STAFF MEETINGS
The recreation assessment included meetings with the director, leadership from recreation and other departments, and three programming staff. A list of questions for each meeting were provided in advance so that staff could prepare. It should be noted that the Department is in a rebuilding phase with all the programming staff new to the City in the past two years.
Strengths
For a young team, several Department strengths were shared starting with teamwork – they all work very well together to get the job done. In addition, senior programming is strong – specifically some of the group exercise classes that have experienced an increase in participation recently. Youth sports were also noted as another area of strength. Staff morale is improving, the facilities are nice, and the Department is well-funded. Overall, the staff feel that the programs they offer are high quality, but they have not been able to offer enough variety.
Weaknesses
Recruiting for part-time and full-time staff has been difficult. Once staff are hired, it can be difficult to retain them. The high turnover rate makes programming difficult – it has been hard to staff all the public swims. With the short tenure of the staff, communication can be difficult at times, and in need of some improvement. RecTrac has not been an ideal software for the Department and staff are seeking another option. Wi-Fi is not available in the facility, and this is an issue for staff and the public. The Department could also benefit from more targeted marketing. As noted in the demographics section, the median income in Grandview is below that of the state and the country. This fact has made it difficult for some families to afford recreation programs.
Opportunities
To address the financial issues, staff are interested in revamping the scholarship program. This opportunity should provide access to families who cannot currently afford programs. Unless programs are free, it has been difficult to get solid participation. The staff feel there’s a better way to communicate with residents regarding what they desire in recreation programming. Staff would like to utilize the parks more frequently for programming and events.
PROGRAM MENU
The program menu consists of the recreational activities for a specific time frame. Program data from 2022 (January 1, 2022 – December 31, 2022) was used to analyze offerings. Department staff identified the core programs as:
15 High Level Maintenance
• Aquatics • Events • Fitness • Seniors • Youth General Interest • Youth Sports
The View Community Center is a state-of-the-art facility featuring an indoor track, gym, climbing wall, fitness room, meeting rooms, and an indoor pool. The View is home to most of the Department’s recreation programs and also has rooms available for rental.
Aquatics
Grandview’s indoor pool includes a 25-yard lap pool with four lanes and a leisure pool with a water slide. The facility is open Monday – Sunday and is home to the following aquatic programs:
• Aqua Fit
• Water Aerobics
• Aqua Zumba
• Swim lessons
• Swim Team (summer only)
Each day, the lap lanes and leisure pool are available for public swims.
Events
The Department hosts many events throughout the year. Some of the events are free and for a few, a small fee is charged. The list of annual events includes:
• Family Formal: dinner, sweets, and dancing for the entire family
• Harry’s Hay Days: a community celebration of President Truman’s birthday
• Concerts and movies at the Amphitheater
• Howl-O-Ween: and event for families and their pups at the Dog Park
• Trunk or Treat: a family friendly Halloween event
• Senior Thanksgiving: a free Thanksgiving dinner for seniors – attendees bring dessert
• Letters to Santa: write a letter to Santa and he will write you back!
• Mayor’s Tree Lighting: tree lighting event with entertainment provided by the elementary schools
• Holiday Lights Tour: a Kansas City holiday lights tour aboard the Barley Bus
• Breakfast with Santa: breakfast, crafts, and a visit with Santa
Fitness
The View Fitness Center provides several fitness opportunities for the community including:
• A cardio and free weight area
• Several daily group exercise classes for adults including spin, Zumba, yoga, chair yoga, Silver Sneakers, and strength classes
• Youth strength and conditioning classes
• Personal training opportunities
Seniors
The Department considers anyone over age 62 a senior. Programs offered for this age group include:
• Potluck lunches
• Games (Bingo on Friday mornings)
• Senior Trips (one every other month)
• Senior Fitness Classes
The Department’s website indicates that “Due to Covid, some senior activities remain postponed until further notice”.
Youth Dance
The Department offers several youth dance classes including ballet, tap and jazz, hip hop, and Irish Step Dance.
Youth Sports
The Department offers many youth sports coached by volunteers including:
• Flag Football: kindergarten – 8th grade
• Baseball: for ages 7 - 14
• T-Ball: co-ed program for children ages 3 – 6 years
• Basketball: 1st – 8th grades
• Pee Wee Basketball: for ages 3 – 6 years
• Soccer
• Pee Wee Soccer: for ages 3 – 6 years
• Co-ed Youth Volleyball: for 1st – 8th grades
16 High Level Maintenance
POTENTIAL NEW CORE PROGRAM AREAS
As programming variety and participation increases, Grandview may consider adding some new core programs including:
• Arts: drawing, painting, cartooning, tie-dyeing, ceramics, clay, beading
• STEM/STEAM
• General interest: chess, magic class, and babysitting instruction
• Lifelong learning: foreign languages and Do It Yourself (DIY) projects
• Nature/outdoor education: sustainability, gardening, and green living
• Outdoor adventures: hiking, biking, paddle boarding, and camping
These core program types are popular in many areas of the country and offering programs in these areas will greatly increase the variety of options.
Within each core program type, the goal is to provide offerings for all age groups (preschool, youth, teen, adult, and seniors). Obviously, some core program areas, such as camps, only include preschool, youth, and teen. This diversification helps create a well-rounded department that focusses on all areas of recreation for all ages and abilities.
OTHER SERVICES
In addition to The View Community Center and the core program areas, the Department manages other facilities that provide community leisure opportunities.
Grandview Amphitheater
The Grandview Amphitheater is one of the newest music venues in the Kansas City Metro area. This open-air 5,000-person capacity performance venue is conveniently located near two major highways in Grandview.
This facility is host to a summer concert series, the Grandview Farmers Market, a family movie series, and a free Zumba class on Saturday mornings from early June through late September. This facility is also available for rental.
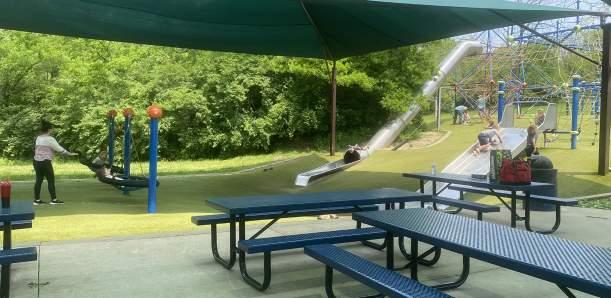
Grandview Splash Park
The Grandview Splash Park is open (weather permitting) from Memorial Day to Labor Day. This facility opened in 2019 and is open to members and those paying the daily fee. This family friendly facility is equipped with water cannons, a giant dump buckets, and water slides.
Grandview Shooting Range
The Grandview Shooting Range is located on the northwest side of town and is used by the Grandview Police Department, Honeywell Security, and the public. The range is open to the public on Saturday for pistol and rifle shooting. Lanes are available on a first-come, first-served basis or can be reserved in advance online.
Parks
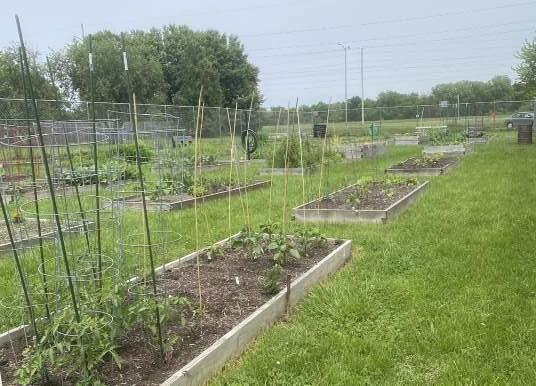
The City owns and maintains 15 park sites. These parks provide a number of additional recreation and leisure opportunities including playgrounds, ball fields, a skate park, trails, a dog park, and a community garden, among other amenities.
Shelter Rentals
The City has nine shelters available for rental at local parks. The capacity of the available shelters ranges from 20 people to 130 people.
PROGRAM INVENTORY
The following is a list of typical program categories that park and recreation agencies throughout the country commonly provide. This list helps to identify whether there are any common program areas not offered by an agency. Most agencies offer a majority of these programs. In matching the Department’s inventory of programs against this list, less than half (or 42.8%) of the program areas are represented. (Orange text represents programs the Department does not offer).
17 High Level Maintenance
Active Adult Golf Running/ Walking
Aquatics Gymnastics/ Tumbling School Day Off Programs
Arts Historical Programs Seniors
Before/After School Homeschool Programs Special/Comm. Events
Biking Horseback Riding Specialty Camps
Birthday Party Services Ice Skating/ Hockey Sports Instruction
Childcare Inclusion Opportunities Sports Leagues/ Adult
Climbing Language Arts Sports Leagues/ Youth
Cooking Lifelong Learning STEM/STEAM
Dance Martial Arts Sustainability/ Green
Day Camps Music Teen
E-Sports Open GymAdults Tennis
Early Childhood Open GymYouth Theater/ Acting
Environmental/ Nature Outdoor Adventure Trips
Extreme Sports Pet Programming/ Events Wellness
Fitness Pickleball
General Interest Preschool
For comparison purposes, the consulting team reviewed the program category percentages against its database of park and recreation agencies nationwide. The comparison agencies average percentage of offered program categories was 64.5%, which is a bit higher than the Department’s 42.8%. The program categories depicted in orange text in Table 1 represents opportunities for program menu expansion where aligned with community needs.
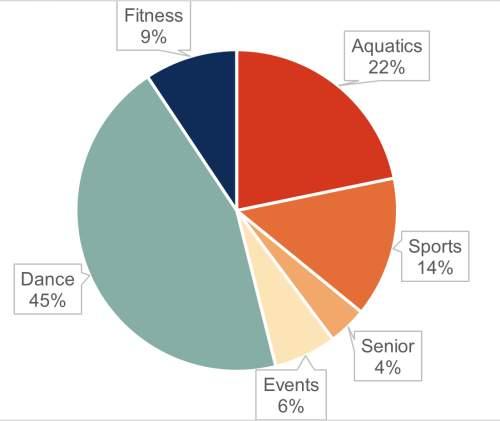
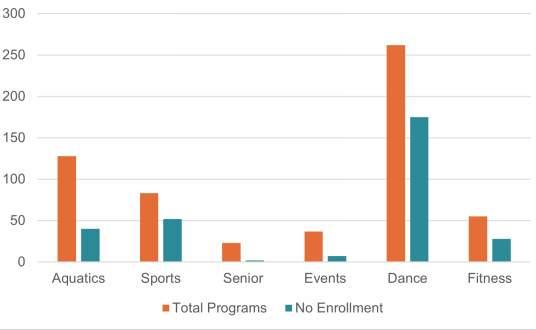
PROGRAM DISTRIBUTION
Understanding how the Department’s enrollmentbased program menu is distributed across the core program areas helps to identify the extent of programming within each program area in relation to the whole. A total of 588 programs were offered by the Department in 2022. Of the 588 programs offered, 304 programs indicated no enrollment. Figure 1 below depicts the total programs offered by category. Figure 2 depicts the total number of programs by category and how many programs in that category had zero enrollment per the participation report from RecTrac.
18 High Level Maintenance
Figure 1: Total Programs Offered, 2022
Table 1: Recreation Program Expansion Opportunities
The programs with the largest quantity of programs offered include dance (262 programs), aquatics (128 programs), and sports (83 programs). However, these programs also make up the programs with the highest rate of no enrollments. Approximately 57% of dance programs had no enrollment, followed by sports (17%), and aquatics (13%).
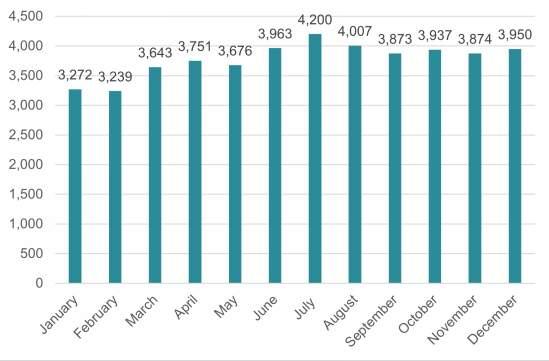
In 2022, community center membership enrollments were consistent with the most notable periods of growth in memberships during the summer months (June, July, and August).
AGE SEGMENTATION
The age segment analysis reviews the distribution of the program offerings according to the age segments serviced. For the purposes of this assessment, BerryDunn delineated age categories according to the following age structure:
• Early Childhood, 0 – 5 years
• Youth, 6 – 12 years
• Teen, 13 – 17 years
• Adult, 18 – 54 years
• Senior, 55+ years
• All Ages
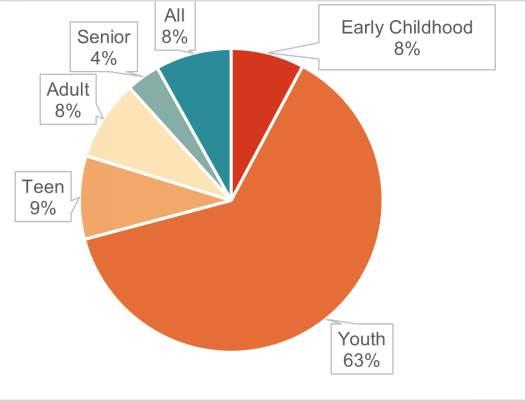
If a program section spanned clearly across age categories (e.g., ages 4 – 8 years), BerryDunn counted that section once in early childhood and once in youth. Figure 4 displays the Department’s 2022 program menu’s percentage of programs according to each age segment.
For a community the size of Grandview, this level of fitness memberships is very positive (over 15% during the peak month of July). Finding ways to further connect with these members, cross promote programs, and survey the need for new types of programs is critical.
63% of programs were designated for youth 6 to 12 years. Of all the age-specific programming, 80% were designed for youth under the age of 18 years and 12% were designed for adults 18 years and over. The remaining 8% of programs were designed for all ages.
The age segmentation analysis is one helpful method to review the Department’s programming related to the community demographics. Demographic data can be helpful to consider how programming efforts are aligned with the makeup
19 High Level Maintenance
Figure 3: Community Center Memberships, 2022
Figure 2: Total Programs Offered with No Enrollment, 2022
Figure 4: Age Segmentation of Enrollment-Based Programs, 2022
of the community. The adjacent comparison of the community’s population and enrollmentbased program offerings in Figure 5 demonstrates two key age segments’ relationship between the population percentage and the percentage of programs offered.
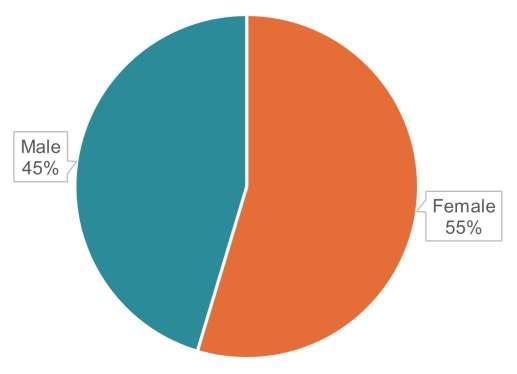
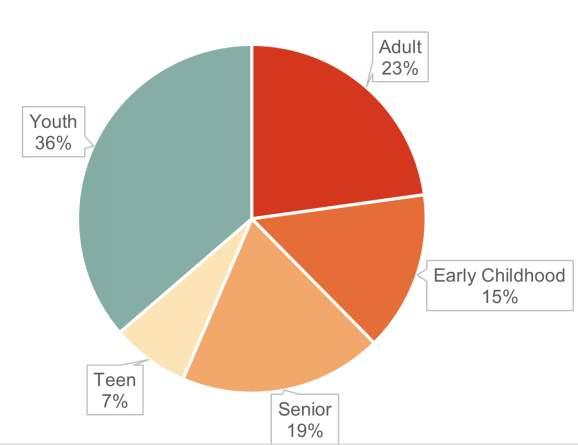
12 years. The figures below depict the distribution percentages for enrollment ages, gender, and resident status.
A large percentage (80%) of the Department’s enrollment-based programs are designed for youth, while the youth age segment represents 27% of the community’s population. Adults, ages 18 years and up, make up 73% of the population, while 12% of programs are designed for adults. The notion of offering a majority of programming for youth is consistent with most park and recreation agencies’ program menus across the country; that said, the percentage of youth programming is more often within the 60 – 75% range. The program menu’s age segmentation does not need to mirror the community’s age demographic segmentation in an exact manner; however, an ongoing goal can be to balance the menu toward a reflection of the community makeup.
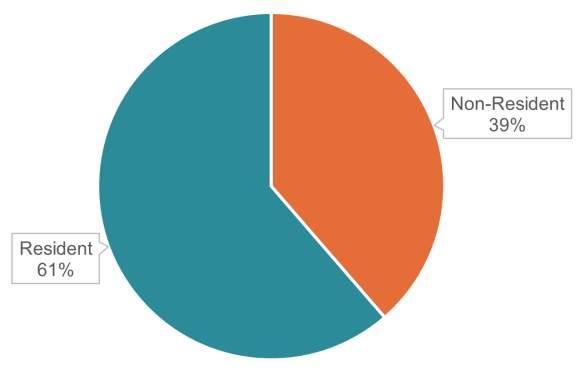
ENROLLMENT DISTRIBUTION
The Department had 1,369 unique enrollments in programs during 2022. The most common enrollment type is a female resident between 6 to
20 High Level Maintenance Youth 27% of population 80% of programs Adult 73% of population 12% of programs
Figure 5: Population vs. Program Menu
Figure 6: Enrollment Age Distribution, 2022
Figure 7: Enrollment Gender Distribution, 2022
Figure 8: Enrollment Residency Distribution, 2022
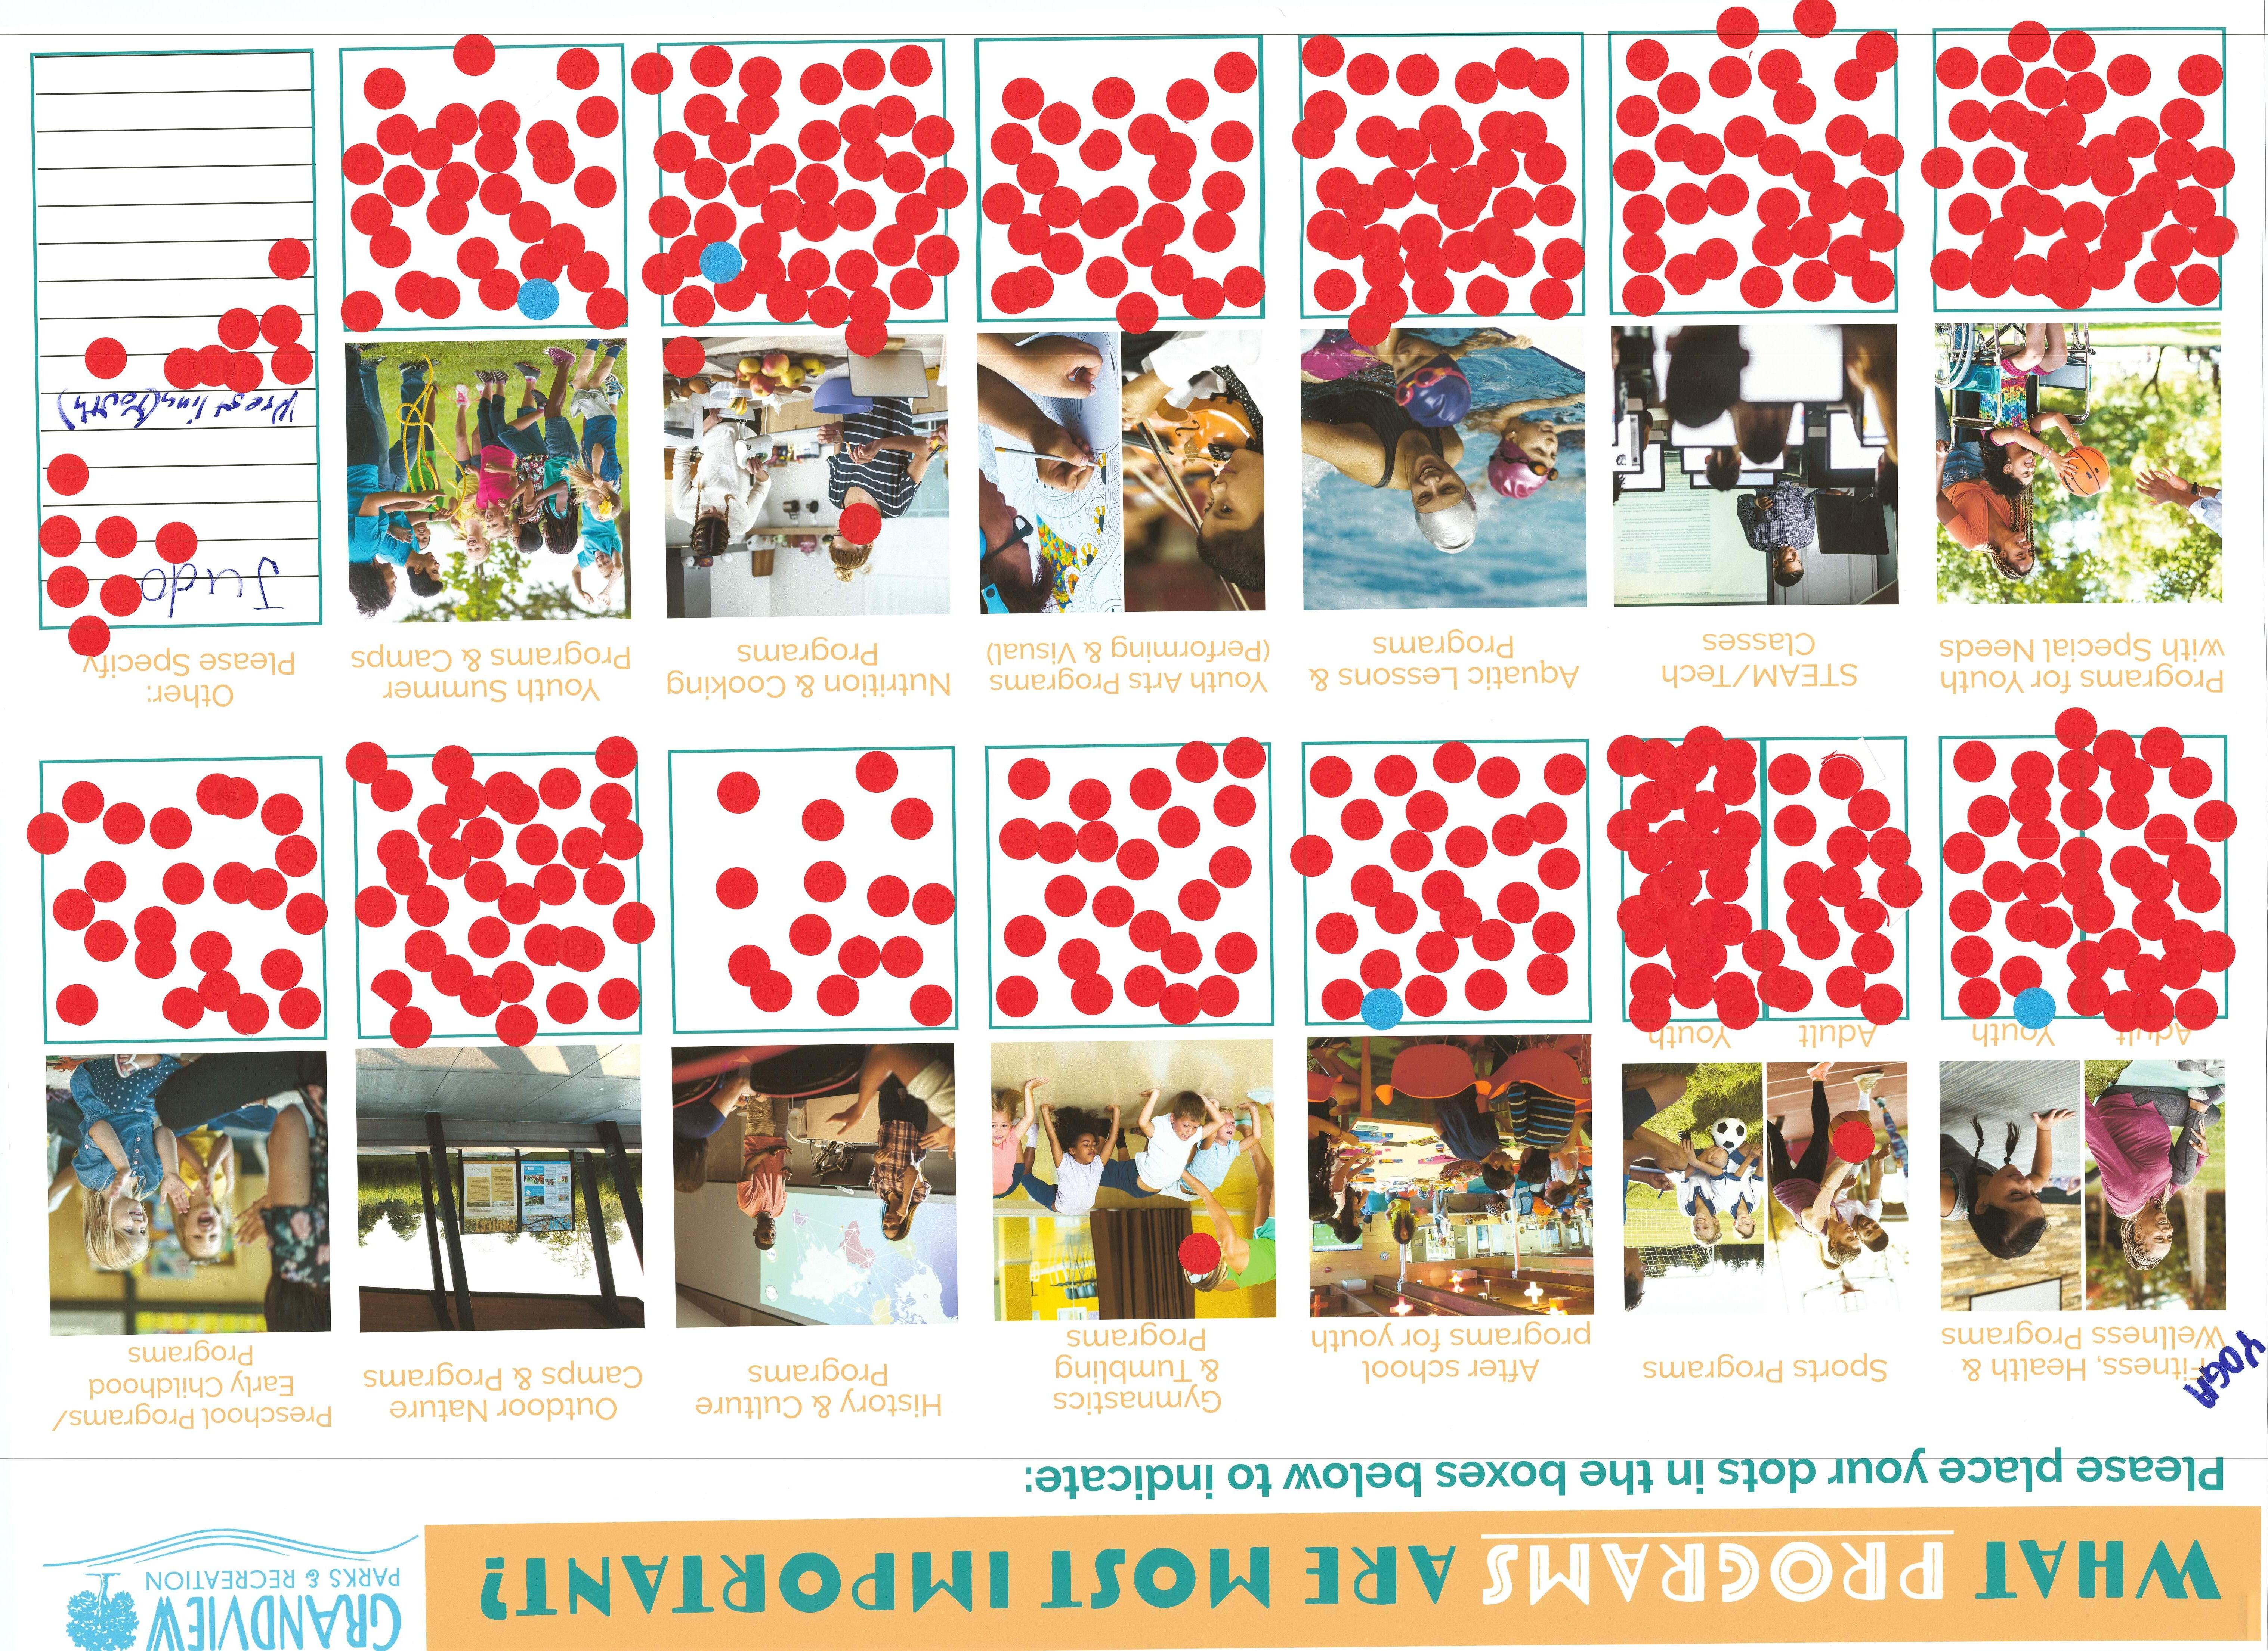
SURVEY RESULTS
As part of the Master Plan Update, ETC Institute conducted a community needs assessment survey during the fall of 2022. The full findings from this survey are in a stand-alone report.
A portion of the survey questions focused recreation programs. ETC developed the Priority Investment Rating (PIR) to help organizations determine where to focus resources. The PIR equally weighs the importance that a respondent places on a program type and how many respondents have an unmet need for that program. A low priority has a score of 0-50, medium priority is scored 59-99, and a high priority rating has a 100+ score.The top six program types that rated high priorities for investment included:
• Adult fitness & wellness programs (PIR=200)
• Community special events (PIR=140)
• Senior health and wellness programs (PIR=125)
• Outdoor water recreation (PIR=99)
• Water fitness programs/lap swimming (PIR=95)
• Cultural enrichment programs (PIR=93)
These results should be considered as the Department looks to add new programs or revamp old programs. The large number of fitness center memberships supports this desire for adult fitness.
RECOMMENDATIONS
As a result of the meeting with staff, the review and analysis of program data, and the statistically valid survey results, the BerryDunn consulting team recommends the following:
Programming
• Add more adult programming to more evenly match the community demographics.
• Add enrichment/general interest as an alternative to sports programming.
• Evaluate the ability to lower fees to attract more participants.
• Offer specific open gym days/times for youth,
teens, and adults and advertise.
• Reduce program offerings, eliminating those that are not successful after three seasons.
• Seek out new programming opportunities to address the mental health needs of the community such as mindfulness, tai chi, and stress relief.
• Review trends report to determine which trending programs might be relevant to Grandview.
Program Evaluation
• Create a system where programs are evaluated on a regular basis and share results.
• Ask for feedback regarding programming needs from fitness members.
• Evaluate the success of programs at the end of each season comparing courses offered to courses cancelled and participant satisfaction.
• Start to monitor program cancellation rates to maximize program planning efforts, efficiently market programs, and meet the needs of more participants. After tracking for a year, set annual goals to reduce the cancellation rates.
Staffing
• Create team building opportunities for the staff.
• Work on providing a healthy work/life balance for all team members.
• Create growth opportunities for staff to improve retention.
• Add full-time staff positions to add to the program menu.
Facility
• Evaluate the best and most efficient use of facility space that will generate increased participation – consider renovating spaces that are not used to capacity.
21 High Level Maintenance
Park Inventory, Assessment, & Analysis 03
Park Inventory Assessment & Analysis
LEVEL OF SERVICE (LOS)
Establishing a Goal
In order to determine if the amount of parkland in Grandview is sufficient to serve its residents, we have to establish some grounds for measurement. In the 1930’s, George Butler of the National Recreation Association proposed a standard of “10 acres of park open space per 1,000 population within each city, plus an equal area in parkways, large parks, forests, and the like, either within or adjacent to the city” (Mertes and Hall 1996). This metric calculates the number of acres of parkland per capita and is referred to as an Acreage Level of Service (LOS). It has often been used as a basis for benchmarking or comparing a community’s parks system to other communities.
Since then, the National Recreation and Park Association (NRPA) has determined that there are many factors, such as location, which need to be considered, so they no longer promote 10 acres per 1,000 as a blanket standard. One of the limitations of using the Acreage LOS standard alone is that it doesn’t account for factors such as equitable distribution, the capacity or quality of the facilities, or the level of programming. Today, the old standard is often used as a baseline reference, which on a national level, 10 acres per 1,000 tends to be the median. However, when looking at more regional data, the number of acres per 1,000 may be significantly higher or lower. Communities can use this information to develop goals that feel more commensurate with their community in relation to others with similar characteristics, such as population and size of operating budget. Additionally, Acreage LOS goals should be developed to a level that allows them to maintain and monitor a supply of parkland that is commensurate with a community's growth and resources.
In addition to population, the size of a park department's operating budget is a factor that should be considered when using benchmarks to determine LOS goals. The budget size varies greatly from one community to the next and should not be considered proportional to a city's geographic size,
or population. There are communities with large land masses or high populations that have small operating budgets. Conversely, there are many communities that are fairly small in geographic size or population, but have relatively large budgets.
Benchmarking data for this study was obtained from the NRPA Park Metrics database. Comparison characteristics for this plan were broken down into the following 3 categories:
National comparison of all reporting municipalities.
Regional comparison of all reporting municipalities.
Population size comparable to Grandview (20,000 to 49,999).
Budget size comparable to Grandview ($1 to $5 million).
# of Acres Maintained comparable to Grandview (<250 acres).
While these benchmarks provide a guide on a more macro scale perspective, the data should also be considered alongside NRPA guidelines for the amount of parkland (number of acres per 1,000) by park type classification.
Determining Level of Service (LOS)
A target acreage LOS was derived by averaging national and regional data based on population and budget comparisons (Table 1). Other factors that influenced the target LOS included review of projected growth, current growth patterns, current parkland distribution, department budget, staffing capacity, and available or potentially available land.
An overall target LOS of 9.5 acres of parkland per 1,000 residents was identified for Grandview, as shown in table 1 and figures 1 and 2. This suggests that Grandview potentially needs to add 82 acres of community park space to meet the target. The figures on the following page help to visualize the table data by illustrating Grandview in comparison to regional and national trends, with a dashed line showing the target goal for future planning.
23 High Level Maintenance
Acres of Parkland per 1,000 Residents
This measure is used to determine how well a community is acquiring park land relative to the rate of population growth. Currently, Grandview maintains more acres of land than the median for cities with comparable acreage. However, it falls below national and regional trends as well as cities with similar population and operating budget sizes.
# of Residents Per Park
This measure gives a sense for how crowded parks may become relative to the number of parks available for Grandview residents to patron. Current numbers suggest that Grandview has more parks available than the national average and is comparable with similar municipalities
24 High Level Maintenance
NRPA Relevant Perspective Comparisons 2022 NRPA Median Grandview Current Minimum Required # of Parks Acres Grandview Needs National Residents Per Park 2,323 1,875 11 0 Acres of Parkland per 1,000 Residents 10.40 6.43 273 104 Midwest Residents Per Park 1,751 1,875 15 1 Acres of Park Land per 1,000 Residents 10.40 6.43 273 104 POPULATION ( 20,000 - 49,999) Residents Per Park 1,941 1,875 14 0 Acres of Park Land per 1,000 Residents 10.60 6.43 278 109 BUDGET SIZE ($500k to $1 million) Residents Per Park 1,998 1,875 13 0 Acres of Park Land per 1,000 Residents 11.30 6.43 297 128 Acres of Parks Maintained (Less than 250) Residents Per Park 1,998 1,875 13 0 Acres of Park Land per 1,000 Residents 5.10 6.43 134 - 35 Target # of Residents per Park (Averaged): 2,002 13 parks 0 parks Target Acres of Parkland per 1,000 (Averaged): 9.56 251 acres 82 acres
TABLE
1LEVEL OF SERVICE (LOS) BENCHMARKS
Figure 1: Figure 2: 10.40 10.40 6.43 10.60 11.30 5.10 0 3 6 9 12 National Midwest Grandview Population <20,000 Budget Siz $500k-$1M Acres Maintained (<250 acres) Acres of Parkland per 1,000 Residents By Comparison to Relavant NRPA Metrics Target LOS: 9.5 Budget Size $500k-$1M 2,323 1,751 1,875 1,941 1,998 1,998 0 1,000 2,000 National Midwest Grandview Population <20,000 Budget Size $500k-$1M Acres Maintained (<250 acres) #
Residents
By Comparison to Relavant NRPA Metrics (The higher the number the more crowded parks are) Target: 1,875
of
Per Park
LOS by Park Type
Next, we want to take a closer look at how well the Grandview park system is served by specific types of parks. Table 1 gave us an overall indication of how much parkland the Grandview park system should have. It indicated that while Grandview's number of parks seems on par with similar communities, Grandview's overall amount of land falls short by comparison. The next questions we want to answer are: what type of parkland is needed, and where is it needed most?
Table 2 below shows a zoomed in view of Grandview's LOS compared to NRPA suggested norms by park type. A target LOS was set for each park type for the next 10 years. Factors that influenced target settings included Table 1 benchmark comparisons, budget, staffing, and public input. Grandview's target LOS is set at 9.56 acres of land per 1,000 residents which indicates a potential need to add 82 acres of community park space.
The maps and planning area analysis on the following pages analyze the distribution of parks and provide an indication of where gaps in service exist and where there may be a need for additional parkland.
25 High Level Maintenance LEVEL OF SERVICE SUMMARY 2022 Population Estimate 26,252 City Square Miles 14.79 Population per Sq. mile 1,775 Number of Parks 14 Park Acres 168.92 Residents Per Park 1,875 NRPA Comparison LOS (acres per 1,000 residents) 9.56 Current LOS (acres per 1,000 residents) 6.43 Target LOS (acres per 1,000 residents) 9.56 Target Total Parkland (Acres) 251 Additional Park Acres Needed 82 TABLE
TARGET LOS BY PARK TYPE NRPA Suggested LOS Range Acres per 1,000 residents NRPA Suggested Minimum Acres NRPA Suggested Acres Needed Target LOS Acres per 1,000 Residents Target Size Total Acres Additional Acres Needed to Reach Target Park Type Park Name Total (Acres) Current Acres per 1,000 Residents Mini Parks (1 acre or less) 0.65 0.02 0.25-.50 6.56 5.91 0.02 0.65 SUFFICIENT Neighborhood Parks (5 - 20 acres) 53.44 2.04 1-2 26.25 0 2.04 53.44 SUFFICIENT Community Parks (30 - 150 acres) 85.63 3.26 5-8 131.26 45.63 6.40 167.62 82.00 Special Use Parks (Size Varies) 29.20 0.45 VARIABLE N/A N/A N/A VARIABLE SUFFICIENT
2 -
Park Types
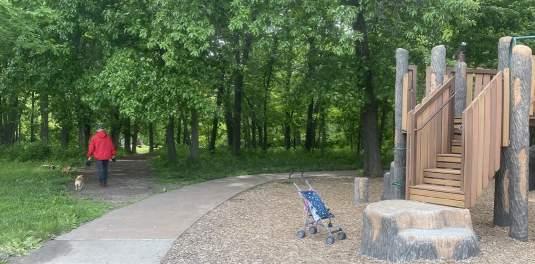
Neighborhood Parks - This basic unit of any park system is about 2 to 5 acres in size. Neighborhood parks serve the community with the capacity to provide recreational and social facilities. This type of park provides space for both active and passive recreational activities such as picnic areas, playgrounds, ball fields, multi-use open space, shelters, and walking paths. Neighborhood parks have a typical service radius of about 1/4 to 1/2- mile and account for about 1 to 2 acres per 1,000 residents.
Mini Parks - Sometimes called “Pocket Parks”, mini parks are the smallest type of park and have a service radius of 1/4- mile or less. These parks generally serve a specific function or open space need. About 1/4 to 1/2- acre per 1,000 residents is the general NRPA guideline for this type of parkland.
Community Parks - These are typically much larger in size than neighborhood parks at about 20-50 acres, and provide a wide range of facilities serving several neighborhoods. In some cases, this type of park can function on smaller properties depending on amenity offering, but typically not smaller than about 15-20 acres. Community parks often include a special attraction such as an aquatic center or city lake drawing people from throughout the community. Community parks have a service radius of about 1 to 3-miles and account for about 5 to 8-acres of parkland per 1,000 residents.
Special Use Parks - These parks typically serve specialized activities covering a broad range of facilities, which typically respond to cultural needs or single uses such as sports complexes. The size of this type of park varies as does the amount of parkland per capita need.
Natural Resource Areas - These areas may include park amenities, but they primarily play a larger more ecological role within the community. They generally preserve, restore, or provide access to natural resources and meet the need for open space preservation and trail needs.
26 High Level Maintenance
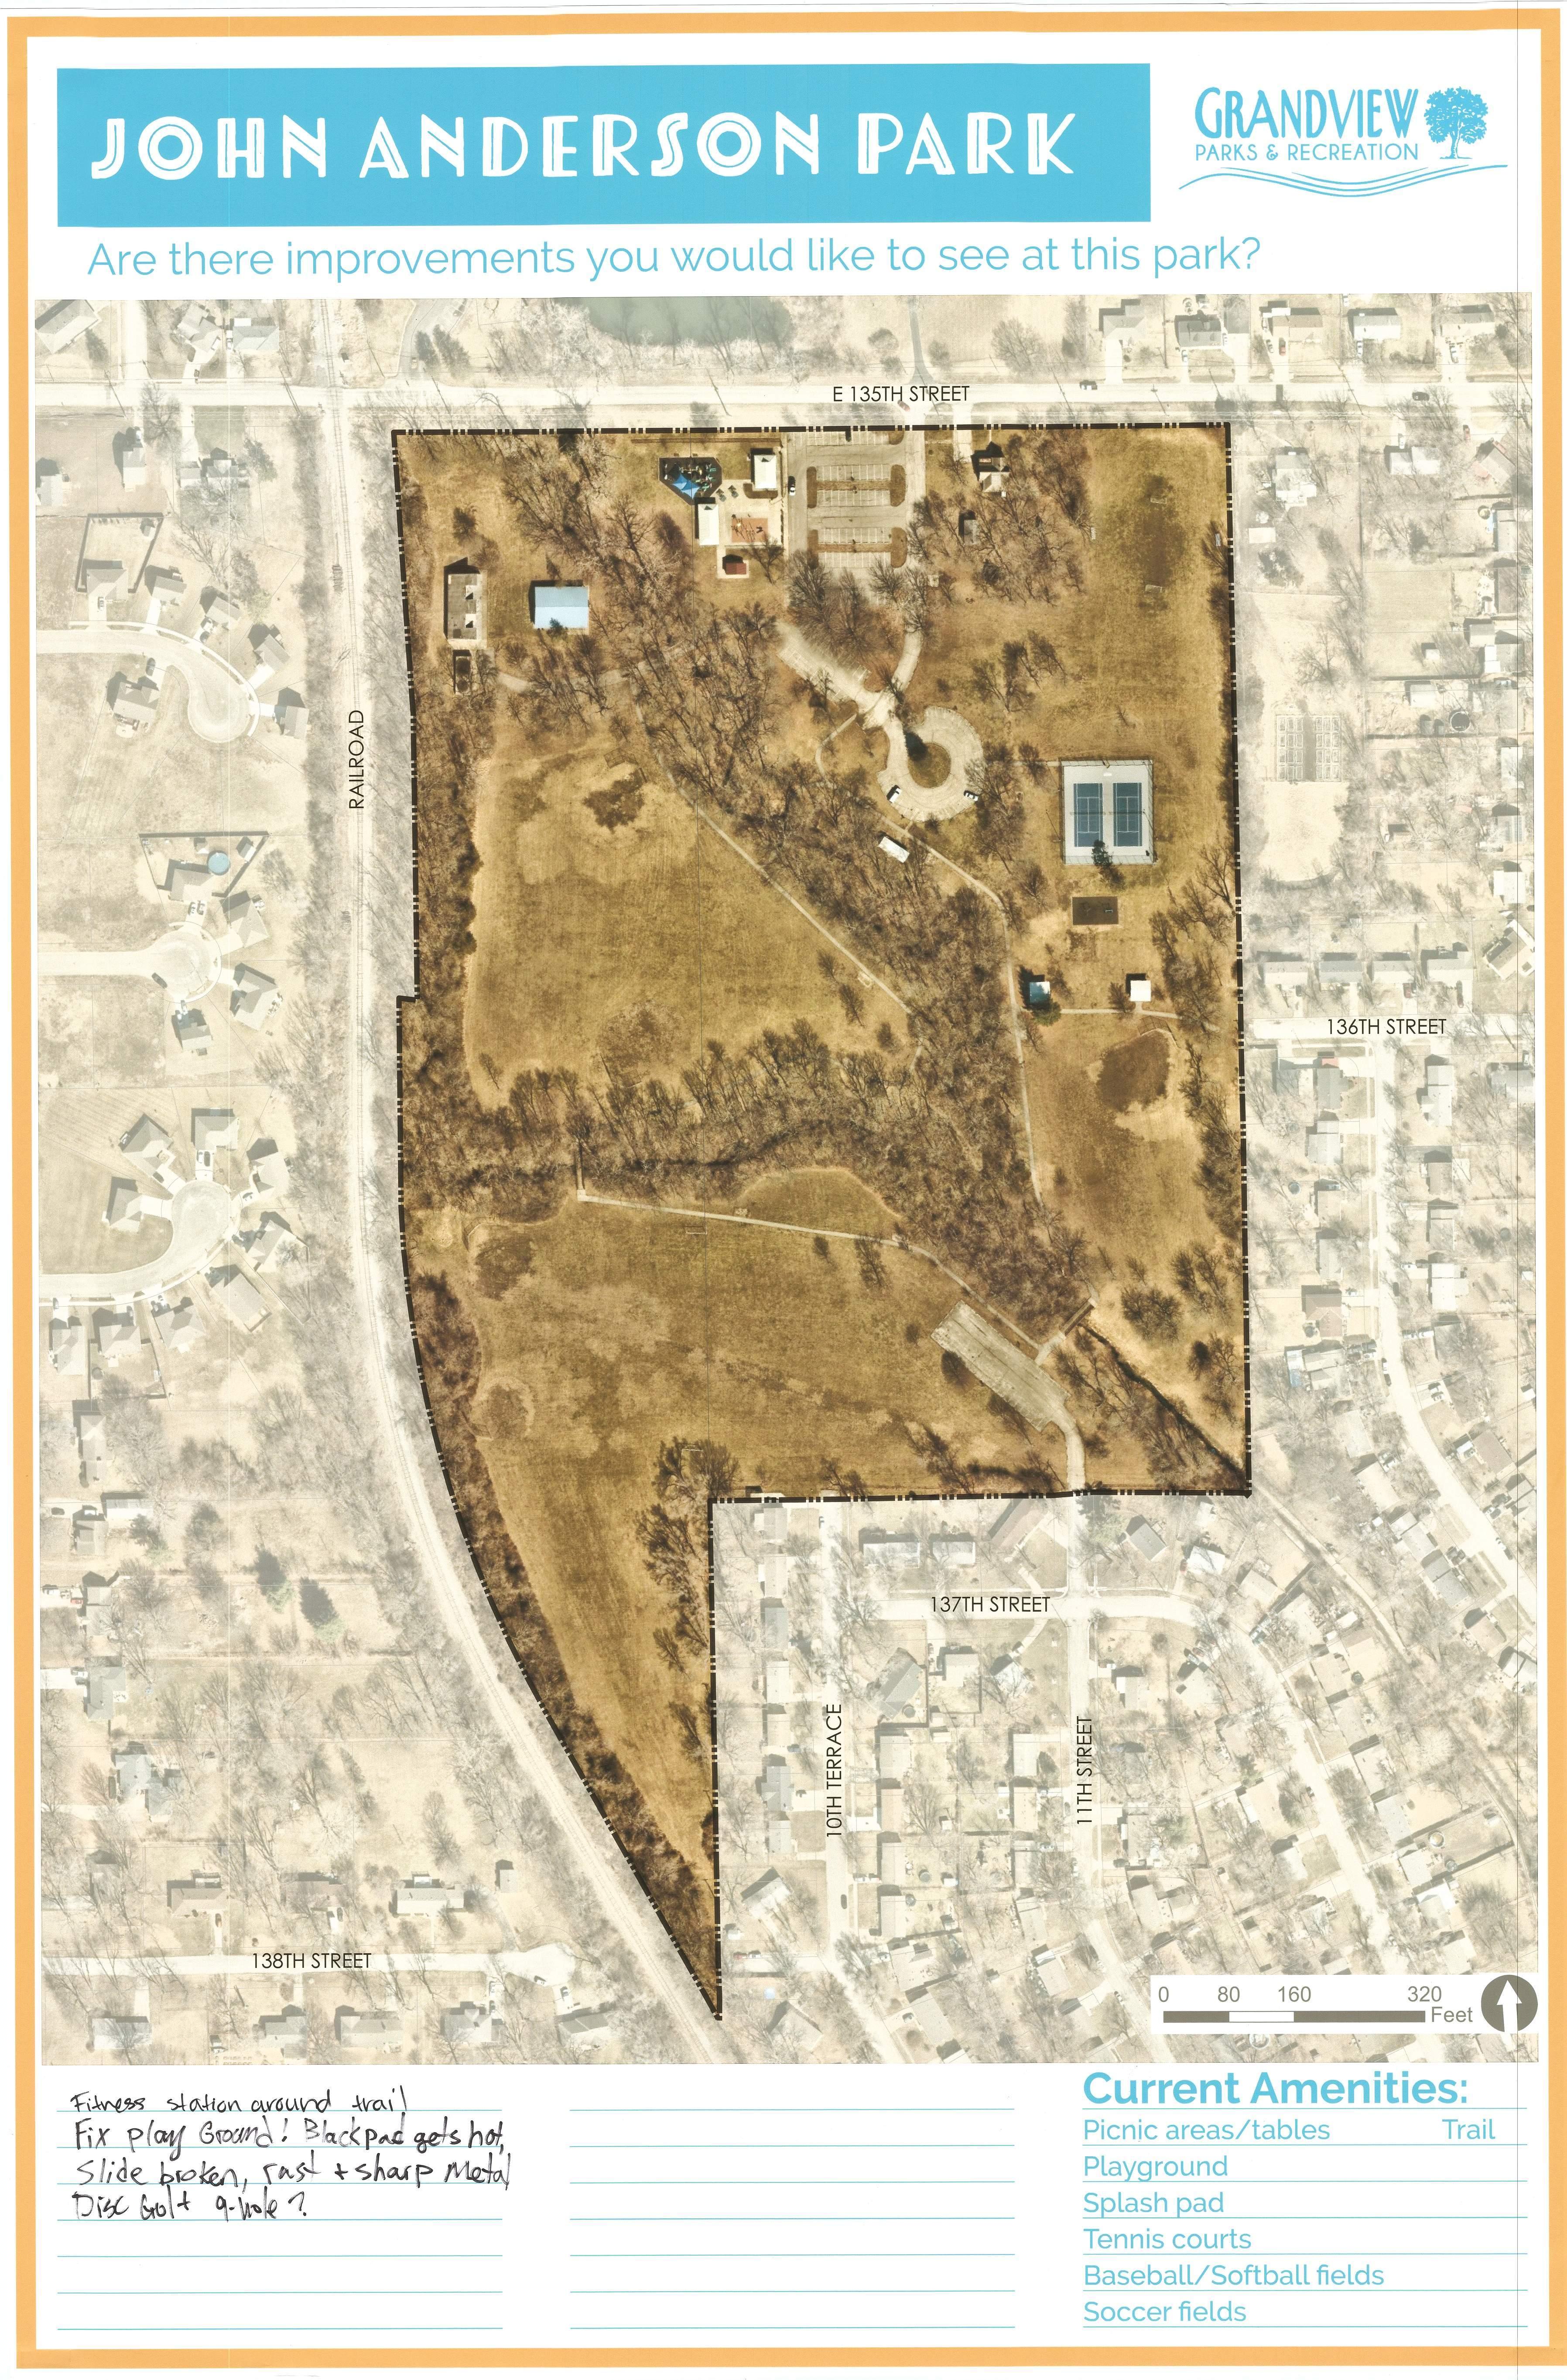
John Anderson Park
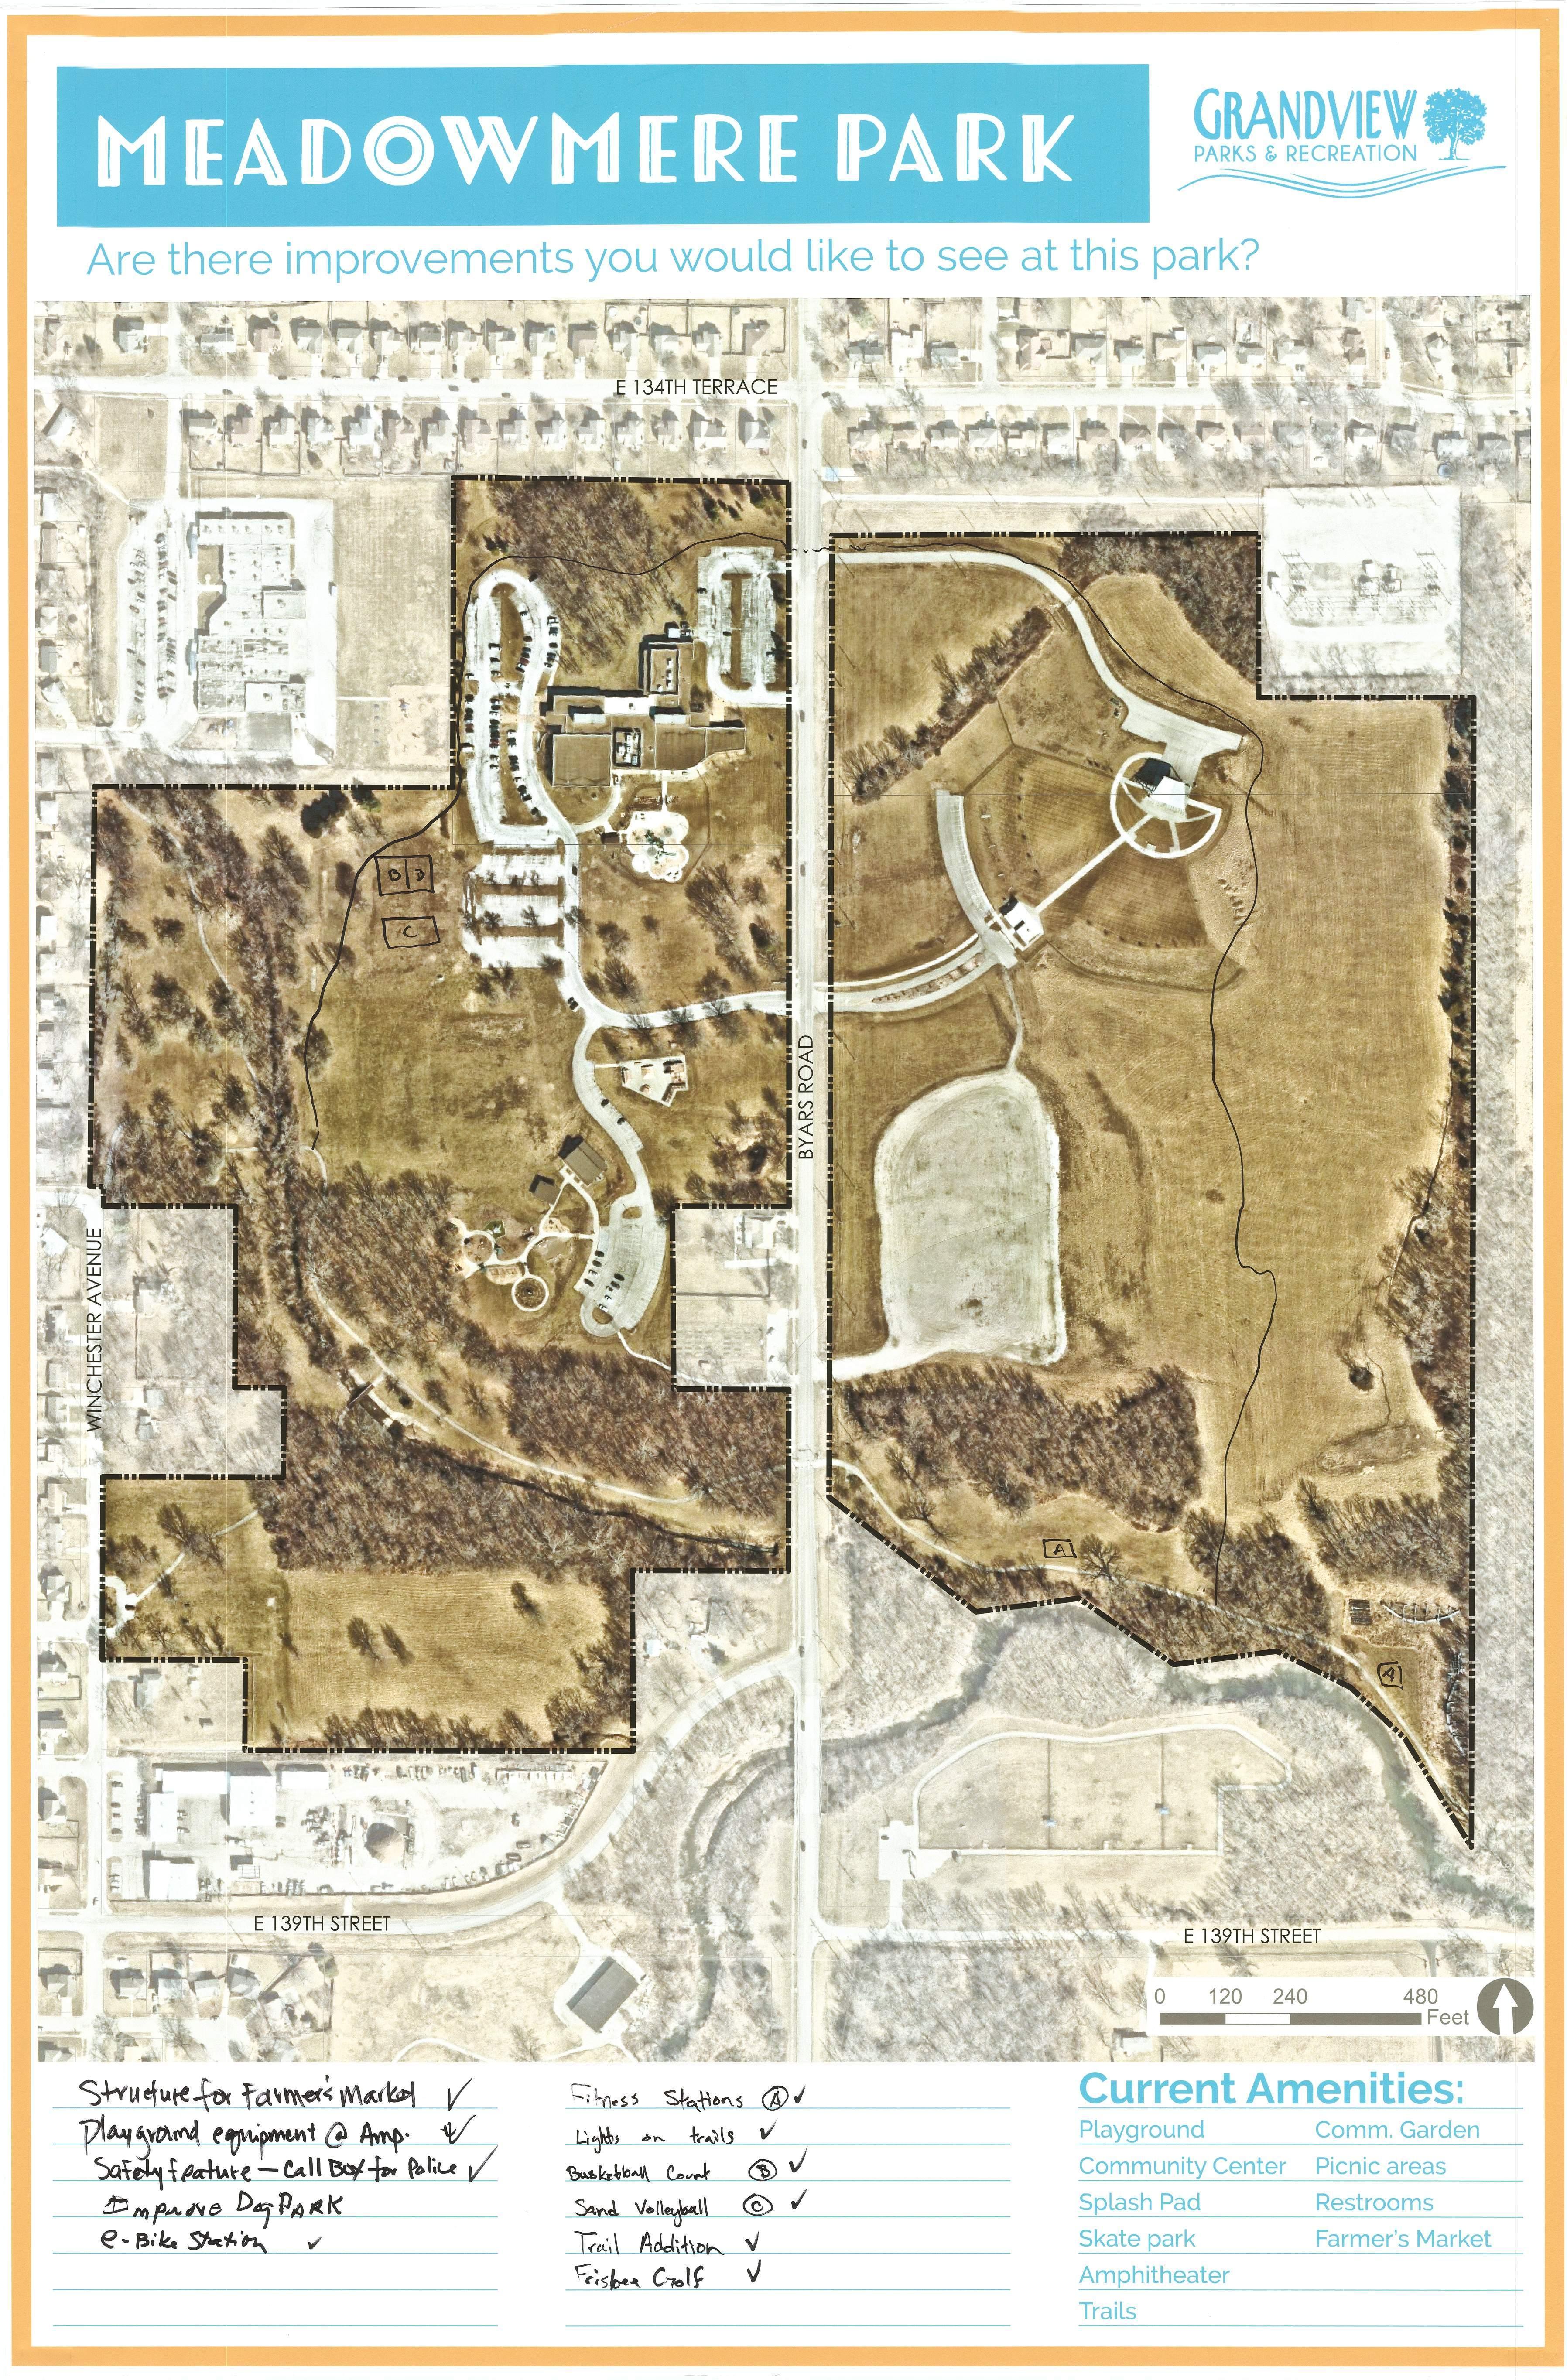
Meadowmere Park
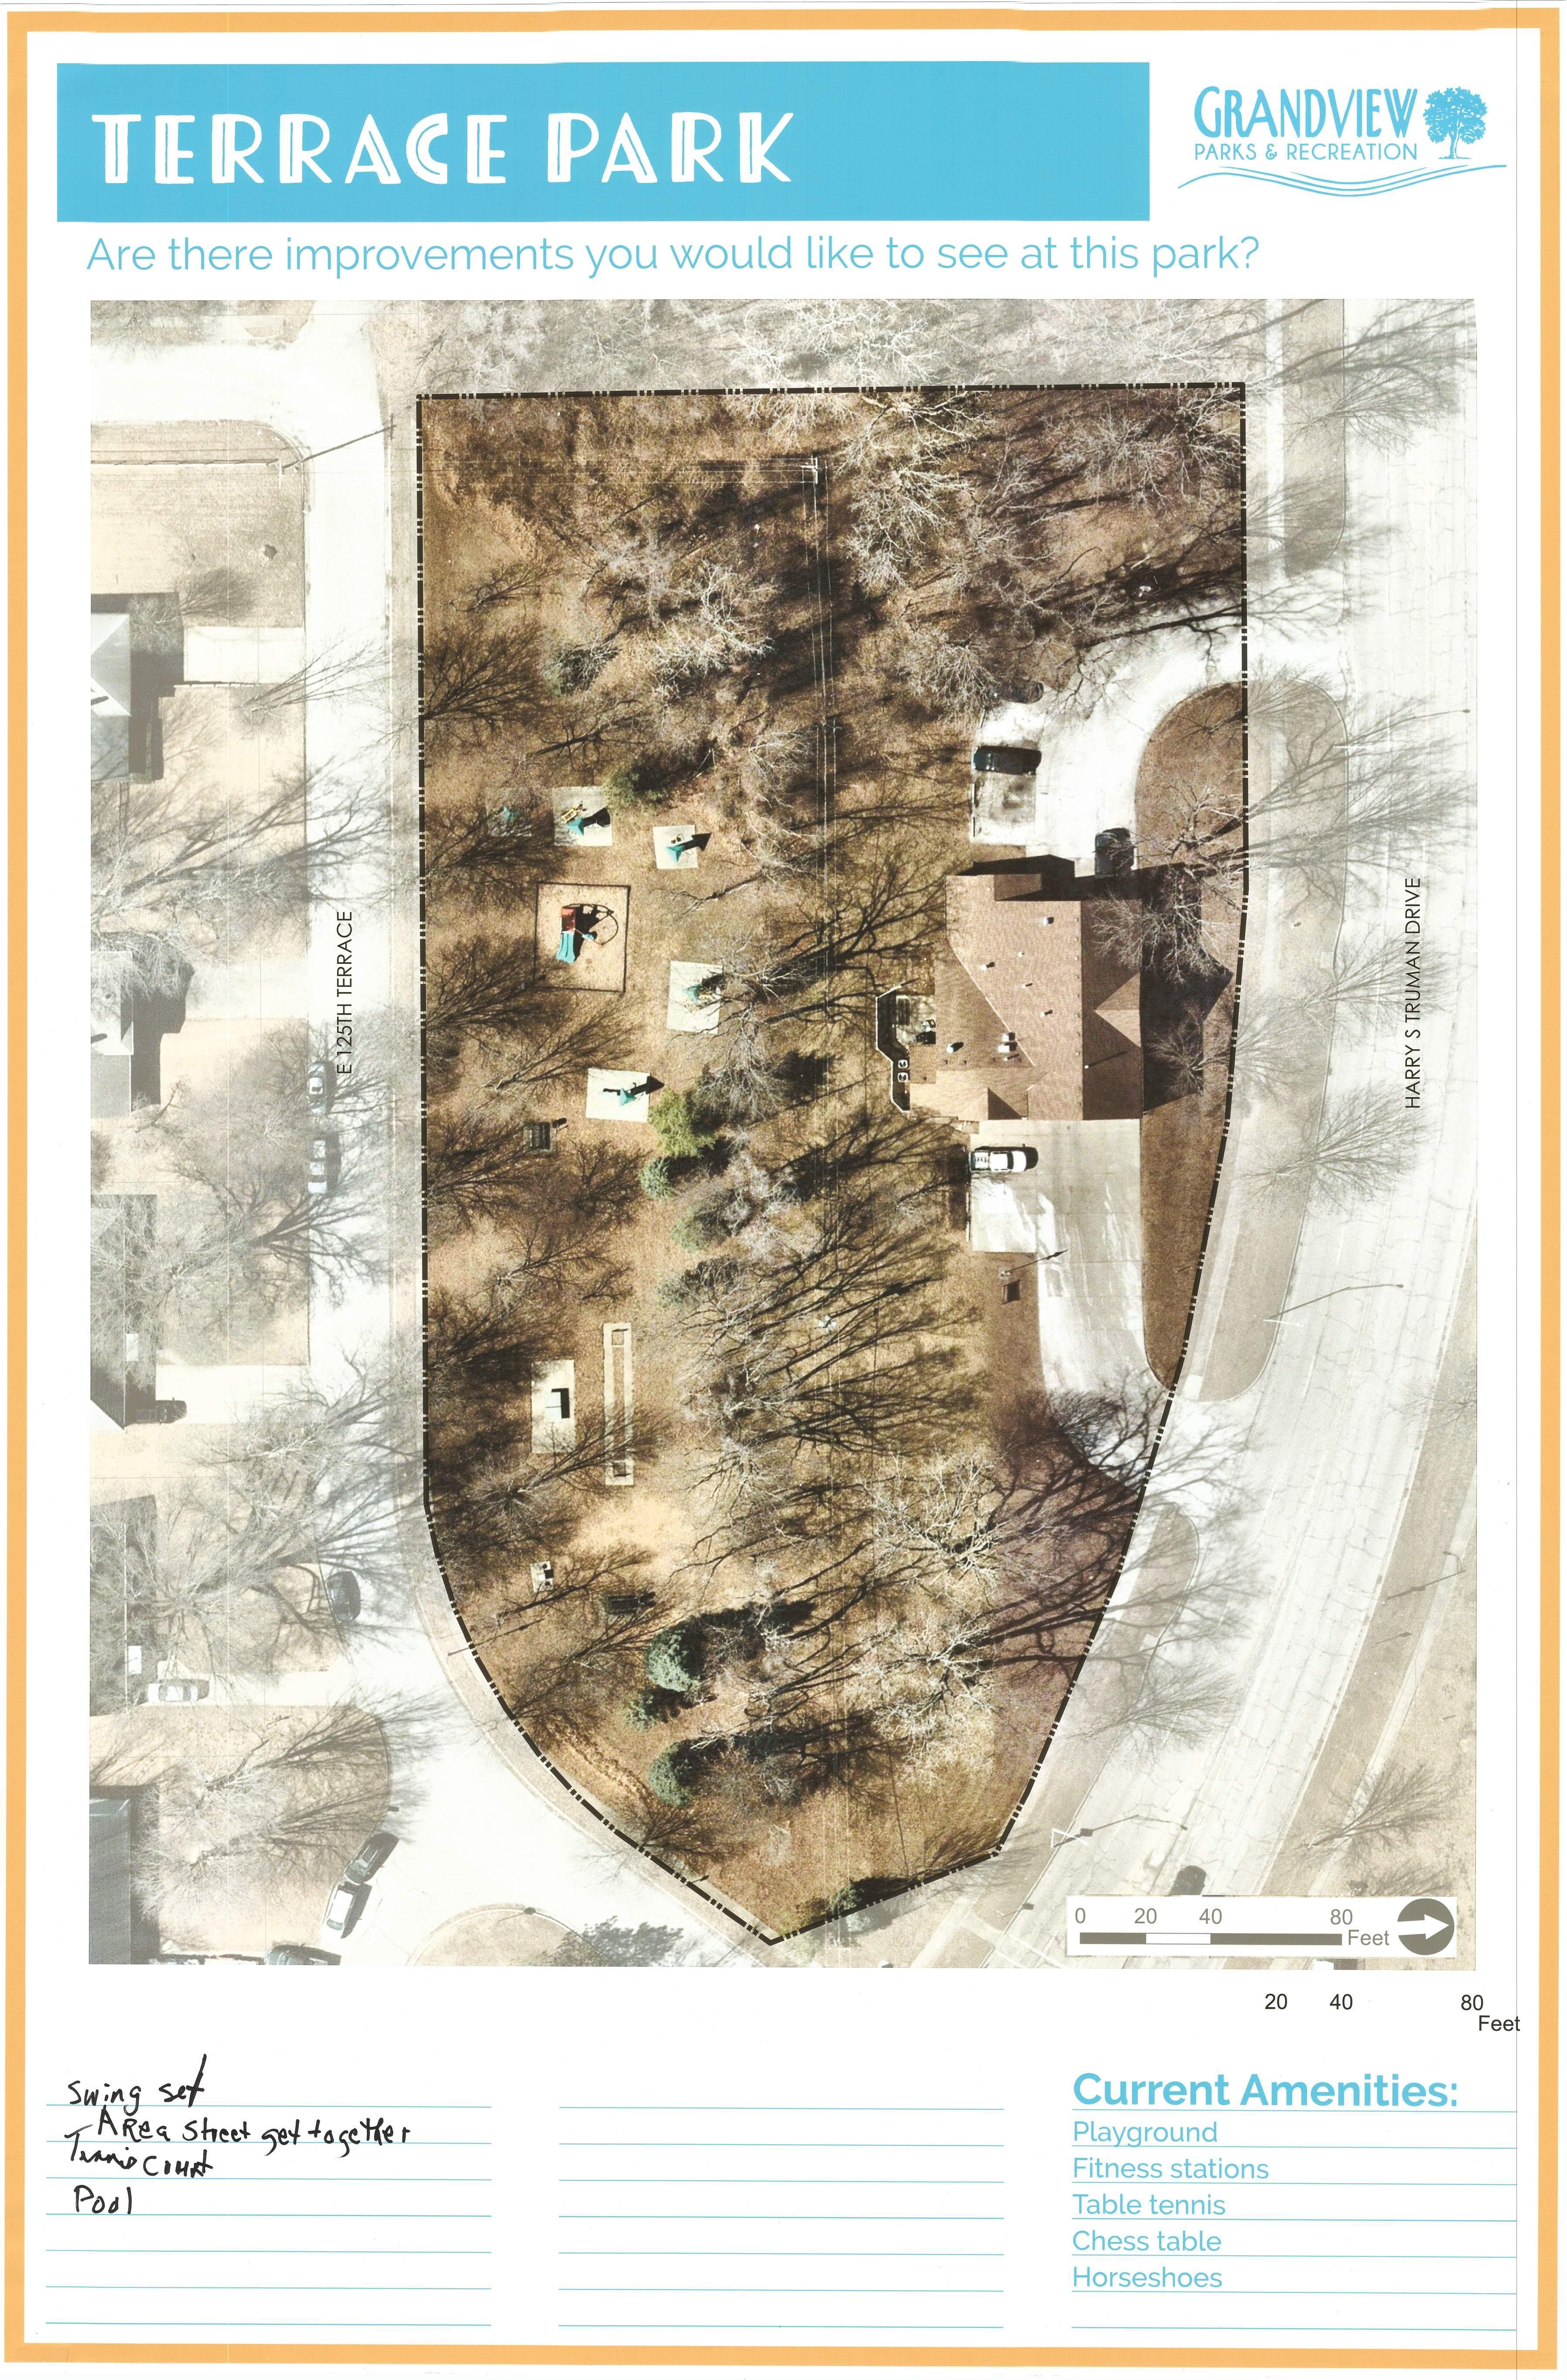
Terrace Park
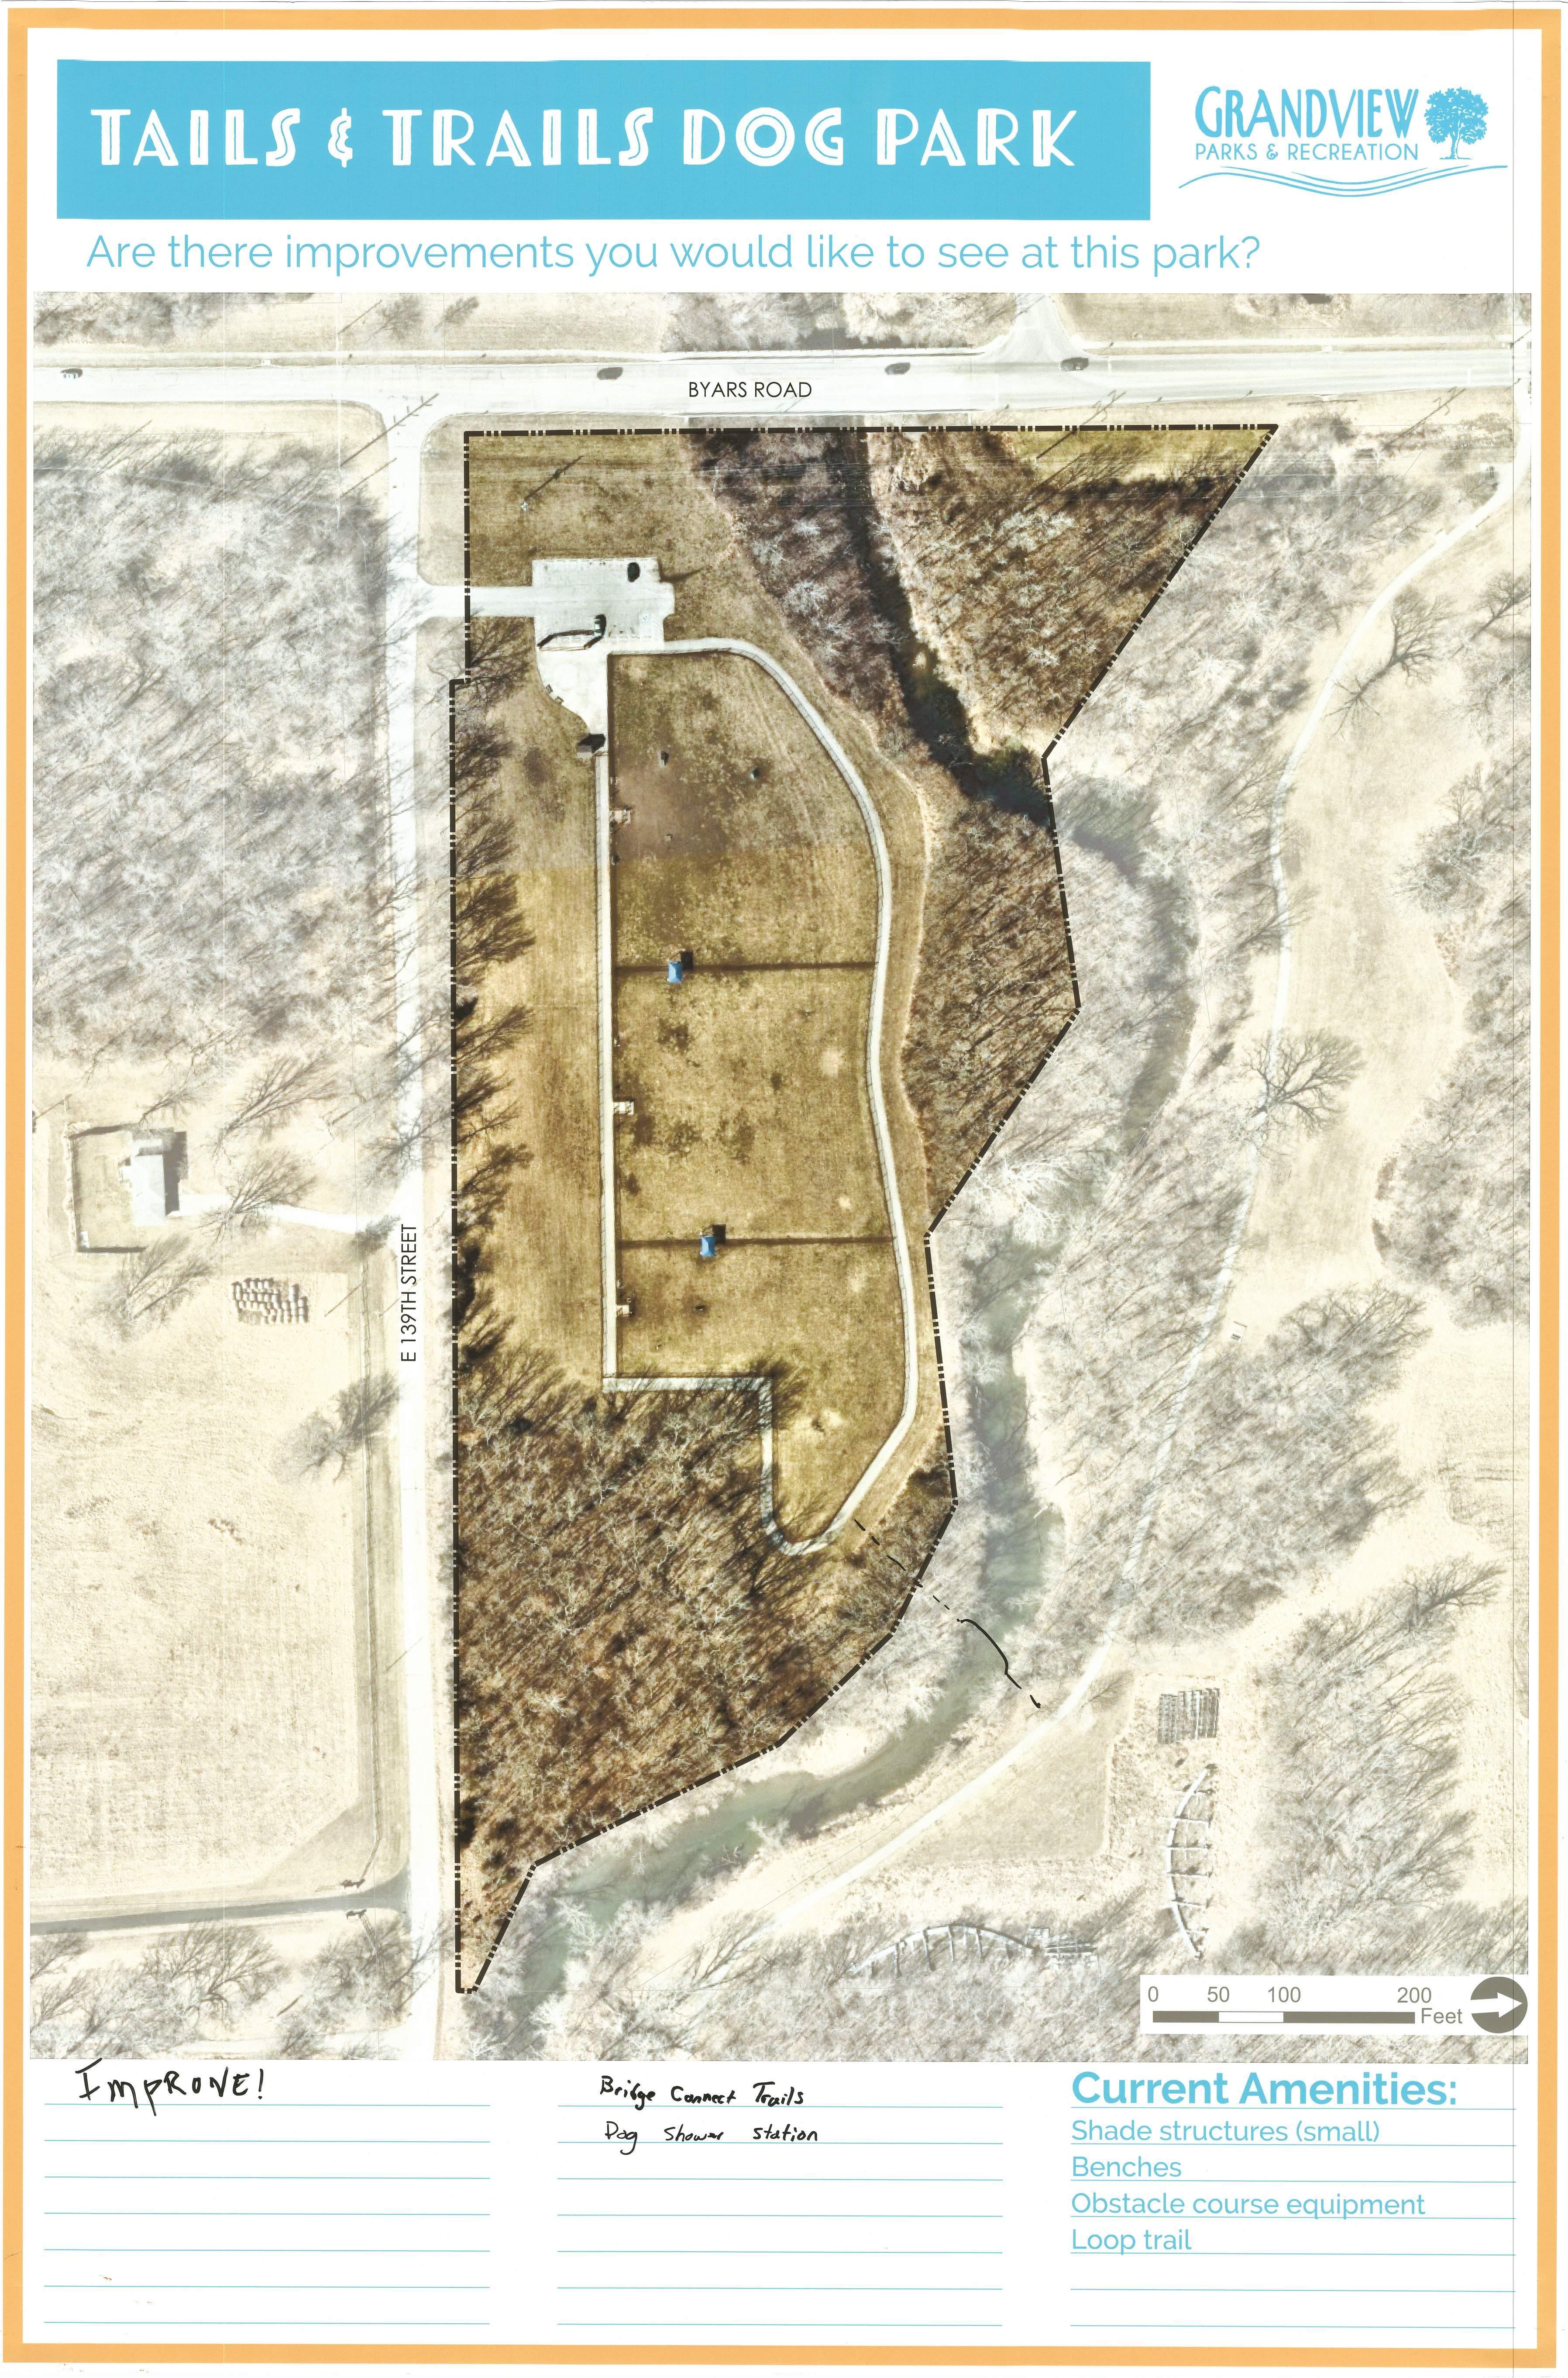
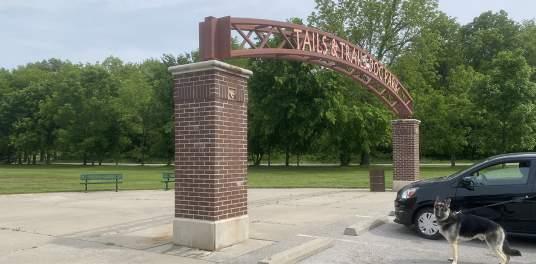
Tails & Trails Dog Park
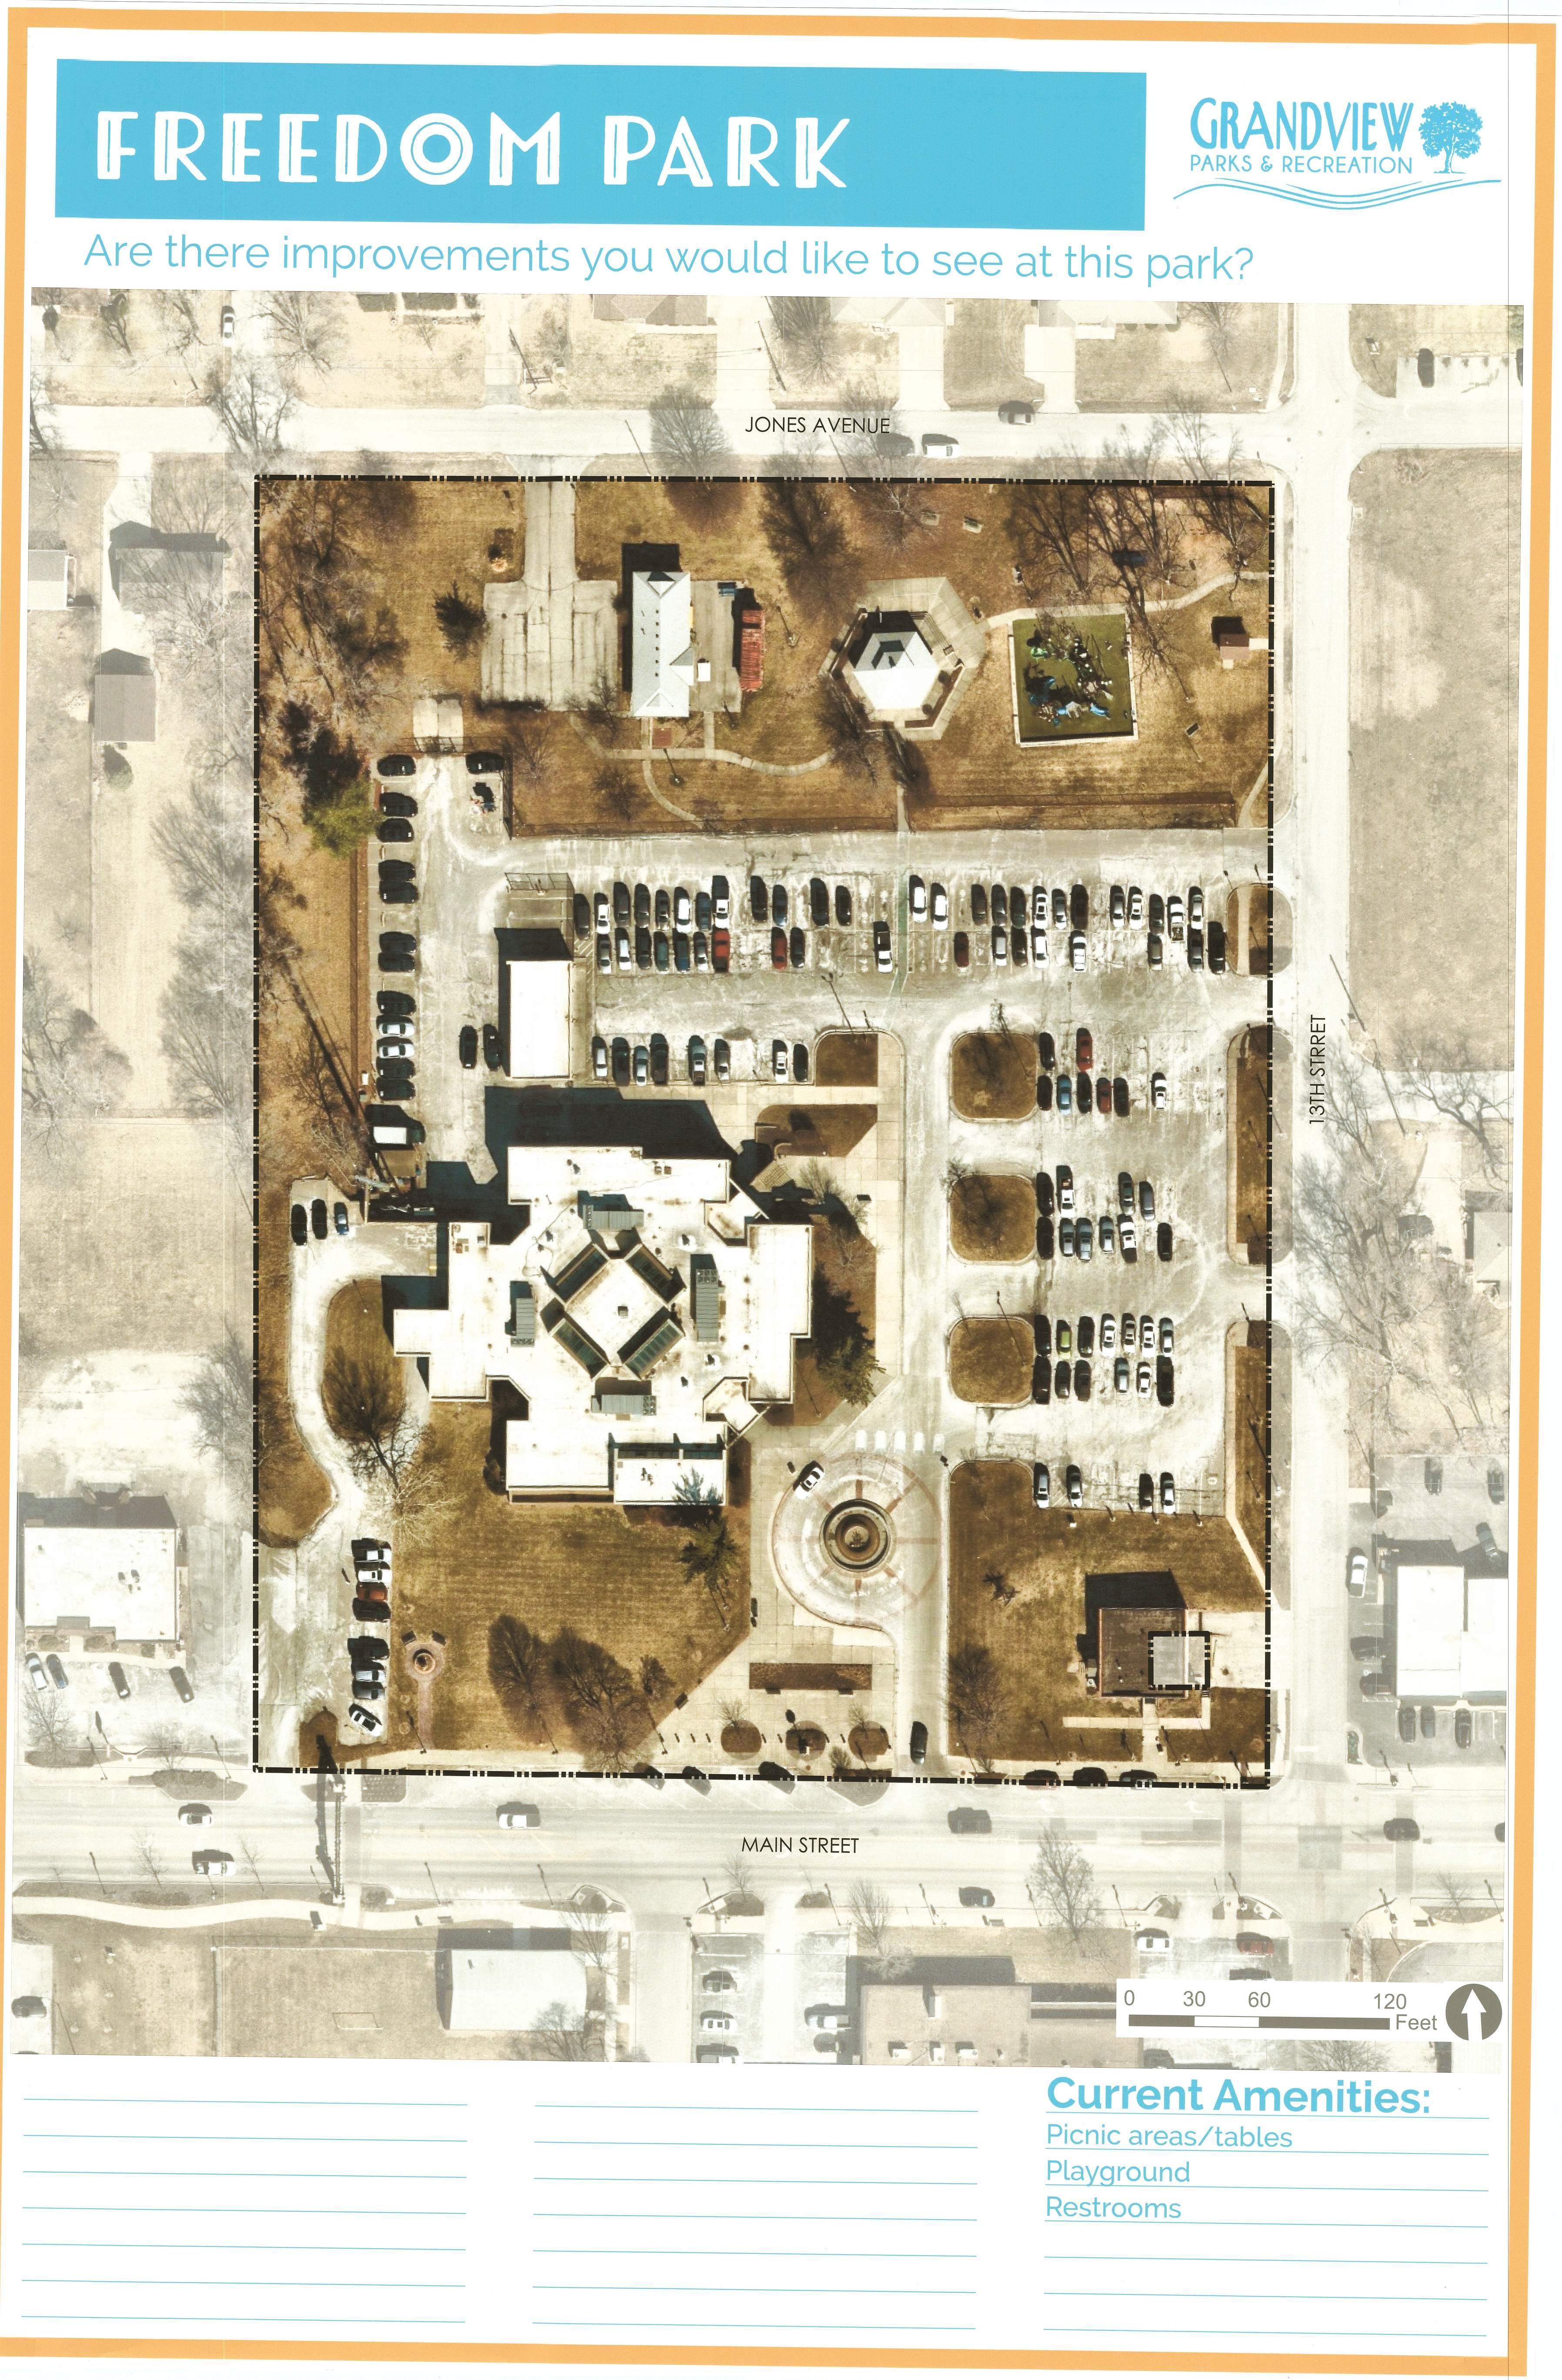
Freedom Park
Grandview Parks
0 0
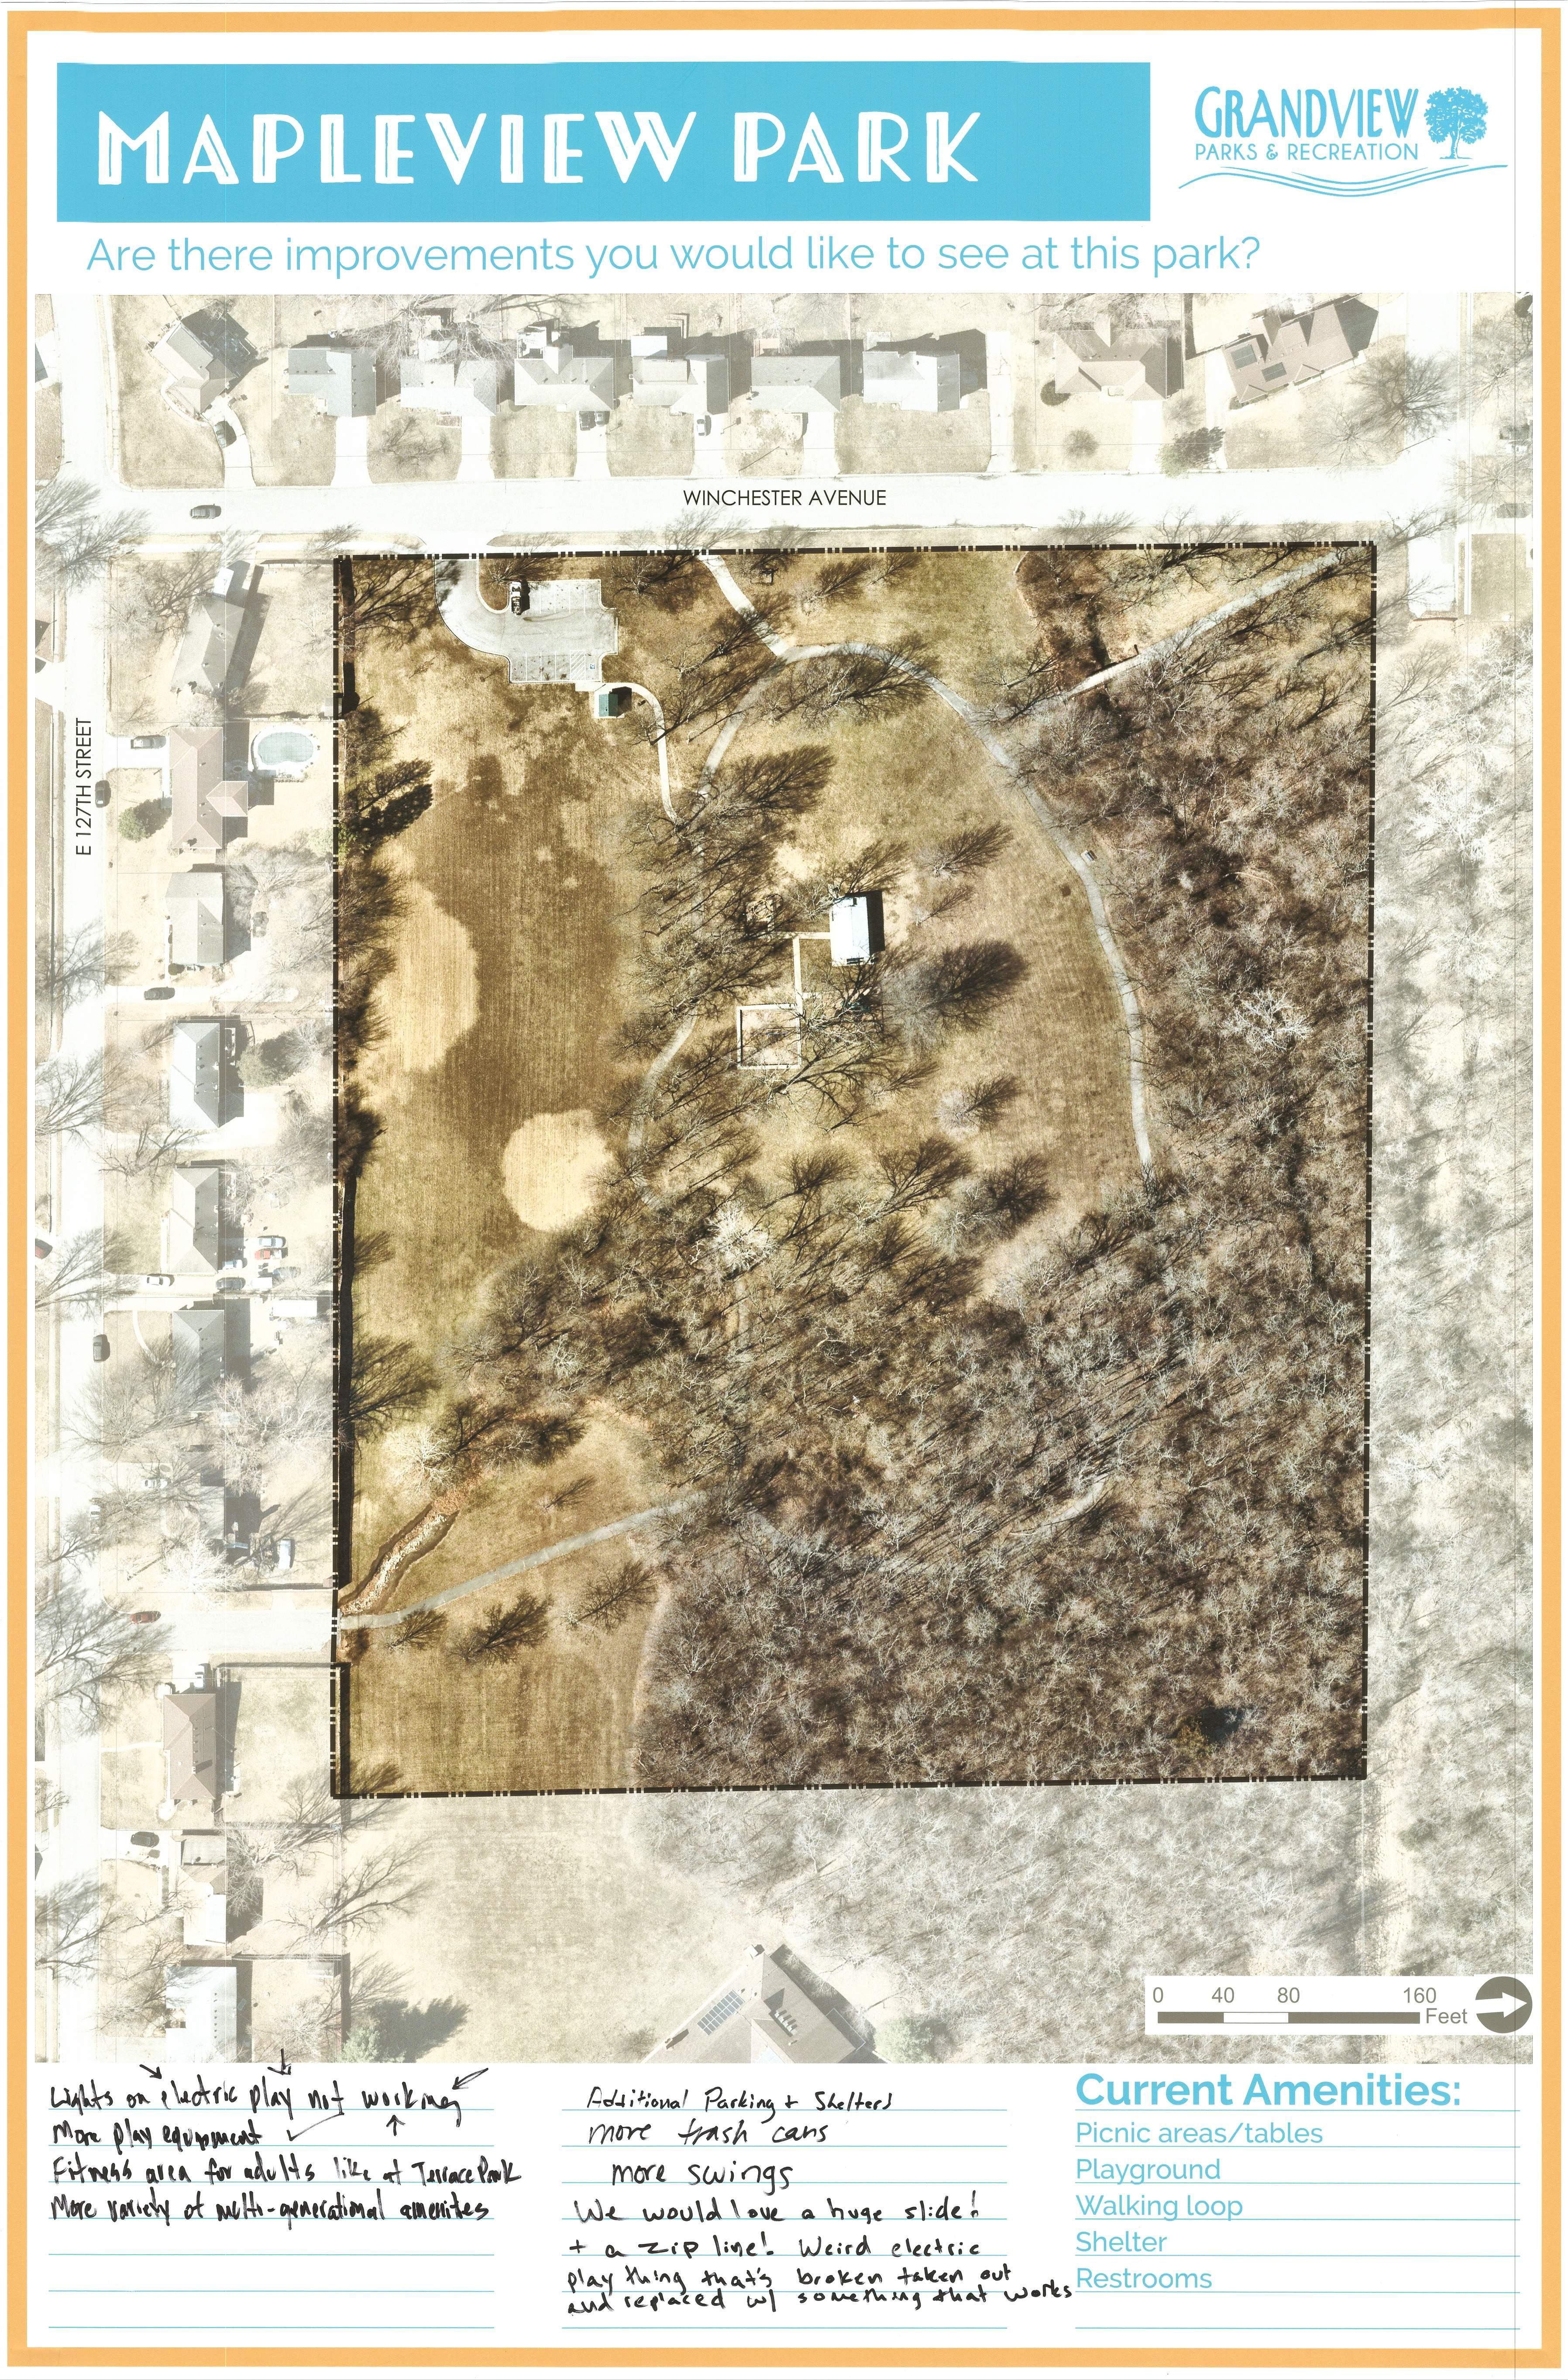
Mapleview Park
Meadowmere Park
John Anderson Park
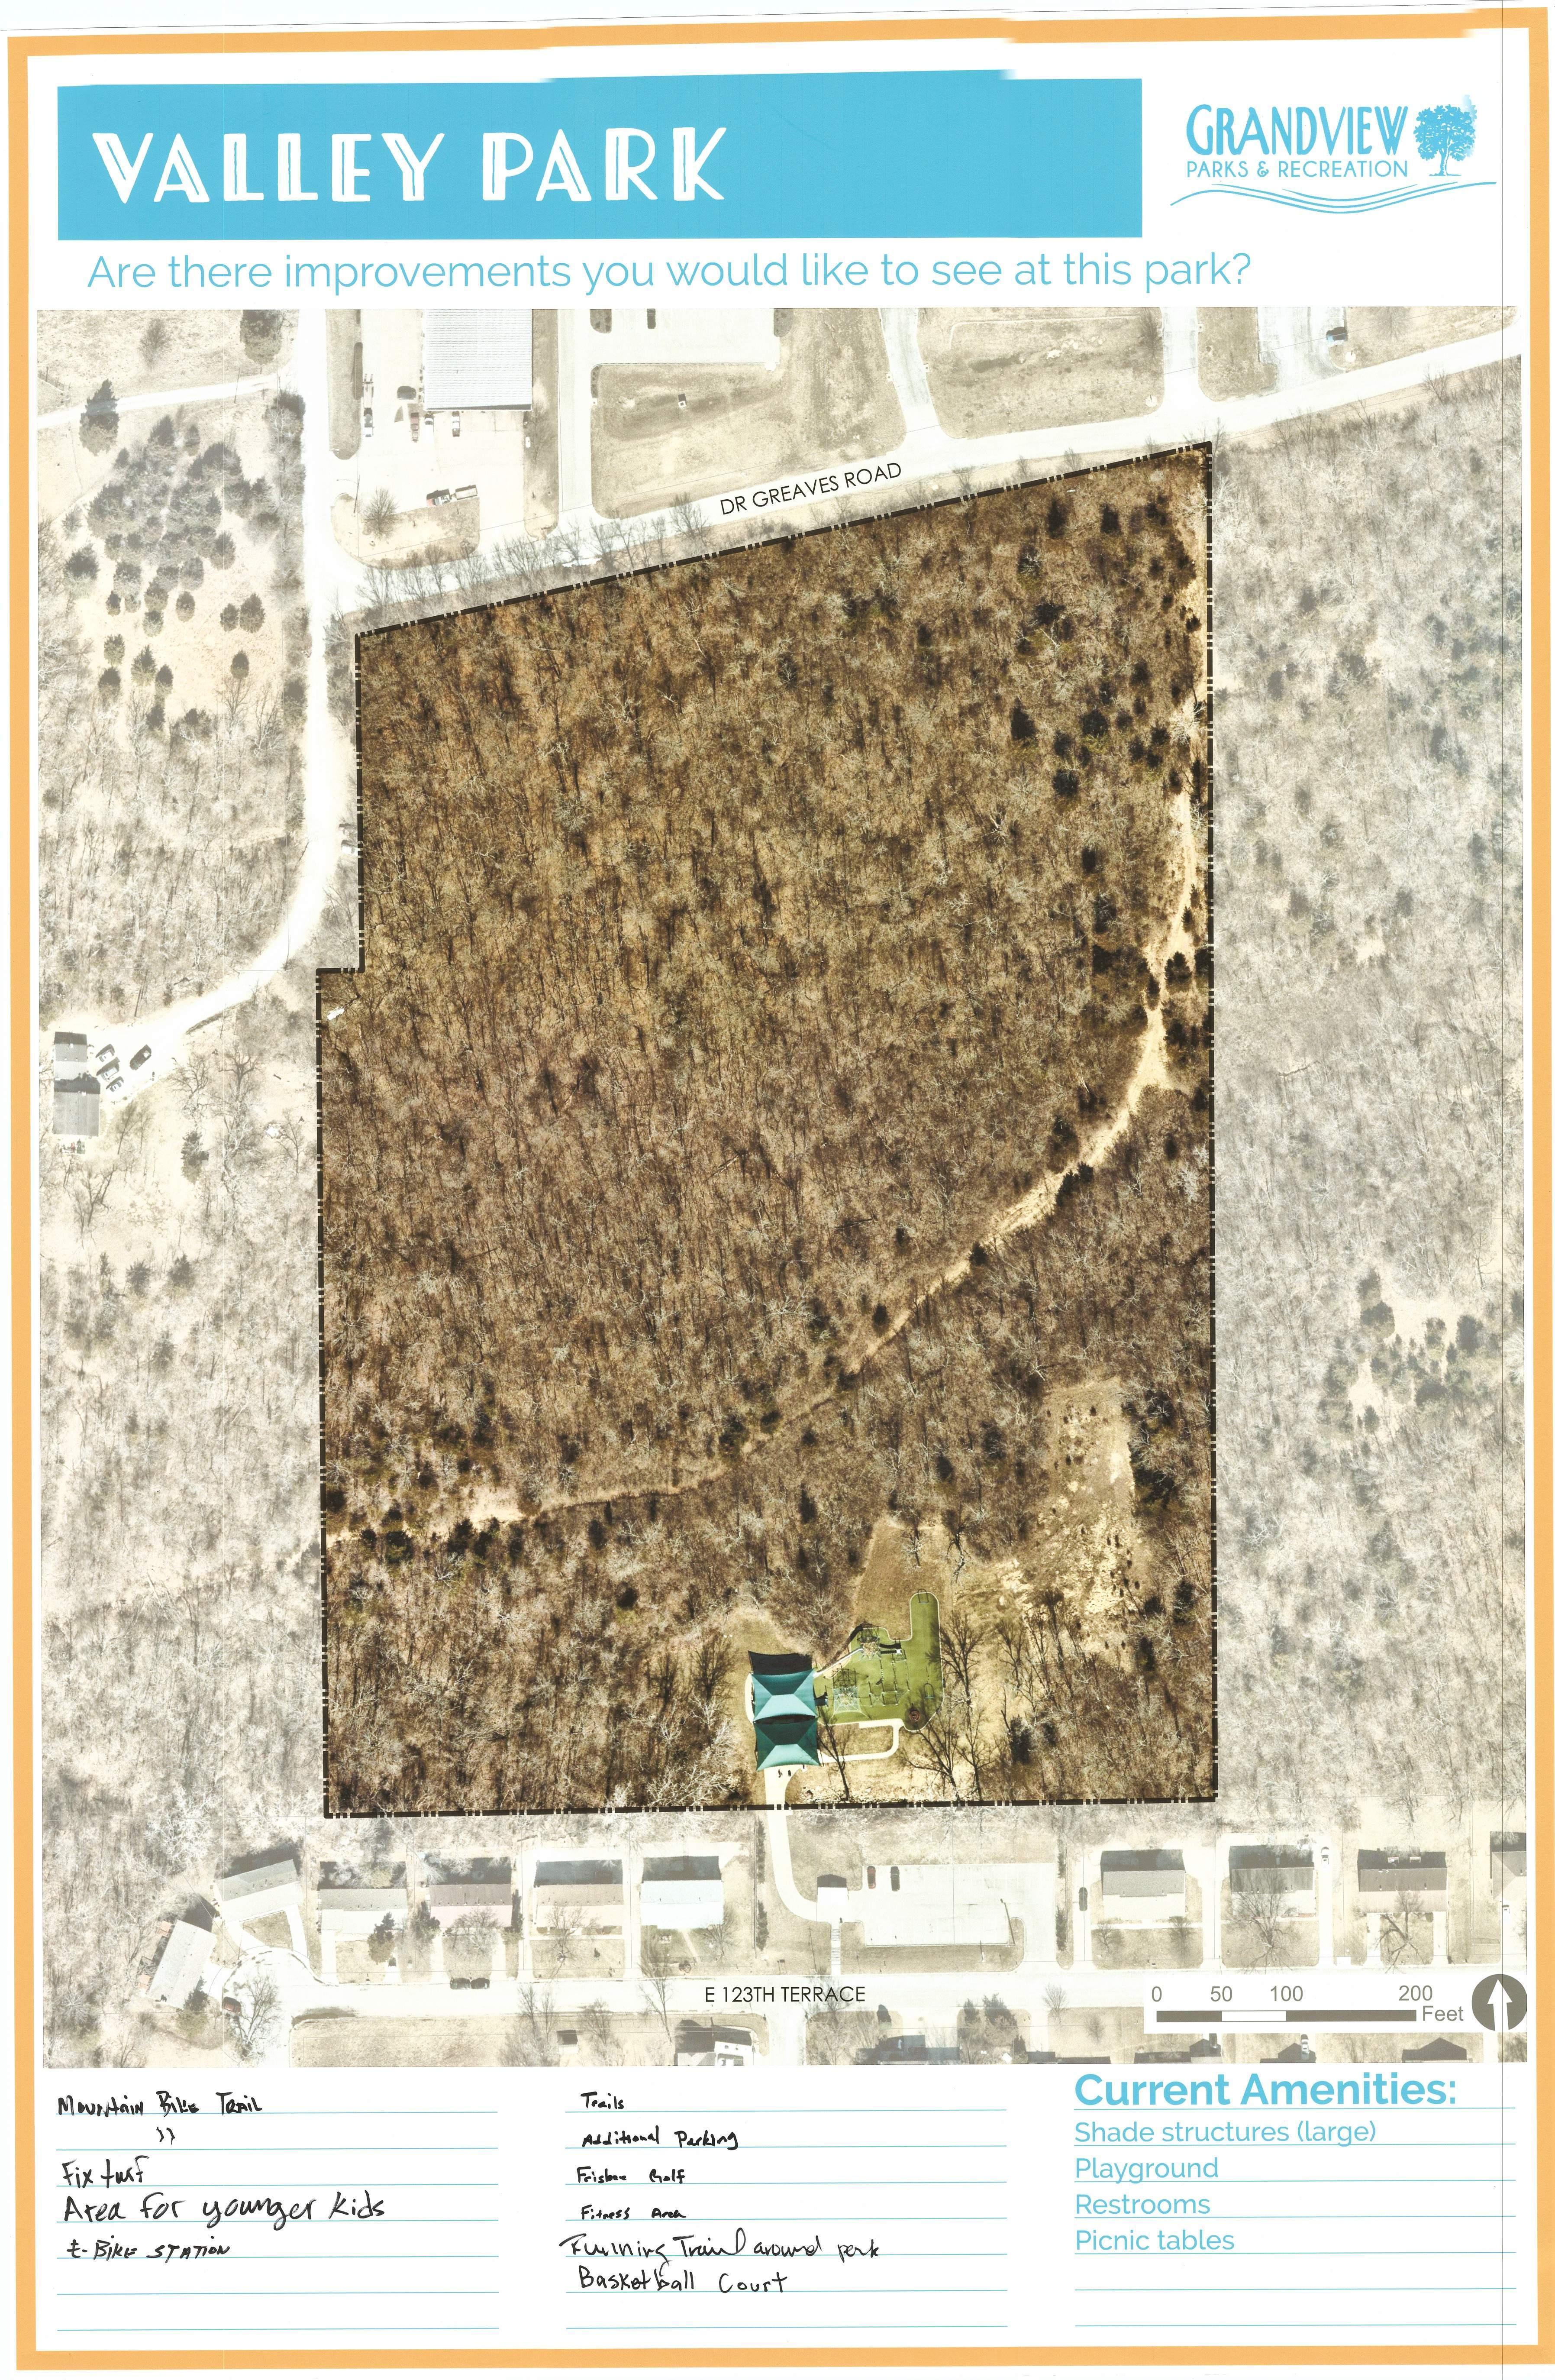
Valley Park
1 2 3 4 6 5 7 Legend Grandview
Parks
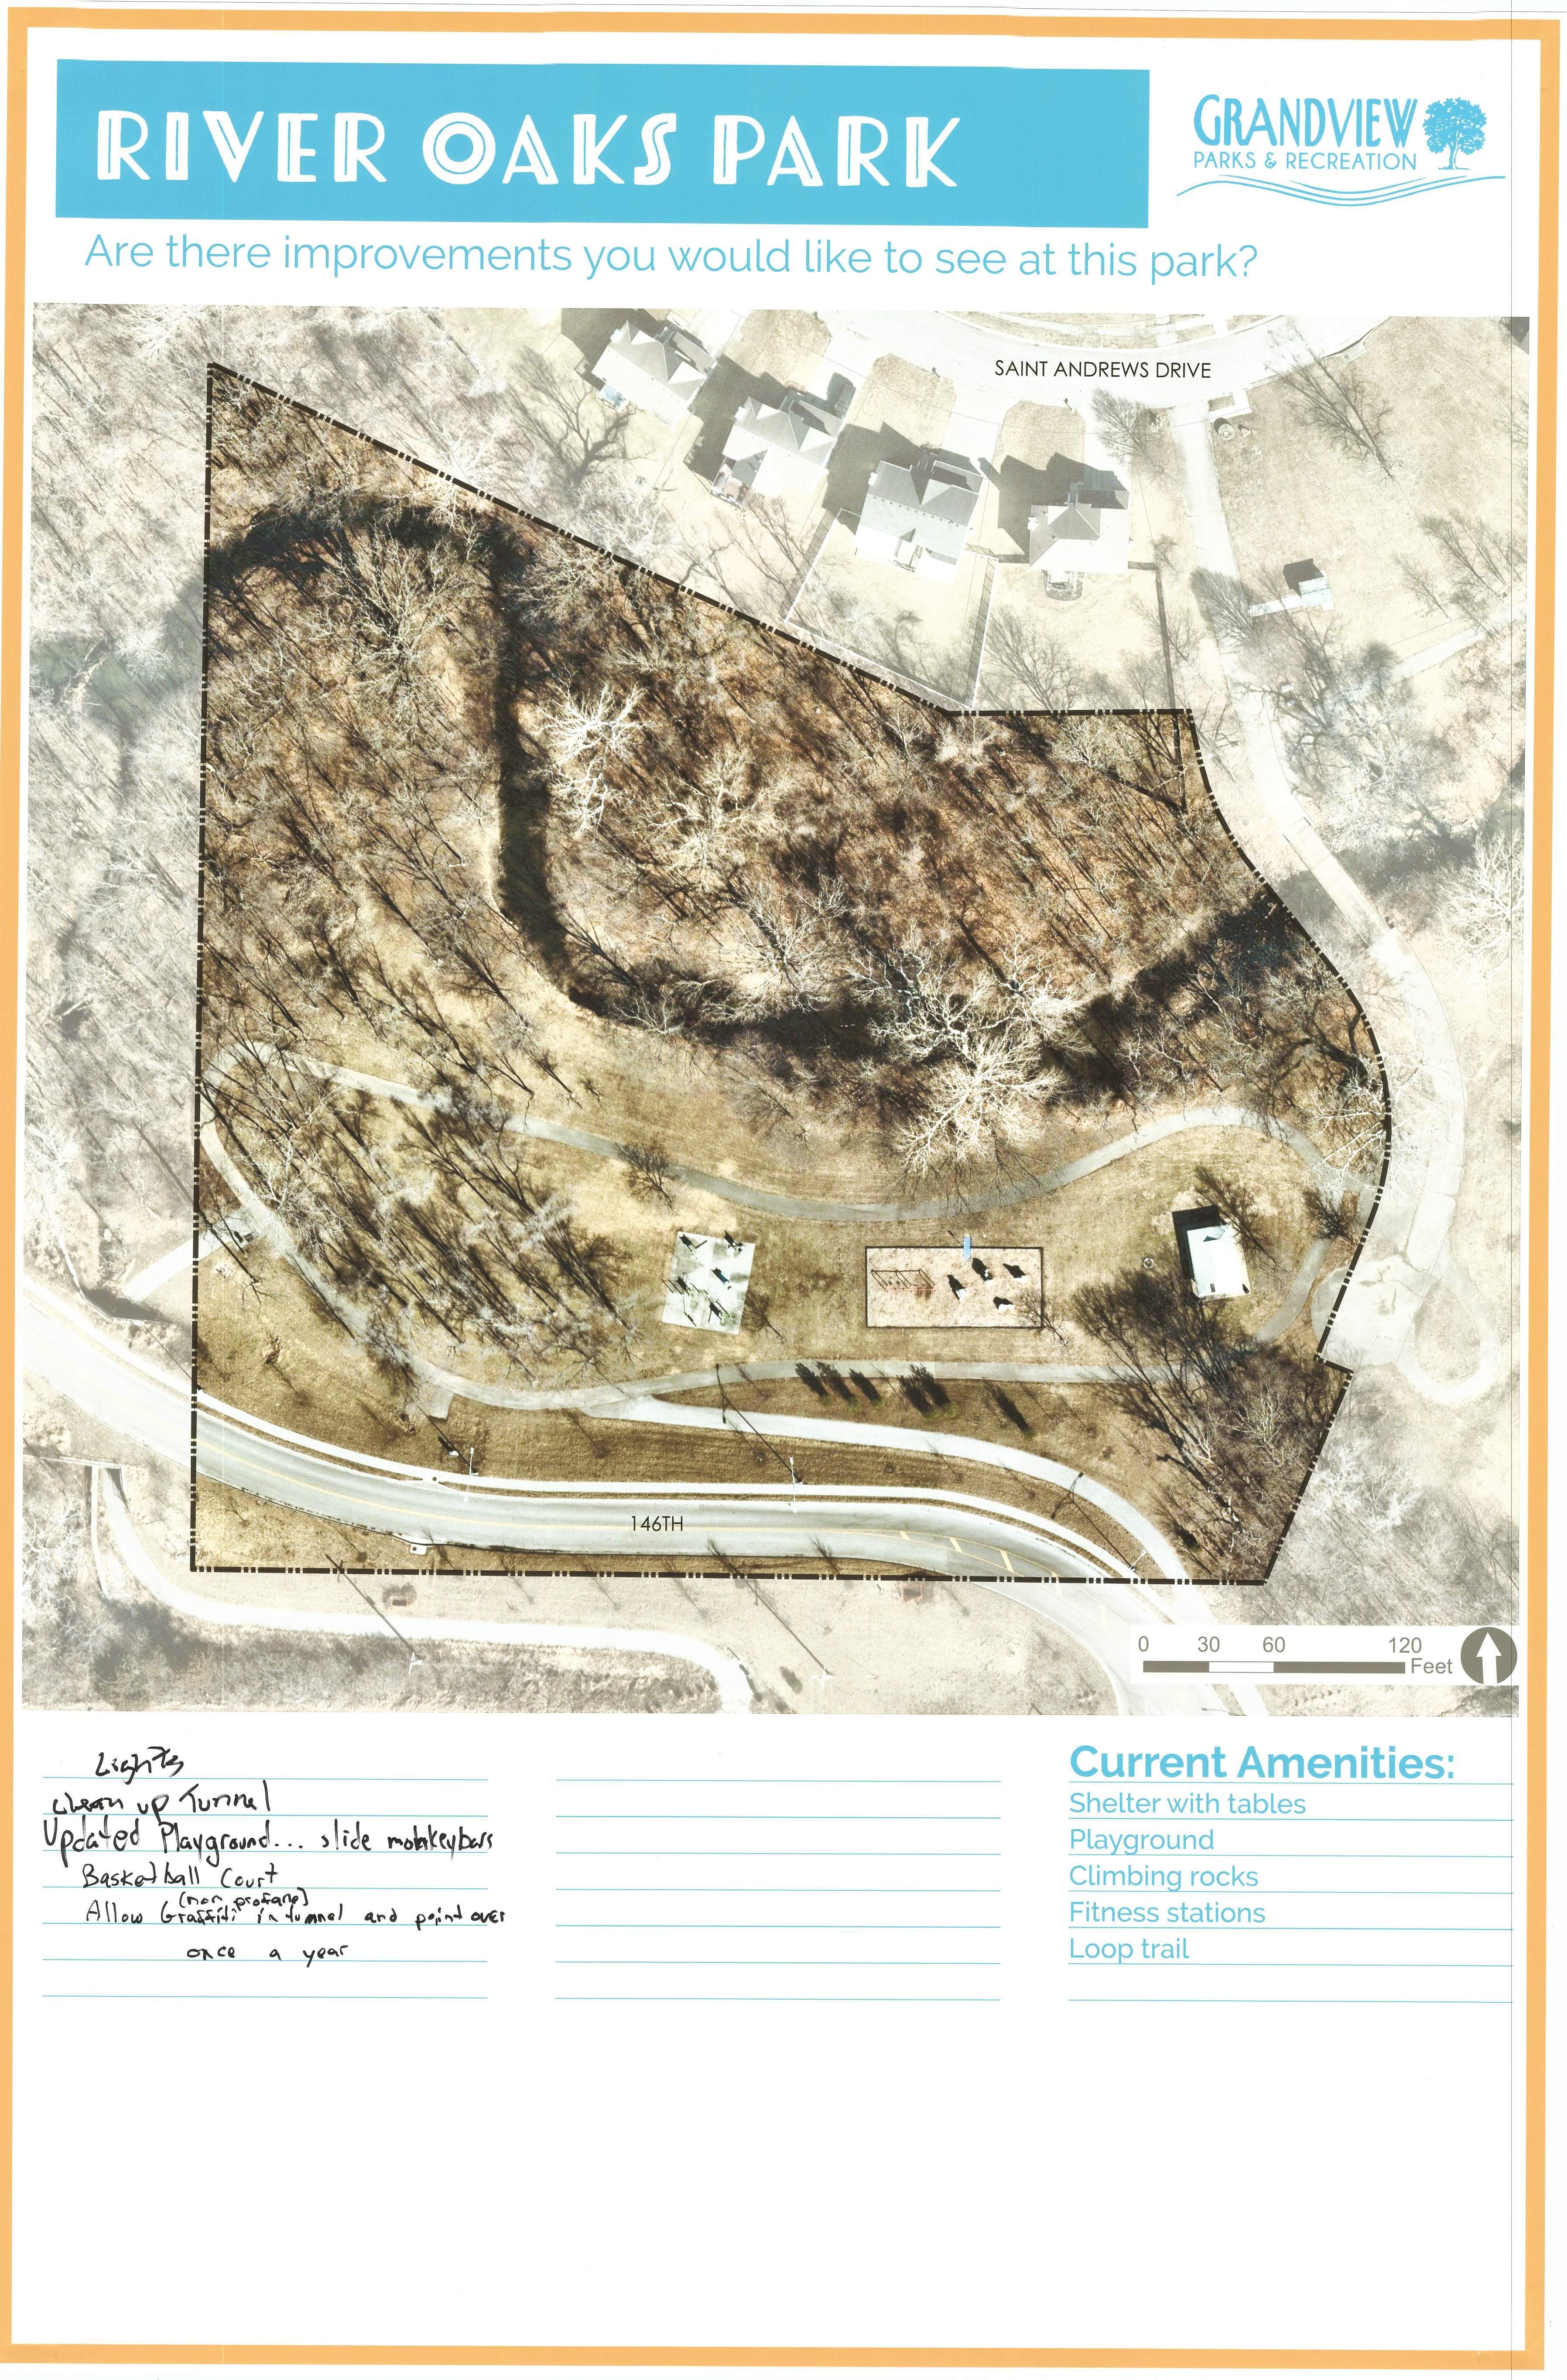
River Oaks Park
City Limits
City Owned Property
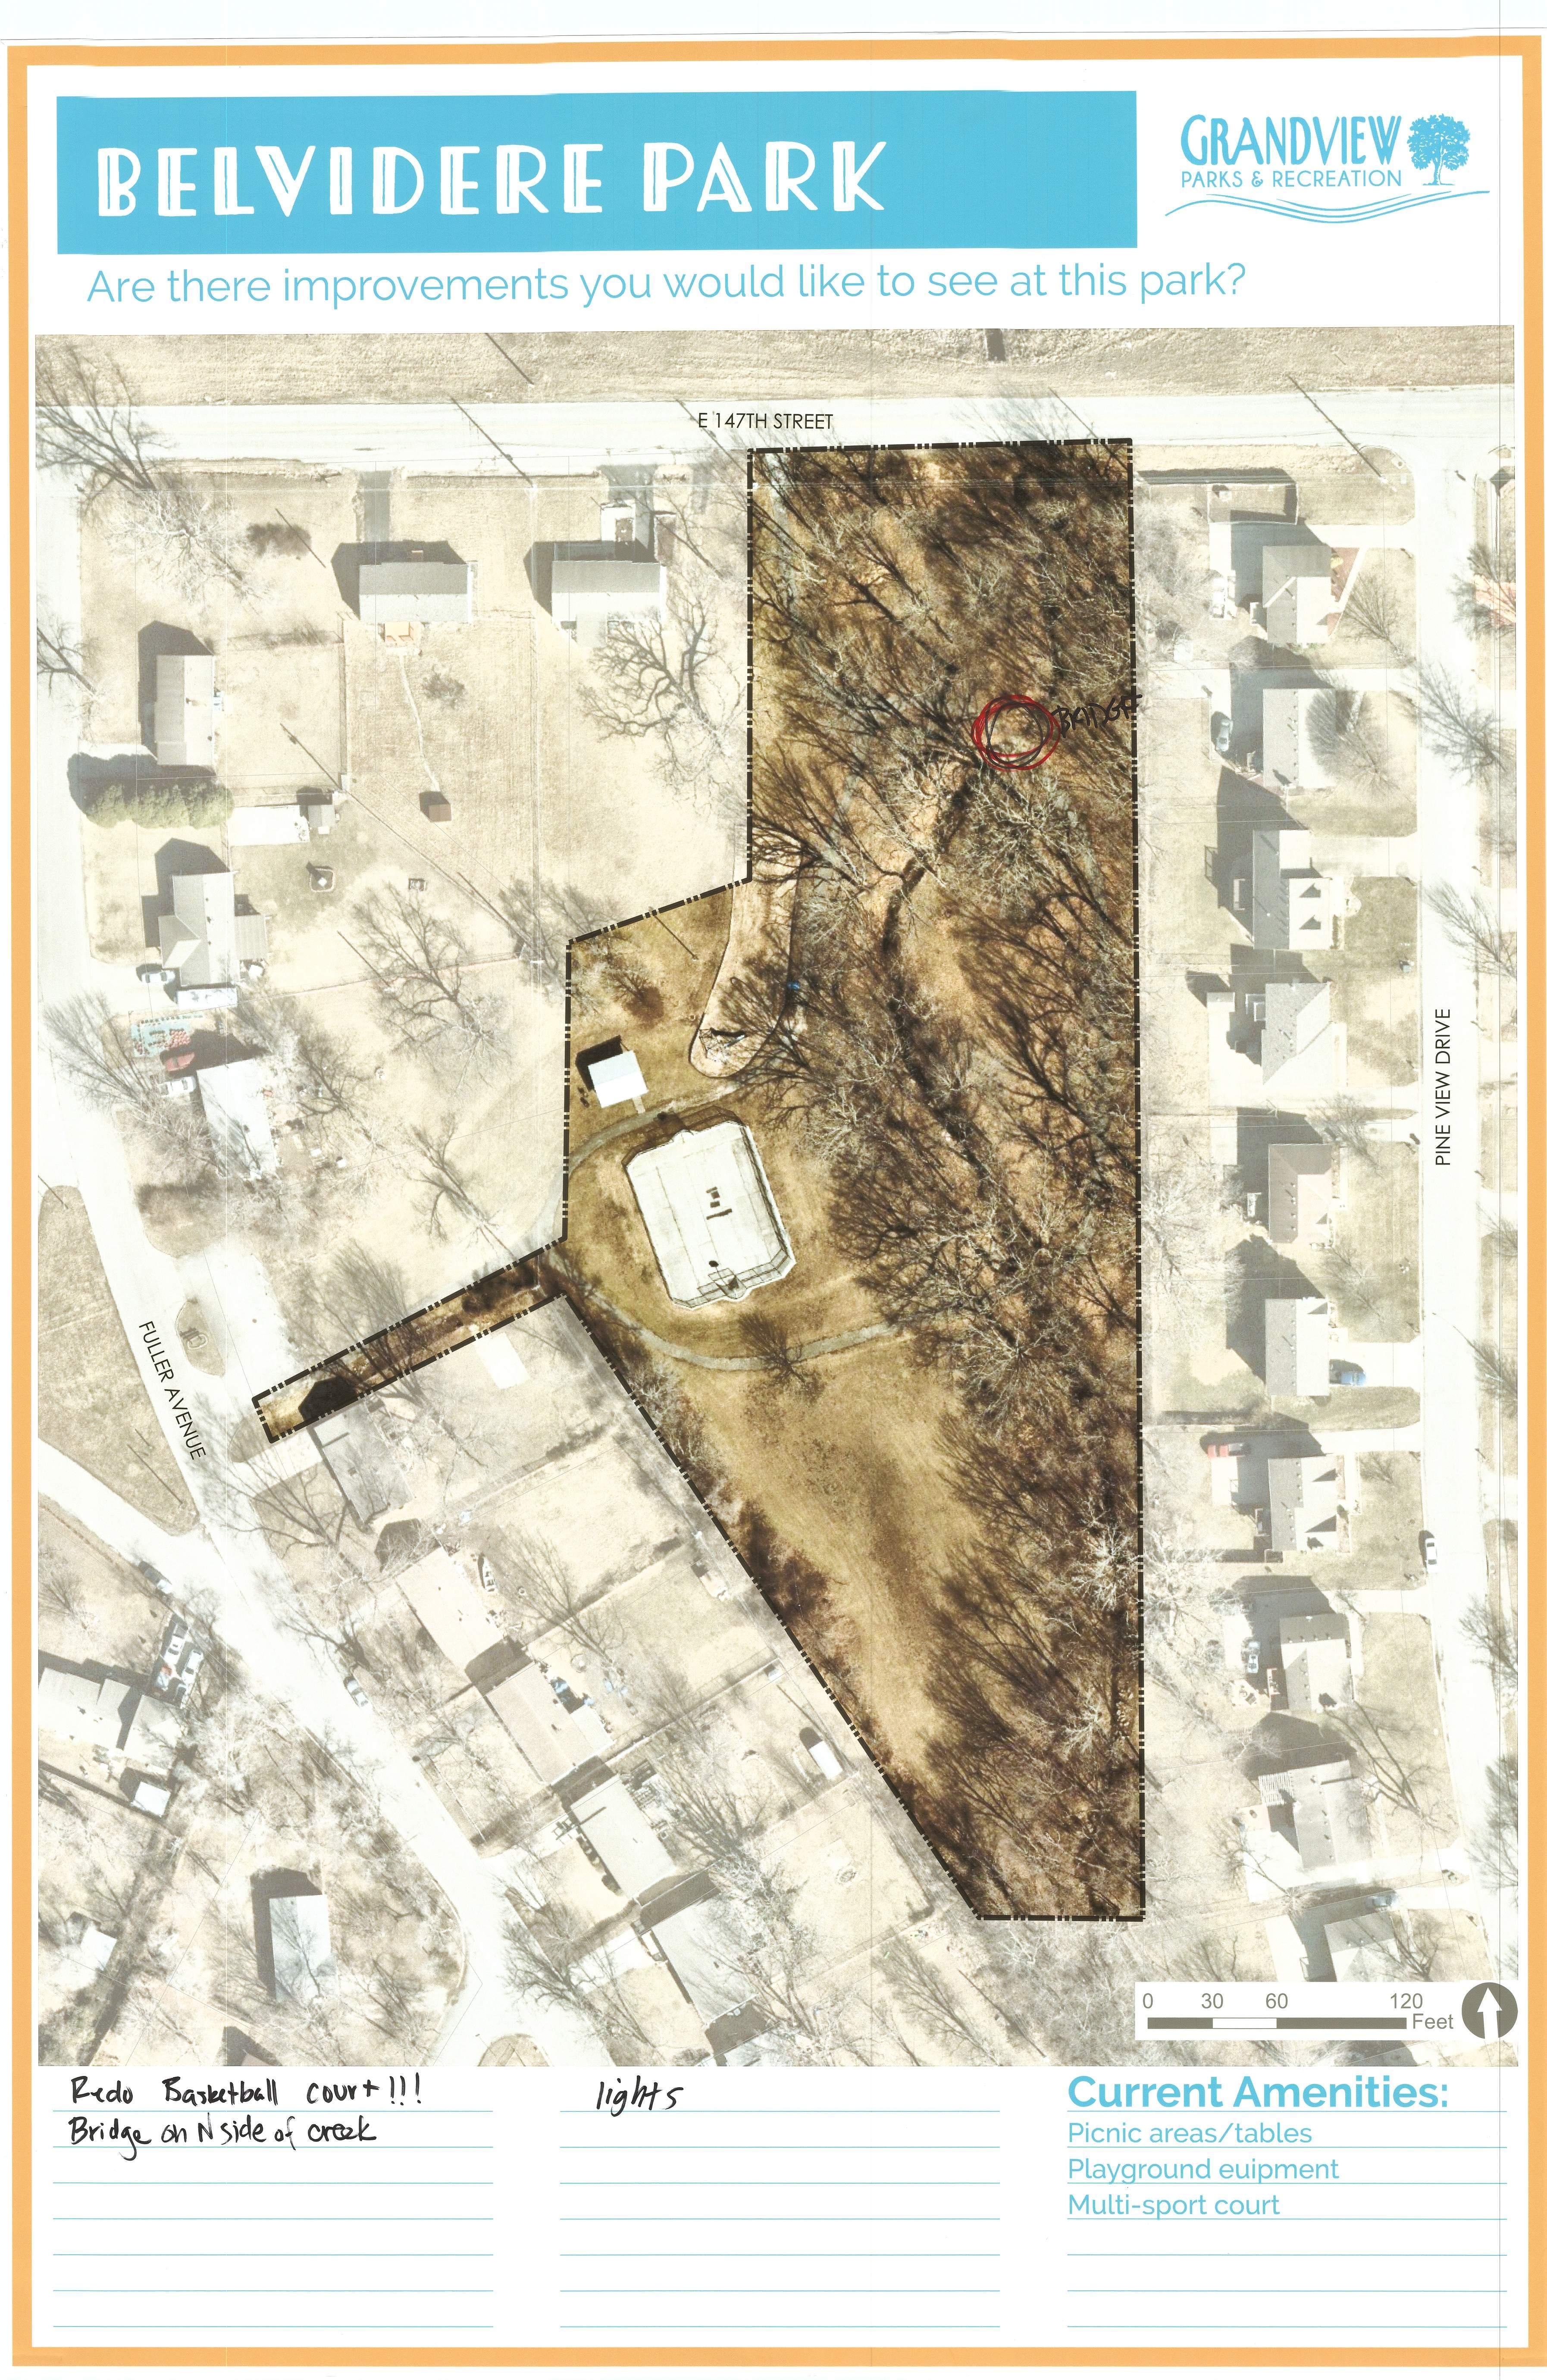
1. Belvidere Park
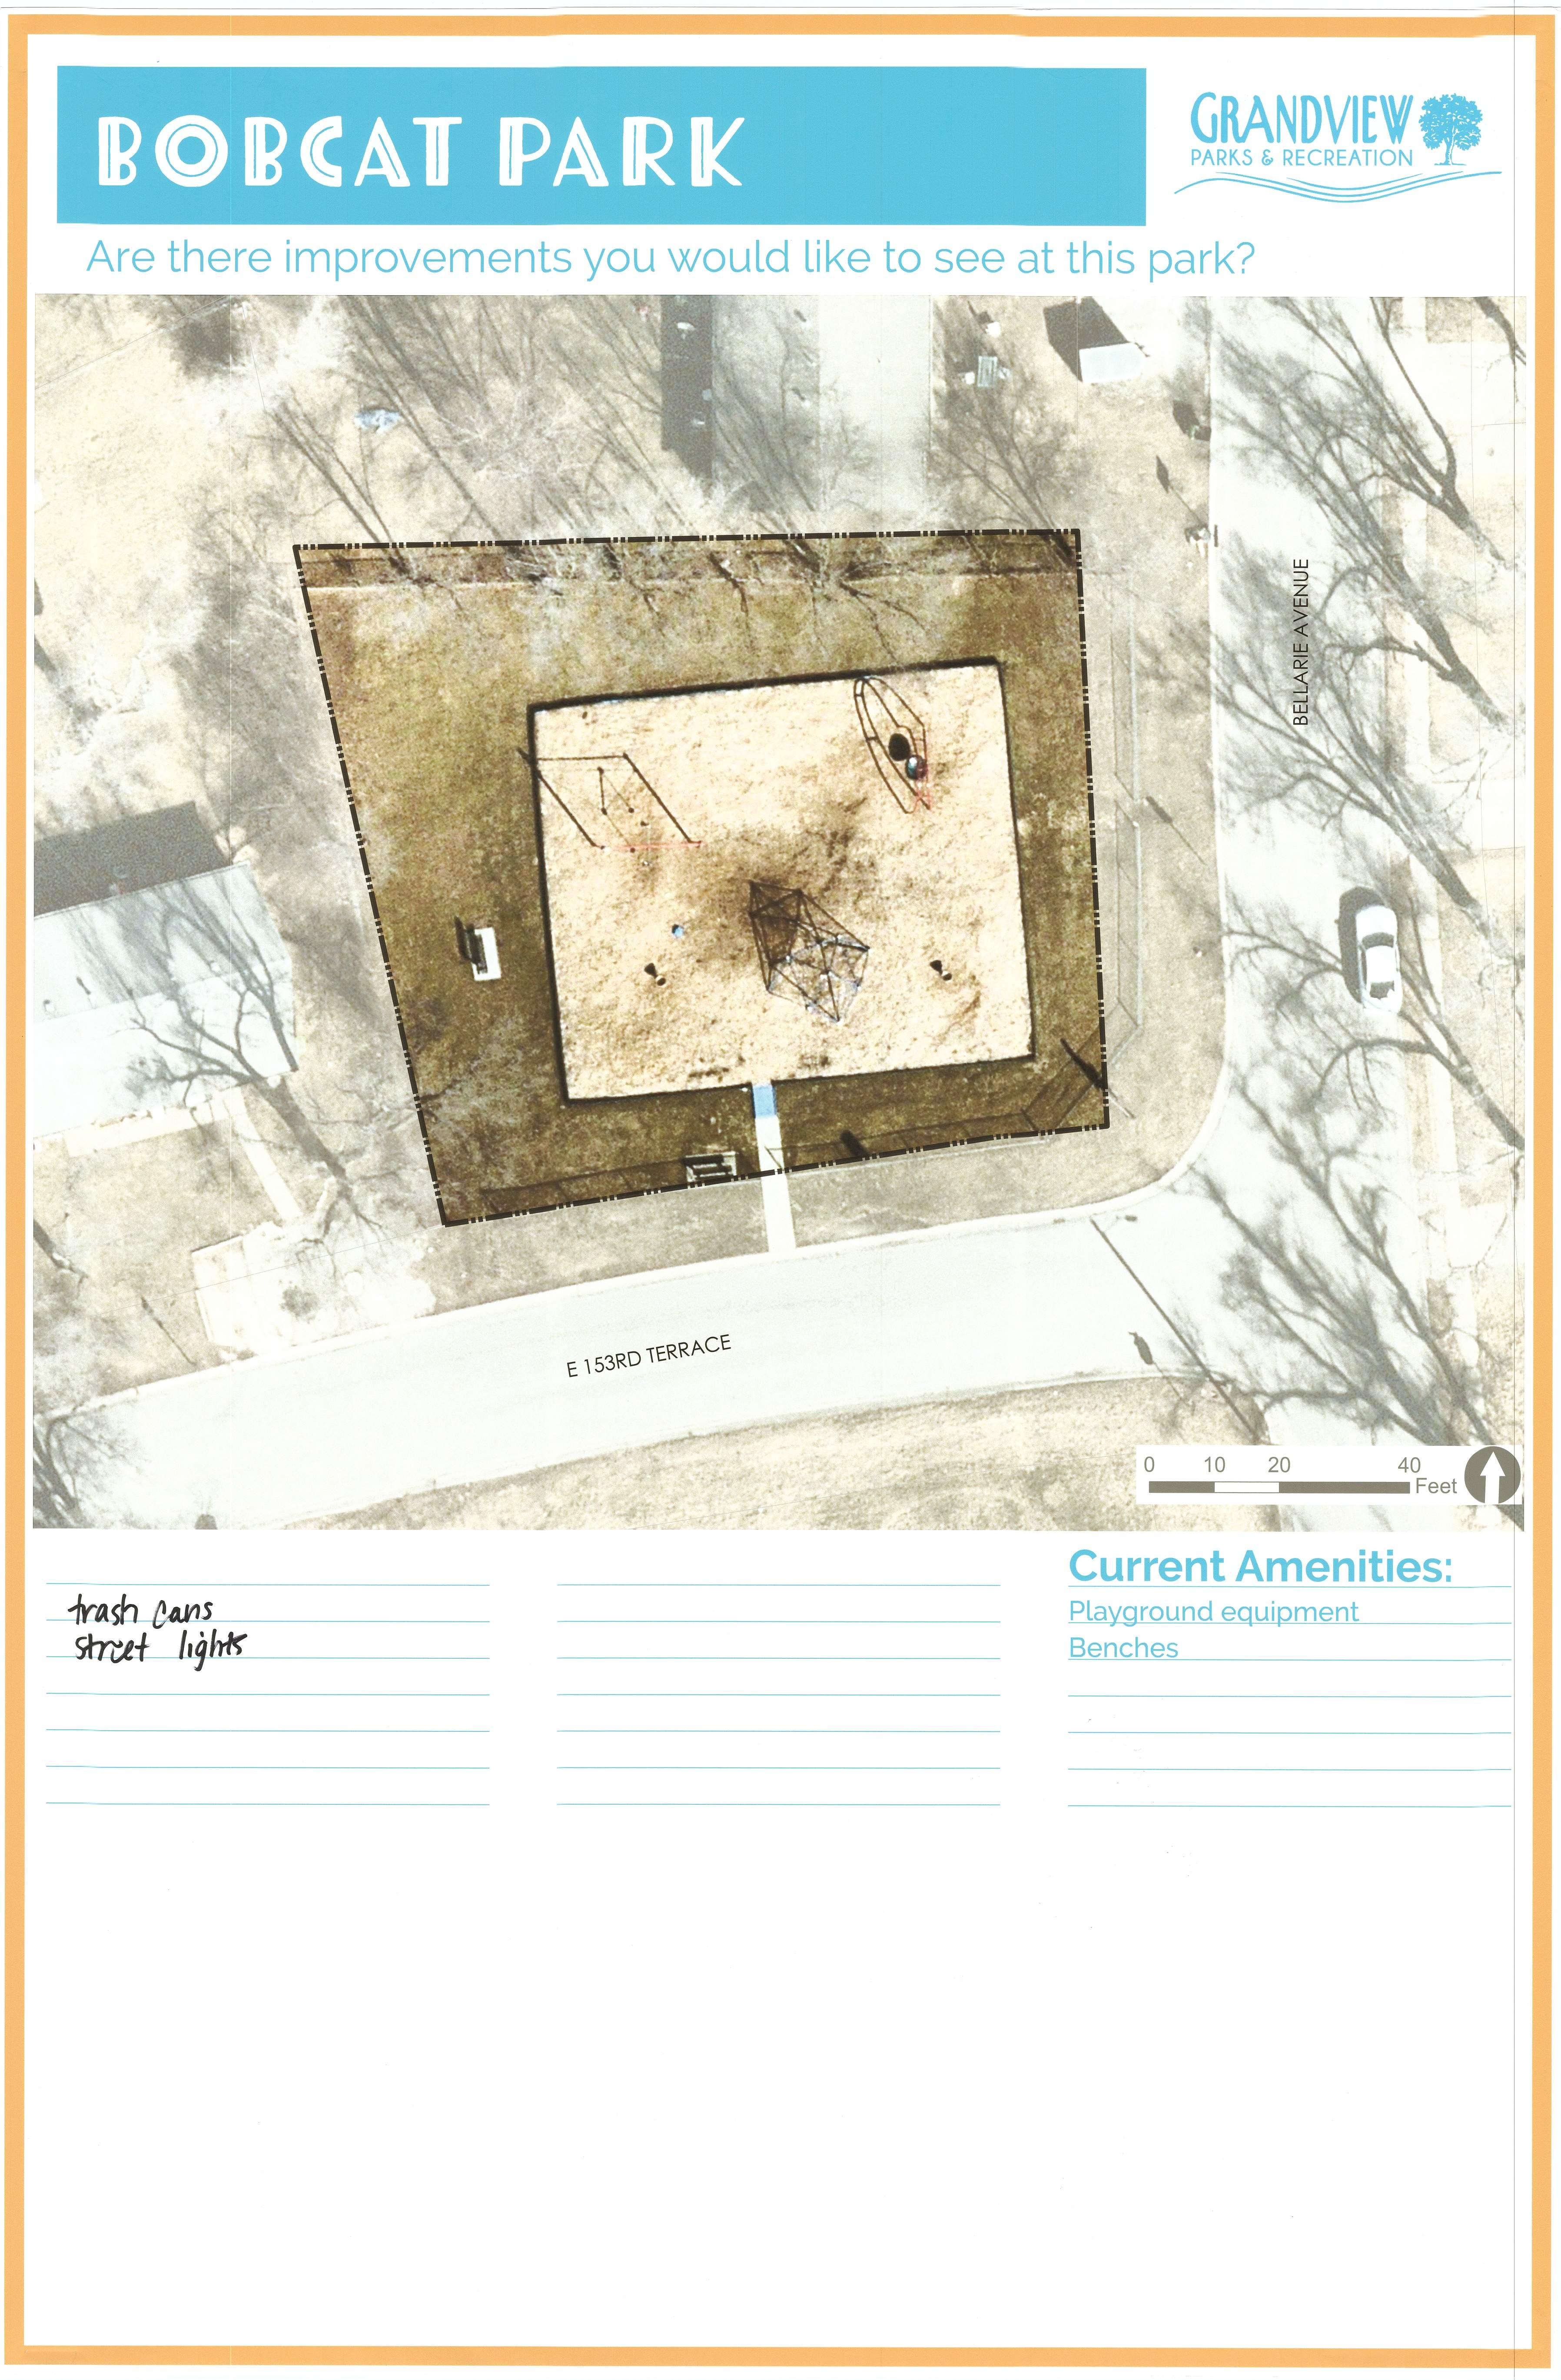
2. Bobcat Park
3. Freedom Park
4. John Anderson Park
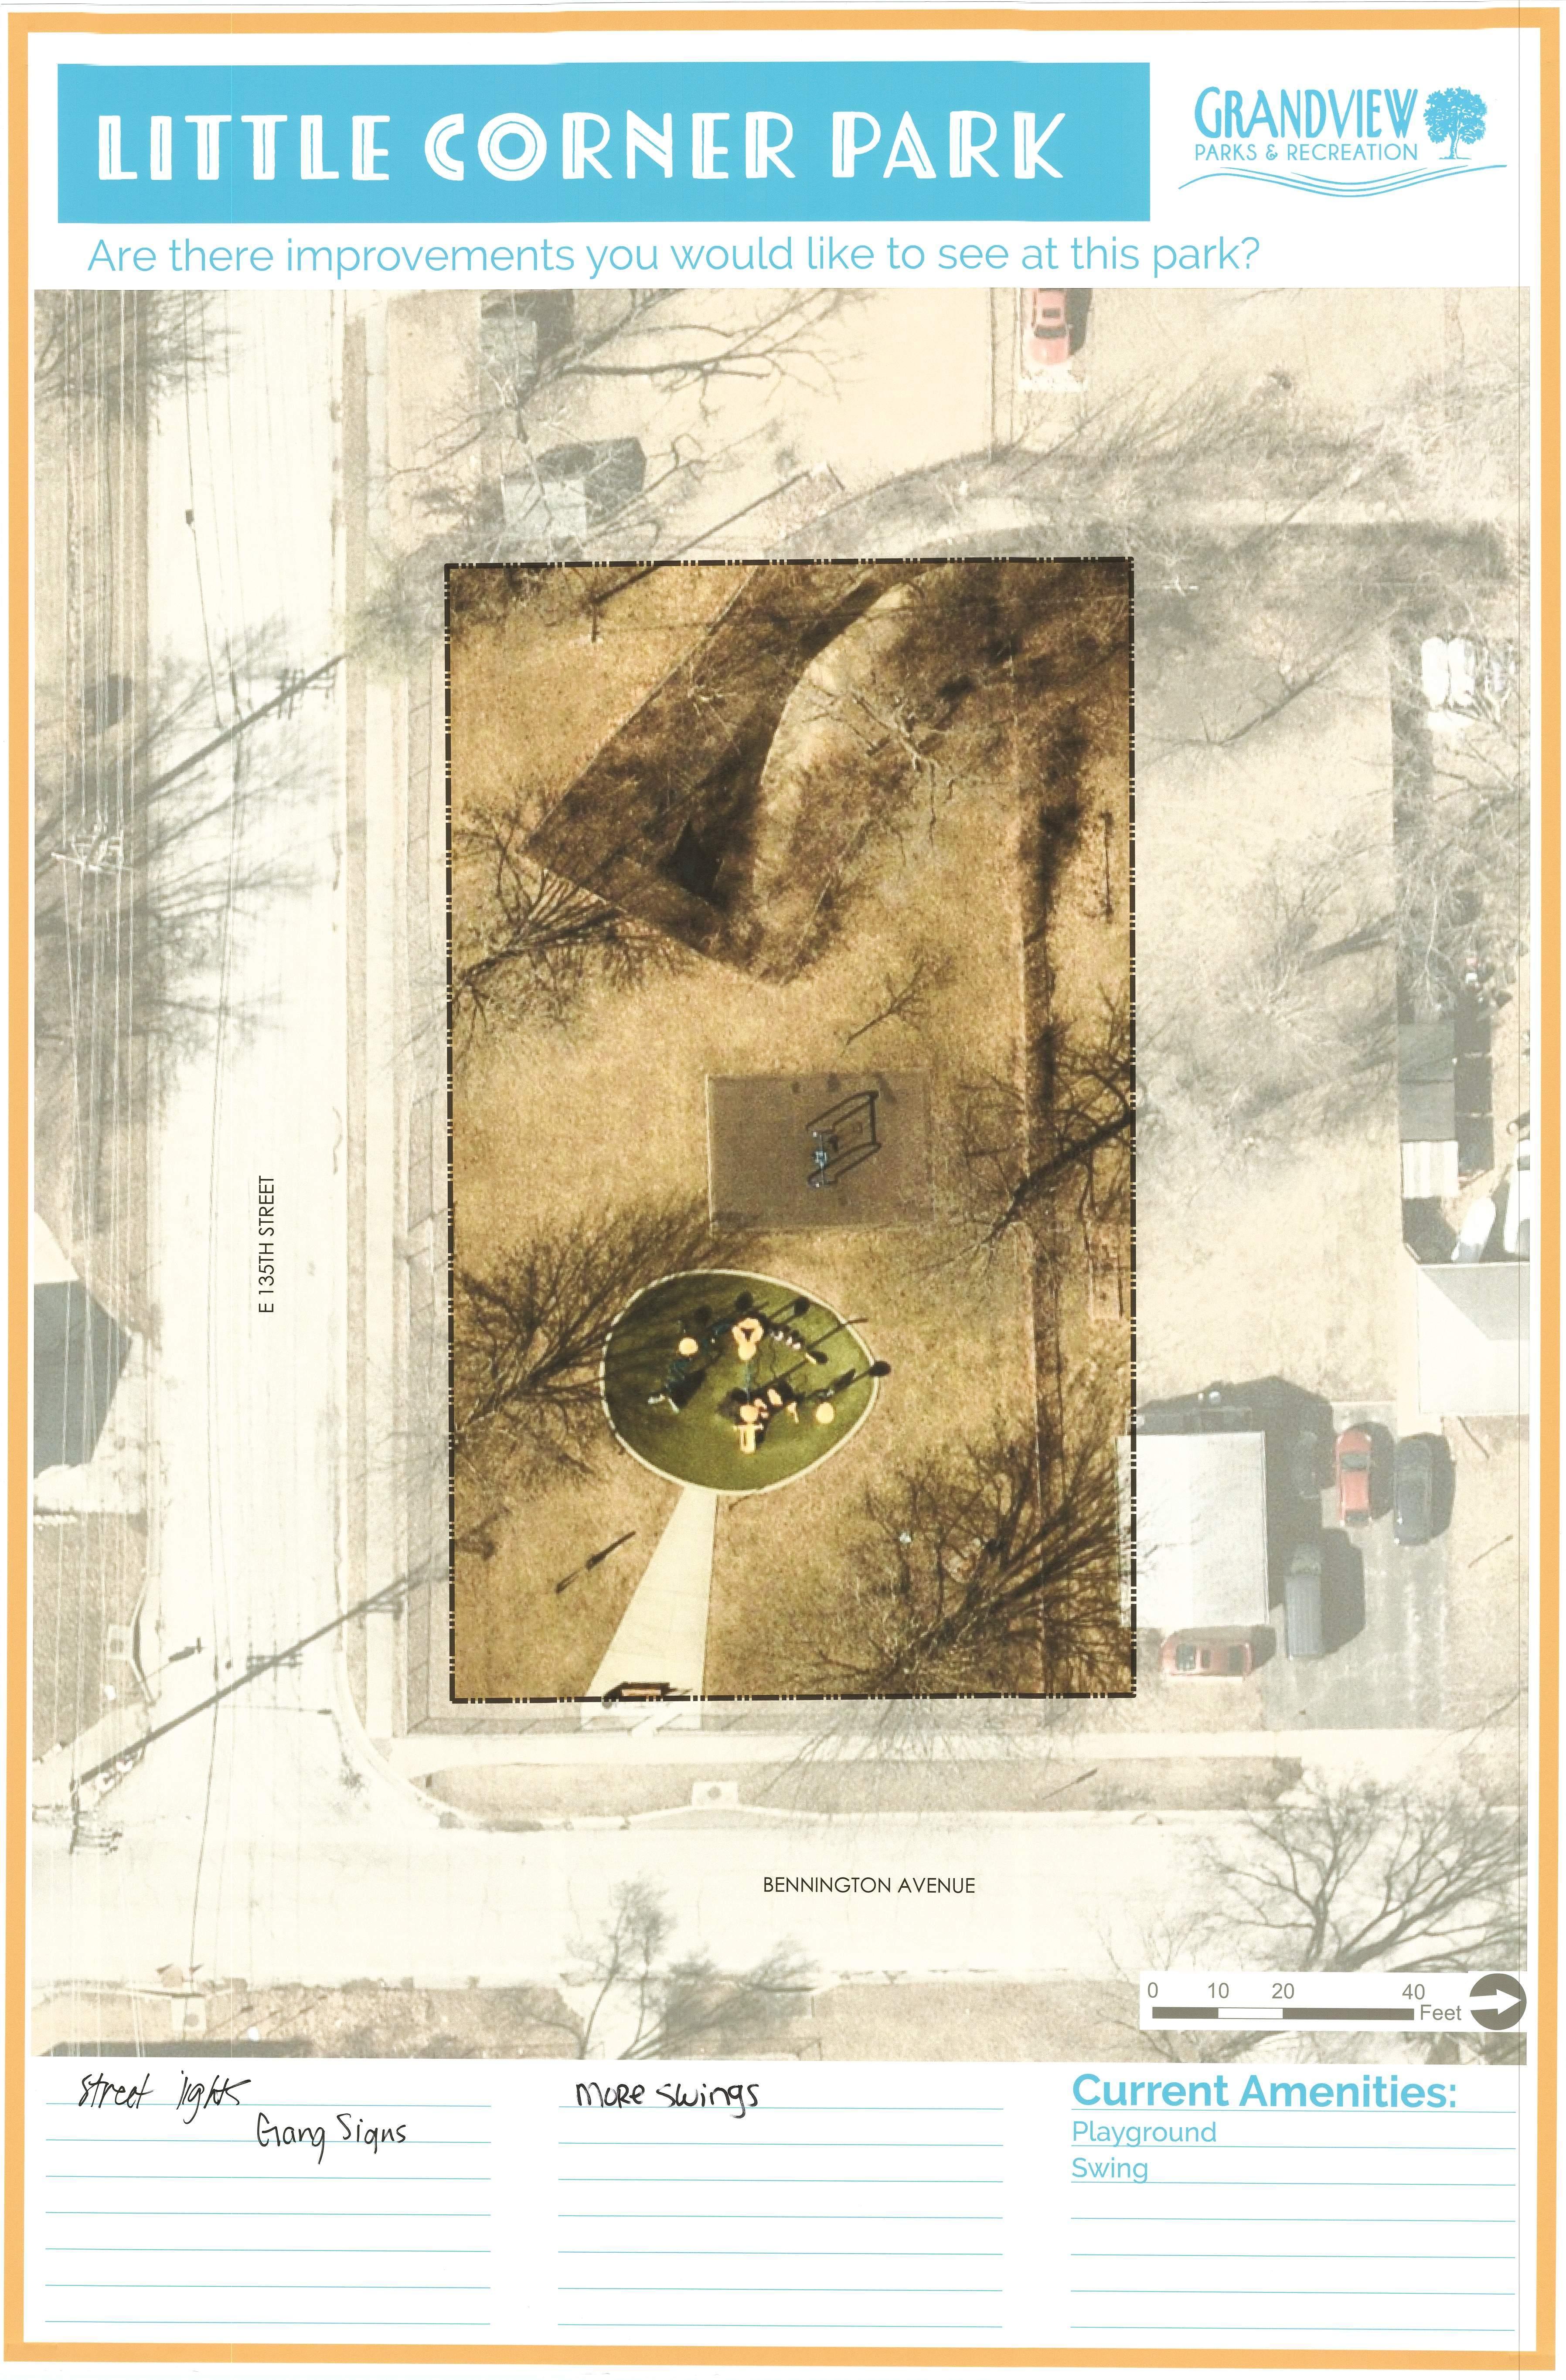
5. Little Corner Park
6. Mapleview Park
7. Meadowmere Park
8. River Oaks Park
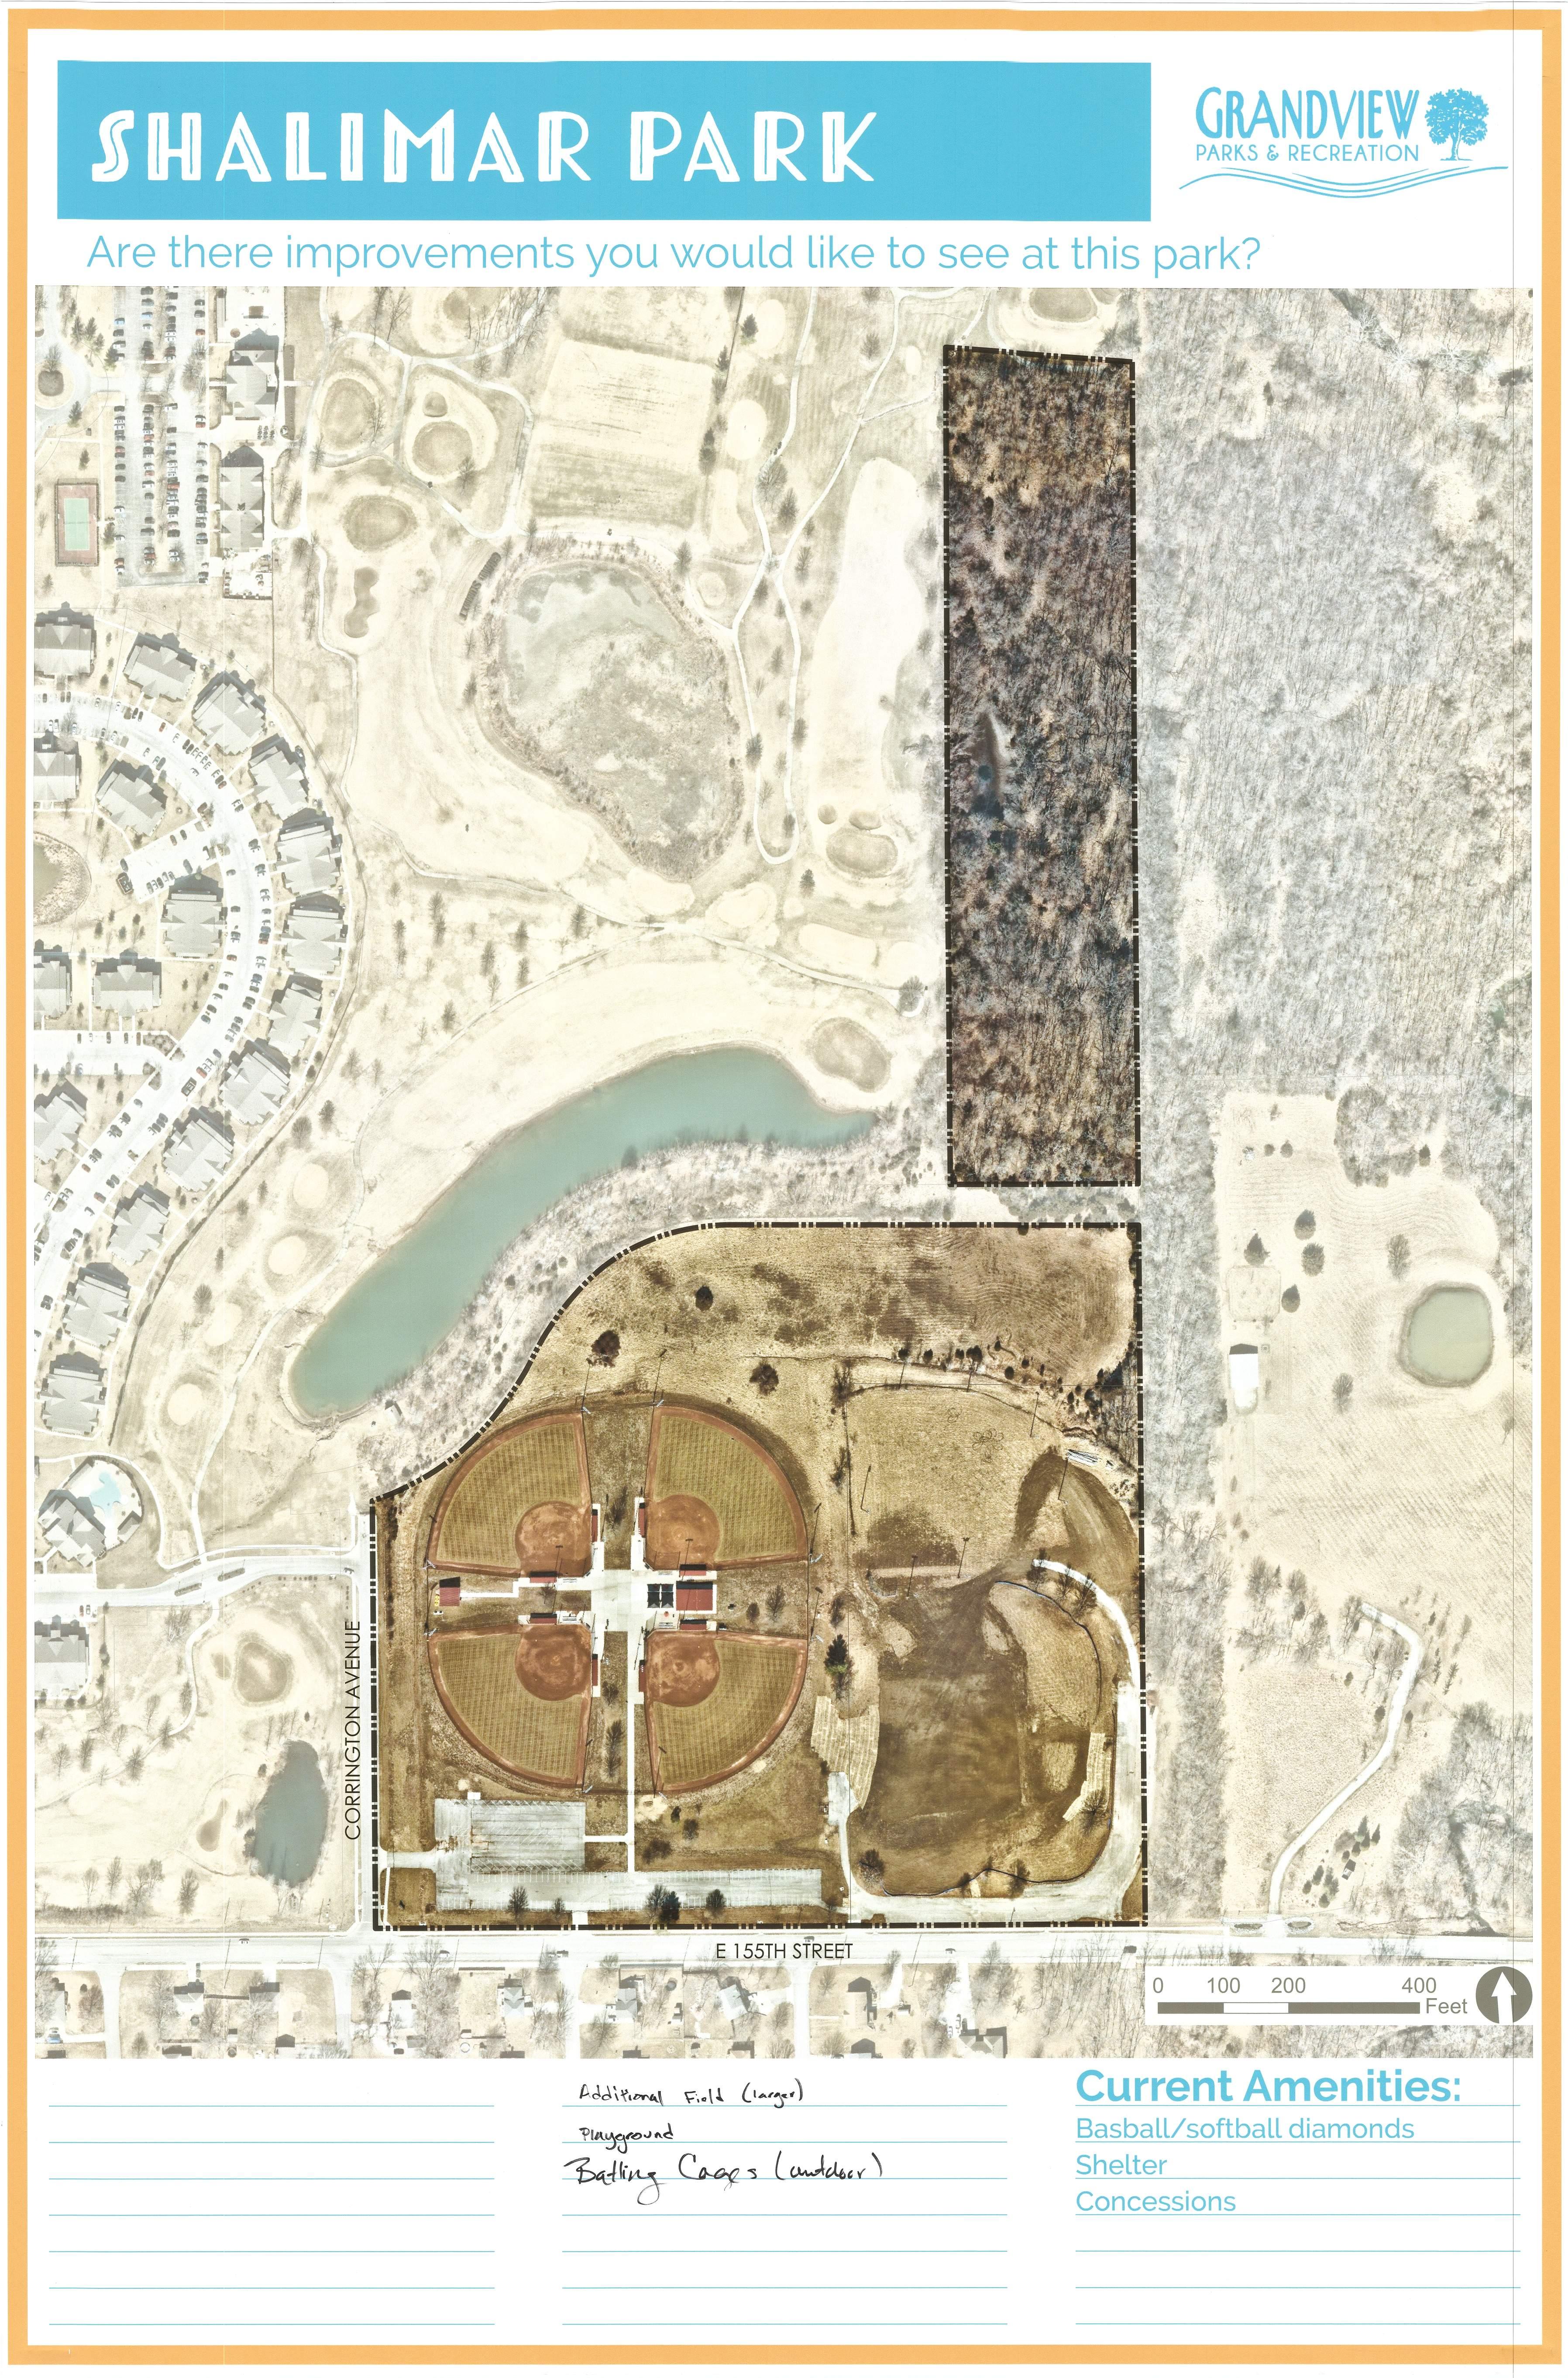
9. Shalimar Park
10. Shooting Range
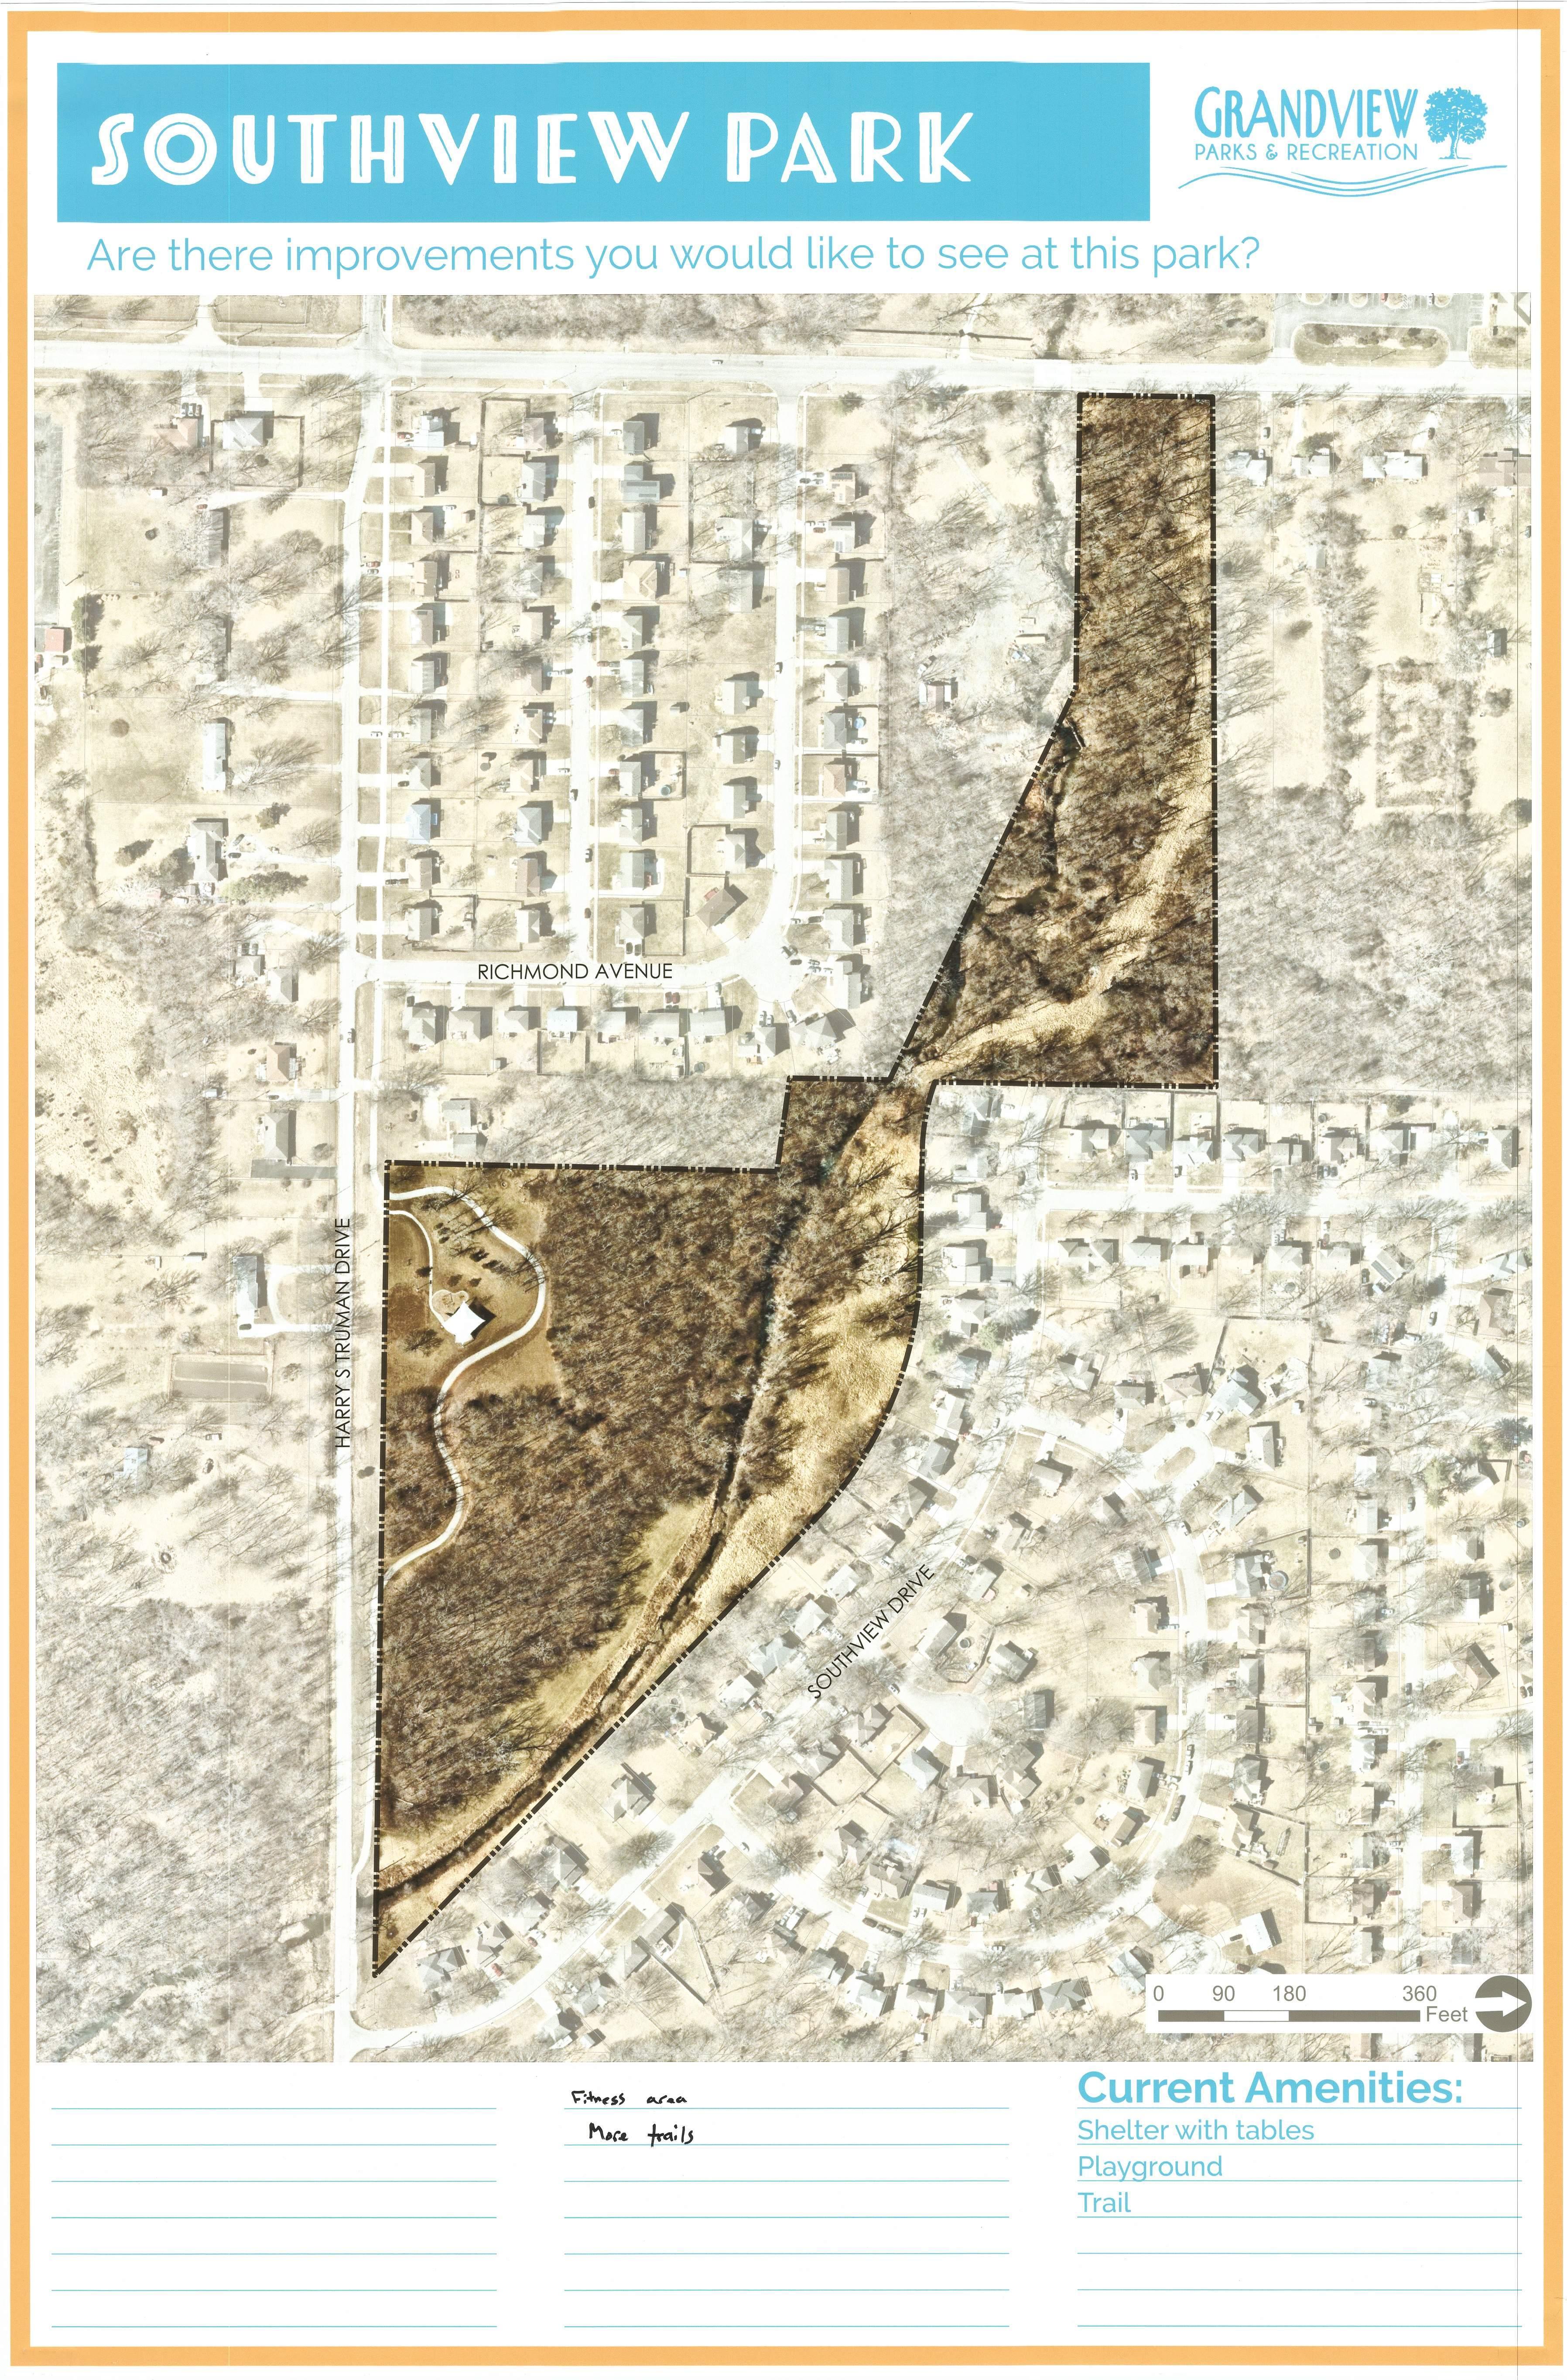
11. Southview Park
12. Tails & Trails Dog Park
13. Terrace Park
14. Valley Park
Interstate 49 Highway 150 8 9 10 11 12 13 Raytown Rd Main St Highgrove Rd Byars Rd Blue Ridge Blvd Harry S Truman Dr 0 0.5 1 0.25 Miles [ 14
Figure 10: Park Distribution Map
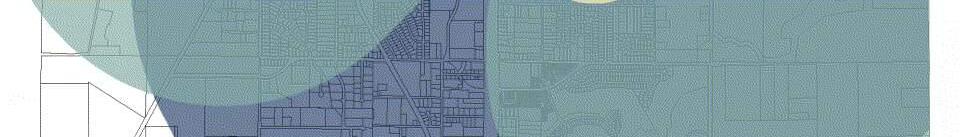
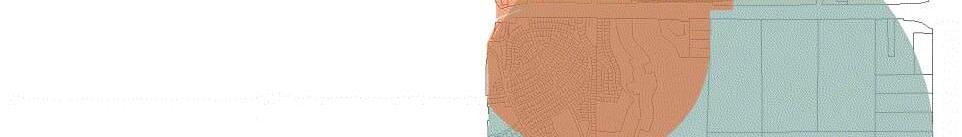
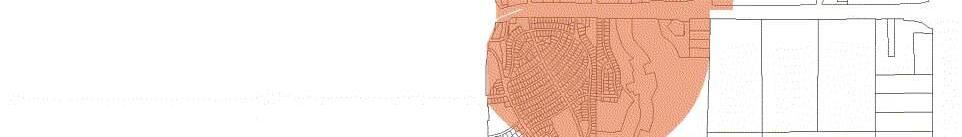
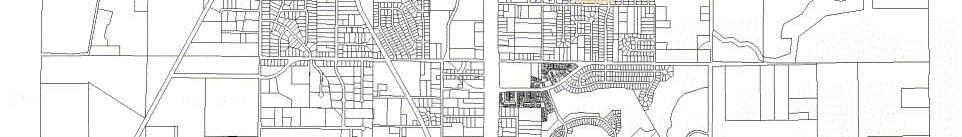
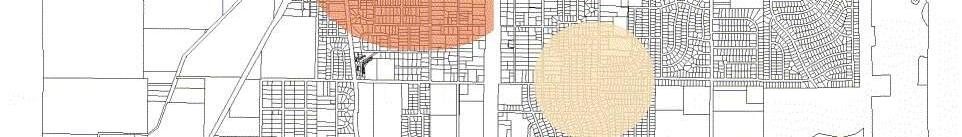
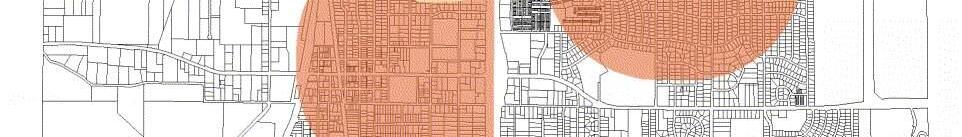
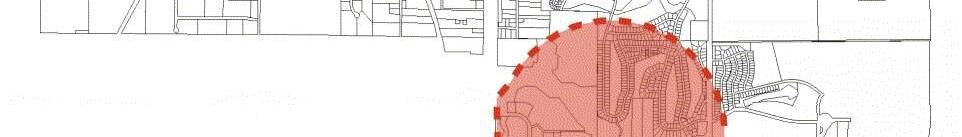
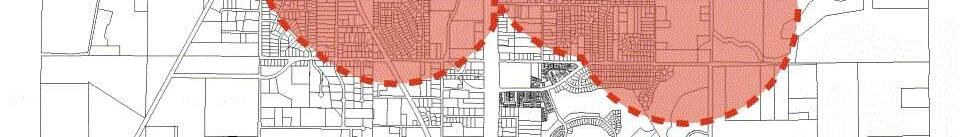
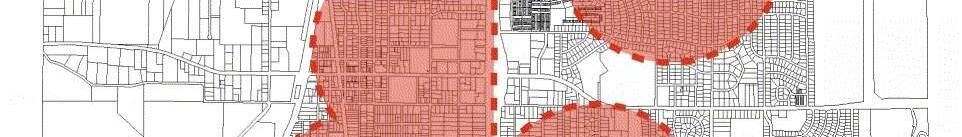
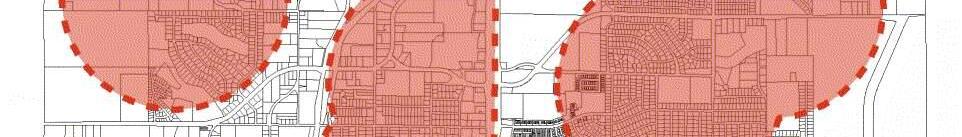
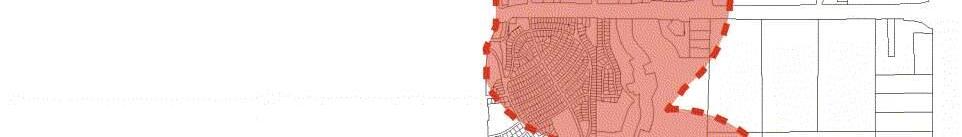
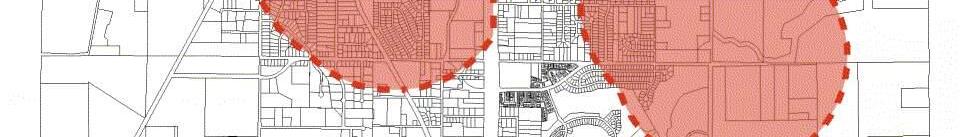
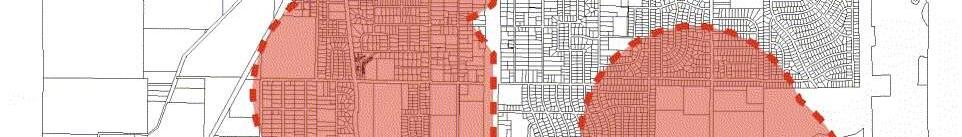
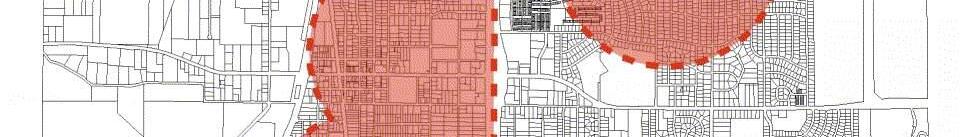
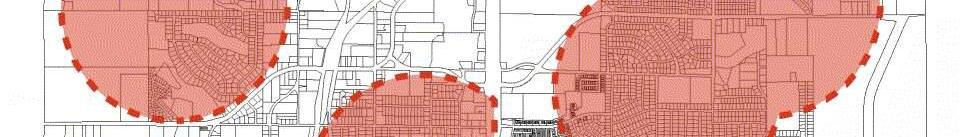
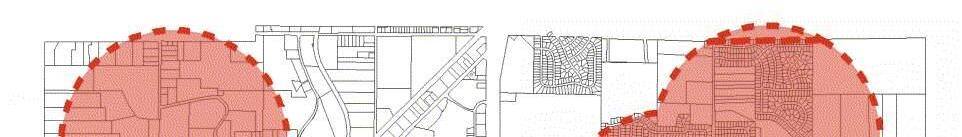
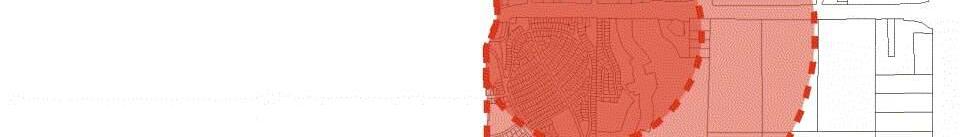
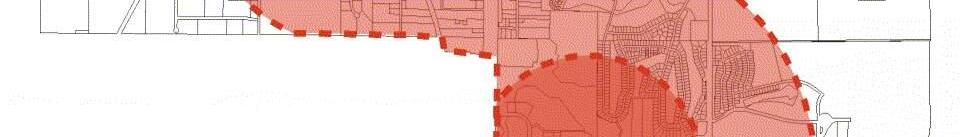
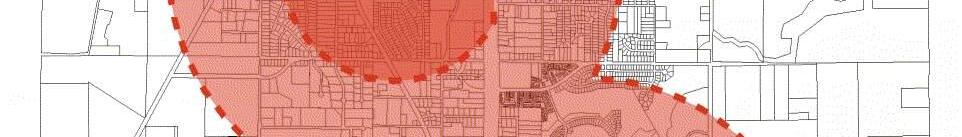
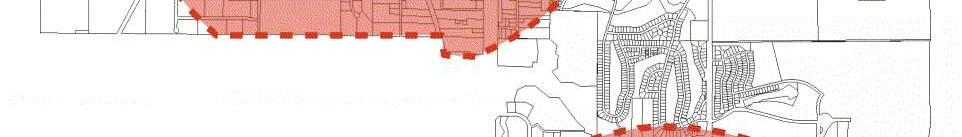
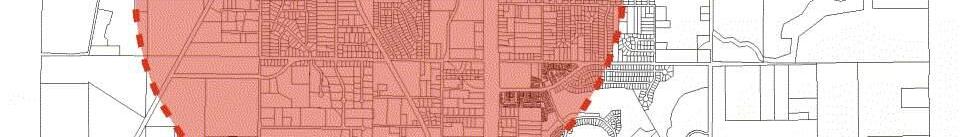
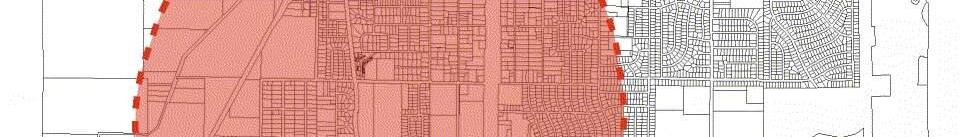
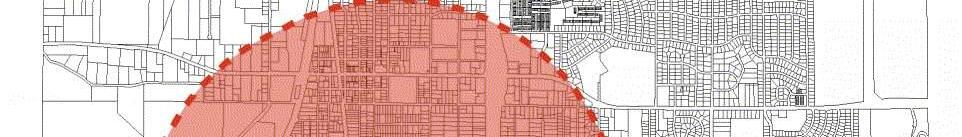
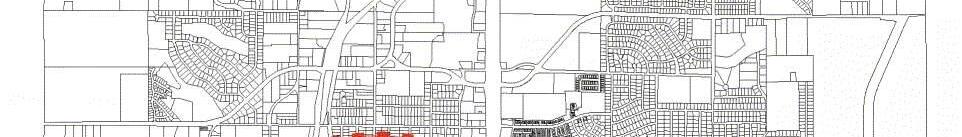
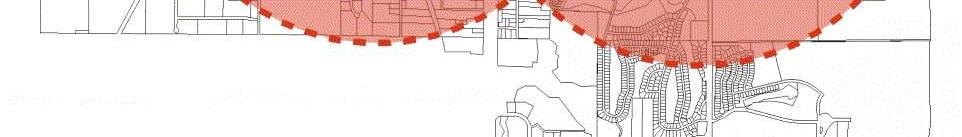
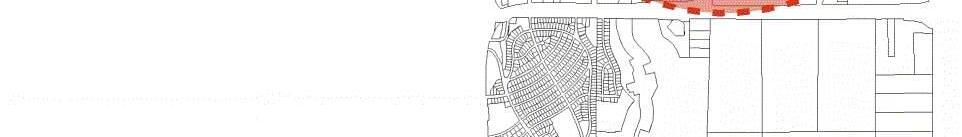
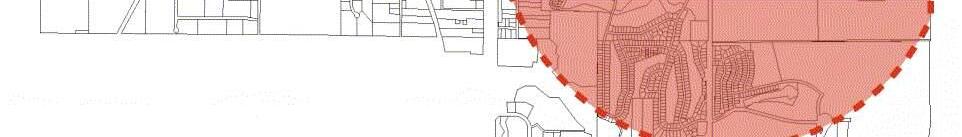
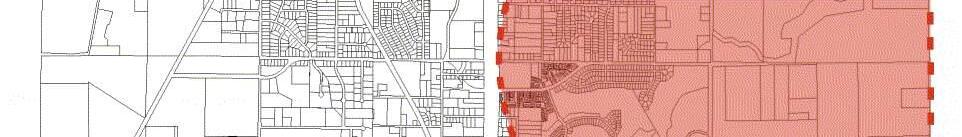
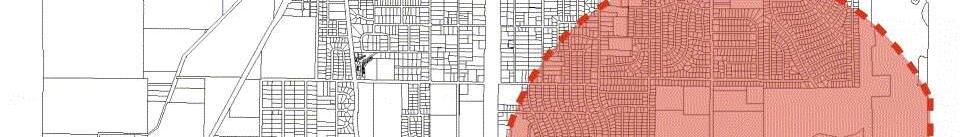
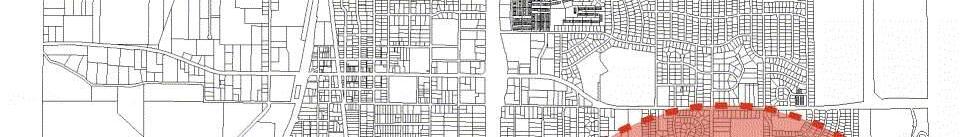
GAP ANALYSIS & FUTURE PARK LOCATIONS Service
A Gap analysis was conducted using GIS to identify areas of the community that may be under-served by parks and park amenities. Gaps in service areas become obvious when service radii shown are based on typical walking distances. The service radius of a park is dependent upon park type, level of quality, and pedestrian walkability in the case of neighborhood and mini parks.

0 0 5 1 0 25
Miles
Legend
Grandview City Limits
Mini Parks (1/4-mile)
Neighborhood Parks (1/2-mile)
Special Use Parks (1-Mile)
Community Parks (1-mile)
Potential Opportunities
Parks
City Owned Property
Areas
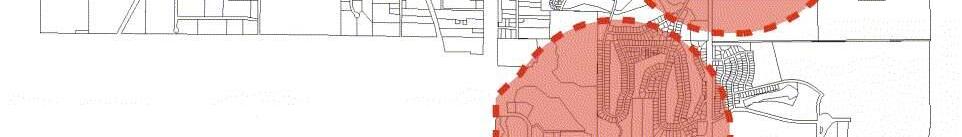
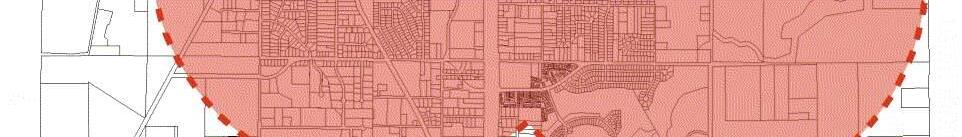
What can be seen from the overall analysis below is that the City as a whole is served fairly well by parks. The distribution of parkland serves the majority of the community in one type of park or another within a 10 minute walk of most residences. Dashed circles indicate potential opportunities for future parkland within each of the City's three administrative Wards.
29 High Level Maintenance
[
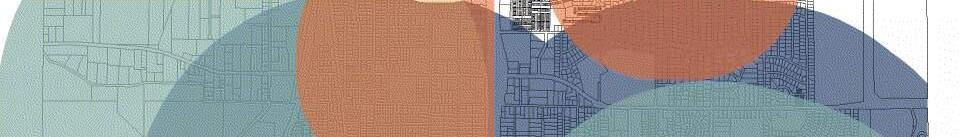
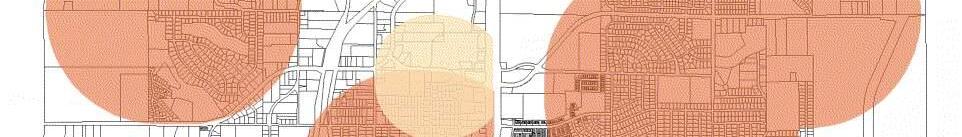
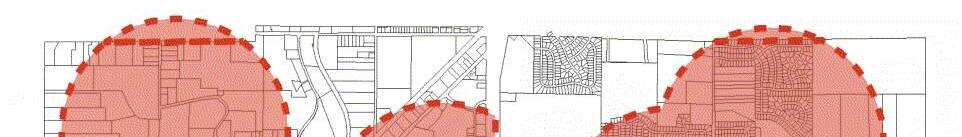
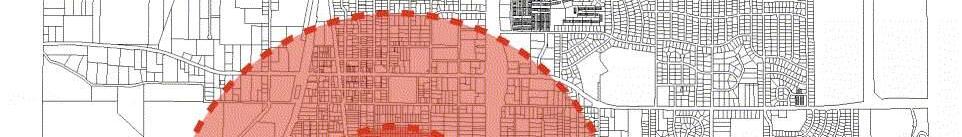
Mini & Neighborhood Parks

0 0 5 1 0 25 Miles
30 High Level Maintenance
[
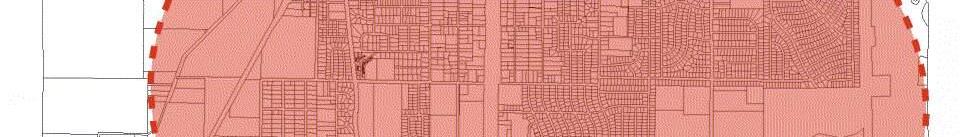
This map illustrates the service area for mini and neighborhood parks within a 5 to 10 minute walking distance. Barriers to pedestrian travel such as a lack of sidewalks, street crossings, and creeks limit the service of some parks. Access to these parks could be improved with connections between parks and their surrounding neighborhoods.
1. Bobcat Park
2. Little Corner Park
2 3 4
3. Terrace Park
4. Belvidere Park
5. Freedom Park
6. Mapleview Park
7. River Oaks Park
8. Southview Park
5
9. Valley Park
Mini Parks (1/4-mile)
Neighborhood Parks (1/2-mile)
Grandview City Limits
0 0 5 1 0 25 Miles [ 6 7
City Owned Property
8 9
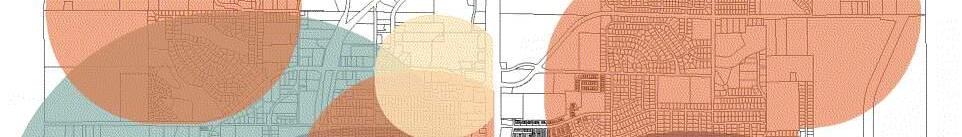
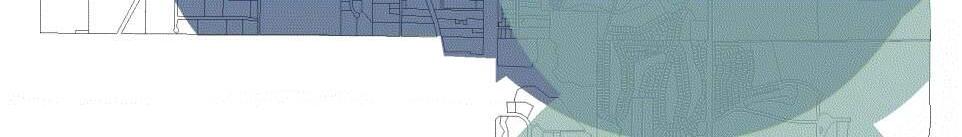
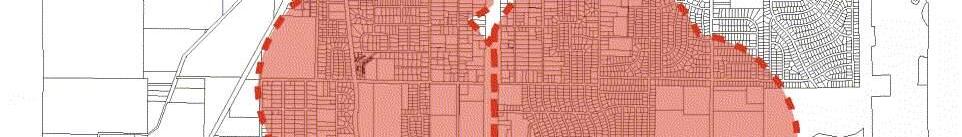
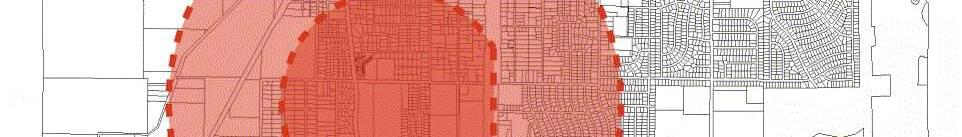
Community & Special Use Parks
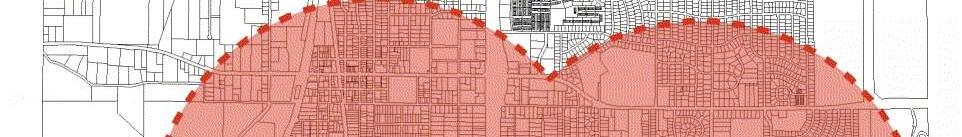
This map illustrates the service area for community and special-use parks, which have a 1-mile service radius. Overall, the City is served fairly well by community parks and no new community parks are recommended.
0 0 5 1 0 25 Miles
Grandview City Limits
City Owned Property

Special Use Parks (1-Mile)
Community Parks (1-mile)


31 High Level Maintenance
[ 0 0 5 1 0 25
[
Miles
4. John Anderson Park
1 3
5. Meadowmere Park
1. Shalimar Park
2. Shooting Range.
4 5 2
3. Tails & Trails Dog Park
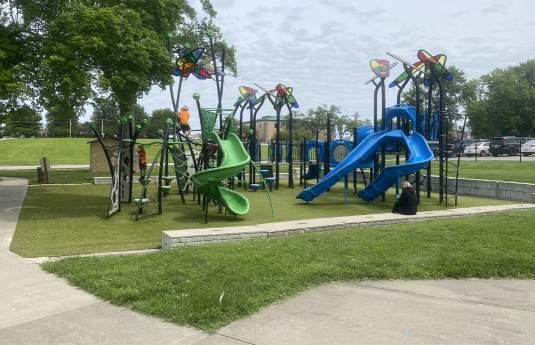
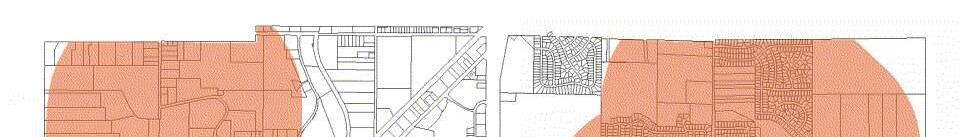
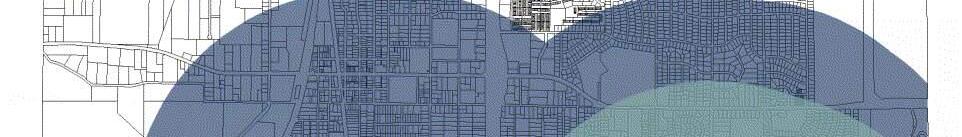
Playgrounds
One of the most desired features in a park is a playground, especially for neighborhood parks. The map below shows the current service area within a 10-minute walk (1/2-mile) of all playgrounds in Grandview. Almost every park has a playground, only excluding Shalimar Park.
0 0.5 1 0.25 Miles
Legend
Grandview City Limits
Parks
Playgrounds
10 Minute Walking Distance

32 High Level Maintenance ! ! ! ! !( ( ! ! ! ! ( ! ! ! !
[
Miles
Picnic Shelters
Picnic shelters are another key feature for parks. They provide a park amenity that is multi-generational and serves cultural needs such as birthday parties, family gatherings, classrooms, and events. The map below shows the distribution of picnic shelters and the service area within a 10-minute walk. Overall the community is pretty well by picnic shelters. All three of the mini parks are missing picnic shelters.
Legend
Crestwood City Limits

Parks
Picnic Shelters
10 Minute Walking Distance
33 High Level Maintenance ! ( ! ! ( ! !( ( ! !( ( ! ! (! ( ! ! ! ! ( 0 0 5 1 0 25
[
Sport Courts
Sport Courts such as basketball, tennis, pickleball, and sand volleyball are few and far between throughout the Grandview Parks system. There is a multi-sport court in Belvidere Park that has basketball, footsal and roller hockey and a couple tennis courts in John Anderson. Potential opportunities to expand the service area may come with additions to Meadowmere, Mapleview, and possibly River Oaks Park.
0 0.5 1 0.25 Miles
Legend Grandview City Limits

Multi-Sport Court Tennis Court
10 Minute Walking Distance
1-Mile Radius

34 High Level Maintenance ! ! ( "
[
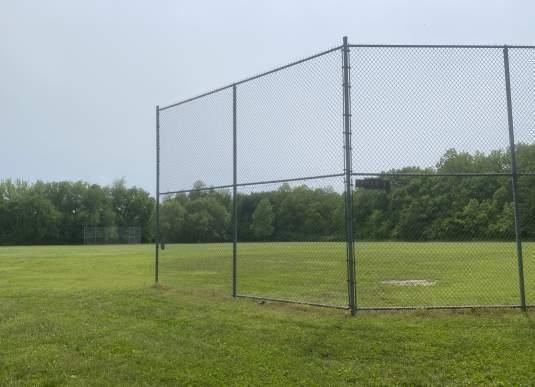
Athletic Fields
Athletic fields such as baseball, softball, and soccer, are primarily found in John Anderson Park. The fields in John Anderson only have backstops and grass infields and are perfect for practice fields. Shalimar Park has 4 skinned infields, with dugouts, stands, concessions, shade structures, and lighting, making them perfect for competition and league games.
35 High Level Maintenance ! ( ! !( ( ! (! ( ! ! ! (! !( (! ( " " 0 0 5 1 0 25 Miles [
Grandview City Limits
Baseball/Softball Fields Soccer Fields
Legend
1-Mile Radius
Splash Pads
There are two splash pads in Grandview, one in Meadowmere Park and another in John Anderson Park as well as an indoor pool in the Community Center. Mapleview Park could be considered to expand the service area of aquatic facilities. John Anderson's splash pad may also need updates or replacement in the next 5 years.
0 0.5 1 0.25 Miles
Legend
Grandview City Limits

Aquatic Facilities
1-Mile Radius

36 High Level Maintenance ! ( !
[
Dog Park
Tails & Trails Dog Park serves Grandview's dog park needs with a small dog and large dog area complete with obstacle course equipment. Another dog park could be located in John Anderson, River Oaks, or Mapleview Park.
37 High Level Maintenance
! 0
Miles [ Legend Grandview City Limits Dog Park 1-Mile Radius
0.5 1 0.25
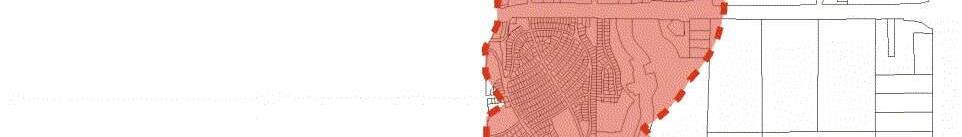
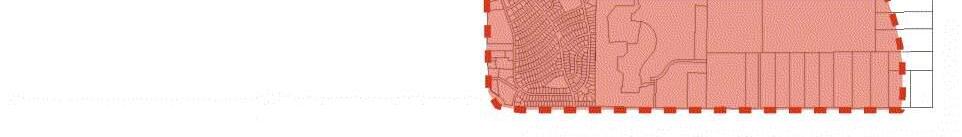
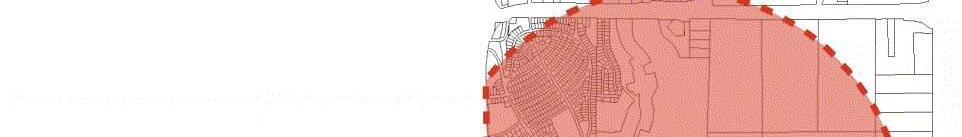
PLANNING AREAS
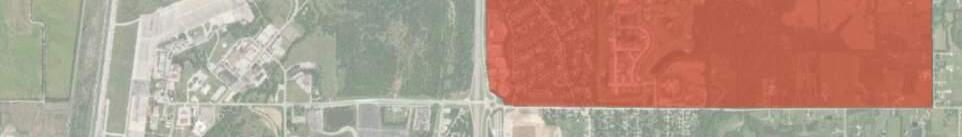
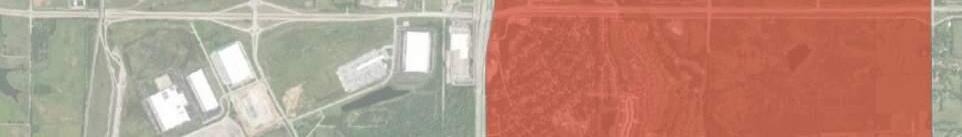
A total of three planning areas were defined for the purpose of analyzing equitable distribution of parks and recreation facilities throughout the City and to provide a planning tool for decision-makers.
The size and shape of each planning area was determined by the city's three wards. The following pages provide descriptions of each of the three planning areas. 1 2 3


38 High Level Maintenance
5
[
Source: Esri, Maxar, GeoEye, Earthstar Geographics, CNES/Airbus DS, U SDA, USGS , AeroGRID, IGN, and the GIS User Community
0 0
1 0 25 Miles
Area 1
OVERVIEW:
This area is a mix of single family residential, commercial, industrial, and agriculture. This is Grandview's most industrial and agricultural area with a mix of older and yonger generations. About 34% of Grandview's population lives here. Freedom Park, John Anderson Park, Terrace Park, and Valley Park serve this area's parkland needs. This racial makeup of this area is 47% white, 27% black, 1.5% asian and 24.5% other. About 20% of the population in this area are of Hispanic origin.
TOTAL AREA: 6.33 sq. mi.
INCOME:
$46,779 $25,835 MEDIAN PER CAPITA |
POPULATION: 8,980
1,419 77.7 36.7 DENSITY PER SQ. MI. DIVERSITY INDEX | | MEDIAN AGE
HOUSING: TOTAL UNITS 4, 183
42.3% 45.6% OWNER RENTER |
LAND USE
33%
21% 2022
Population by Generation: 24% 23%
RETIREMENT COMMUNITIES:
1946-1964
Baby Boomer Gen X
1965-1980
Millennial Gen Z
1981-1998
1999-2016
TAPESTRY SEGMENTATION:
• Single family homes and independent living apartments
• This group enjoys watching cable TV, and gets news through print media
• Take pride in fiscal responsibility and closely watch their finances
23%
RUSTBELT TRADITIONS: OLD & NEWCOMERS:
• Backbone of older industrial cities
• Mix of married couples and singles
• Primarily white collar with modest incomes
• Family-oriented and value time at home
• Singles' lifestyles on a budget
• Convenience over consumerism, economy over acquisition
• Neighborhoods are in transition
• Mostly renters, beginning careers, retiring, or still in college
METRO FUSION:
• Young market, many do not speak English fluently and are new homeowners
• Highly mobile, have young children, and are mostly renters
• Hardworking and climb social and professional ladders
FRONT PORCHES:
• Blend of household types with more young families with children
• More than half are renters and rent townhomes or duplexes
• Households typically have one vehicle and are influenced by friend and family
22%
18%
17%
14%
39 High Level Maintenance
28% Institution: 2% Single Family: 23% Recreation: .4% Industrial: 28% Commercial: 14% Multi-Family: 2% Duplex: .6% Park: 2% Park: 2%
Vacant/Ag:
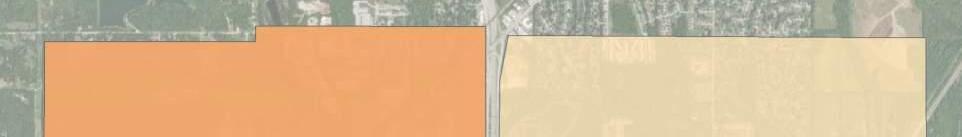
Area 2
OVERVIEW:
Area 2 is made up of mostly younger generations, most of them have children and/or are married. This area is mostly comprised of single-family homes, commercial properties, and vacant/ agriculture land. Approximately 31% of Grandview residents live in this area. Southview Park and Mapleview Park serve this area's parkland needs. The racial makeup of this area is 53% black, and 30% white, and 17% other minority races. About 9% are of hispanic origin.
TOTAL AREA: 3.04 sq. mi. INCOME:
$54,540 $26,812 MEDIAN PER CAPITA |
POPULATION: 8,260
2,717 67.6 36.2 DENSITY PER SQ. MI. DIVERSITY INDEX | | MEDIAN AGE
HOUSING: TOTAL UNITS 3,470
52.8% 41.1% OWNER RENTER |
LAND USE
Commercial: 31%
34%
21% 2022
Population by
Generation: 23% 22%
Baby Boomer
1946-1964
Gen X
1965-1980
Park: 2%
Vacant/Ag: 14%
Park: 2%
Institution: 3%
Multi-Family: 9%
Duplex: .6%
Single Family: 40%
1981-1998
Millennial Gen Z
1999-2016
TAPESTRY SEGMENTATION: CITY
COMMONS
• Young market, primarily single-parent households in large eastern metro cities
• More than a third have college degrees, nearly a quarter didn't finish high school
• Residents strive for the best for themselves and their children
HOME IMPROVEMENT
• Married-couple families make up more than half of these households
• Most are owner occupied residences
• Education and diversity levels mirror US levels
• Eat out & do DIY projects regularly
METRO FUSION
• Young market, many do not speak English fluently and are new homeowners
• Highly mobile, have young children, and are mostly renters
• Hardworking and climb social and professional ladders
COMFORTABLE EMPTY NESTERS:
• Older and still live in suburbs where they grew up
• Most are professionals in government, healthcare, or manufacturing
• Enjoying transitioning from child rearing to retirement
FAMILY FOUNDATIONS:
• Family and faith are the cornerstones
• Older children still live at home and are working toward financial independence
• Neighborhoods are stable and many work in industry or public admin
• Style is important for clothing and tech
30%
24%
23%
13%
10%
40 High Level Maintenance
.3% Industrial: .1%
Recreation:
Area 3
OVERVIEW:
This area's land use is almost 50% parkland and recreation. The tapestry of this area is predominatlely a younger market, most are married, have children, and may not speak english fluently. A third of Grandview's population occupy this area. Nearly half (5) of Grandview's parks are found in this area. Racially, this area is made up of 46% white, 35% black, 11% two or more races, and a variety of other races making up the balance. About 12% are hispanic.
19% 2022
Population by Generation:
TOTAL AREA: 5.15 sq. mi. INCOME: POPULATION: 9,005
$59,354 $33,262 MEDIAN PER CAPITA
1,749 72.5 34.4 DENSITY PER SQ. MI. DIVERSITY INDEX
MEDIAN AGE
HOUSING: TOTAL UNITS 4,066
47.1% 46.2% OWNER RENTER |
LAND USE
1946-1964
Baby Boomer Gen X
1965-1980
1981-1998
Millennial Gen Z
1999-2016
TAPESTRY SEGMENTATION:
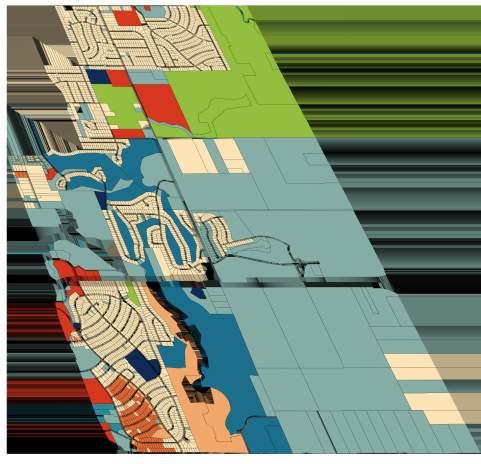
METRO FUSION:
• Young market, many do not speak English fluently and are new homeowners
• Highly mobile, have young children, and are mostly renters
• Hardworking and climb social and professional ladders
HOME IMPROVEMENT
• Married-couple families make up more than half of these households
• Most are owner occupied residences
• Education and diversity levels mirror US levels
• Eat out & do DIY projects regularly
RUSTBELT TRADITIONS:
• Backbone of older industrial cities
• Mix of married couples and singles
• Primarily white collar with modest incomes
• Family-oriented and value time at home
• Most have likved, worked, and played in the same area for years
53%
41%
6%
41 High Level Maintenance
|
| |
23% 26% 32%
Vacant/Ag: 5% Institution: 2% Single Family: 21% Recreation: 22% Commercial: 12% Multi-Family: 11% Park: 28% Park: 28% Duplex: .1% Industrial: .1%
42 High Level Maintenance
Inventory Assessment
ASSESSMENT PROCESS
An inventory and assessment of Grandview's parks was conducted by the consultant team. The team visited each park and rated them based on 5 metrics to establish a Level of Quality (LOQ) rating for each. The following metrics were used: Accessibility, Character, Connectivity, Usability, and Condition of Amenities. LOQ ratings are identified on the following cut sheets with a gauge of Good, Fair, or Poor.
ASSESSMENT CRITERIA
Below is a brief description of the criteria for each metric:
Accessibility is determined not only by the presence of Americans with Disabilities Act (ADA) accommodations, but also by whether or not one can easily identify it as a park and access it by one or more modes of transportation. Other criteria for this metric include park signage, the presence of parking, and visual accessibility (site lines) into the park.
Character of a park includes criteria that evaluate both the look and feel of a park and the experience. In some cases, parks have charming features or are in a unique setting with natural beauty or interesting views inherent to their location. While these are often factors that cannot always be created in every park, there are other criteria that affect character through the experience one has while there. Such criteria include maintenance, landscaping, shade, seating, site furnishings, and lighting
Connectivity of parks studied from several aspects including connectivity to neighborhoods, other parks, and points of interest. Parks with sidewalks that connect to neighborhoods with a good sidewalk network enhance pedestrian connectivity. Parks that connect to other parks and points of interest such as schools and community centers gain bonus points for being well connected.
Usability is a metric that looks at what a park has to offer its community. This metric asks the question, does it have suitable land and offer basic amenities necessary to function as a park? Criteria for this metric include the park's amenity offering which looks at whether or not there is suitable green space for activities, and if there are amenities other
than green space. Amenities such as shelters, playgrounds, trails, and restrooms also play into evaluation of this metric.
Condition of Amenities has a significant impact on the overall LOQ rating of parks as well as the health, safety, and wellfare of its users. Amenities in each park are rated on their remaining lifespan.
PERFORMANCE SUMMMARY
Overall, there is a mix of Good, Fair, and Poor parks in Grandview. The cut sheets on the following pages provide a more in depth look at each park's performance, key issues, and recommendations to enhance the parks ratings and service to the community. Below is a summary table of the LOQ ratings for each park resulting from the assessment criteria performance.
Mini Parks
Bobcat Park Poor
Little Corner Park Fair
Neighborhood Parks
Belvidere Park Poor
Freedom Park Good
Mapleview Park Good
River Oaks Park Fair
Southview Park Fair
Terrace Park Poor
Valley Park Fair
Community Parks
John Anderson Park Fair
Meadowmere Park Good
Special Use Parks
Shalimar Park Fair
Shooting Range Park Fair
Tails & Trails Dog Park Fair
43 High Level Maintenance
Park LOQ Assessment
Belvidere Park
PARK FACTS
Location: 14713 Fuller Ave.
Park Type: Neighborhood Park
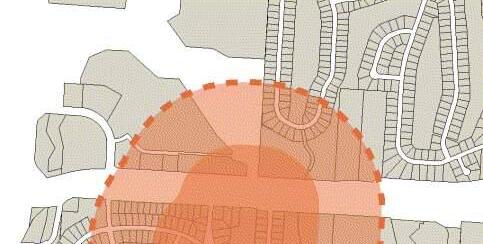
Park Size: 5 Acres
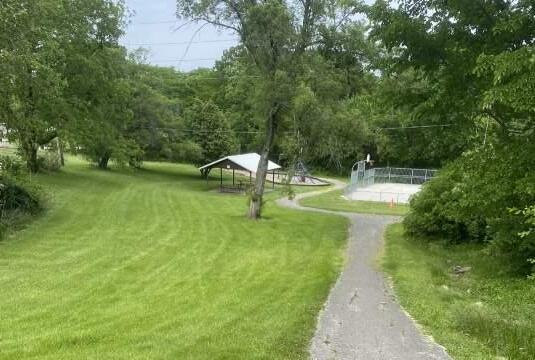
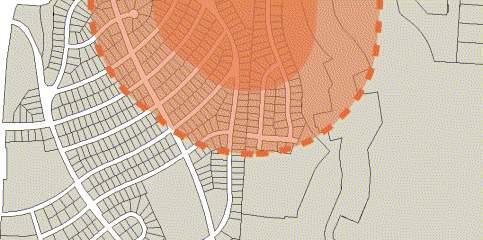
Description: Belvidere Park is a neighborhood park with unique amenities such as their multi-sport court where you can play basketball, hockey, and futsal. It also has a partially wooded loop path, a shelter, a rope play structure, and a zip-line.
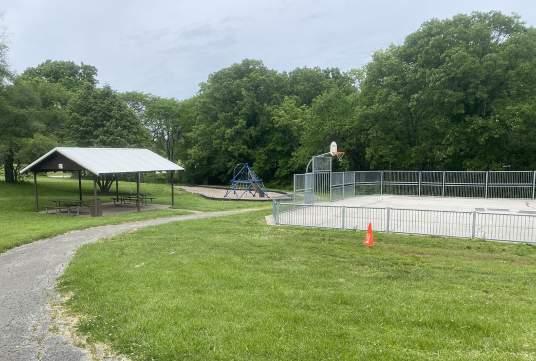
Inventory of Amenities:
Multi-sport Court
Playground
Walking loop
PUBLIC OPEN HOUSE REQUESTS:
Re-design basketball court
Bridge on East side of creek Lights
44 High Level Maintenance
Gazebo
2.5
5 min
min
AMENITIES - AT A GLANCE


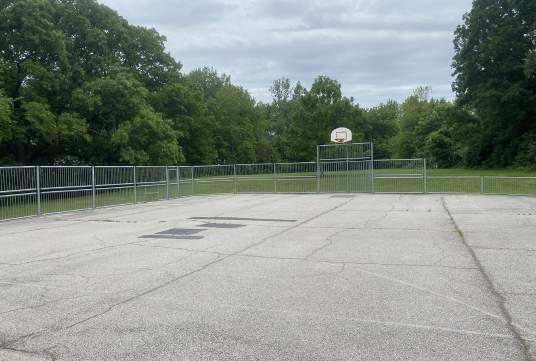
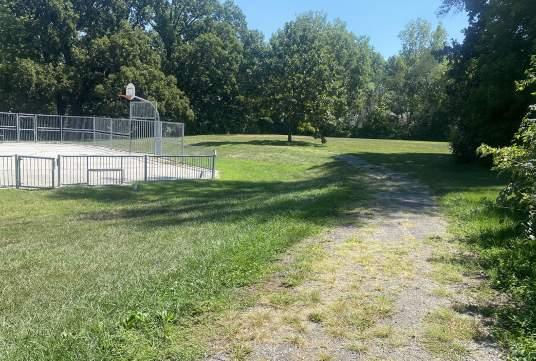
45 High Level Maintenance
LEVEL OF QUALITY
Key Issues:
FAIR GOOD POOR
POOR
Accessibility:
FAIR GOOD
POOR FAIR GOOD
While there is a parking lot, the sidewalk from the parking lot is fairly steep and not ADA, making accessibilty difficult. Because of the steep drop from the parking lot, there is little visibility from the street into the park and vice versa.
Character:
POOR FAIR GOOD
Belvidere Park has fair character. It is partially wooded with a walking loop and two creek crossings. It has Grandview's only multi-sport court and some interesting play equipment.
Connectivity:
LOW MEDIUM HIGH
Pedestrian connectivity to Belvidere Park is fairly low. Since Belvidere Park is predominately surrounded by neighborhoods, there is little connectivity to points of interest, major roads, and other parks. While it is close to River Oaks Park, there is a major highway the separates them and makes connection difficult and dangerous. Belvidere is the second southern-most park in Grandview.
Usability:
LIMITED HIGH
The usability of this park in its current state is fairly high. Consider making access points into the park more ADA friendly and accessible. The playground, picnic shelters, sport court, and walking path look to be regularly used.
Condition:
POOR FAIR GOOD
The condition of amenities in this park is fairly poor. The multi-sport court may be in need of repair or re-pavement. Amenities are few and don't fully utilize the space. The walking loop pavement is cracked and may need replacement in 1-3 years.
• Accessibility concerns from parking down to park amenities.
• Low water crossing has significantly deteriorated, making crossing difficult.
• Asphalt has deteriorated, with sections being overtaken by vegetation.
• Limited visability from the street.
Recommendations:
• Create an accessible parking lot off of 147th Street, with additional signage.
• Replace both creek crossings to provide accessible accommodations.
• Repave and extend the asphalt trail.
• Repavethe existing parking lot and add security lighting.
Opinion of Probable Costs: $542,500
46 High Level Maintenance
PROPOSED IMPROVEMENTS:
a. ADA Accessible Parking
b. Park Entry Sign (147th St. entrance)
c. Replace Low-Water Crossing


d. Replace Pedestrian Bridge
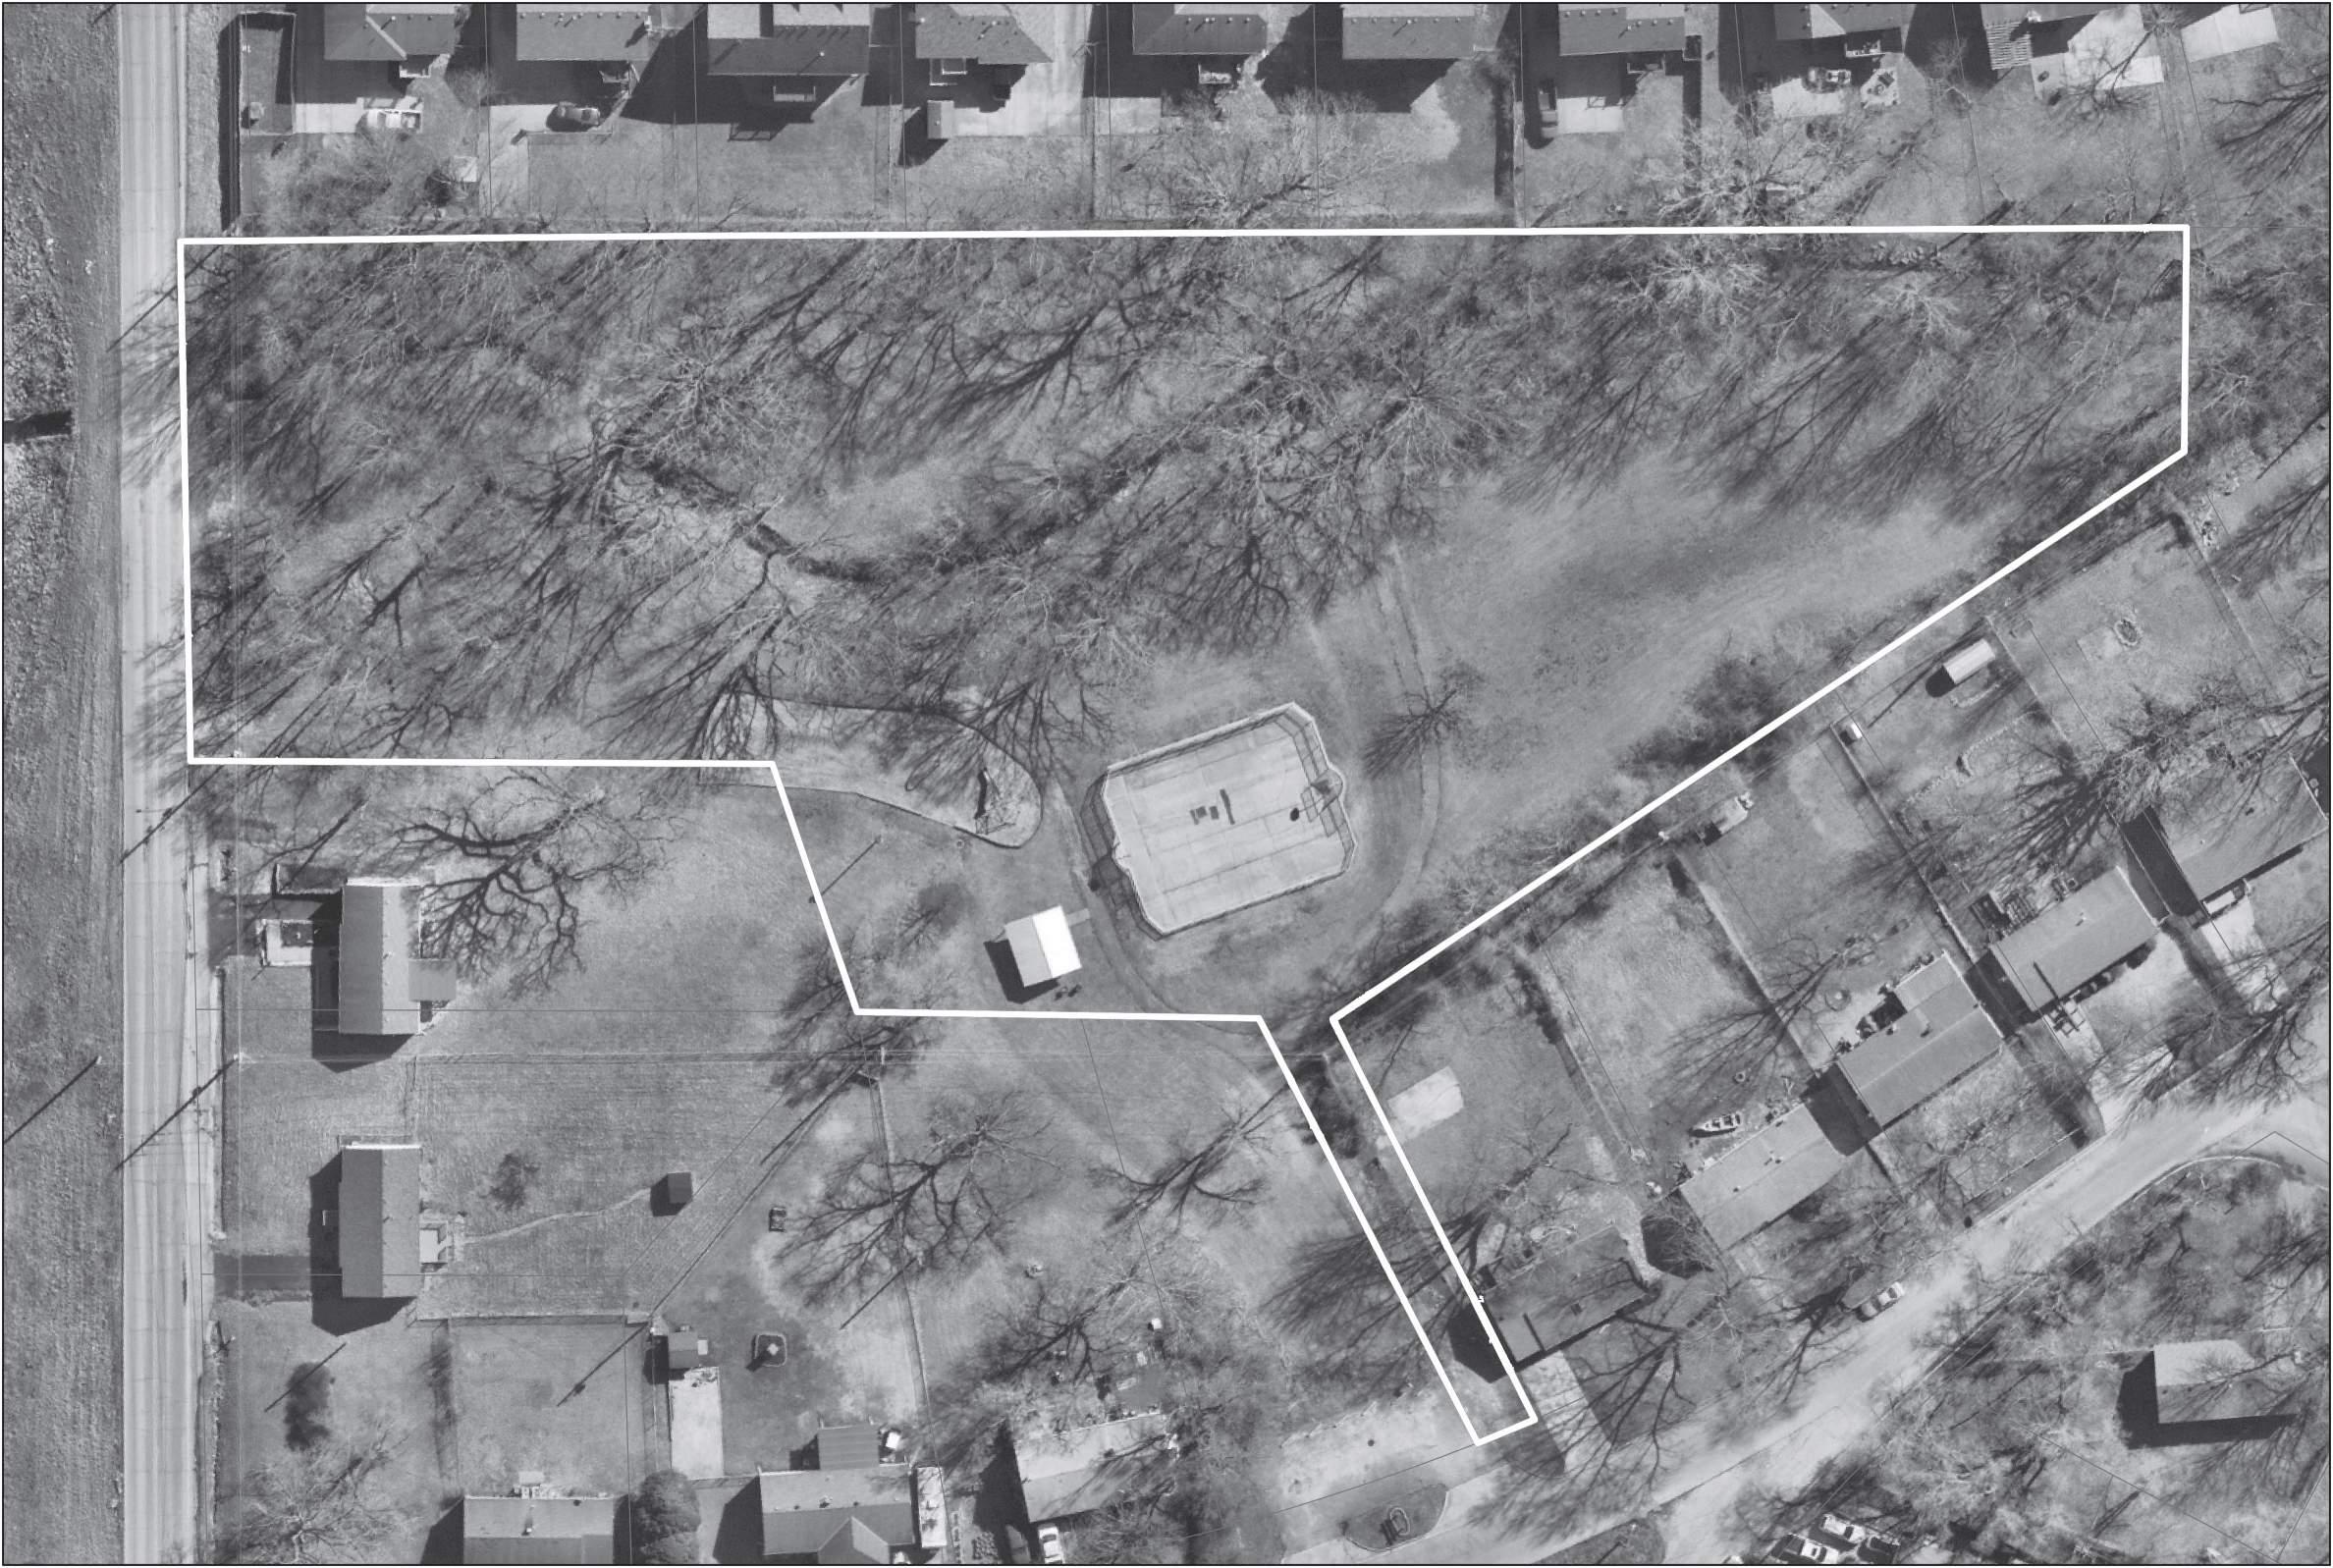
e. Repave Asphalt Trail
f. Update Playground
g. Expand Trail
h. Re-pave Parking Lot and Add Lighting
E 147th St. FullerAve. AsphaltLoopTrail Update Playground Unprogrammed Open Green Space Steep Slope Parking Sign Add ADA Parking Low-water Crossing Pedestrian Bridge Expand Loop Trail Small Shelter Multi-Sport Court 1"= 50' belvidere Park N
a c d h b e g f
Bobcat Park
5 min
2.5 min
PARK FACTS
Location: 15312 Bellaire St.
Park Type: Mini Park Park Size: .25 Acre
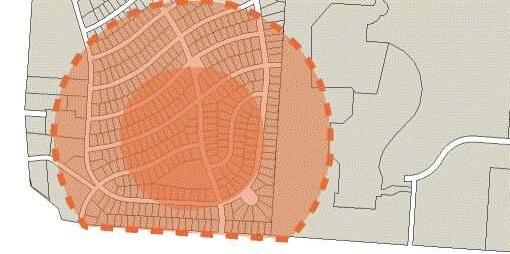
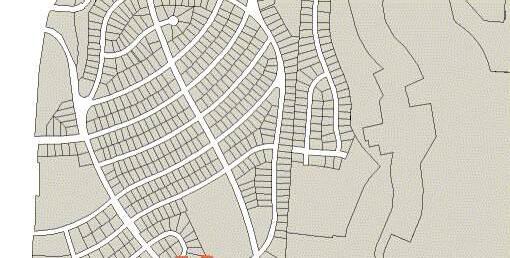
Description: Bobcat Park is one of several of Grandview's mini parks. Bobcat has personalized benches, some swings, (some inclusive), and a rope play structure. This park mainly serves this specific neighborhood and does not serve to draw visitors from other areas of Grandview.
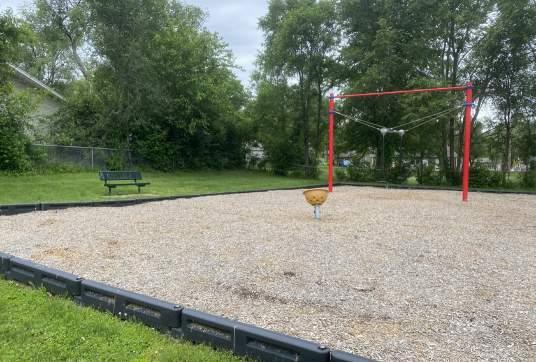
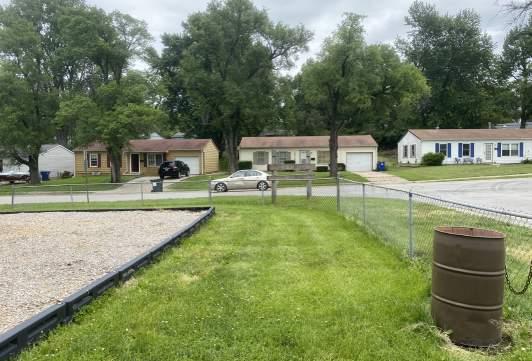
Inventory of Amenities: Benches Playground
PUBLIC OPEN HOUSE REQUESTS:
Trash cans
Street lights
48
AMENITIES - AT A GLANCE


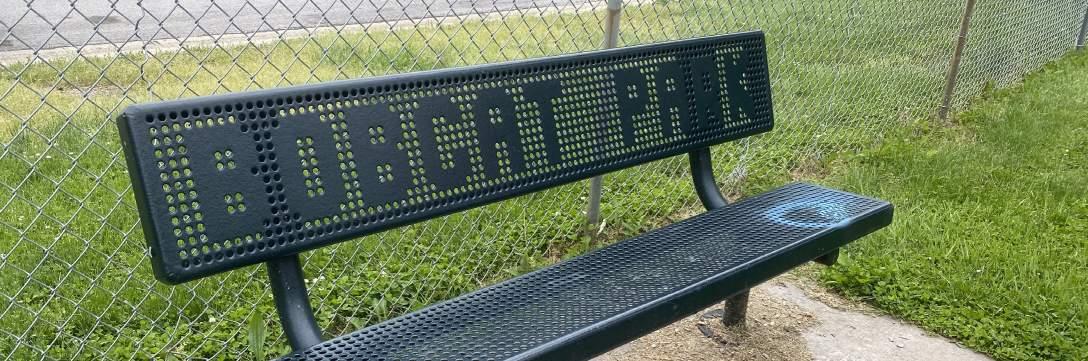
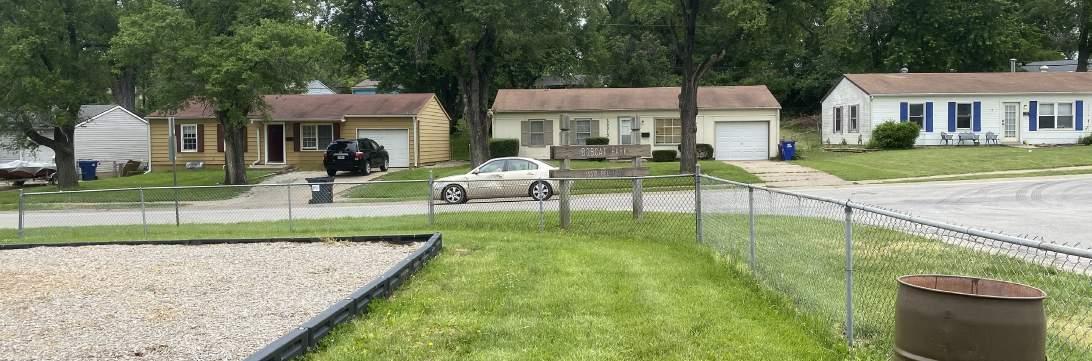
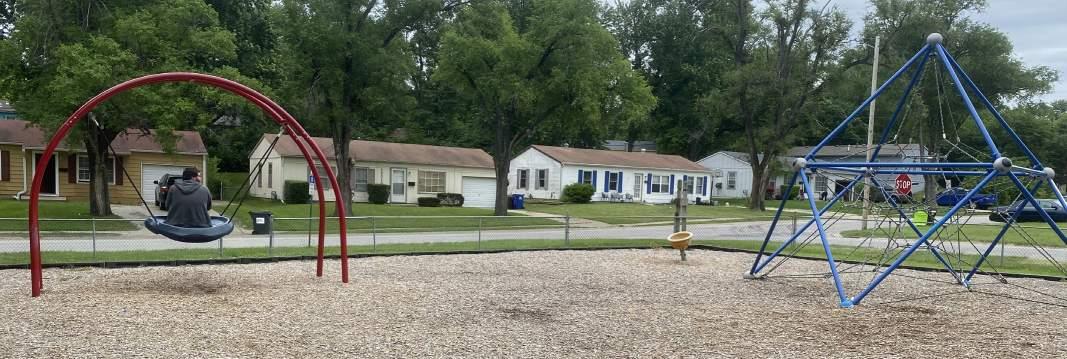
49 High Level Maintenance
LEVEL OF QUALITY
POOR
FAIR GOOD
Accessibility:
POOR FAIR GOOD
This is Grandview's southern most park and has little accessibility to other parks. This is also one of the smallest parks in the Grandview system and is completely flat, making accessibility fair. There is one inclusive play swing.
Character:
POOR FAIR GOOD
Bobcat Park has poor character. Besides it's branded benches, there is not much that differentiates this park from others in the Grandview park system. Park sign looks dated and in need of replacement.
Connectivity:
Key Issues:
• Park sign needs updating and replacement.
• Lack of shade.
• Limited play equipment offering for younger age groups.
• Fence is aging and needs replacement.
Recommendations:
• Consider adding play equipment suitable for 2-5 year olds.
• Playground replacement
• Create shade by adding a 16'x20' shelter, and large tree plantings on the east edge.
• Add family games to bring in multigenerational amenities.
• Update trash receptacles.
• Consider replacing the park sign in the next 2-5 years.
The closest park is Belvidere park and can be accessed through sidewalks as they are both in the southeast neighborhoods of Grandview. While situated within a neighborhood, it primarily serves a small radius of those residents.
Usability:
LOW MEDIUM HIGH LIMITED HIGH
This park has a limited usability rating. The variety of amenities this park has to offer is lacking, but the quality and condition of most amenities increase this park's overall usability with some newer amenities. While most amenities are newer, there is just not enough variety offered at this mini park.
Condition:
POOR FAIR GOOD
Amenities are newer and they are in fair condition. Improvement of the playground and addition of shade will help increase the current condition.
50 High Level Maintenance
of Probable
Opinion
Costs: $99,500
PROPOSED IMPROVEMENTS:

a. Additional Play Equipment (ages 2-5)


b. Small Shelter (16'x20')
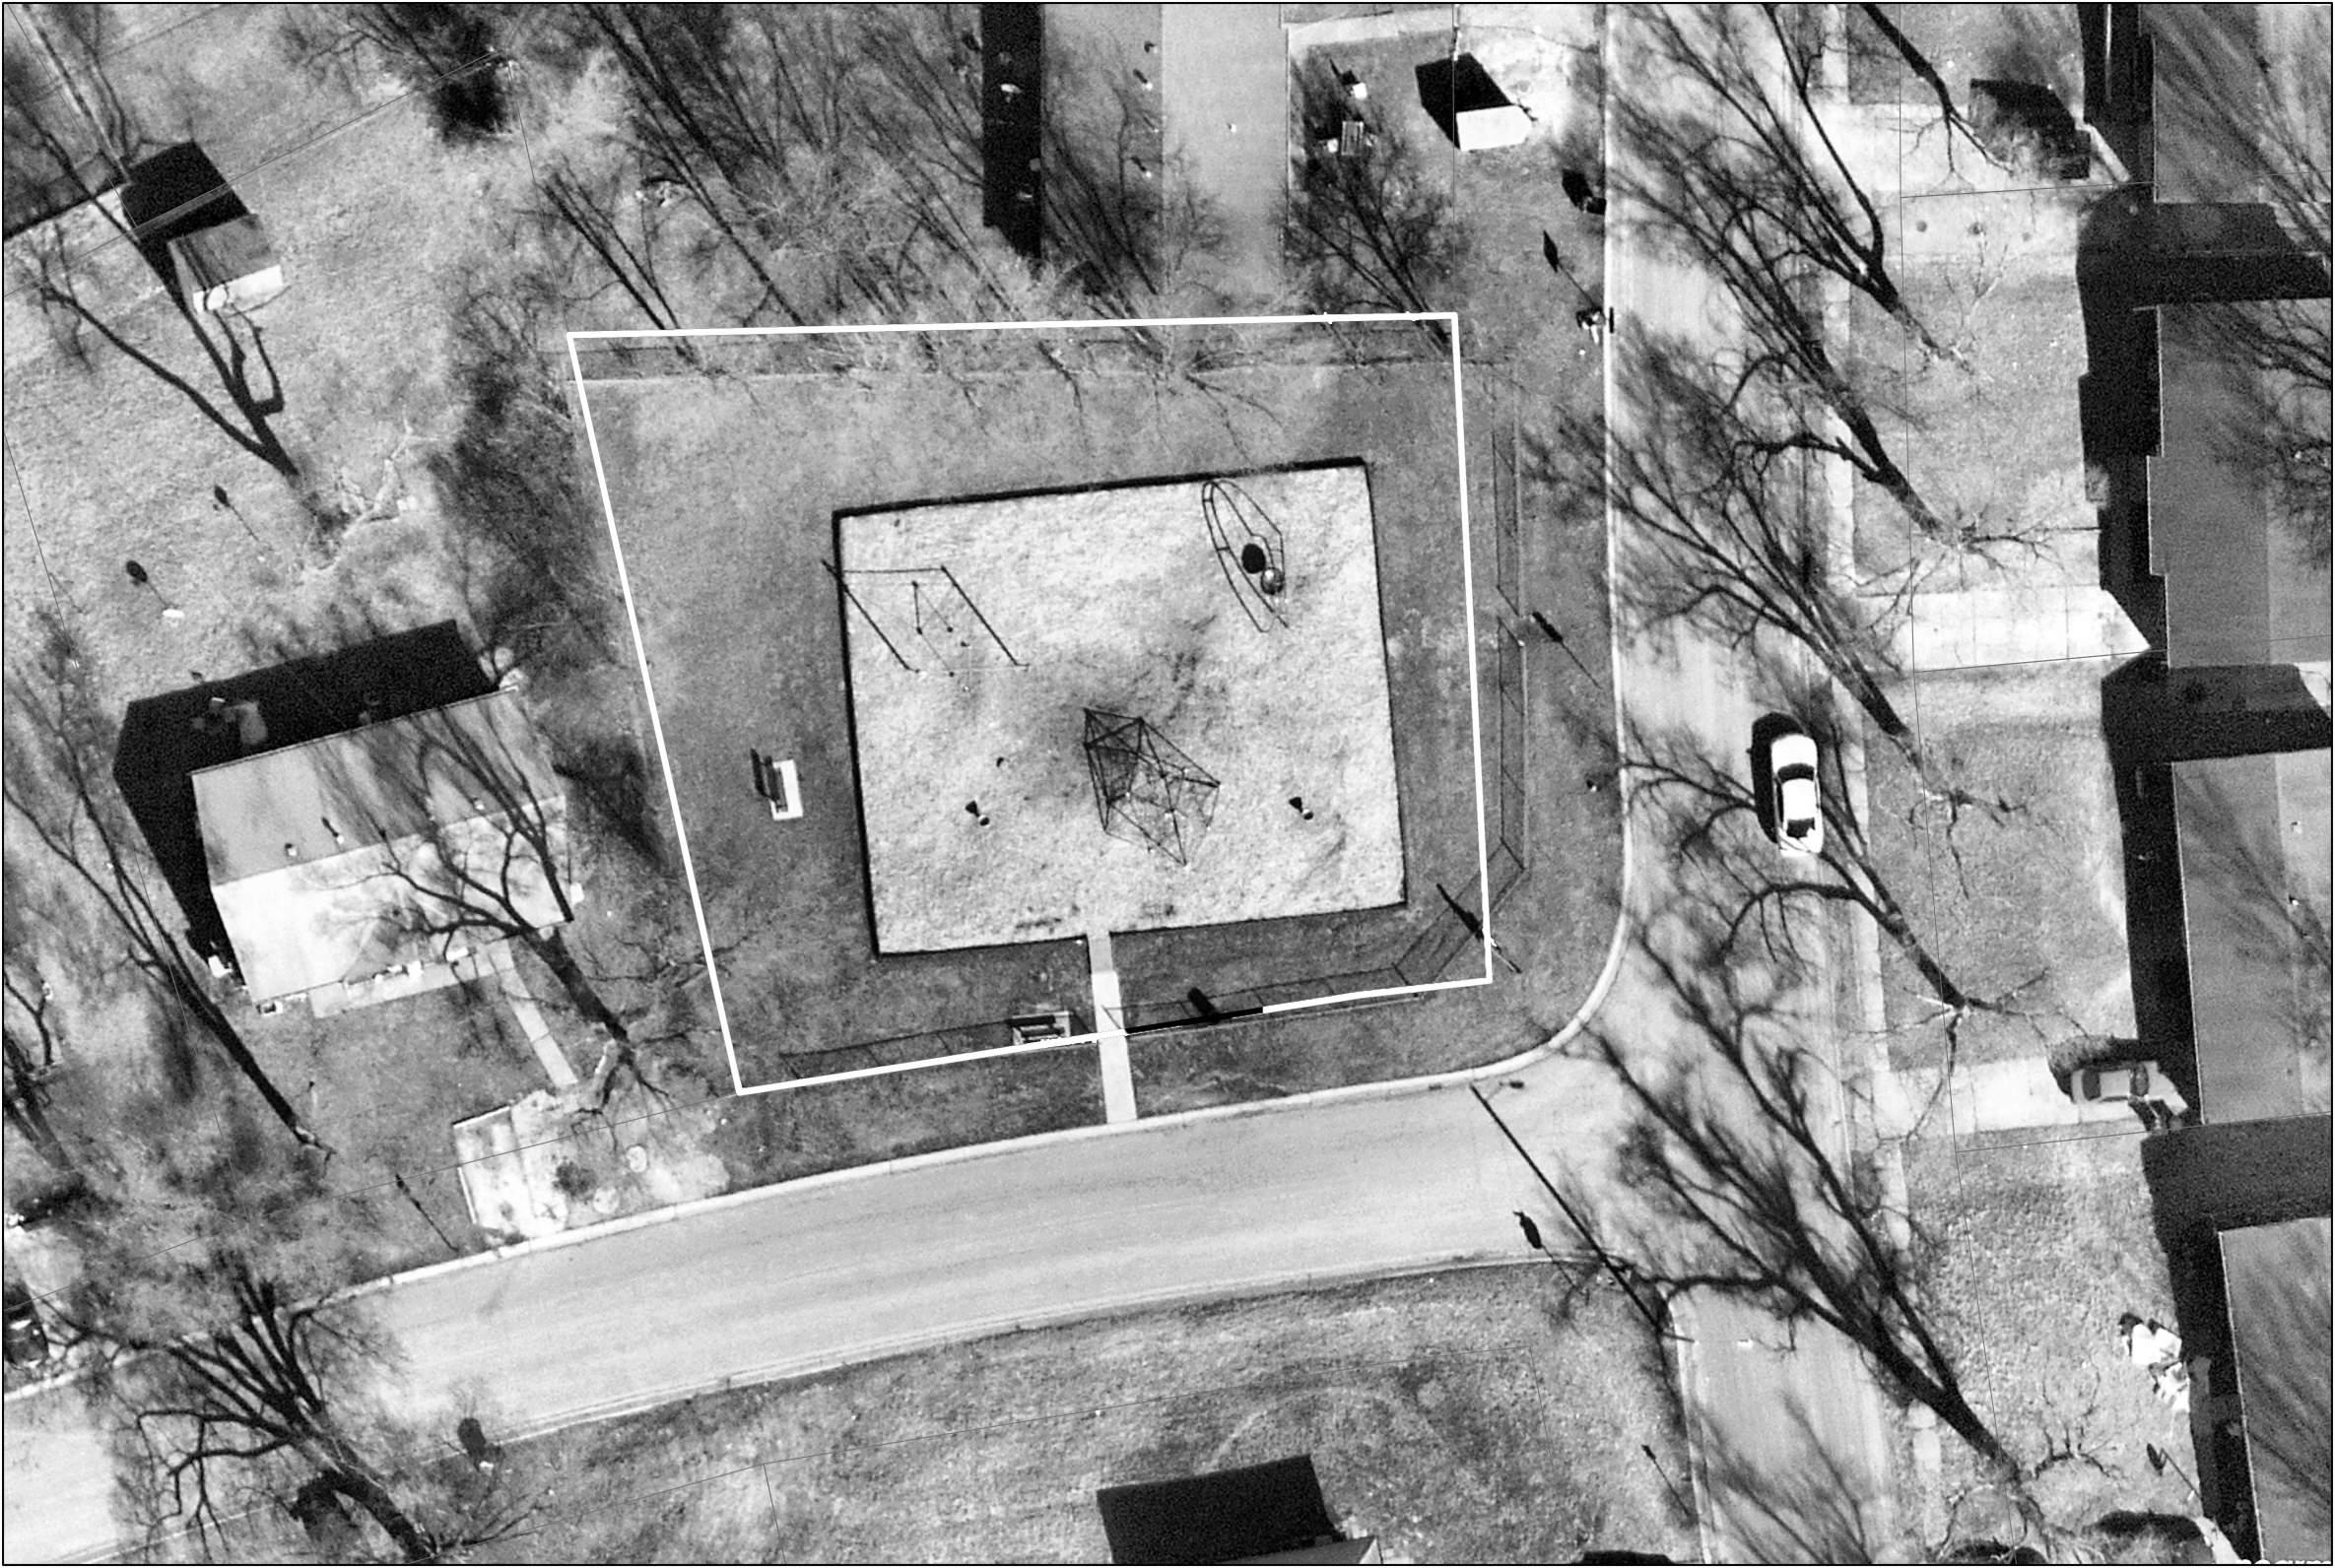
c. Plant Large Shade Trees

d. Family Games
e. Update Trash Receptacles
TERR.
E 153rd
BELLAIRE AVE. Bench Playground Fence Shelter Shade Trees Family Games + + + + Bobcat Park 1"= 20' N
a c b e d
Freedom Park
5 min
2.5 min
PARK FACTS
Location: 215 Jones Ave.
Park Type: Neighborhood Park
Park Size: 3 Acres
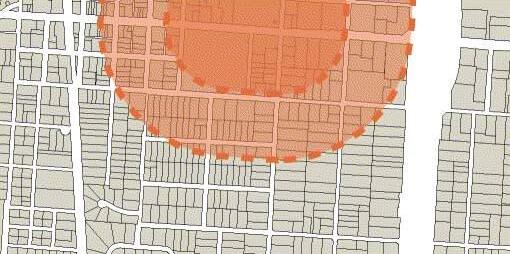
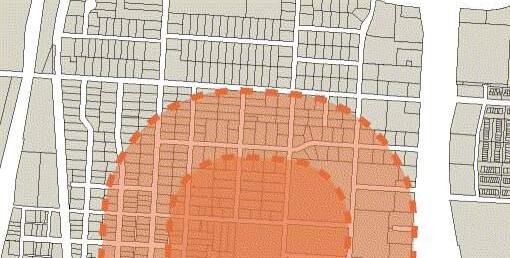
Description: Freedom Park serves as one of Grandview's neighborhood parks and is situated right next to City Hall. It houses the Train Depot and Depot Museum. Amenities include a playground, restroom, benches, picnic tables, a large gazebo, and some swings.
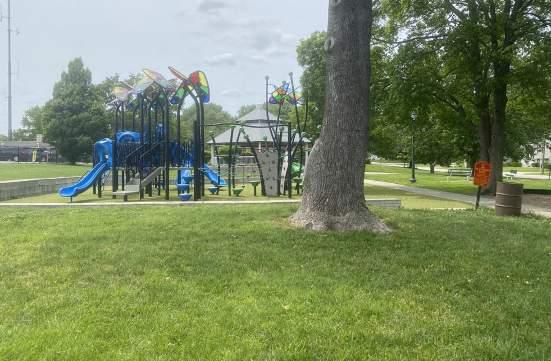
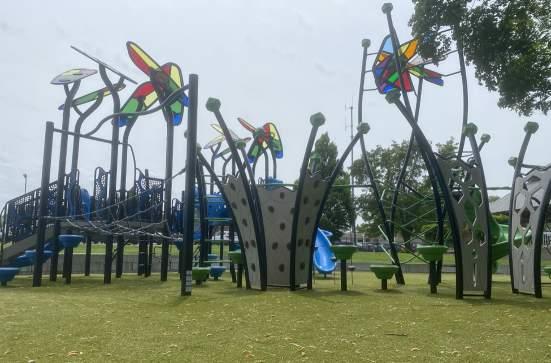
Inventory of Amenities:
Gazebo
Playground
Benches
Restrooms
Picnic Tables
PUBLIC OPEN HOUSE REQUESTS:
Trash cans
Street lights
52
AMENITIES - AT A GLANCE


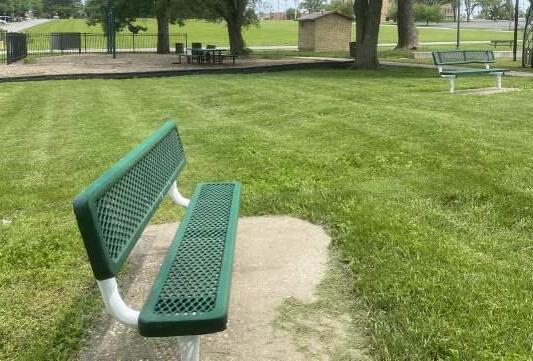
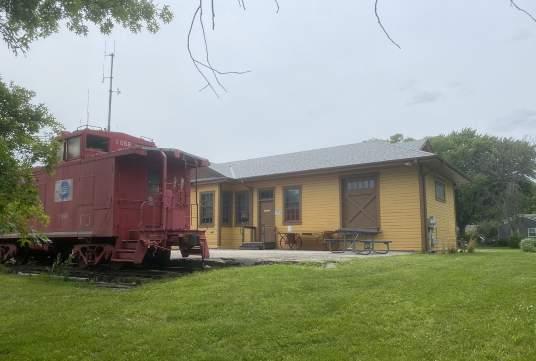
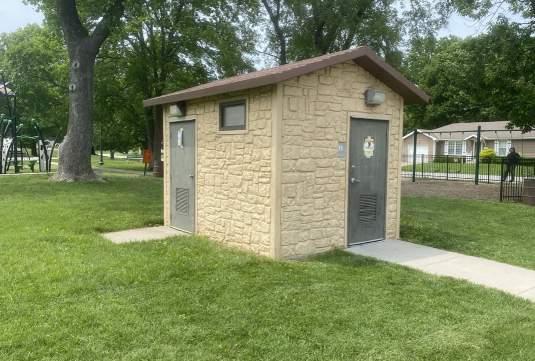
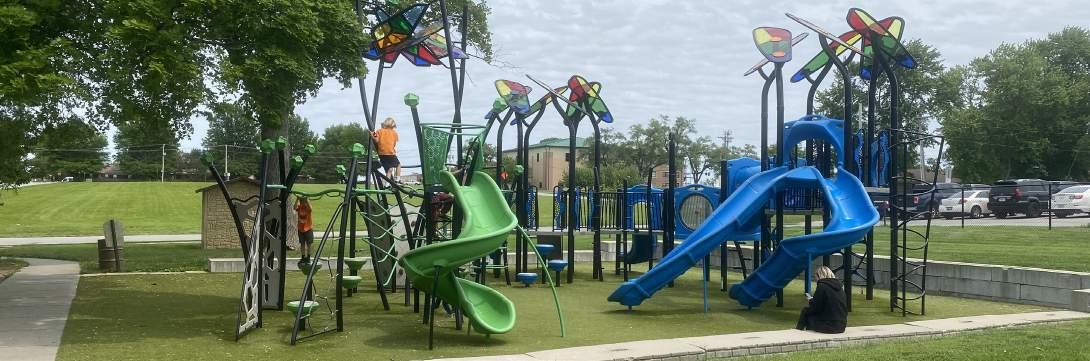
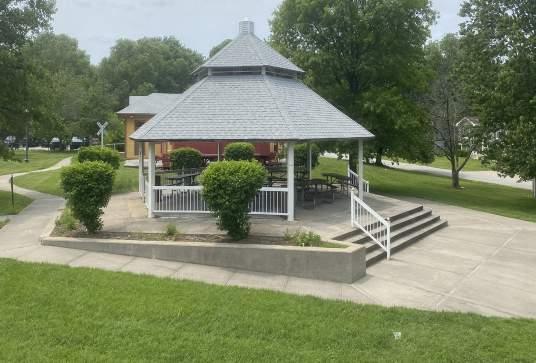
53 High Level Maintenance
LEVEL OF QUALITY
POOR
FAIR GOOD
Accessibility:
POOR FAIR GOOD
The park is easy to get to by car with good proximity to arterial routes. Freedom park has good visibility from most sides. Internal ADA accessibility is good, as well as parking accessibility. Parking lot is shared between park and City Hall.
Character:
POOR FAIR GOOD
Much of Freedom Park is fairly new, including a new playground and swings. Signage could use some updating, but overall character is fair and somewhat unique compared to other Grandview parks.
Connectivity:
LOW MEDIUM HIGH
Pedestrian connectivity to Freedom Park is medium with sidewalk connectivity to neighborhoods north and south. Freedom Park is closest to Terrace Park, which is located several blocks north. Freedom Park is also near City Hall and the old Grandview Train Depot and Depot Museum.
Usability:
LIMITED HIGH
This park has fairly high usability, consisting primarily of playground pieces. Consider new amenities or playground surfacing to replace the mulch with something softer such as a rubber surfacing.
Condition:
POOR FAIR GOOD
The condition of amenities is good. Consider opportunities to enhance or replace 1 or 2 amenities annually.
Key Issues:
• Too few amenities to interest users of multiple generations.
• Swings are reaching the end of their lifespan.
• Benches, trash receptacles and picnic tables are reaching the end of their life span or are damaged.
• Pavilion needs a fresh coat of paint.
• The fencing near the swings is crooked and pickets are bent.
• A better defined picnic area near the playground with amenities for the
Recommendations:
• Create a defined walking loop with interpretive panels along it that tell various stories of the City. This might encourage healthy habits of City Hall employees and visitors while teaching them more about Grandview. Consider a more pedestrian friendly experience through the parking lot by converting a few parking stalls to curbed planter islands with trees, shrubs, and perennials.
• Consider converting the swing area into a better define picnic area with multigenerational amenities like family games (e.g. cornhole).
• Replace swings in the next 2-5 years.
• Remove the fencing around north and east sides of the swing area. Consider replacing it with a fence material that is less residential looking and more park like such as a split rail fence and extending it to the parking lot off of Jones Avenue.
• Install more trees along the south edge of the park to create shade on the playground.
54 High Level Maintenance
Opinion of Probable Costs: $95,500
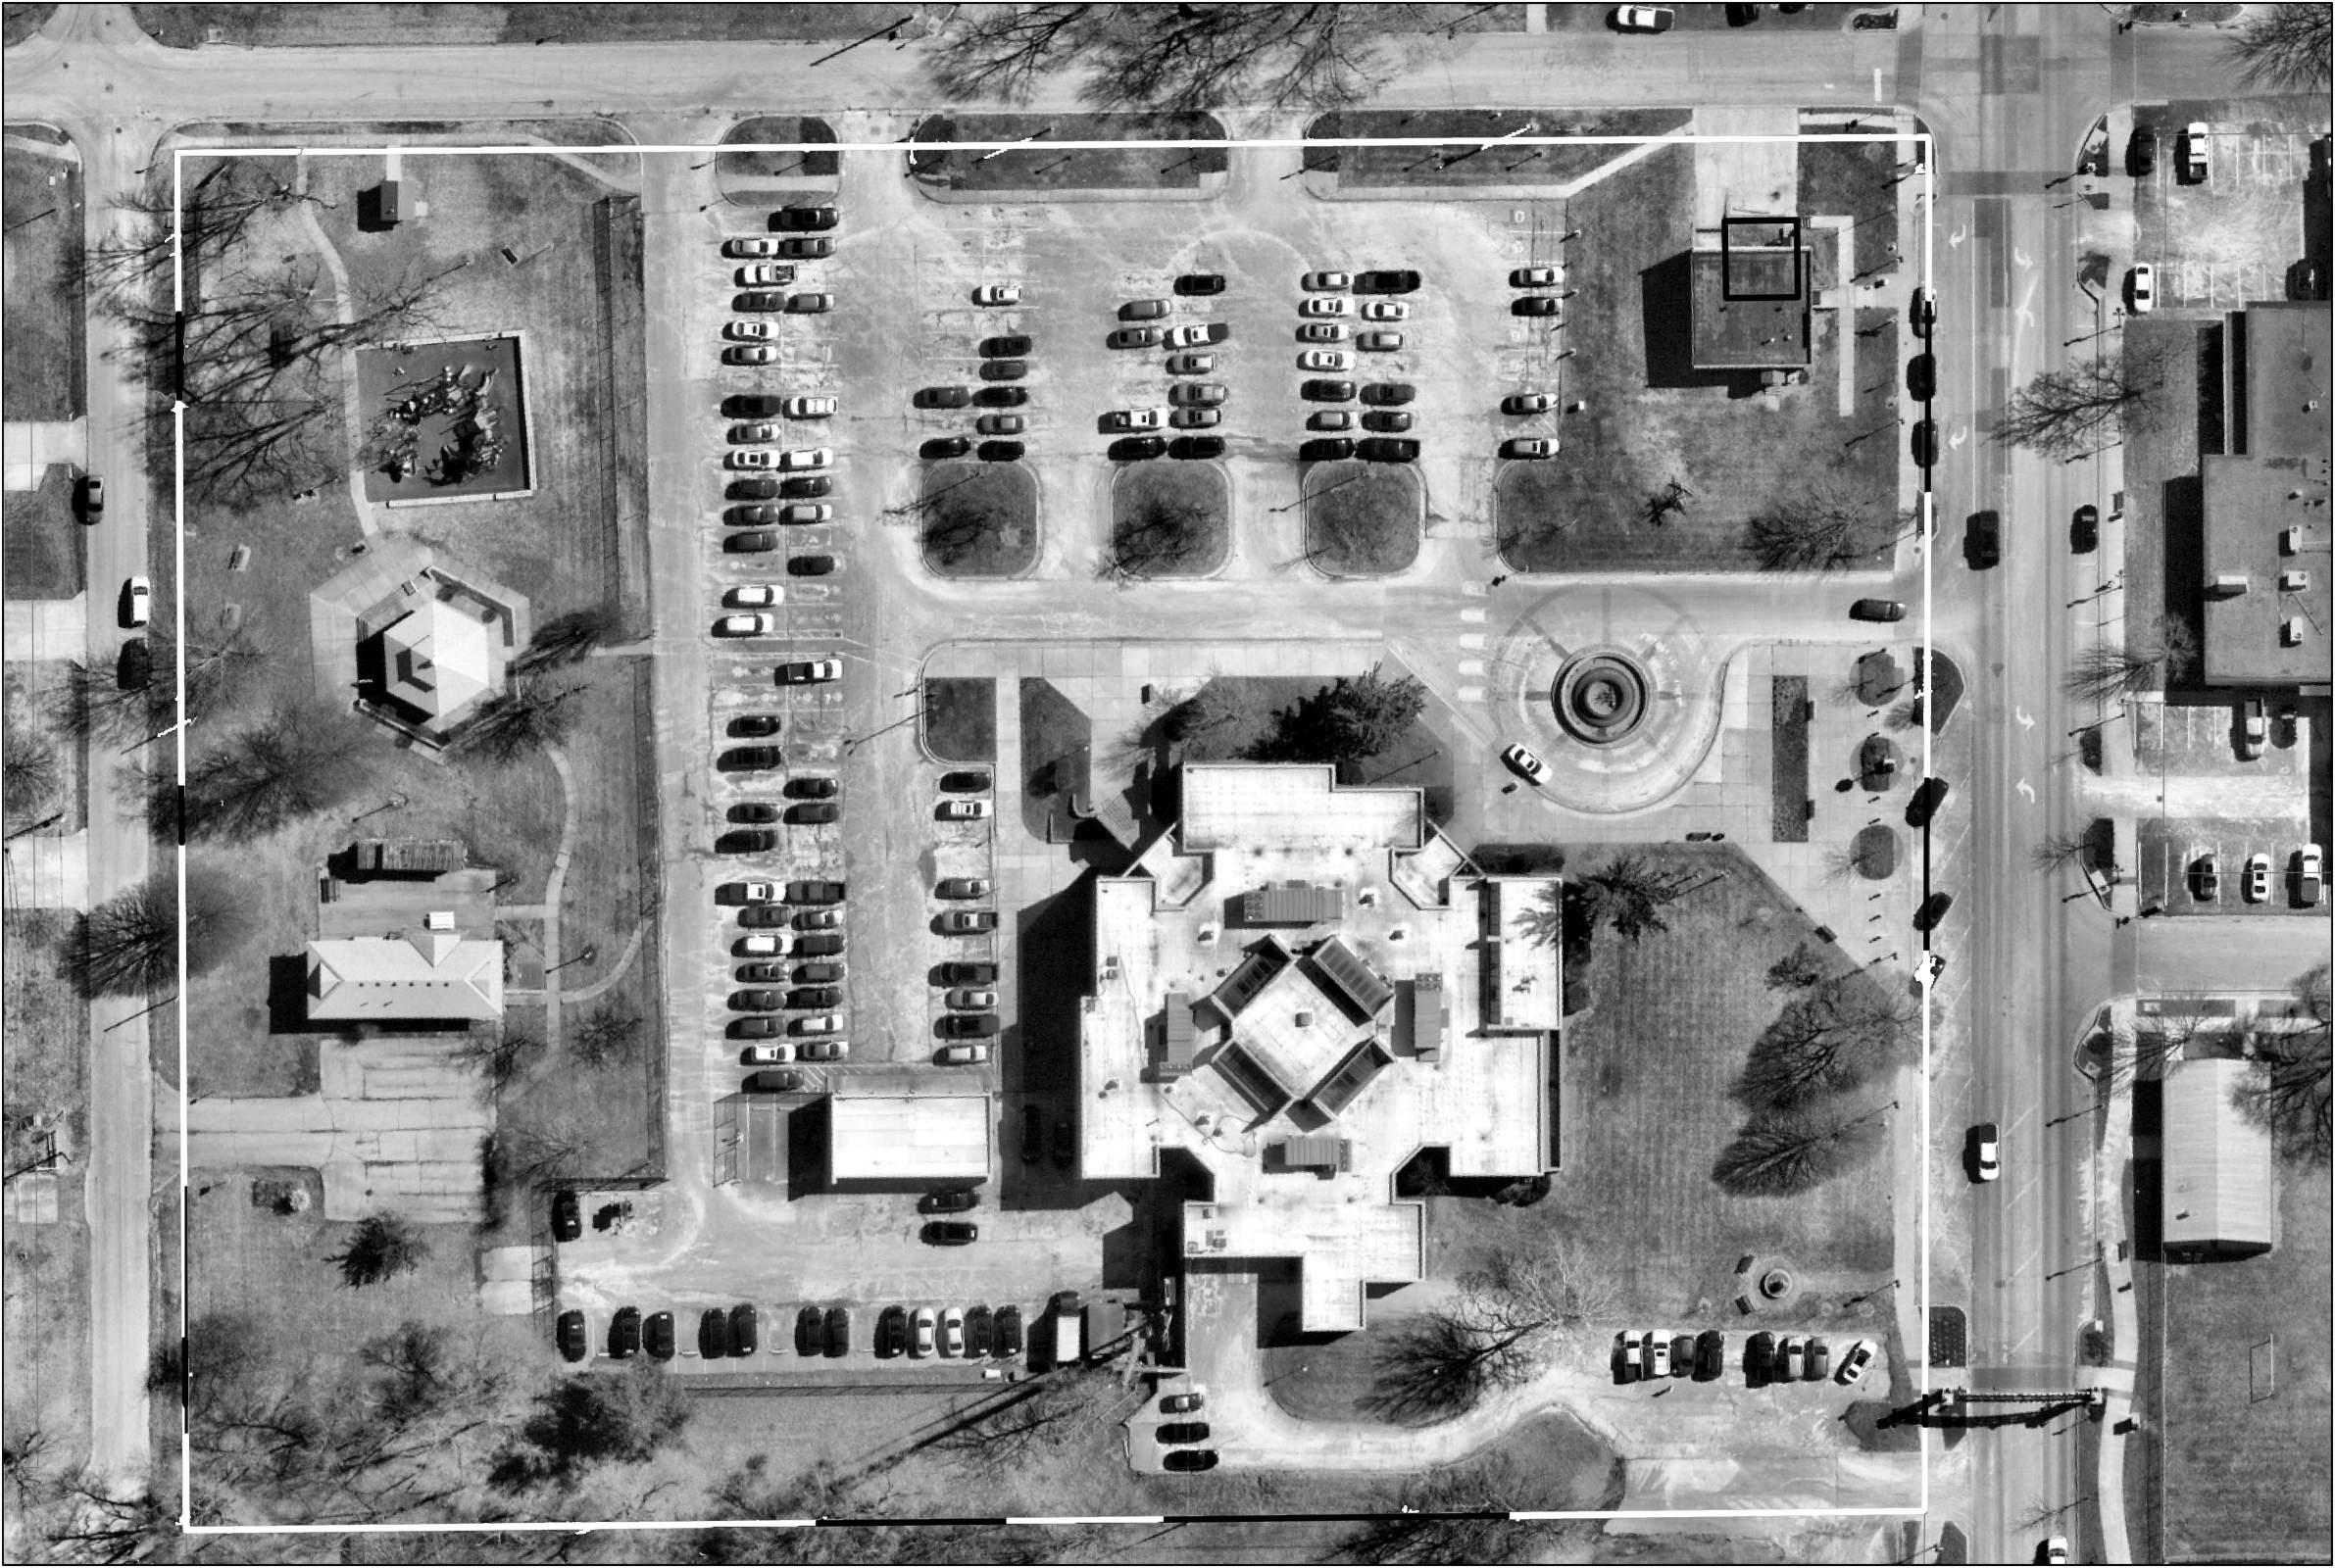


13th ST. JONES AVE. MAIN ST. + + + + + + + + + + + + + Train Depot Parking Parking Playground Restroom City Hall Depot Museum Fence Gazebo Interpretive Signage Loop Walk Parking Lot Islands Swings Fence Picnic Area & Family Games Interpretive Panels Freedom Park 1"= 50' N
Loop Trail with Interpretive Signage
Parking Lot Islands
Picnic & Family Games Area
Replace Swings
Additional Fencing f. Plant Large Shade Trees a c b d e f
PROPOSED IMPROVEMENTS: a.
b.
c.
d.
e.
JOhn Anderson Park
5 min
2.5 min
PARK FACTS
Location: 4701 E. 135th St. Park Type: Community Park Park Size: 35 Acres
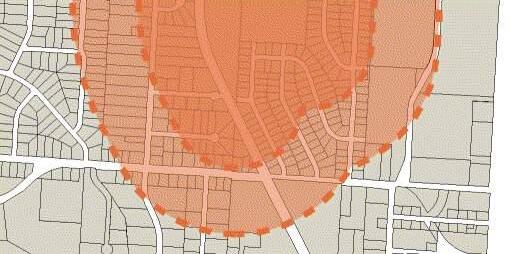
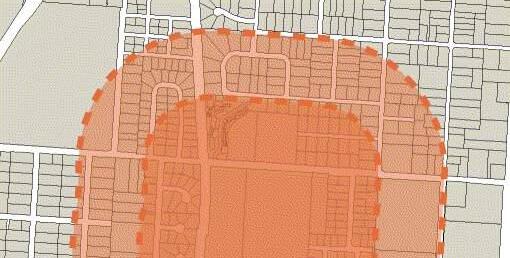
Description: John Anderson Park is one of two community parks that serves the City of Grandview. Amenities include a small splash pad, a playground, picnic shelters with picnic tables, several baseball/softball backstops, soccer goals for practice, tennis courts, and some swings, as well as a long loop trail through some wooded areas.
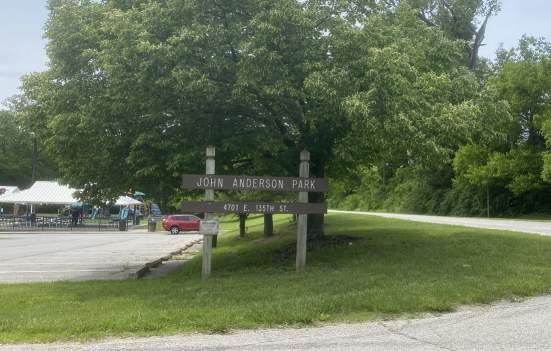
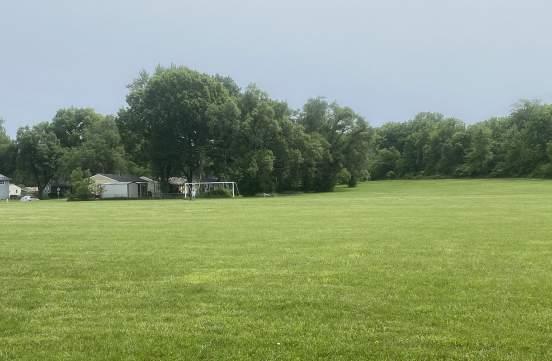
Inventory of Amenities:
Playground 2
Tennis Court 2
Splash Pad
Trails
Pavilion 4
Baseball 4
Soccer 1
Restrooms
Loop Trail
PUBLIC OPEN HOUSE REQUESTS:
Fitness stations around trail
Replace playground surfacing Replace old slide 9-hole disc golf course
56
AMENITIES - AT A GLANCE


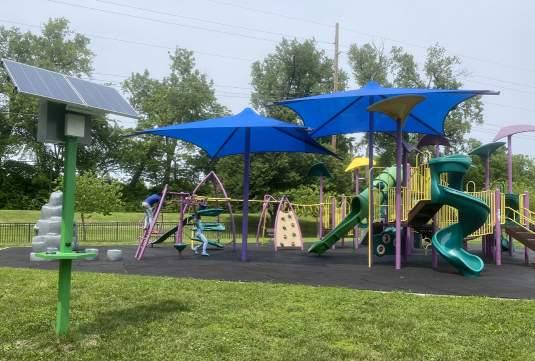
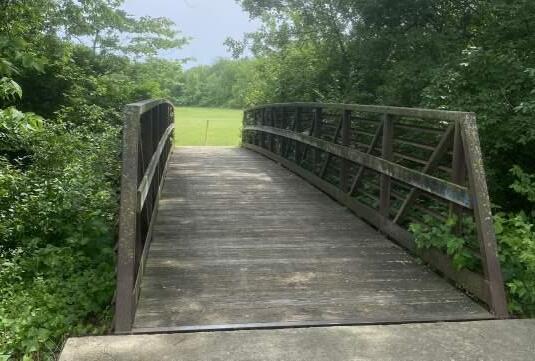
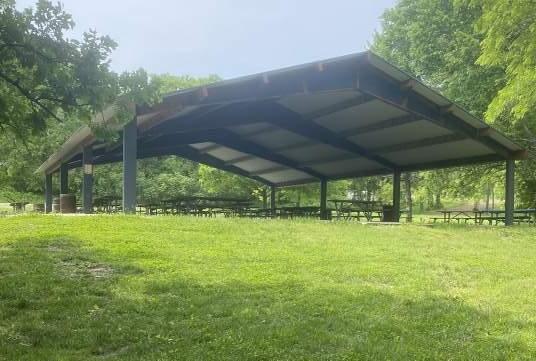
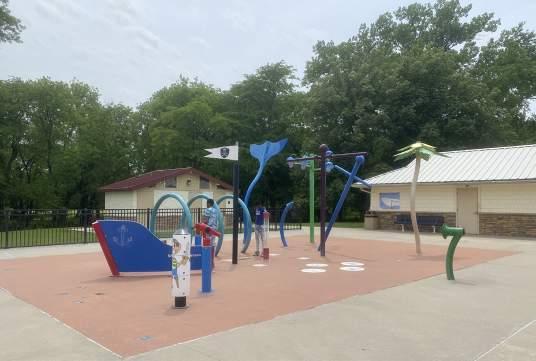
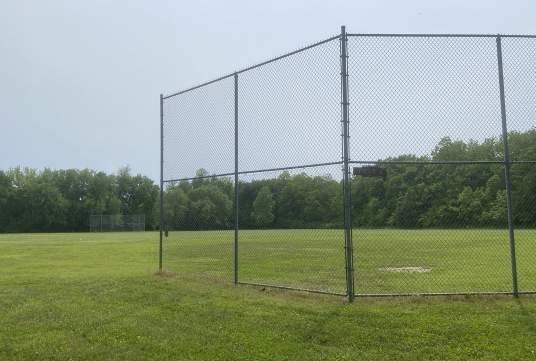
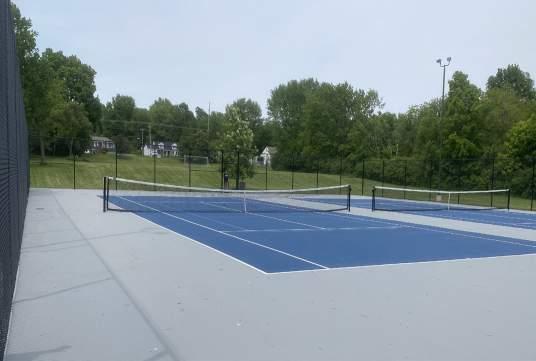
57 High Level Maintenance
LEVEL OF QUALITY
POOR
Accessibility:
FAIR GOOD
POOR FAIR GOOD
The park is fairly easy to get to by car with good proximity to arterial routes and signage at both entrances of the park. Parking is provided including ADA accessible stalls. Sight lines to much of the park are limited due to its wooded character and size of the overall park.
Character:
POOR FAIR GOOD
John Anderson Park provides a natural woodland character with a couple community tennis courts and ball fields. Ample shade is provided by large mature shade trees. Site furnishings such as picnic tables and benches are available, though sparse in some areas.
Connectivity:
LOW MEDIUM HIGH
Pedestrian connectivity is limited as there are few sidewalk connections and several significant barriers. The northern border of the park flanks busy E 135th Street, and western boarder follows a railroad track.
Usability:
LIMITED HIGH
This park has a fairly high usability rating and has several unique offerings like tennis courts, baseball/softball fields, soccer fields, and a small splashpad. Frequency of use of the tennis courts and ball fields could determine how usable some of these amenities actually are.
Condition:
POOR FAIR GOOD
Overall, amenities in this park are in fair condition. The large shelter is in need of cosmetic repairs and the trail will need resurfacing in the next 2 years. The playground needs resurfacing in the next couple years as well as possible improvements to the splash pad.
Key Issues:
• Overall this park needs a face-lift by updating aging equipment and a fresh coat of paint on shelters and shelter amenities.
• Consider adding a few new amenities to attract new users and reduce amenities that have low demand, such as the number of backstops.
• Bridges are in disrepair and are in need of replacement.
• Playground equipment needs updating and surfacing needs replacement.
• Splash pad equipment is aging and in need of updating.
• Picnic shelters are in need of new paint and some may need new roofs soon.
• Parking proximity to some site features tends to be slightly further than desirable.
Recommendations:
• Update playground and splash pad equipment and surfacing.
• Consider expanding trail network to loop around the perimeter of the park, and all densely vegetated corridors.
• Additional parking lot with access drive to increase usability of the largest shelter.
• Add additional active recreation amenities, such as baskeball, pickleball disc golf, and sand volleyball.
• Create a neighborhood hub at the 11th street entrance by addding a shelter and family games.
• Replace or repair bridges where needed.
• Shelter repairs, consider replacing roofing on the larger shelter and cosmetic repairs on the smaller facilities.
Opinion of Probable Costs: $1,455,500
58 High Level Maintenance
PROPOSED IMPROVEMENTS:
a. Update Play Equipment and Surfacing
b. Update Splashpad Equipment
c. Expand the Trail Network
d. Vehicular Access w/ ADA Parking
e. Expand the Playground Area
f. Add a Basketball Court
g. Add a Disc Golf Course
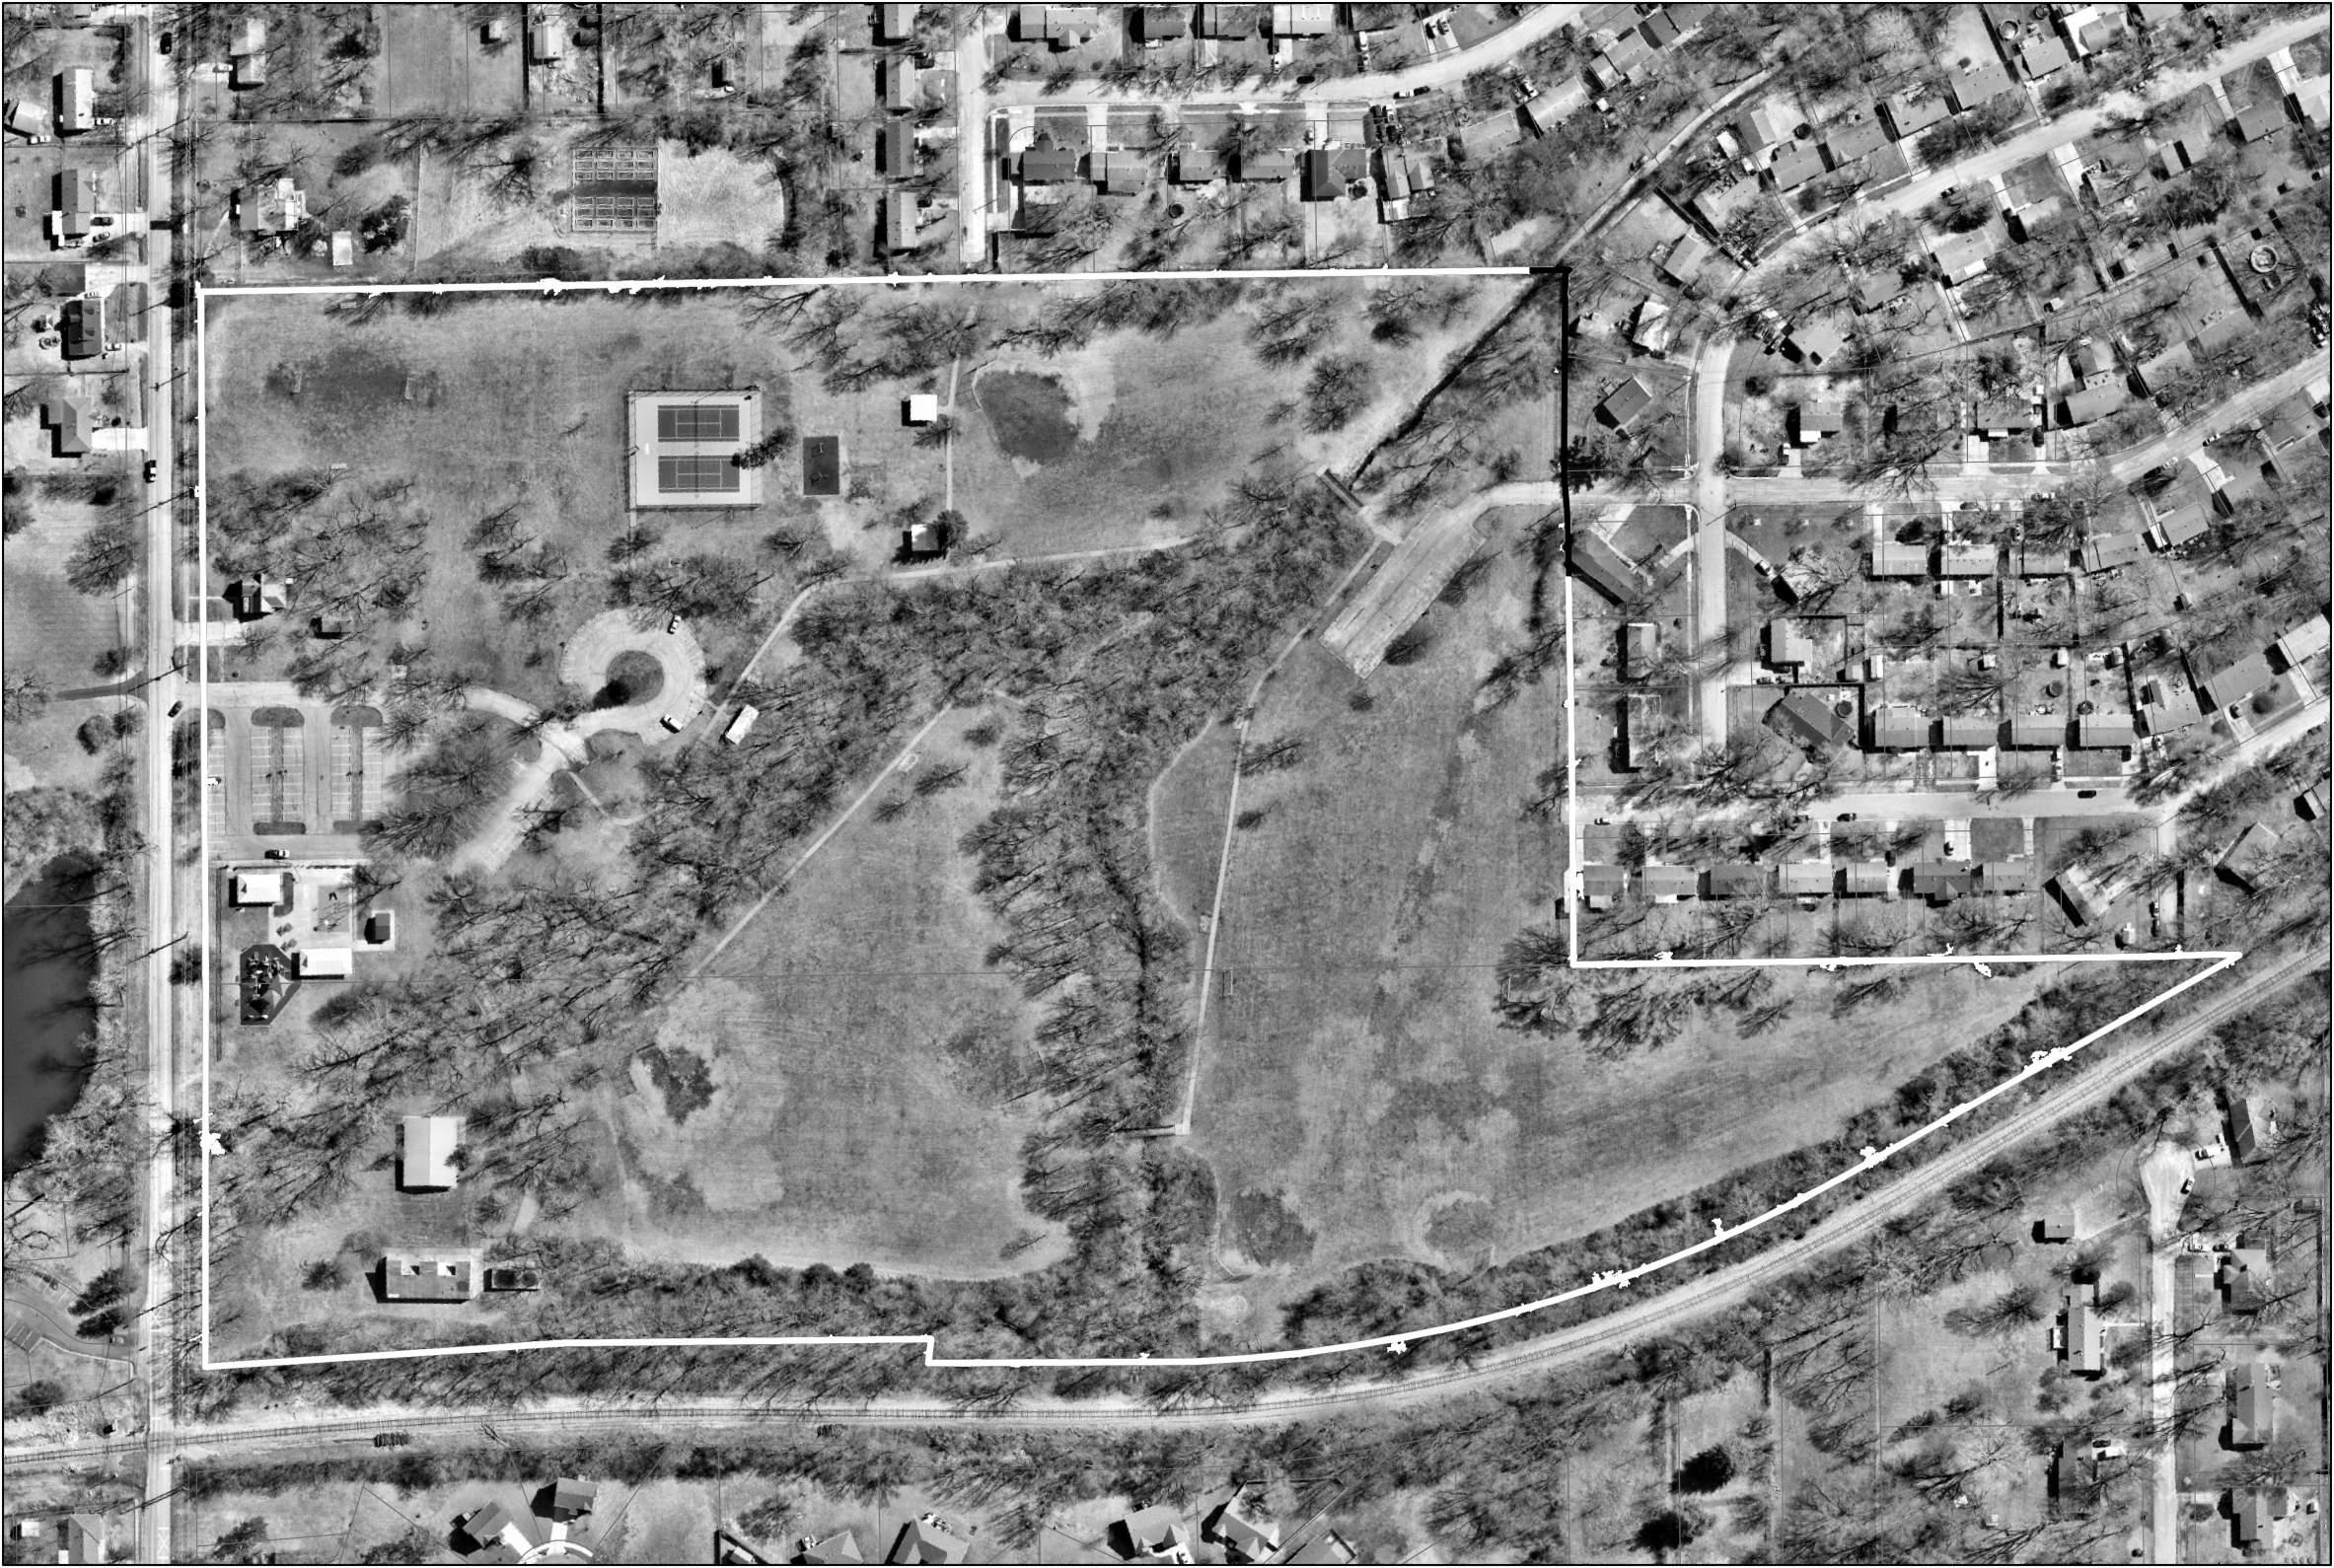
h. Add Pickleball Courts


i. Add a Sand Volleyball Court
j. Add a Medium Shelter (24'x36')
k. Add Family Games
l. Remove 2 Backstops
m. Replace or Repair Bridges
n. Shelter Repairs
E 135th ST. 10TH TERR. 11TH St. 11thTerr. 11TH TERR. E 136TH ST. Splash Pad Parking Parking Parking Tennis Sand Volleyball Court Shelter Access Drive Family Games Disc Golf Pickleball Courts Basketball Court Unprogrammed Open Green Space Baseball/Softball Soccer Baseball/ Softball
Anderson Park 1"= 140' N
John
a c c g i k j l l m m m d f h n n e n n b c
Little Corner Park
5 min
2.5 min
PUBLIC OPEN HOUSE REQUESTS:
Street lights
PARK FACTS
Location: 13424 Bennington Ave.
Park Type: Mini Park Park Size: .4 Acres
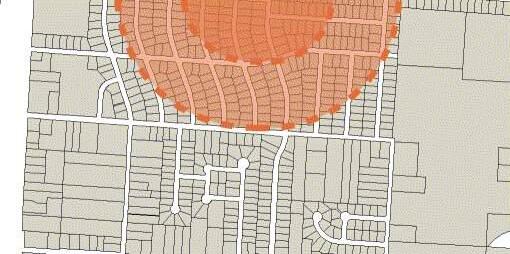
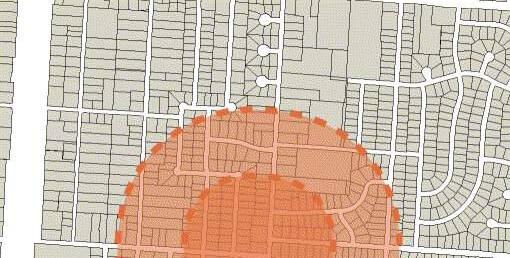
Description: Little Corner Park perfectly serves this neighborhood in Grandview. Less than half an acre, Little Corner has a full playground with surfacing, and a unique swing set.
Inventory of Amenities: Playground Picnic Area
Remove gang signs Add more swings
60
AMENITIES - AT A GLANCE

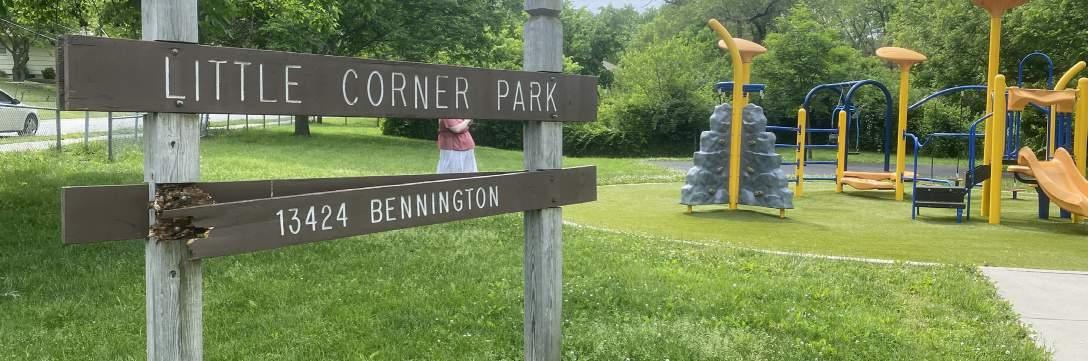
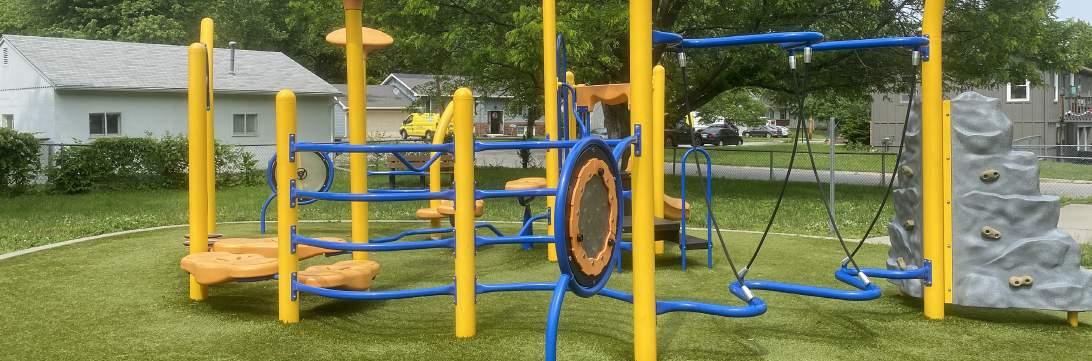
61 High Level Maintenance
LEVEL OF QUALITY
POOR
Accessibility:
FAIR GOOD
Key Issues:
• Sign is damaged.
• No ADA pathways or sidewalks on site.
Recommendations:
• Create better links between play areas.
• Consider adding some nature play elements like climbing rocks and giant logs.
The park is fairly easy to get to by car or sidewalk as it is in the middle of a residential area. There is no parking and no ADA accessible paths in the park.
Character:
Little Corner Park's character is fair with its amenities appearing well-maintained. However, there is little shade, no lighting or landscape plantings, and the only available seating is uncomfortably placed with the users back to the park entrance.
Connectivity:
Pedestrian connectivity to this park is fairly low as there are few connecting sidewalks in the neighborhood. The closest park is Meadowmere and there is a sidewalk connection to the west side of Meadowmere Park.
Usability:
This park lacks usable park features for many user goups. There are no shelters, no picnic tables, and no benches. Current amenities focus on youth ages 5-12.
Condition:
POOR FAIR GOOD POOR FAIR GOOD POOR FAIR GOOD
The limited park amenities available in Little Corner park are in fairly good condition. The main playground, turf surfacing, and concrete pad are in good condition. The surfacing beneath the swing will need to be monitored, and the entry signage and surrounding turf are in need of repair.
• Remove and relocate some of the fence line to more closely follow the stormwater channel.
• Update and add site furnishings.
• Consider adding a small shelter to increase usability.
• Replace and increase capacity of the swing set
62 High Level Maintenance
LOW MEDIUM HIGH LIMITED HIGH Opinion of Probable Costs: 104,000
PROPOSED IMPROVEMENTS:
a. Add Nature Play
b. Replace Swings
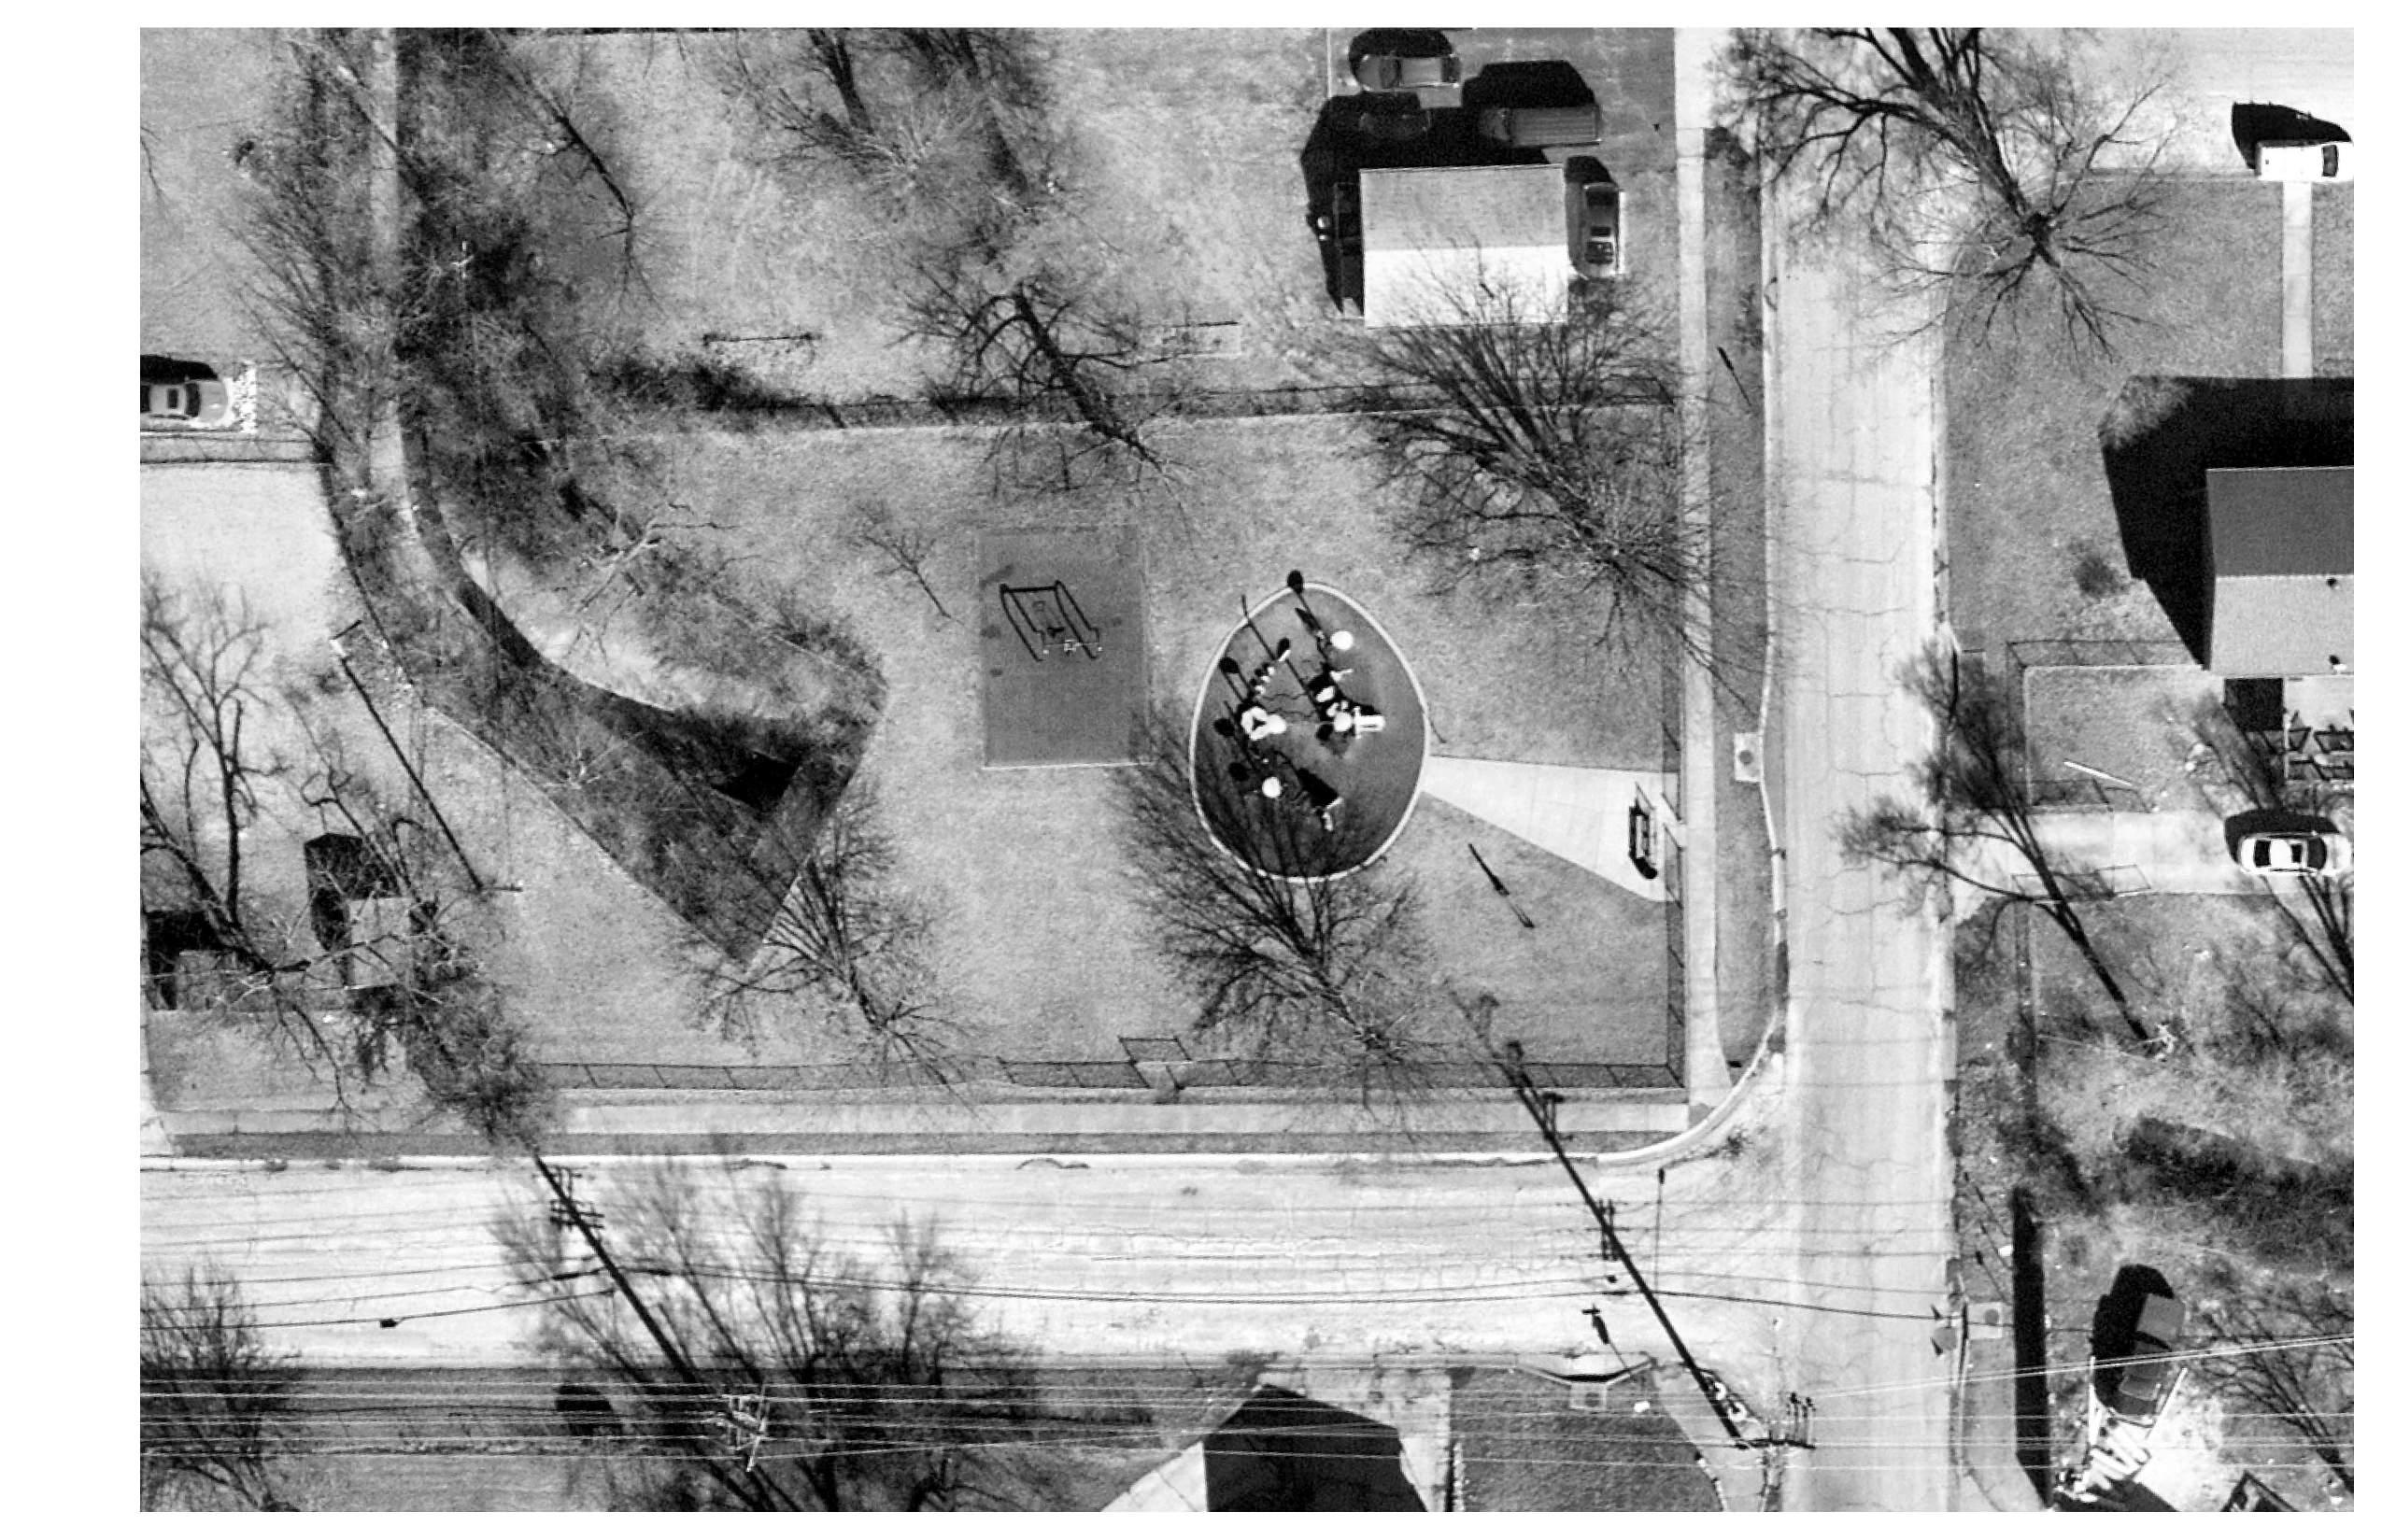
c. Add Site Furnishings


d. Replace and Relocate Entry Sign

e. Add a Small Shelter (16'x20')

E 135th ST. BENNINGTON AVE.
Playground
Fence Creek
Bench Shelter
Concrete Walk Bench
Little corner park 1"= 20' N
Swings Nature Play
a c d e b
Mapleview PARK
5 min
2.5 min
PARK FACTS
Location: 12511 Winchester Ave.
Park Type: Neighborhood Park
Park Size: 11.21 Acres
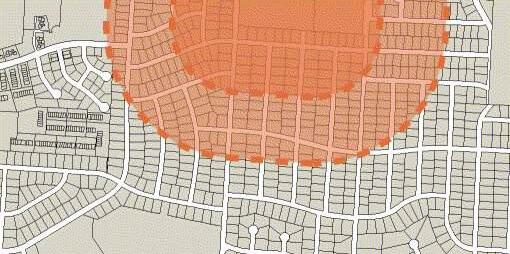
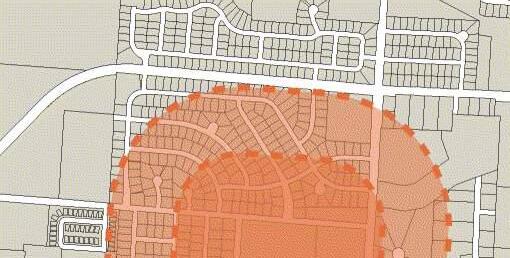
Description: Mapleview Park is a neighborhood park and is fully connected to the surrounding neighborhood with sidewalk connections. This park has a playground, inclusive play equipment, a shelter with picnic tables, open field, and a partially shaded loop trail.
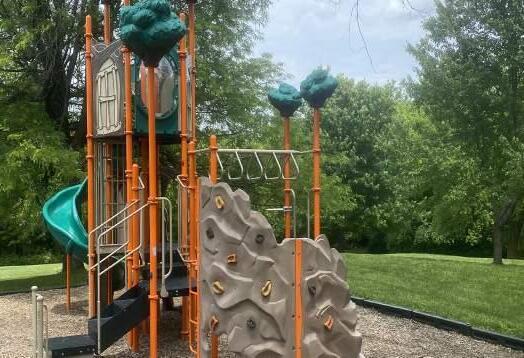
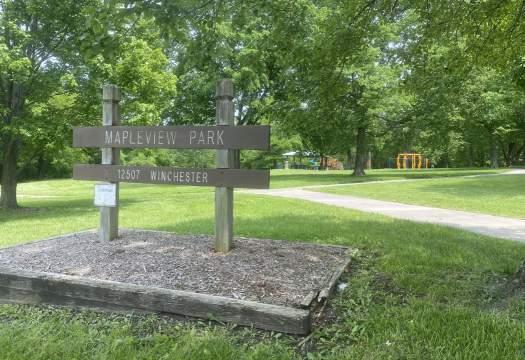
Inventory of Amenities: Playground
Picnic Area
Restrooms
Multi-purpose fields
Shelter
Walking Trail
PUBLIC OPEN HOUSE REQUESTS:
Remove electric play equipment
Add more play structures
Fitness stations
Multi-generational amenities
Addtional parking
More shelters
Swings
Trash cans
Big slide Zip line
64
AMENITIES - AT A GLANCE

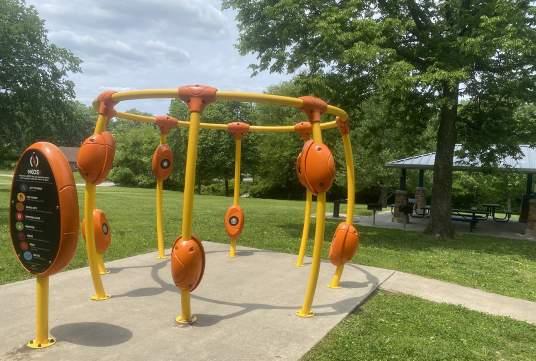
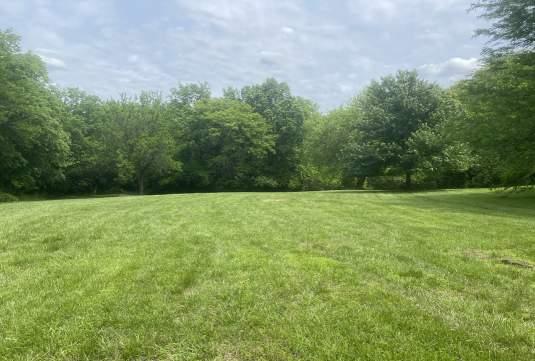
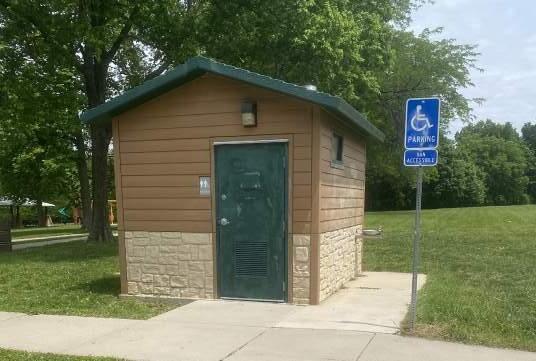
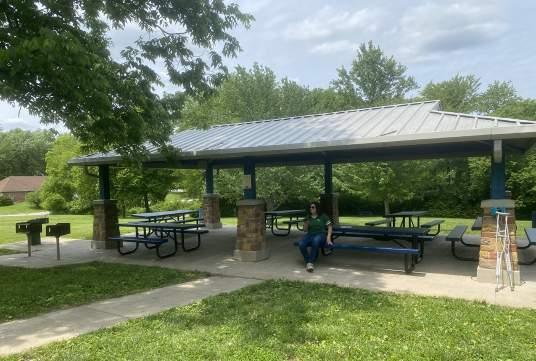
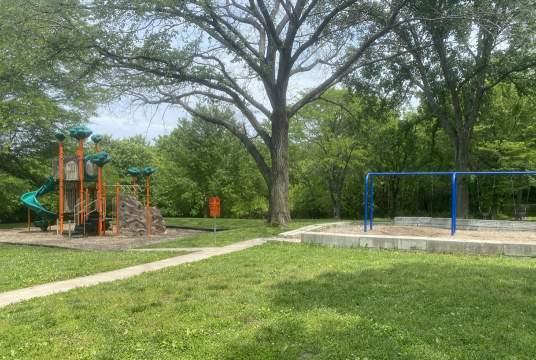
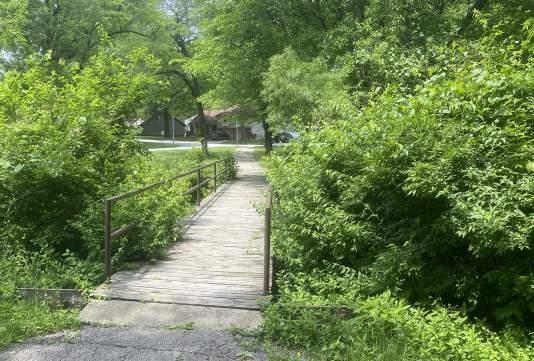
65 High Level Maintenance
LEVEL OF QUALITY
POOR
Accessibility:
The park is easy to get to by car and foot. There is one small parking lot with an ADA stall. There are several neighborhood sidewalks and a walking loop that is fairly accessible but may need updated in the next 1-3 years.
Character:
Mapleview's character is fair. A neighborhood park with some older playground equipment, an inclusive play element and a partially wooded walking loop. Mapleview Park seems well-loved by its surrounding community.
Connectivity:
Pedestrian connectivity is fairly high with sidewalk connectivity to all the surrounding neighborhoods. The closest park is Southview Park to the northwest and can be accessed with sidewalks.
Usability:
Usability for current amenities is fairly high. However, the park has several underutilized spaces. Existing amenity usability is still fairly good with centralized play equipment and a medium-sized shelter.
Condition:
Overall, the condition of amenities is fairly good with a number of aging amenities. Consider opportunities to add new or enhance existing amenities.
Key Issues:
• Loop trail asphalt is damaged and cracked.
• Limited parking.
• Park space is not fully utilized in regards to its size, neighborhood connection, and desire for multi-generational use.
• Signage is limited.
• Drainage issue off of southern entrance.
Recommendations:
• Consolidate and relocate play equipment and add new play surfacing.
• Consider adding some family games to the existing activity hub.
• Consider adding a basketball court.
• Add more benches along the loop trail.
• Repave loop path and existing parking lot.
• Consider an additional loop trail nature walk.
• Highlight neighborhood entrance by adding a parking lot and park sign to southern park entrance.
• Implement fitness stations along the walking loop to offer an additional amenity.
• Add a picnic shelter (24'x36').
• Consider adding an additional nature play area to mimic the surrounding park.
• Implement bio-retention system off possible new parking lot to limit drainage erosion.
Opinion of Probable Costs: $1,200,000
66 High Level Maintenance
FAIR POOR FAIR GOOD
POOR FAIR GOOD
GOOD
MEDIUM HIGH
HIGH
POOR FAIR GOOD
LOW
LIMITED
PROPOSED IMPROVEMENTS:

a. Update Play Equipment and Surfacing
b. Additional Southern Parking Lot
c. Picnic Shelter (24'x36')
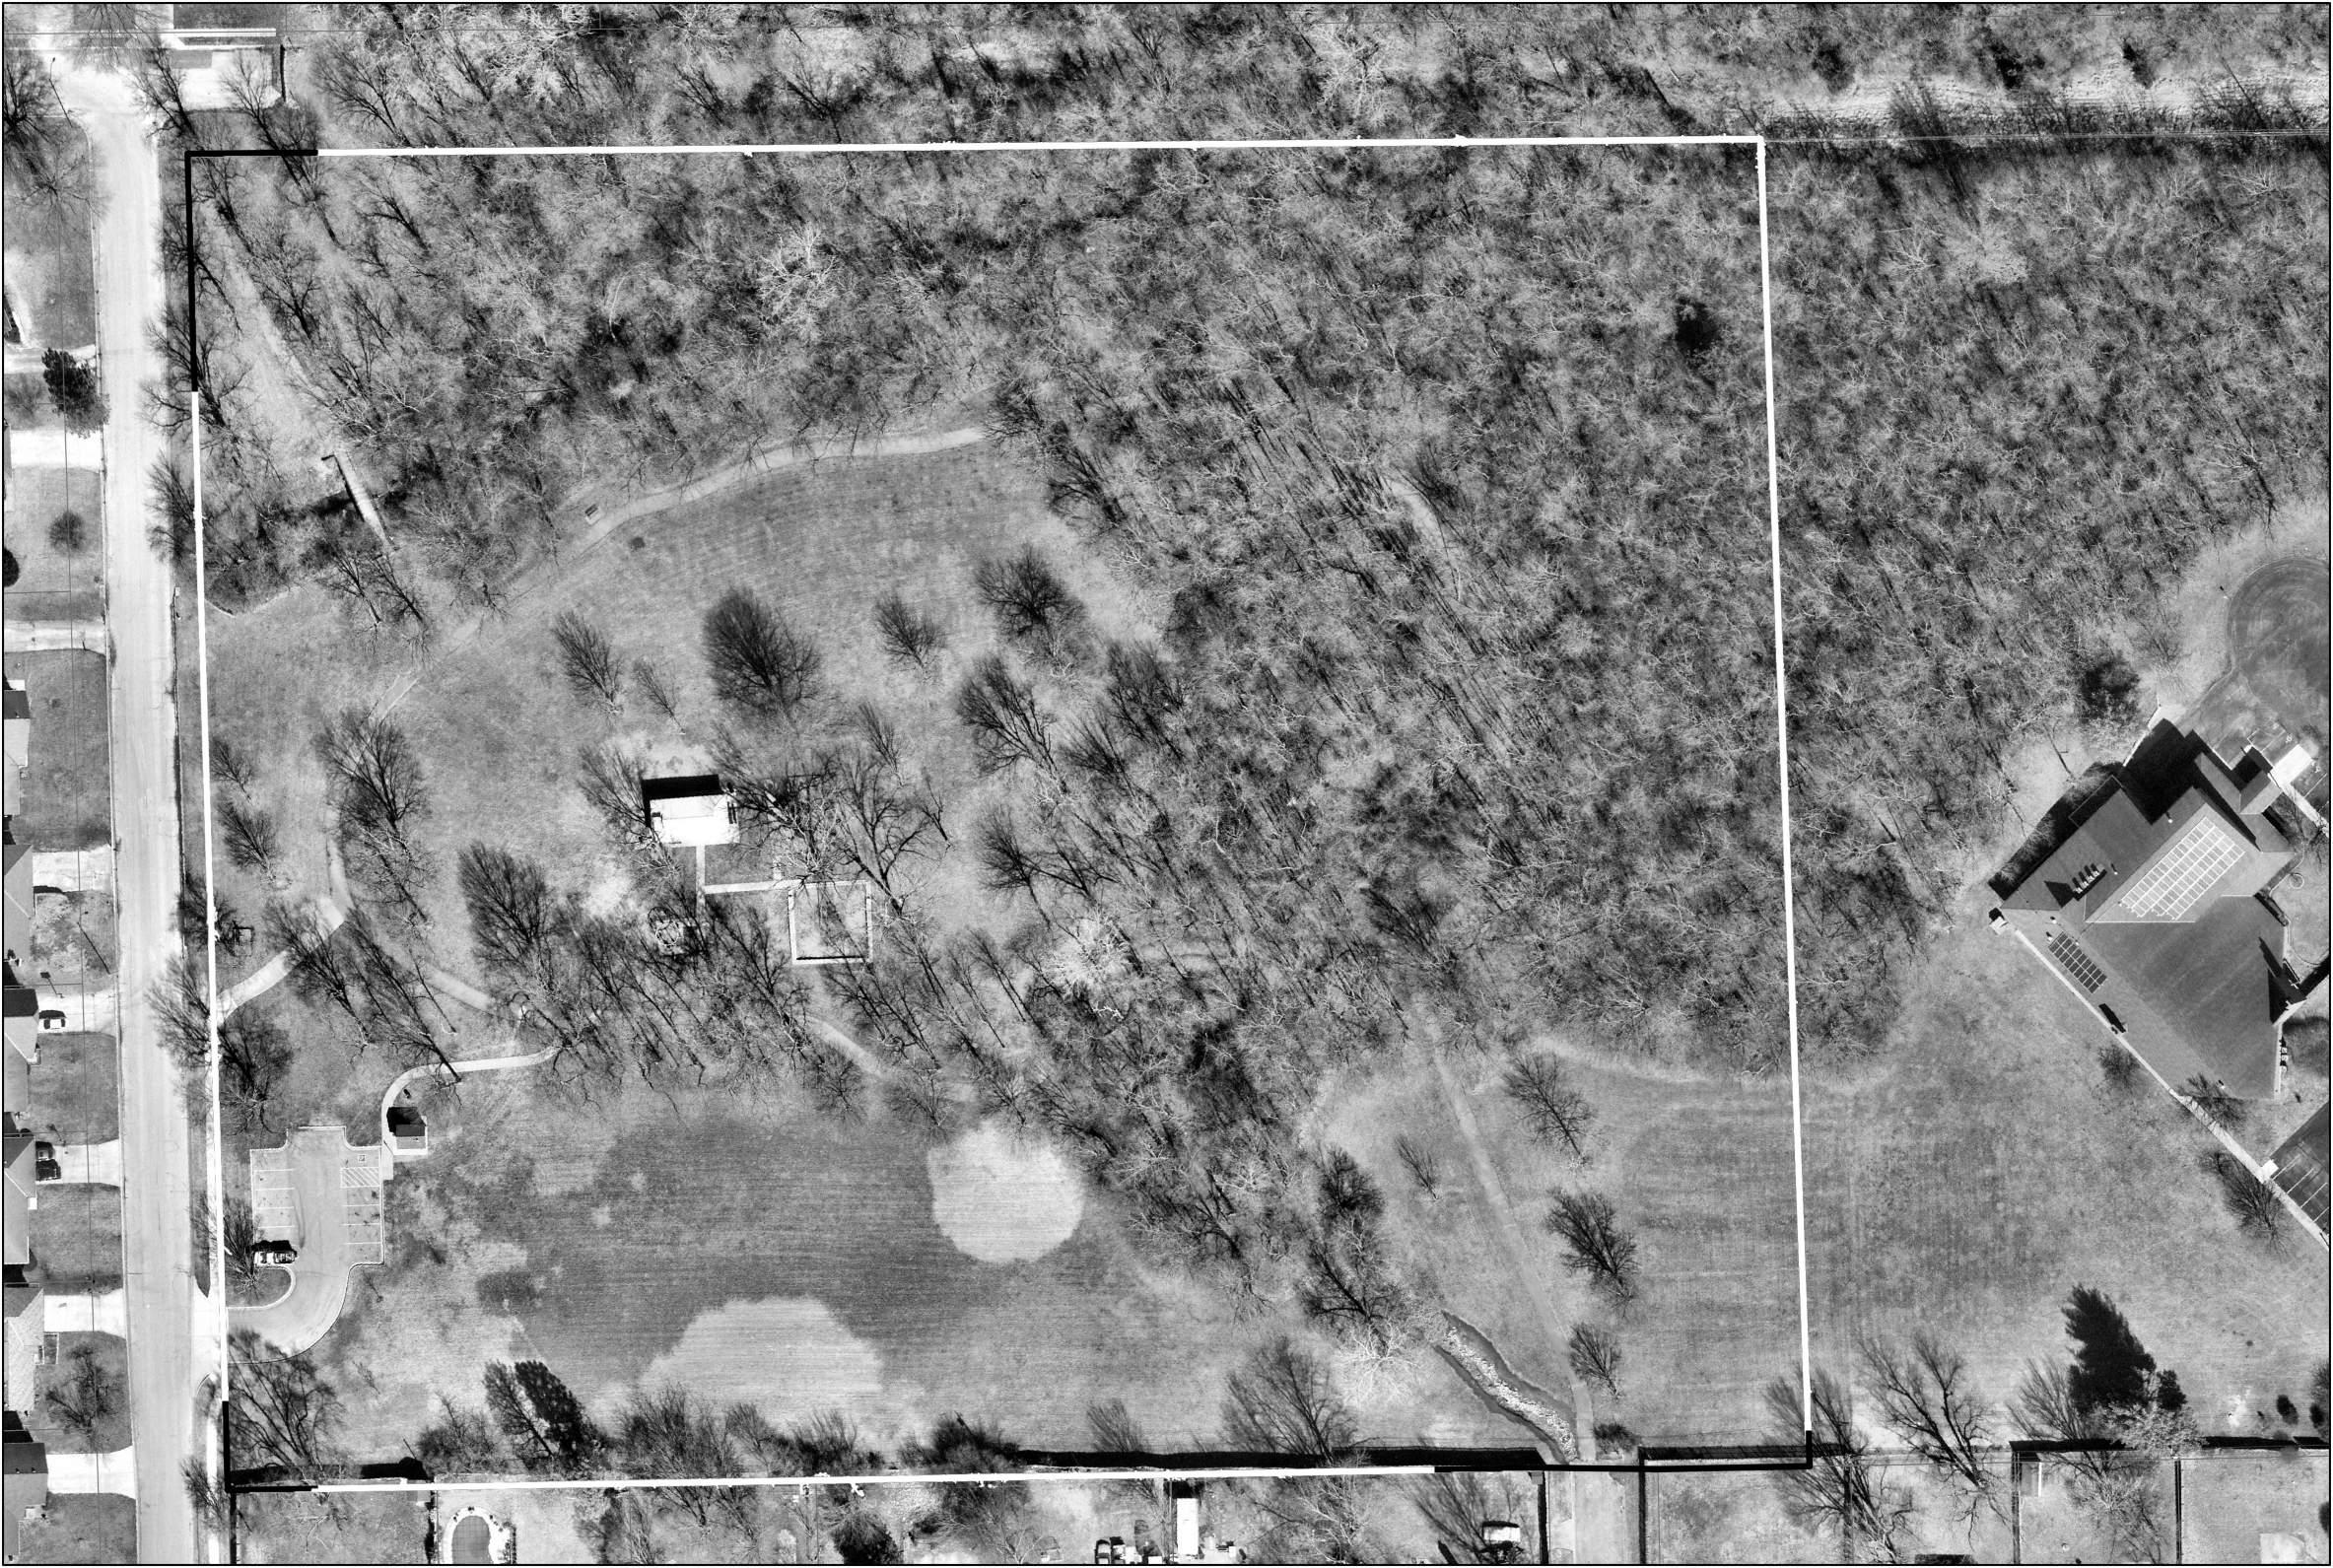
d. Add Nature Play
e. Repave Trails & Parking Lot
f. Basketball Court
g. Family Games
h. Fitness Stations
i. Additional Benches Around Loop Trail
j. Implement an Ornate Bioswale


k. Nature Trail Walking Loop

WINCHESTER AVE. Parking Parking Family Games Shelter Creek Walking Loop Playground Playground Restroom Basketball Court Fitness Stations Shelter Bioswale Bench Nature Play mapleview Park 1"= 70' N
a c g j k i b d f h e e
Meadowmere Park
PARK FACTS
Location: 13610 Byars Rd. Park Type: Community Park Park Size: 50.63 Acres
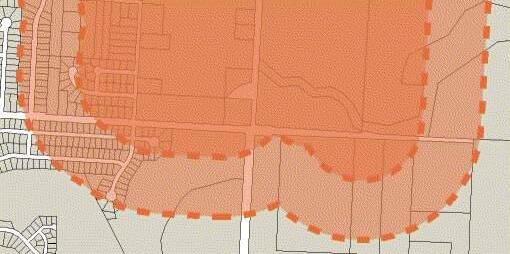
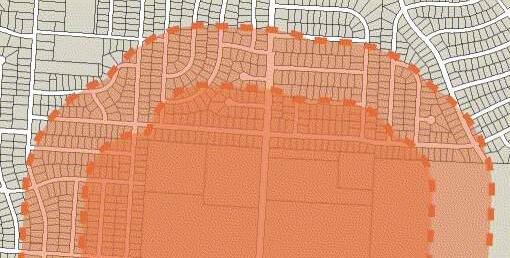
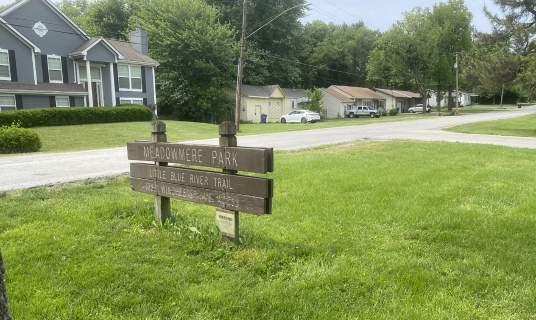
Description: Meadowmere Park is the activity hub of Grandview. The View, Grandview's Community Center lives here as well as a splash pad, a playground, walking paths, a skate park, community garden plots, an outdoor amphitheater and the Farmer's Market on Saturdays.
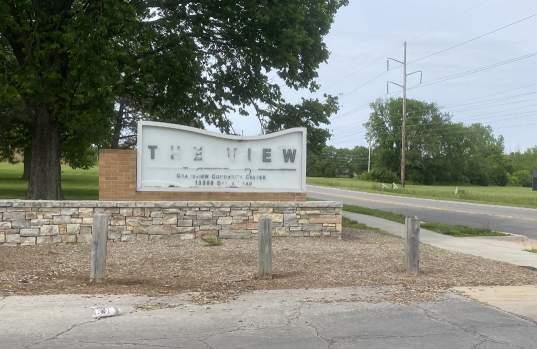
Inventory of Amenities: Community Center Playground Splash Pad Restrooms Multi-Purpose fields Skate Park
Amphitheater Trails
PUBLIC OPEN HOUSE REQUESTS:
Farmer's Market structure
Playground near amphitheater
Safety features - police call-box
E-bike station
Fitness stations
Pedestrian path lighting
Basketball court
Volleyball court
Trail addtions
Disc golf course
68
5 min 2.5 min
AMENITIES - AT A GLANCE

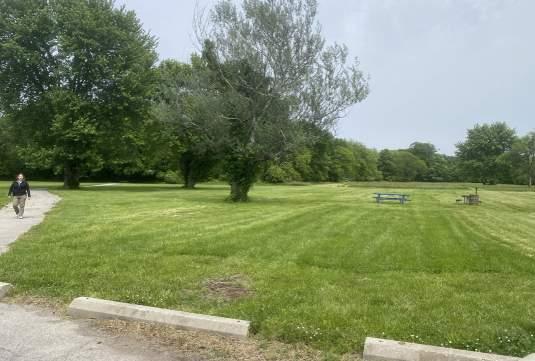
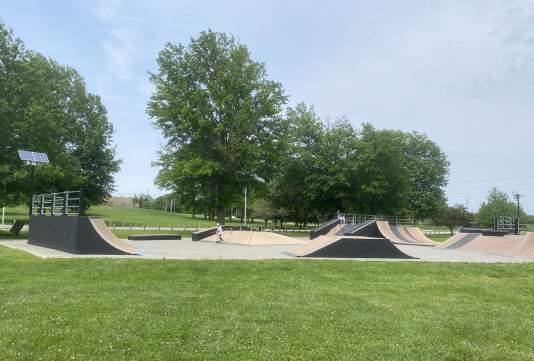
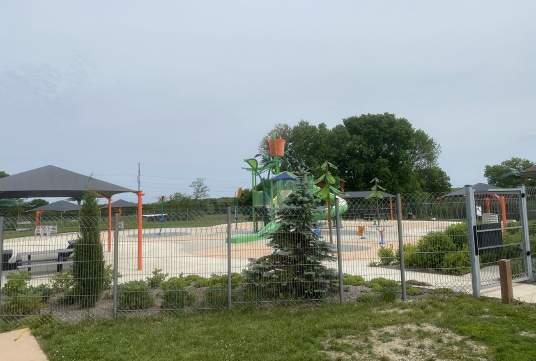
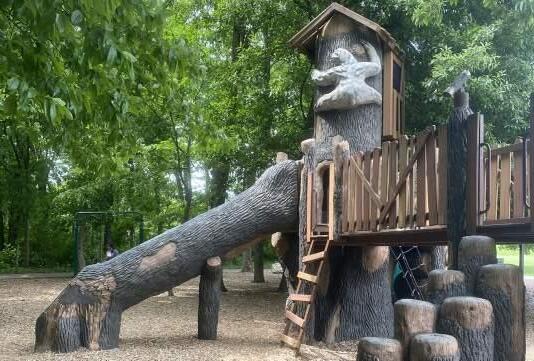
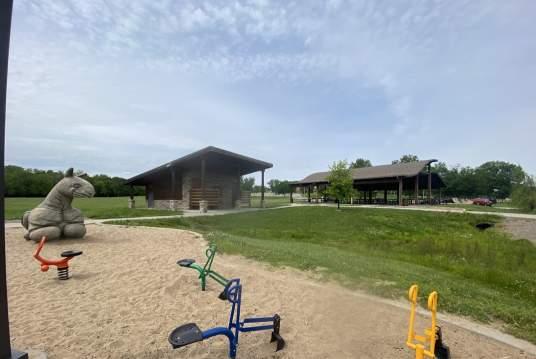
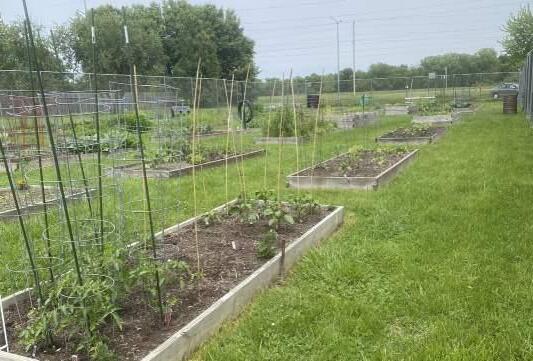
69 High Level Maintenance
LEVEL OF QUALITY
Accessibility:
The park is fairly easy to get to by car. There are several large parking lots and bike racks. Most amenities are ADA accessible. There is little visibility to the edges of this parks as it is heavily wooded throughout. Visibility is good near major amenities.
Character:
In general the character of Meadowmere Park is good with wooded paths, playgrounds, a splash pad, skate park, outdoor amphitheater, and a Community Center. Meadowmere is widely considered to be the activity hub of the community.
Connectivity:
While accessible by foot or bike by a few neighborhoods, most users drive to the park. Inner park connectivity is low with Byars road being a major barrier. Consider adding more sidewalk/trail connections to the park.
Usability:
This park is highly usable with a wide variety of amenities that cater to different age groups. Usability is increased through events, programming, and the Farmer's Market on Saturdays.
Condition:
The condition of amenities is good. Various parking lots may need replacement or paving in the next 1-3 years.
Key Issues:
Key Issues:
• Playground equipment is outdated.
• Parking lot is in need of replacement.
• Mulch surfacing is compacted and dissipating around the edges.
• Amphitheater parking lot is unpaved.
• Desire to create more usable space on the eastern half of the park.
• Creek vegetation catches debris.
Recommendations:
• Byars Road acting as an east-west barrier.
• Replace play equipment and install new safety surfacing and edging.
Recommendations:
• Clean up vegetation along creek.
• Add a 9-hole disc golf course for multigenerational play.
• Additional outdoor team sport courts close to the community center (e.g. volleyball and basketball) to lighten the load on the indoor facilities.
• Add a pedestrian crossing HAWK system.
• Add year-round Farmer's Market structure in amphitheater parking lot. This structure has potential for pickleball use during the week.
• Consider adding an e-bike station creating a new activity hub around the farmer's market.
• Long term planning project to link to Tails and Trails Dog Park
• Seed open field near amphitheater for native prairie grasses and add loop trail.
• Consider adding outdoor education programs focusing on diverse habitat.
• Add a children's play space adjacent to the amphitheater to meet additional programming needs.
Opinion of Probable Costs: $2,267,000
70 High Level Maintenance
FAIR GOOD
POOR
POOR FAIR POOR FAIR GOOD POOR FAIR GOOD POOR FAIR GOOD GOOD LOW MEDIUM HIGH LIMITED HIGH
PROPOSED IMPROVEMENTS:


a. Farmer's Market Permanent Structure
b. Paved Farmer's Market Parking Lot
c. Amphitheater Playground
d. Outdoor Basketball Courts
e. Sand Volleyball Court
f. Additional Trail Connections


g. Pedestrian Crossings (Byars Rd.)
h. E-bike Station
i. Add a Connection to Tails & Trails Dog Park
j. 9-Hole Disc Golf Course
k. Native Prairie Landscape
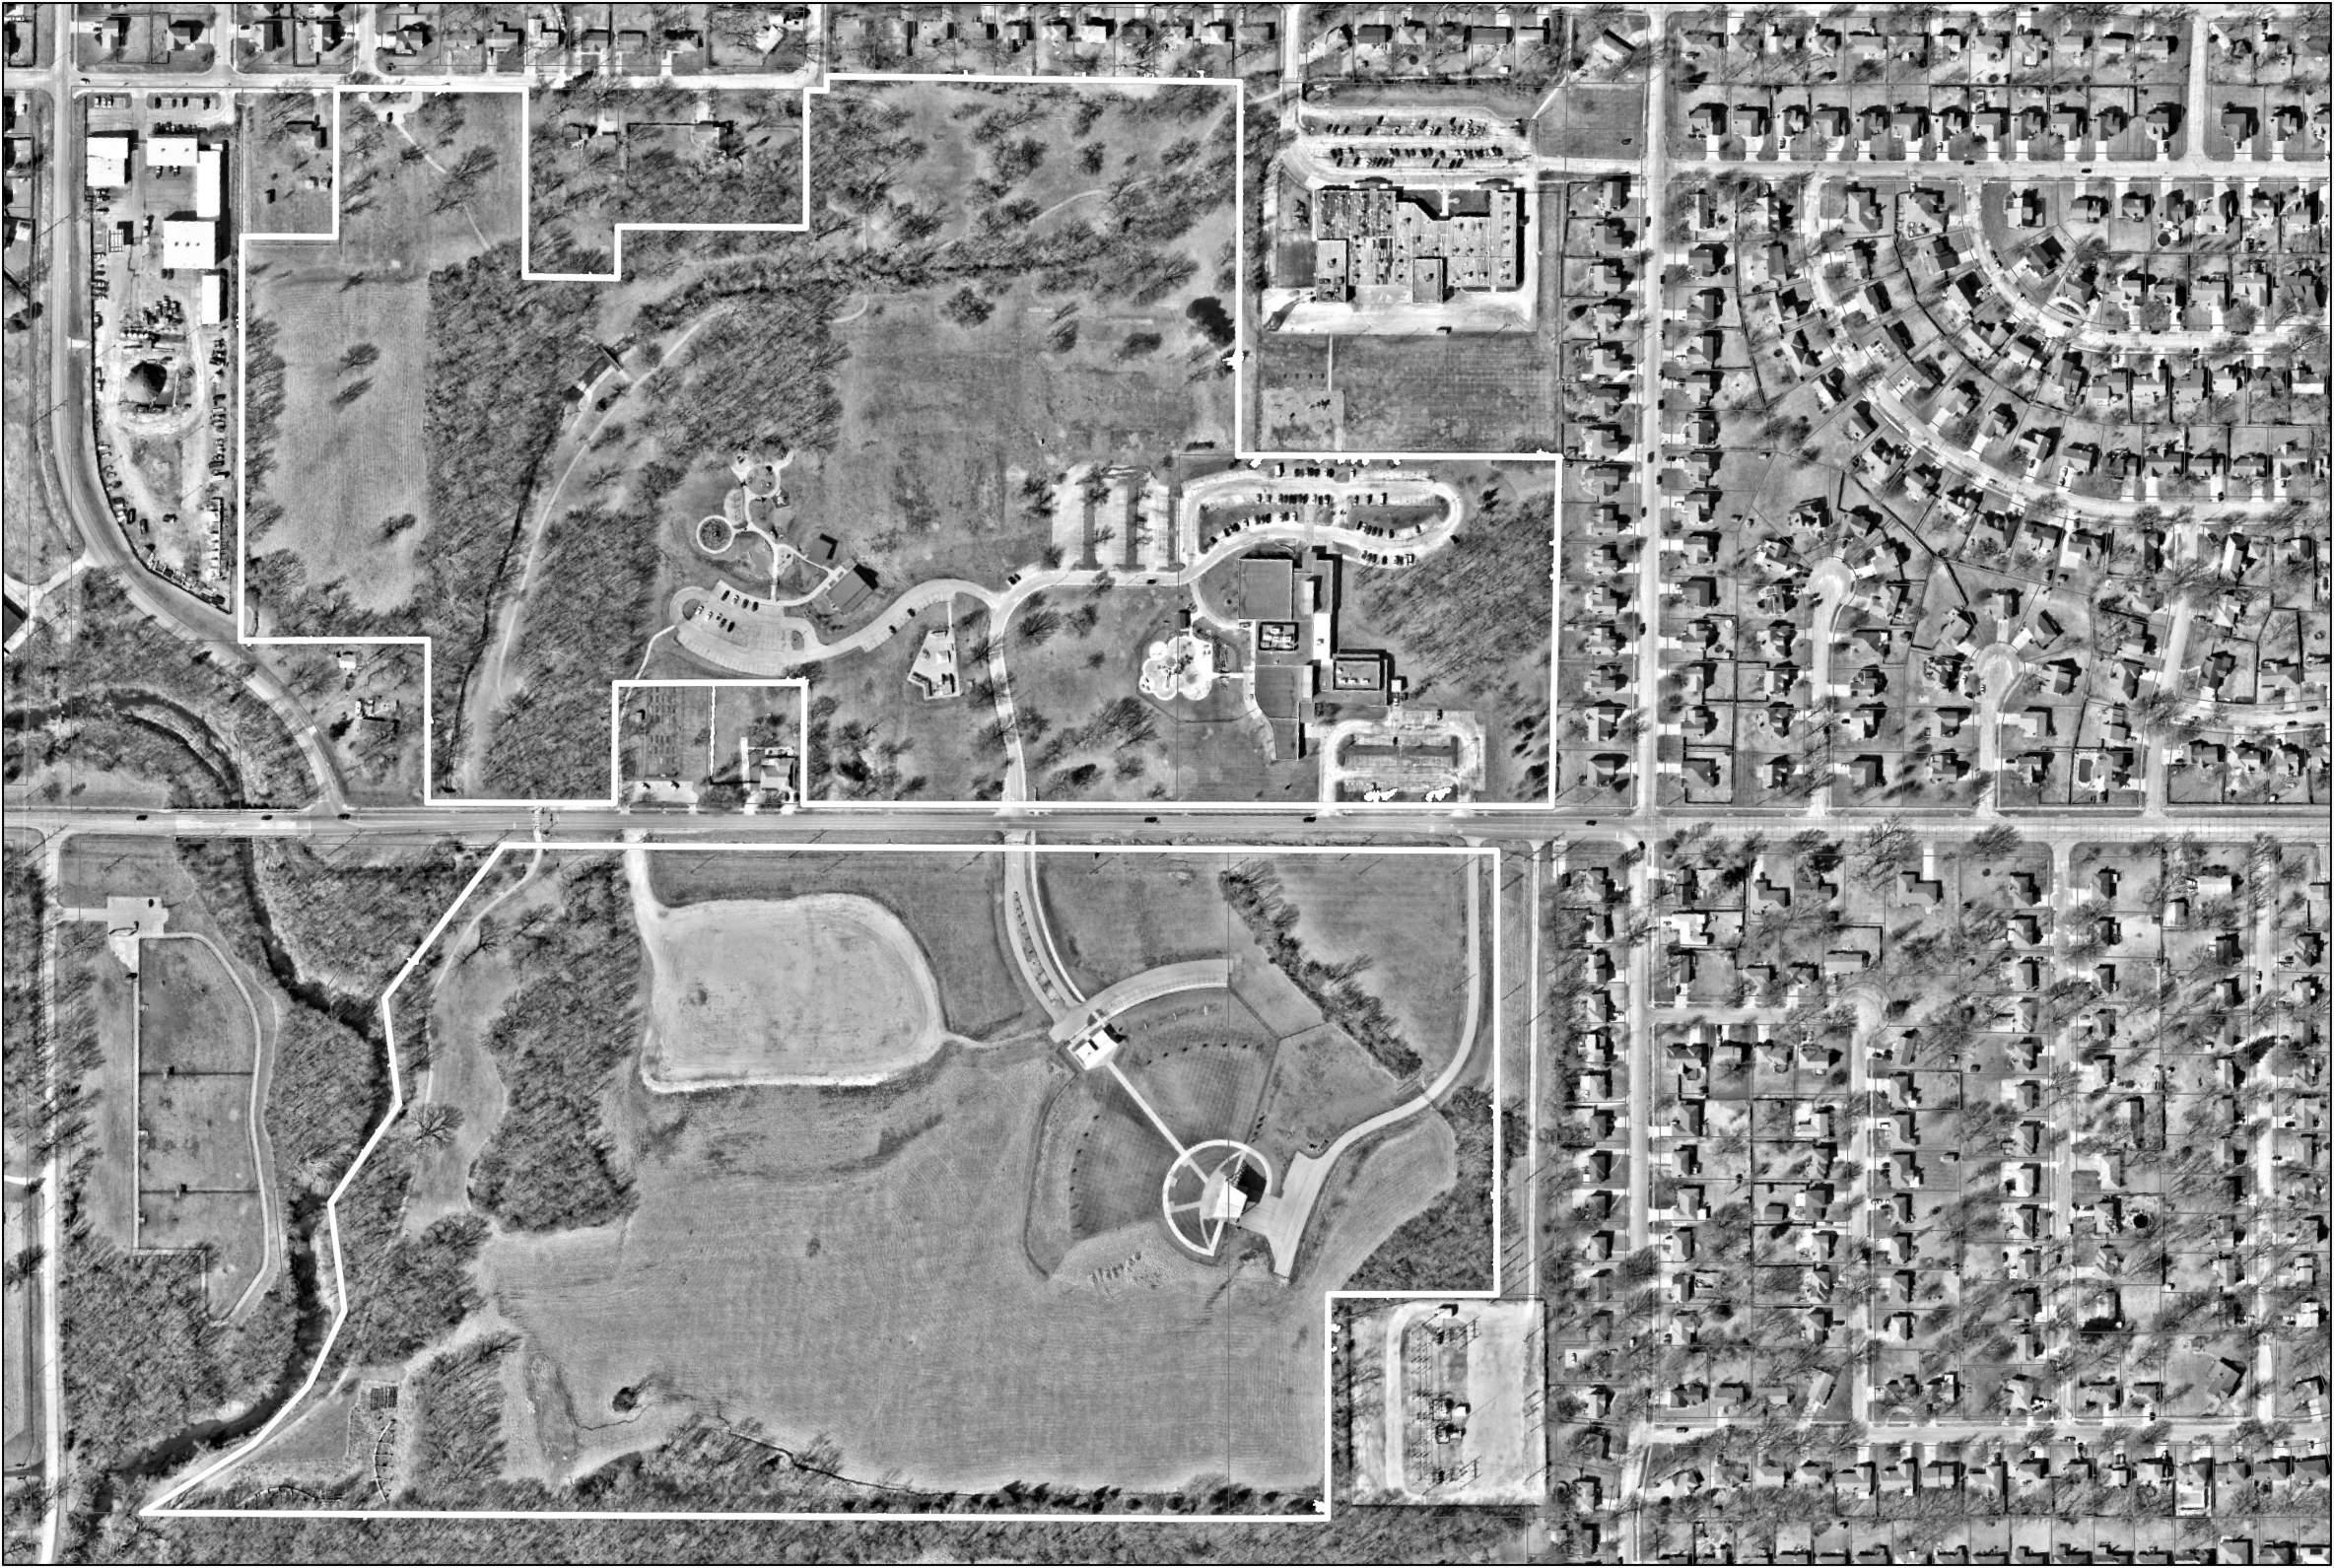
BYARS RD. WINCHESTER AVE. E 139th ST. E 139th ST. E 134th TERR. + + + + + + + + + + + + + Parking Parking Parking Parking Parking Restroom Amphitheater Splash Pad Community Center Skate Park Restroom Shelter Trails Community Garden Playground Shade Trees Disc Golf Disc Golf Farmer’s Market E-bike Station Sidewalk Connections Prairie Bridge Connection Playground Crosswalk Crosswalk Basketball Courts Volleyball Court Meadowmere Park 1"= 260' N
a c g i k b d e f h j j g
River Oaks Park
5 min
2.5 min
PARK FACTS
Location: 14620 St. Andrews Dr. Park Type: Neighborhood Park Park Size: 5.73 Acres
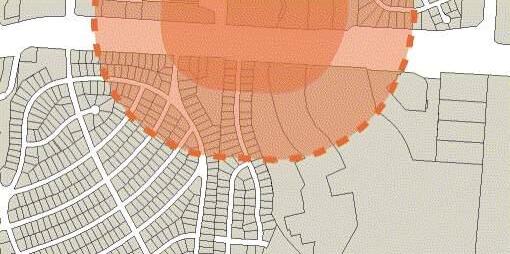
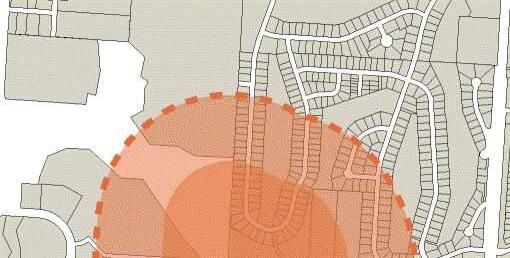
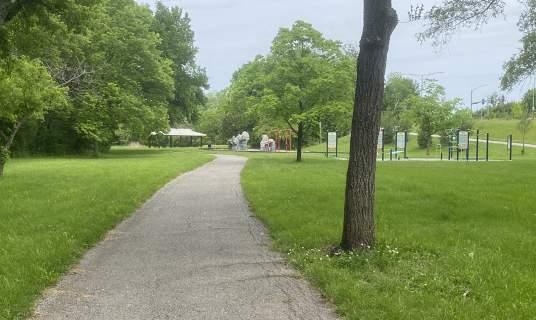
Description: River Oaks is a small neighborhood park and serves a smaller neighborhood to the south of Grandview. Amenities include a loop trail, a small shelter with picnic tables, some rock climbing structures, and fitness stations.
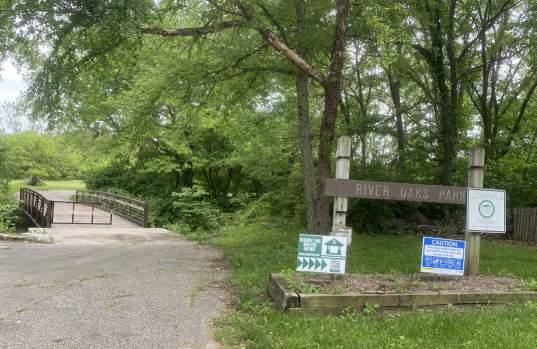
Inventory of Amenities:
Shelter
Fitness Eqipment
Picnic Area
Trail
Playground
Restrooms
PUBLIC OPEN HOUSE REQUESTS:
Lights
Clean up tunnel Basketball court
Add more play equipment
Allow tunnel graffiti
72
AMENITIES - AT A GLANCE


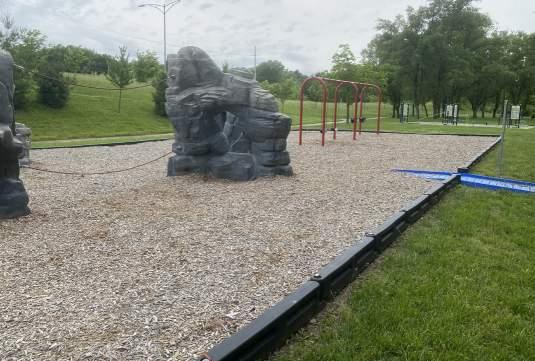
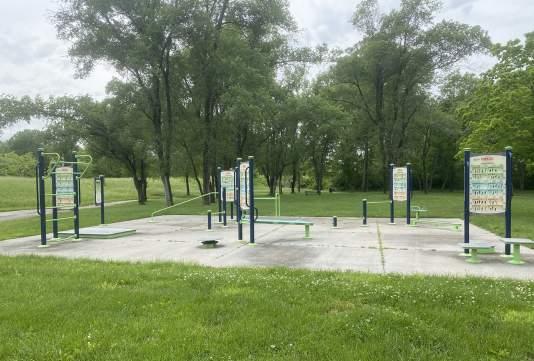
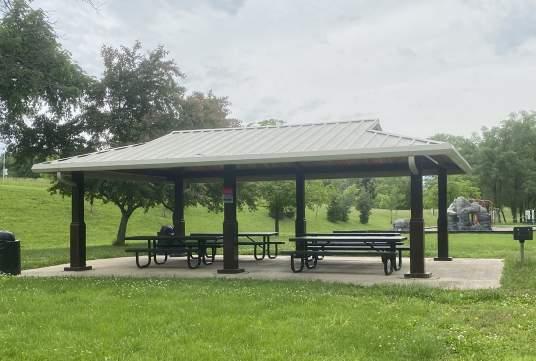
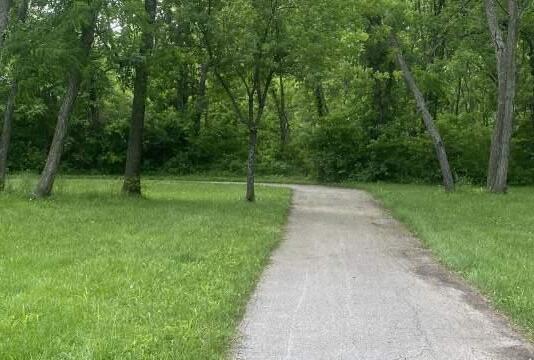
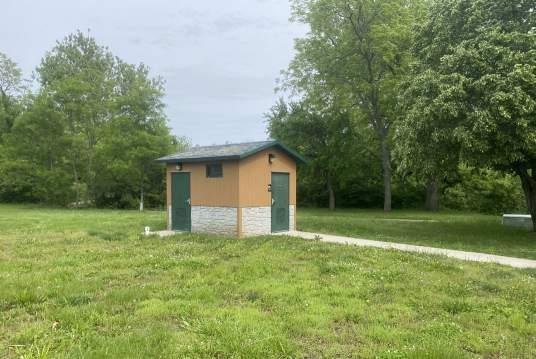
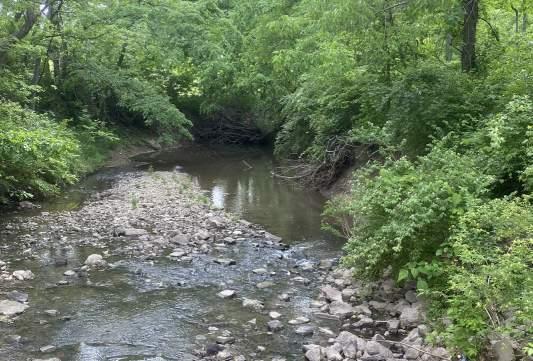
73 High Level Maintenance
LEVEL OF QUALITY
FAIR
POOR
Accessibility:
The park is difficult to get to by car and has little to no visibility from the road as there is a significant grade difference. The park entrance is hidden and has limited parking available. There is little to no ADA accessibility to park amenities.
Character:
In general the character of River Oaks Park is fairly good with a wooded loop path, riparian plantings, fitness stations, a small shelter, and a few climbing play structures.
Connectivity:
Pedestrian connectivity to River Oaks Park is fairly low. While accessible by foot or bike by a few neighborhoods, connectivity is hindered by Highway 150 and visibility of the park.
Usability:
This park is fairly usable with a variety of amenities that cater to different age groups. Usability is increased with neighborhood connections, a restroom, and a small shelter.
Condition:
The condition of amenities is fair. The shelter looks older and may need cosmetic repairs in the next 2-5 years. Mulch surfacing is fair but may benefit from replacement during playground expansion.
Key Issues:
Key Issues:
• Playground equipment is outdated.
• Park entry is not clearly defined.
• Mulch surfacing is compacted and dissipating around the edges.
• Lack of signage from major road.
• Low visibility from road.
• Creek vegetation catches debris.
• No parking.
Recommendations:
• No paved connections to park amenities like the play equipment and fitness stations.
• Replace play equipment and install new safety surfacing and edging.
• Clean up vegetation along creek.
Recommendations:
• Define park entrance more prominently with additional park sign off 146th Street.
• Consider adding paved sidewalk connections to existing amenities in park.
• Consider adding a small parking lot with an ADA stall to increase use.
• Add nature play elements and expand the playground area to incorporate the surrounding 'woodsy' feel.
• The loop trail could use repaving in the next 2-5 years.
• Add a fence to prohibit vehicle access to the rest of the park area.
74 High Level Maintenance
POOR FAIR GOOD
POOR FAIR GOOD POOR FAIR GOOD POOR FAIR GOOD GOOD LOW MEDIUM HIGH LIMITED HIGH
• Consider acquiring the adjacent vacant properties to increase parkland and possibly increase park visibility to the adjacent roads. of Probable Costs:
Opinion
$2,267,000
PROPOSED IMPROVEMENTS: a.


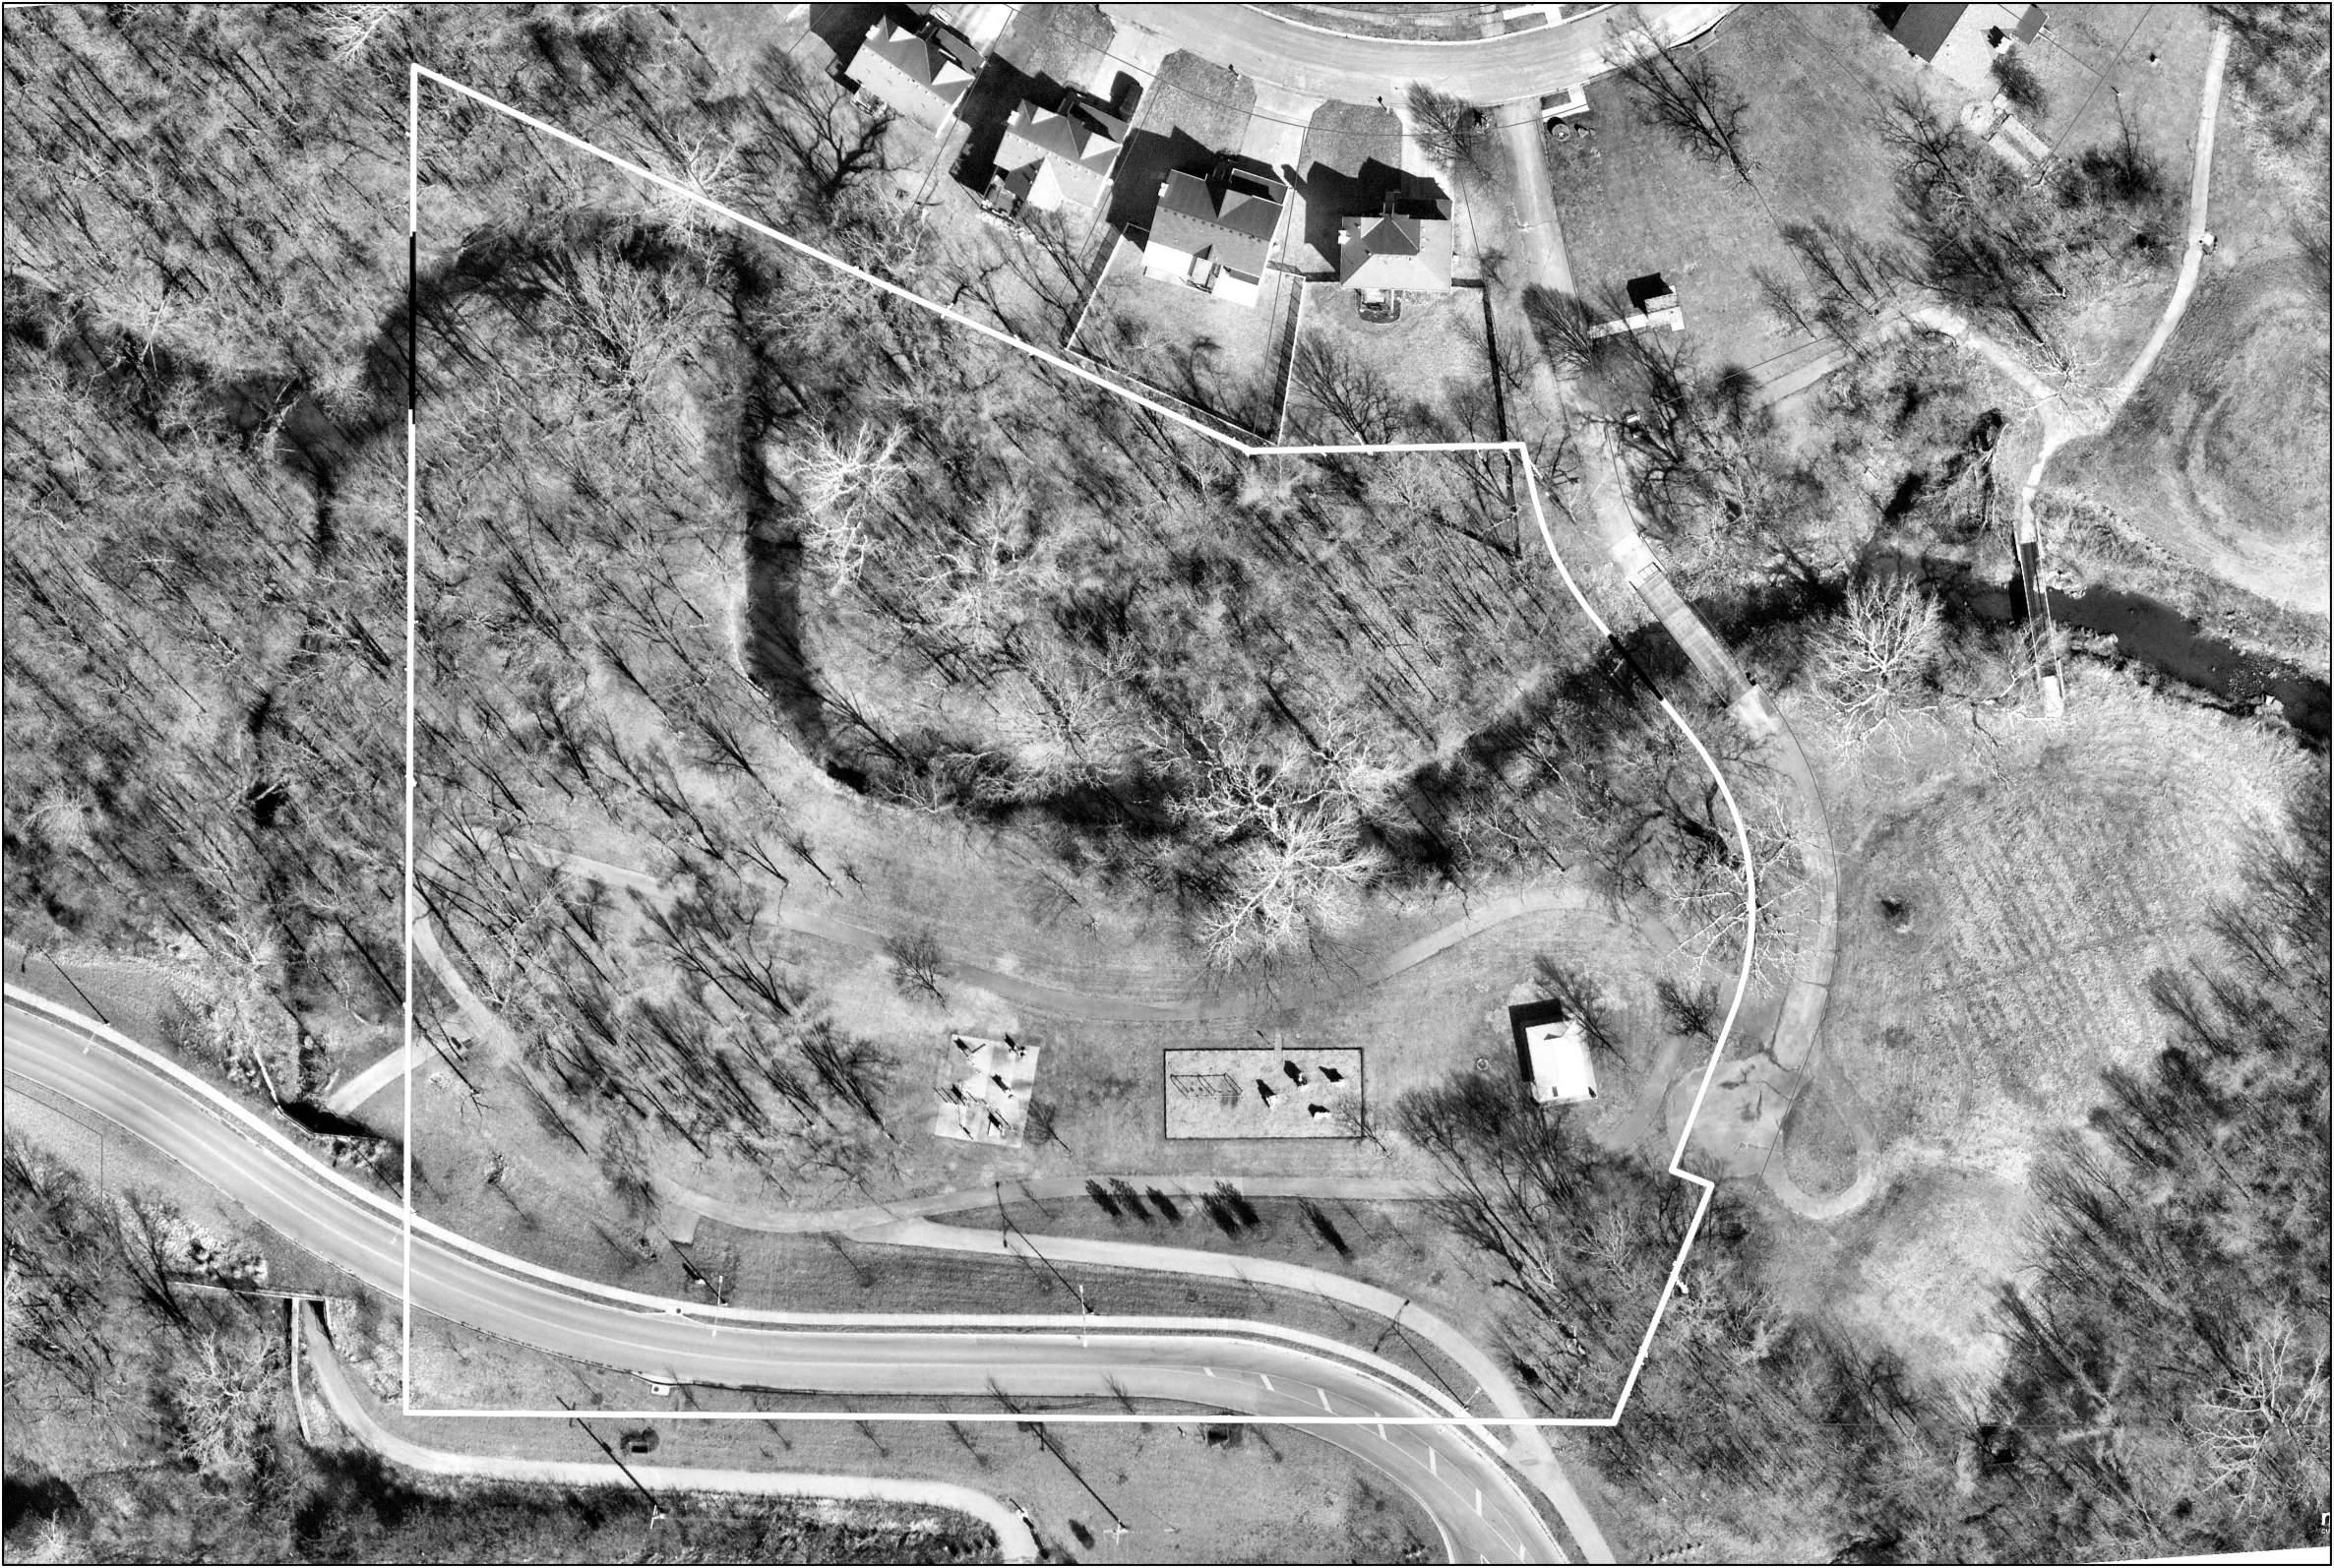
146TH ST. PARKACCESS Small Shelter Restroom Creek Playground Fitness Stations Walking Loop Parking Lot Park Sign Fence Park Sign River Oaks Park 1"= 60' N
Repave and Extend Trail Connections
Expand the Playground
Vehicular Access and Small Parking Lot d. Park Sign
Add a Fence to Buffer Vehicular Access f. Adjacent Properties Acquisition a a c b d a d f
b.
c.
e.
Shalimar Park
5 min
2.5 min
PARK FACTS
Location: 7200 E 155th St.
Park Type: Special Use Park Park Size: 15 Acres
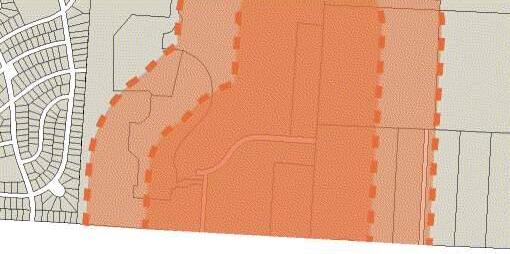
Description: Shalimar Park is one of Grandview's special use parks and acts as Grandview's premier location for league baseball and softball games. Also located here are restrooms, concessions, and all amenities for baseball and softball players and audience members like dugouts and stands.
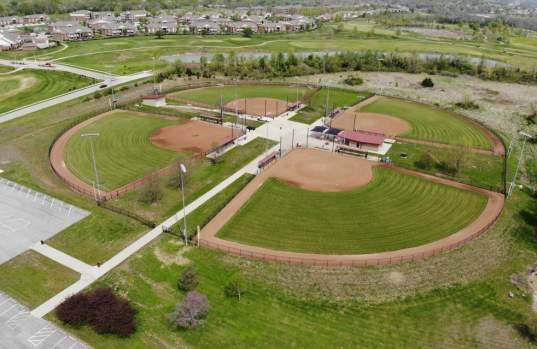
Inventory of Amenities: Baseball/Softball fields 4 Open turf Restrooms Picnic Tables
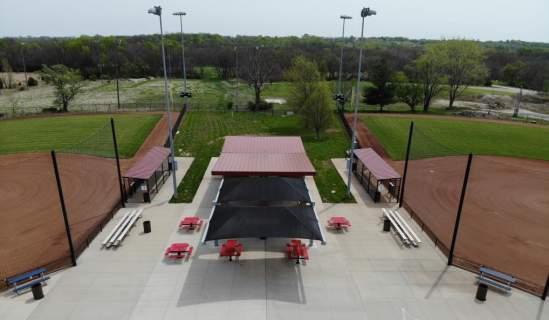
PUBLIC OPEN HOUSE REQUESTS:
Addtional large field Playground
Batting cages
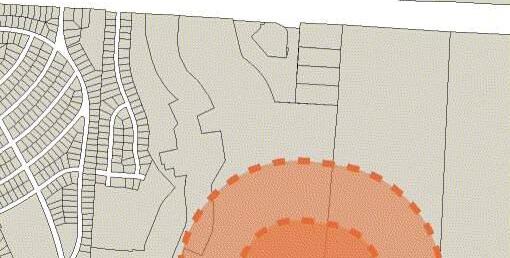
76
AMENITIES - AT A GLANCE


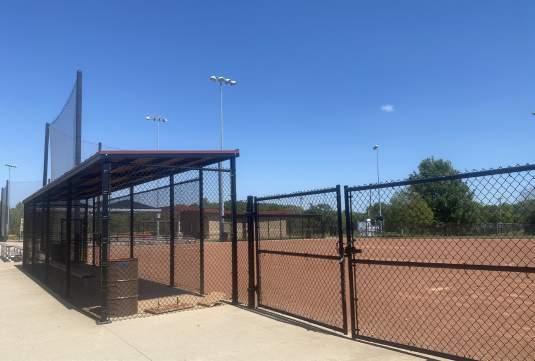
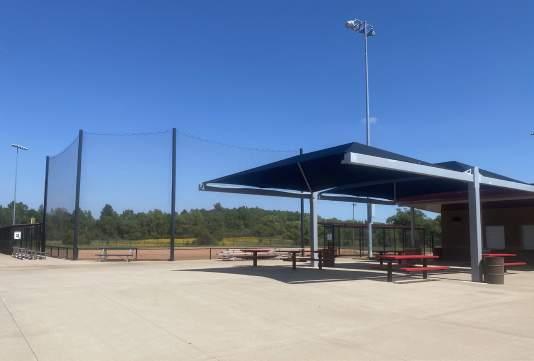
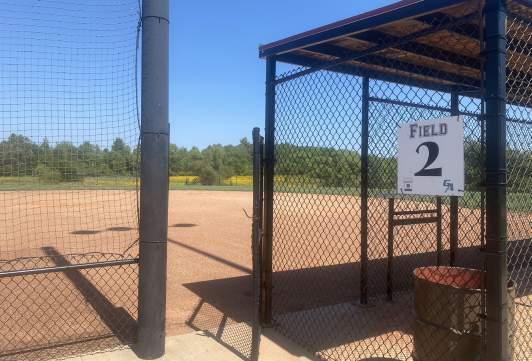
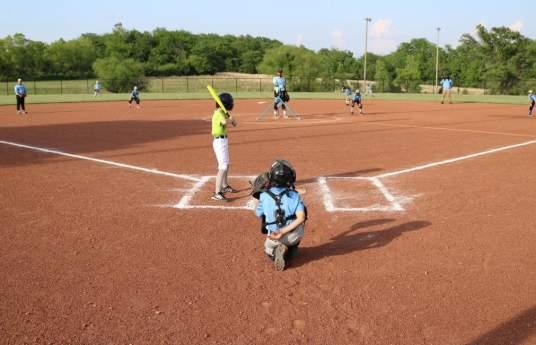
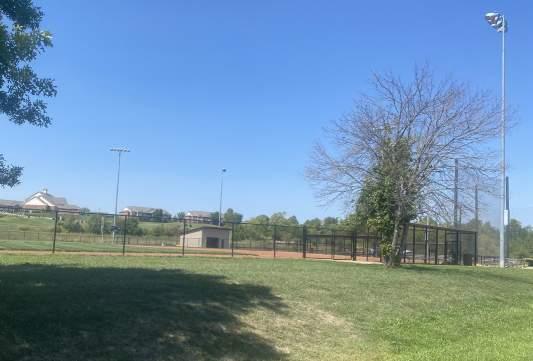
77 High Level Maintenance
LEVEL OF QUALITY
POOR
POOR
Accessibility:
Key Issues:
Key Issues:
• Lack of shade.
FAIR
FAIR GOOD
GOOD
POOR FAIR GOOD
The park is fairly easy to get to by car. the prefered mode of transportation for park users. ADA access is fair as most of the complex is paved. There is a large parking lot and good park signage.
Character:
POOR FAIR GOOD
In general the character of Shalimar Park is fairly good as it is strictly a baseball/softball complex with new amenities like shade structures, restrooms, and concessions.
Connectivity:
POOR FAIR GOOD
Pedestrian connectivity to Shalimar is poor as it is located off a major road and farther away from larger neighborhoods. Bobcat Park is the closest park and does not have connecting sidewalks between them.
Usability:
POOR FAIR GOOD
This park is fairly good in terms of usability as it has fully skinned baseball/softball infields, audience stands, dugouts, amenities, and is often used for competition leagues and championship games.
Condition:
POOR FAIR GOOD
The condition of amenities is good as they look newly renovated and well-used by its community.
• Playground equipment is outdated.
• Mulch surfacing is compacted and dissipating around the edges.
• Site is not currently utilized on eastern side.
• Parking lot may need repaving in the next 1-3 years.
• Creek vegetation catches debris.
Recommendations:
Recommendations:
• Add a small playground near existing fields.
• Replace play equipment and install new safety surfacing and edging.
• Clean up vegetation along creek.
• Consider planting trees for shade and beautification.
• Build one additional new baseball field with lighting and irrigation. The space will accommodate a field size up to 300' foul lines.
• Consider adding batting cages. Start with 5 (one for each field) and allow room to expand if demand warrants.
• There is room to accommodate up to 2 regulation size soccer fields (225'x360'). Consider grading to accommodate the space requirements for both fields. This will allow use by multiple league age groups at one time.
• Add connecting sidewalks to new amenities.
• Consider improving edge treatments by installing a split-rail fence along the east, south, and west property lines.
• With significant use the parking lot will need to be repaved in the next 1-3 years. Extend parking lots to accommodate the new programming.
• Continue to preserve the natural prairie grasses and wildflowers area north of the ball fields and add simple nature trails through it.
Opinion of Probable Costs: $2,165,000
78 High Level Maintenance
PROPOSED IMPROVEMENTS:


a. Baseball/Softball Field
b. Soccer Fields (225'x360')
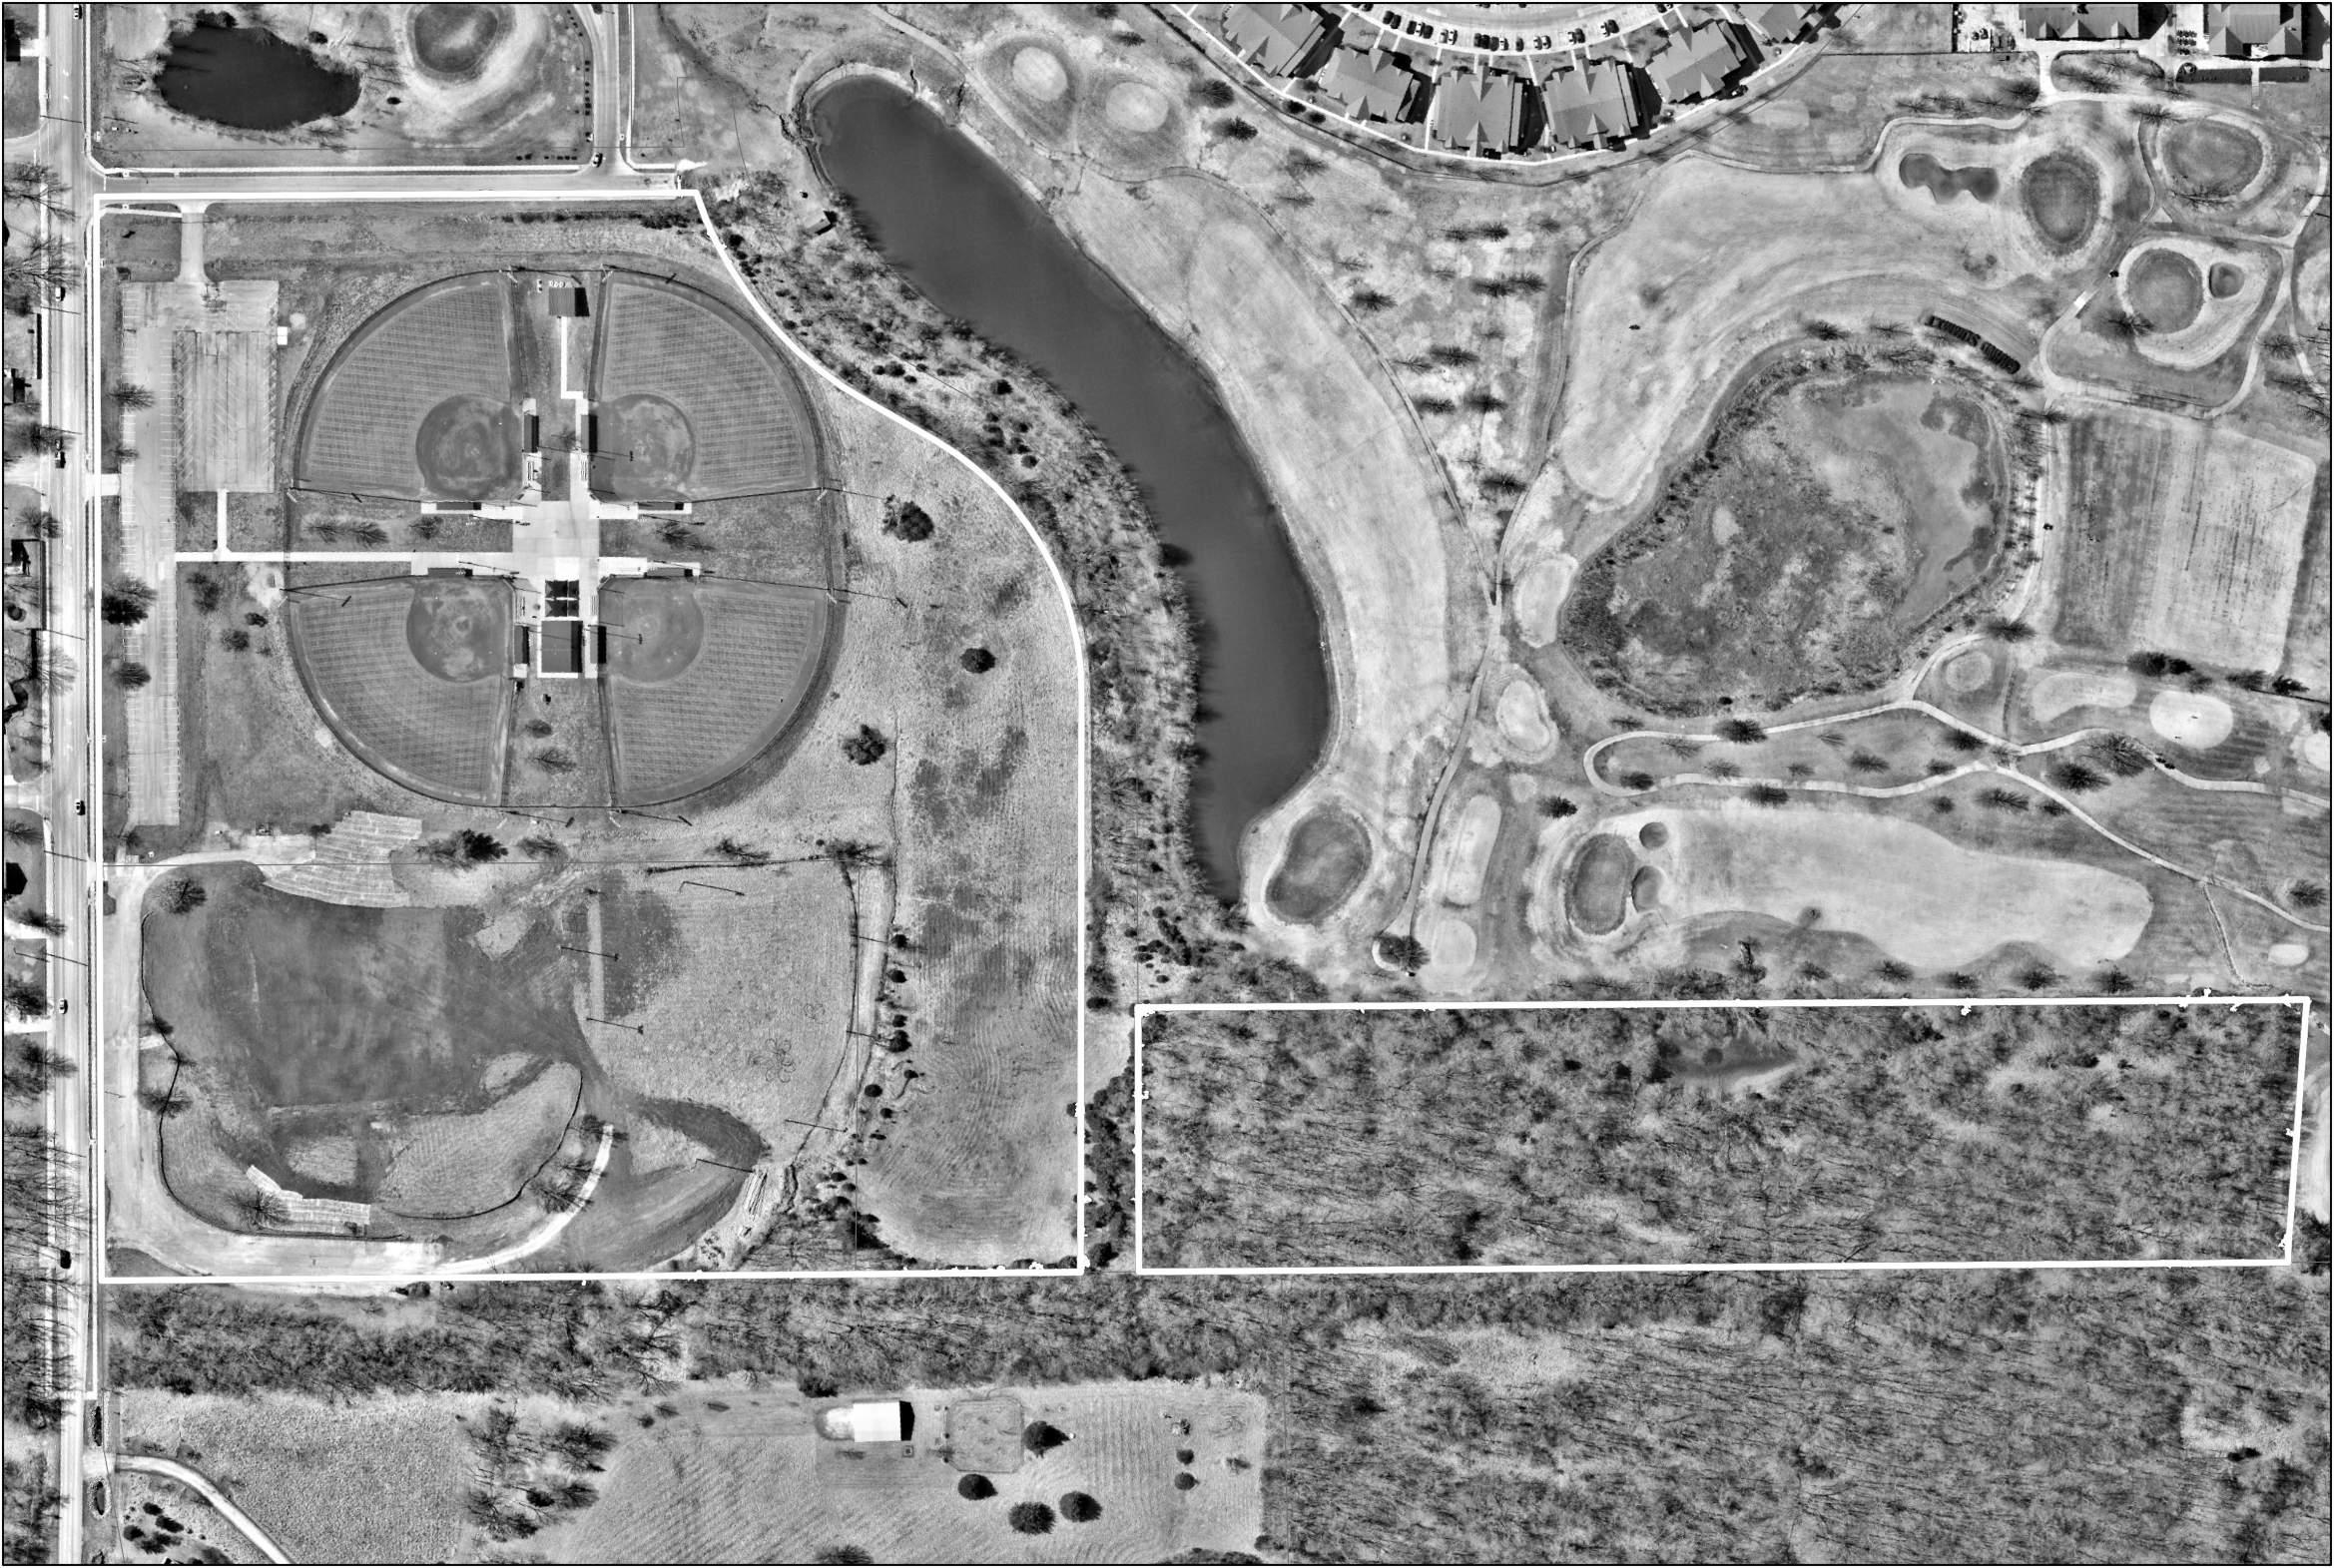
c. Small Playground
d. Outdoor Batting Cages
e. Loop Trail
f. Native Prairie


g. Parking Lot Extension
h. Extend Fencing
i. Nature Loop Trails
E 155th ST. CORRINGTON AVE. + + + + + + + + + + + + + + + + + + + + + + + + + + + + + + + + Parking Baseball/ Softball Soccer Soccer Parking Batting Cages Playground Fence Loop Trail Loop Trail Woodland Preservation Prairie Shalimar Park 1"= 160' N
a c g e i b b d f h
Shooting range
5 min
2.5 min
PARK FACTS
Location: 13116 Arrington Rd. Park Type: Special Use Park Park Size: 14.7
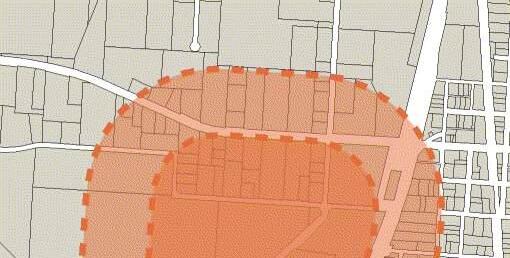
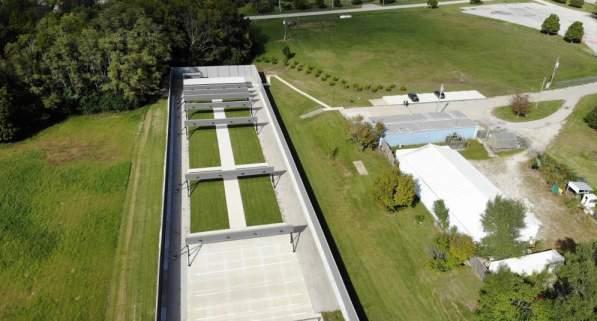
Description: This park contains the city's brand new shooting range for fire arms and archery equipment. An old archery range and ballfield can also be found here. This shooting range is open for use to the public and is the home range for the Grandview Police department and the Honeywell Security company.
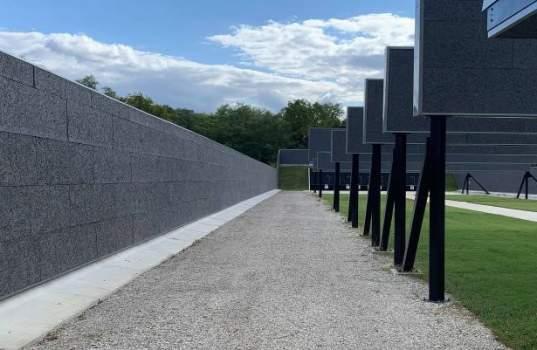
Inventory of Amenities: Shooting range Ballfield Parking lot
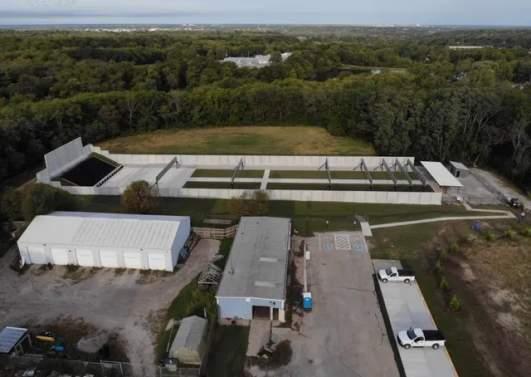
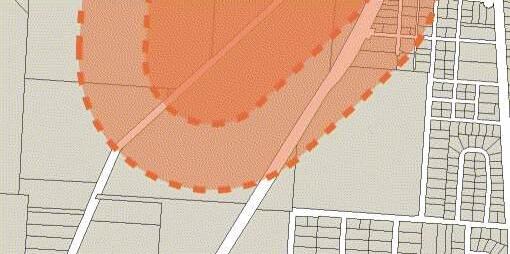
80
AMENITIES - AT A GLANCE
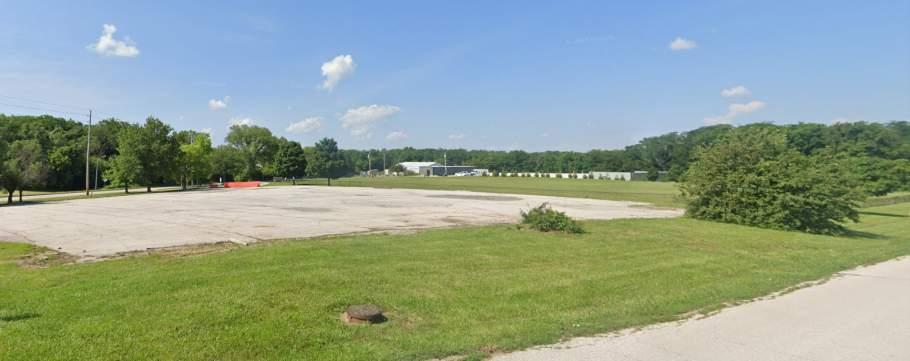
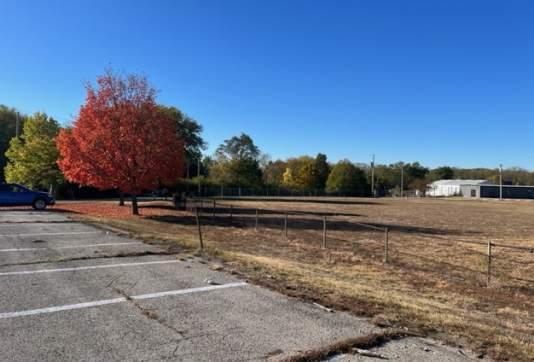
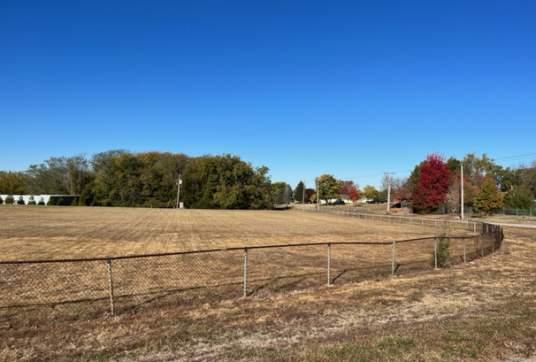
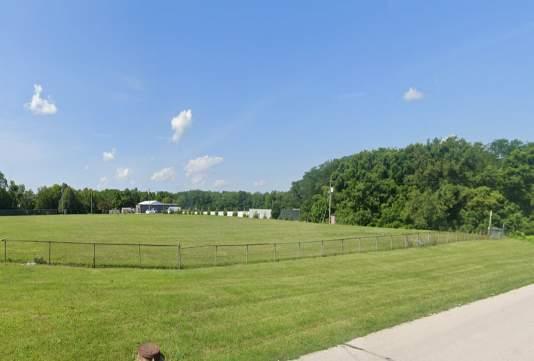
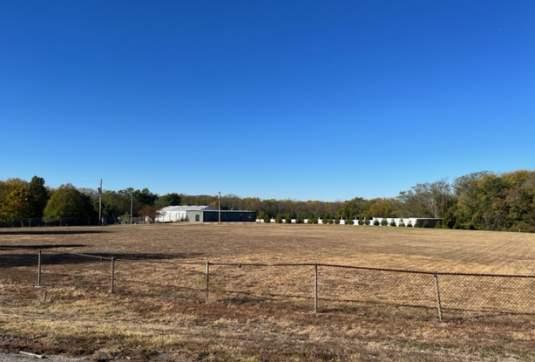
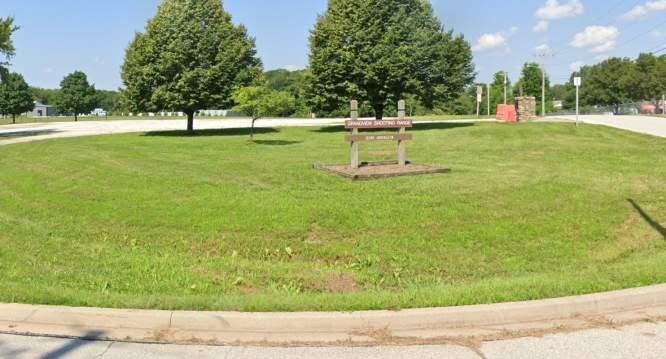
81 High Level Maintenance
LEVEL OF QUALITY
POOR
POOR
Accessibility:
FAIR
FAIR GOOD
POOR FAIR GOOD
This park is in a fairly industrial part of town and is not easily accessible by pedestrians. There is no designated ADA parking. All amenities have paved connections and accommodates users of all abilities.
Character:
POOR FAIR GOOD
As the actual shooting range itself is tucked into the landscape to buffer sound, the park has very little character visible from the road. Appears well-maintained but lacks any interesting views or landscaping.
Connectivity:
Connectivity is low as it is almost exclusively accessed by vehicle and is not surrounded by any neighborhoods or other points of interest.
Usability:
Usability is pretty limited as it is mostly a singular-use park. Usability of the eastern half of the park could be increased if additional amenities were installed in the baseball field or a loop trail was added.
Condition:
Condition of amenities are fairly good as the shooting range was built in the last 10 years. Amenities include a small shelter and a few picnic tables in fairly new condition.
Key Issues:
Key Issues:
• Playground equipment is outdated.
• Mulch surfacing is compacted and dissipating around the edges.
• Creek vegetation catches debris.
• This is a unique special use park that has an underutilized area where a baseball field was once. Given the nature of shooting ranges and loud sudden bursts of sound, compatible park uses are challenging.
Recommendations:
• The existing parking lot near Robinson Pike Road needs resurfacing.
• Replace play equipment and install new safety surfacing and edging.
• Clean up vegetation along creek.
Recommendations:
• Consider creating a showcase native pollinator garden with wildflowers, shrubs, and grasses. This may be a phased effort over time to achieve the footprint shown.
• Creat a paved loop trail around the native area and more natural paths throught it.
• Consider adding a picnic shelter and drinking fountain.
• Consider adding an archery range next to the gun range.
• Resurface the parking lot. Consider reducing it's size and adding green solutions to manage stormwater runoff.
Opinion of Probable Costs: $1,119,500
82 High Level Maintenance
POOR FAIR GOOD GOOD LOW MEDIUM HIGH LIMITED HIGH
PROPOSED IMPROVEMENTS:
a. Showcase Native Pollinator Garden.
b. Paved Loop Trail.
c. Parking Lot Resurfacing & Green Solutions
d. Archery Range
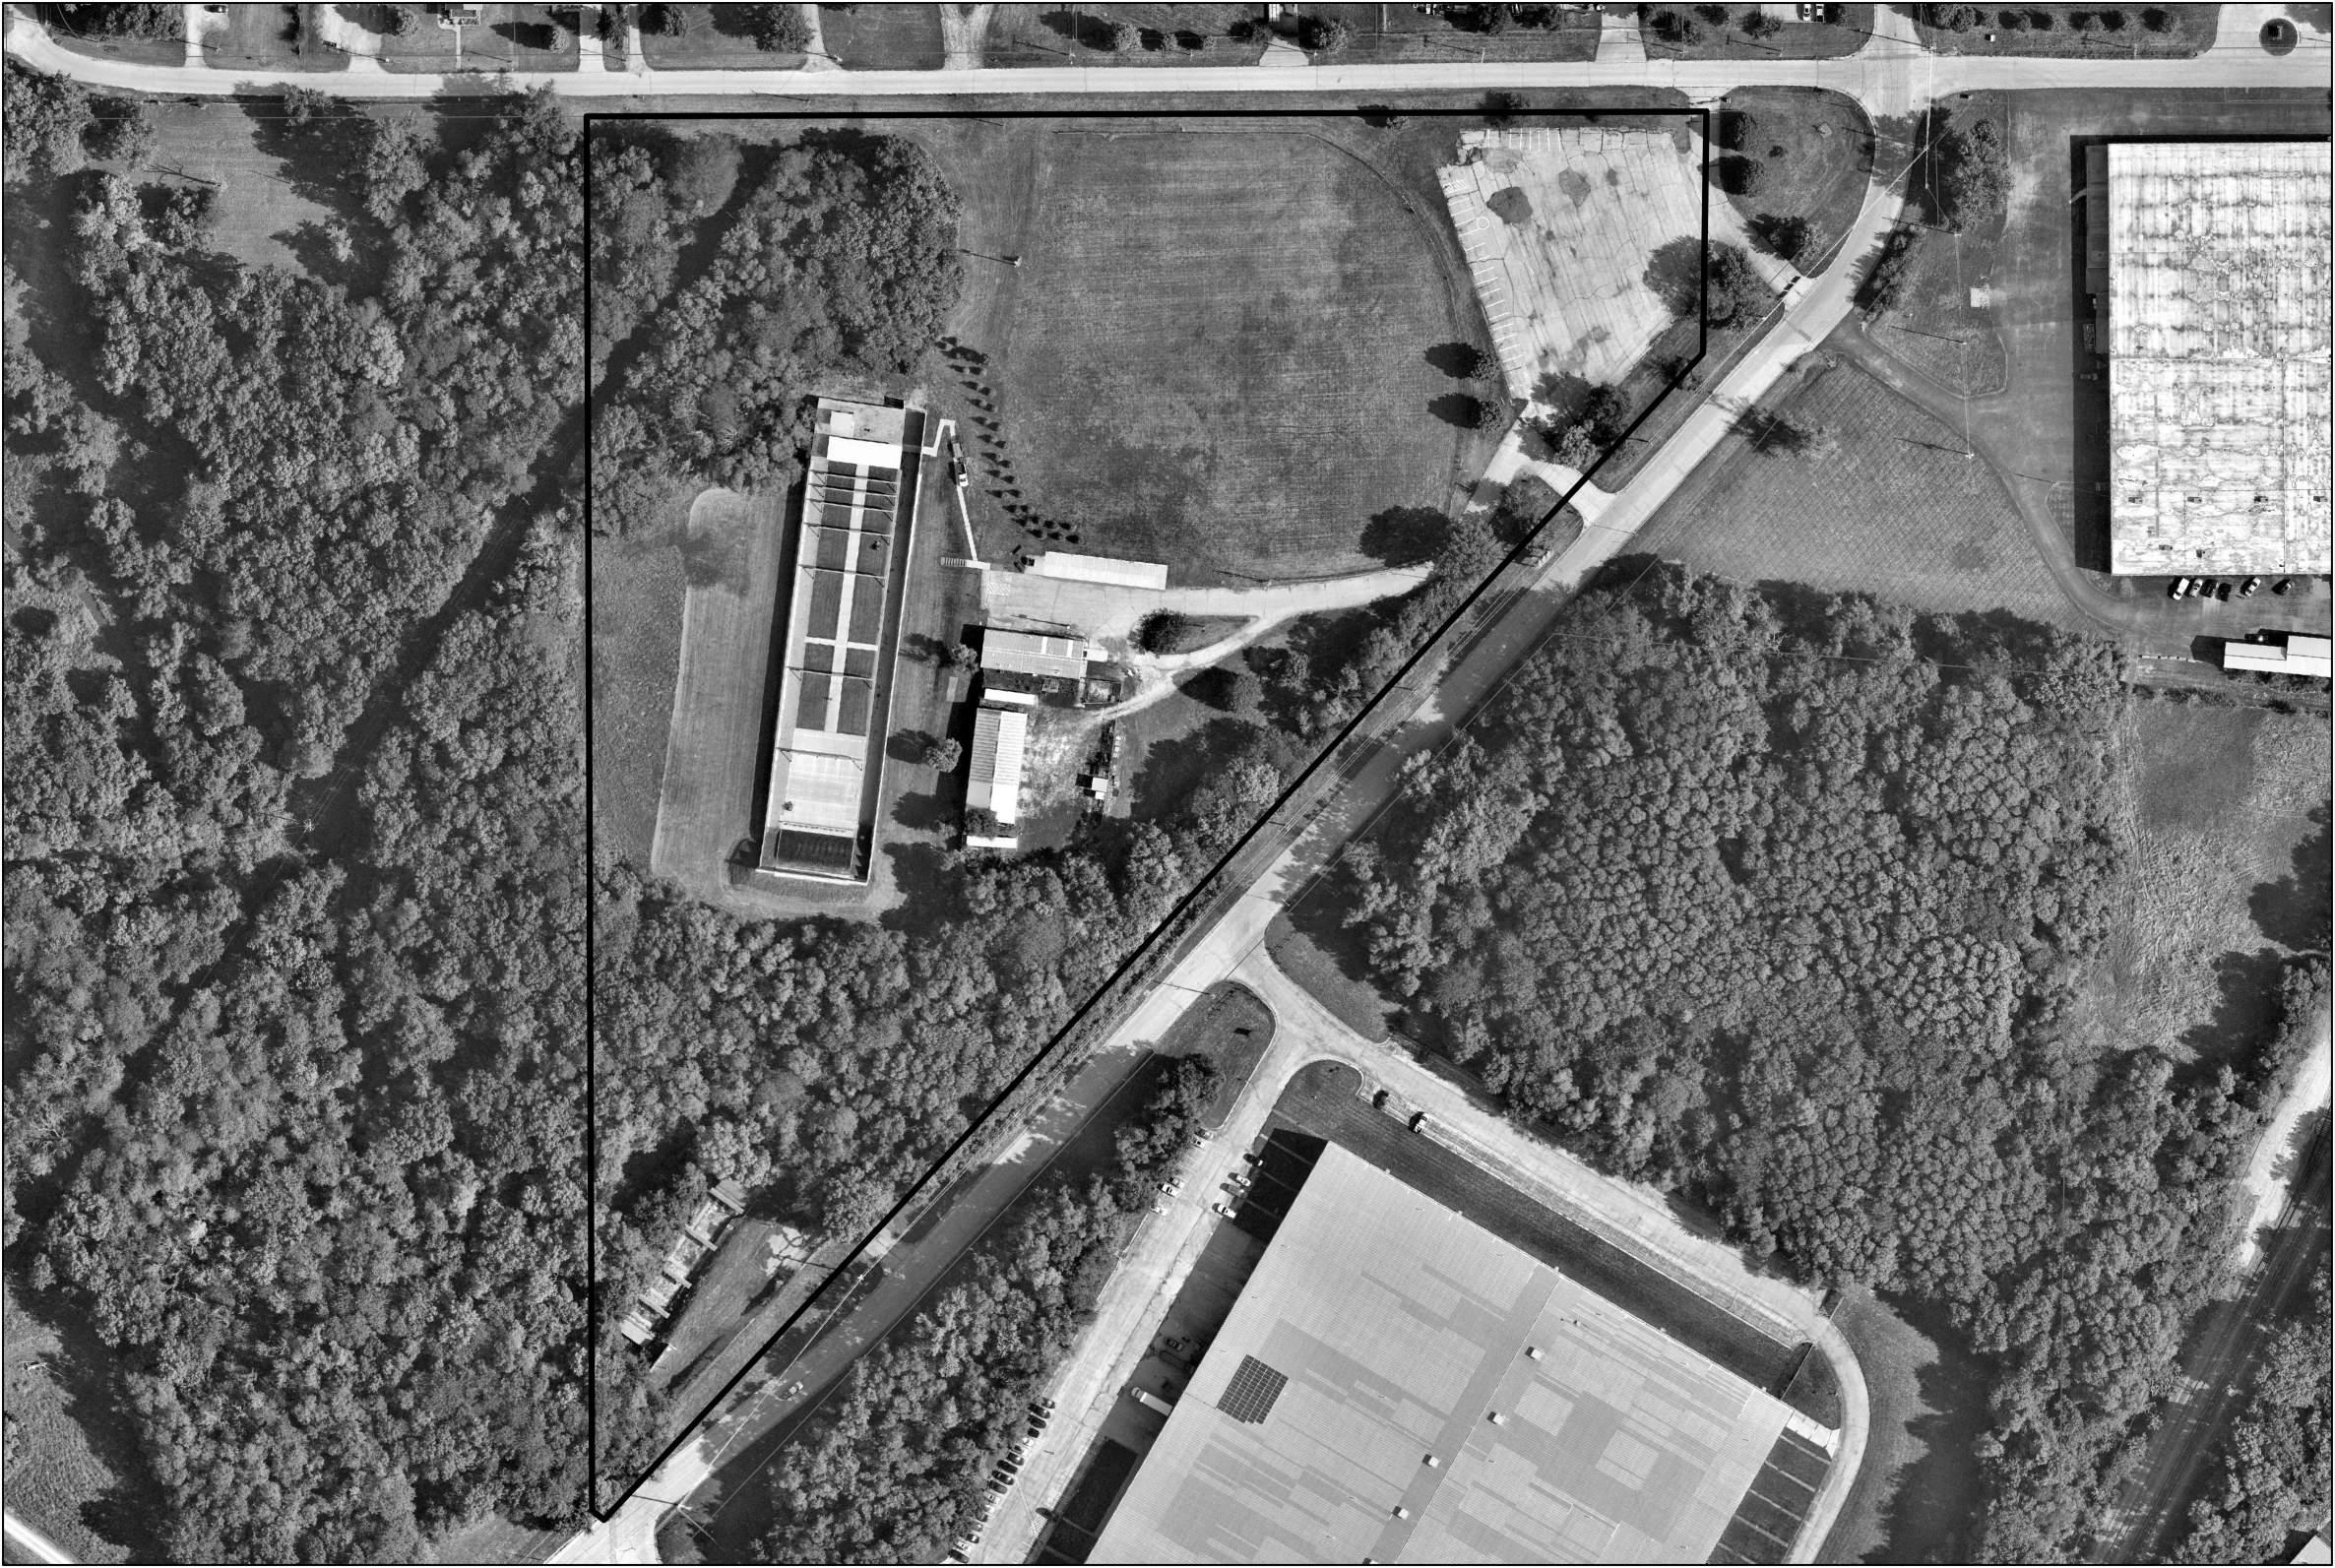
+ + + + + + + + + Shooting range
N
1"= 110'
a c d b
Southview Park
2.5 min
5 min
PARK FACTS
Location: 7900 Harry S Truman Dr. Park Type: Neighborhood Park Park Size: 12.19 Acres
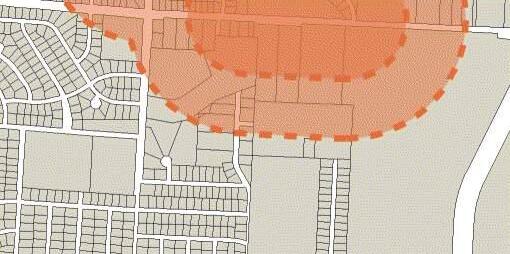
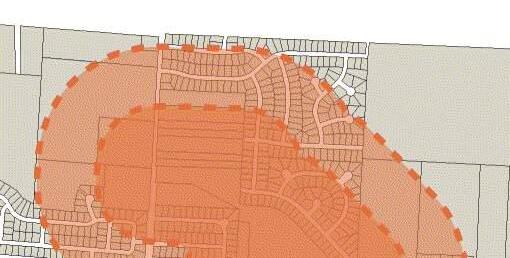
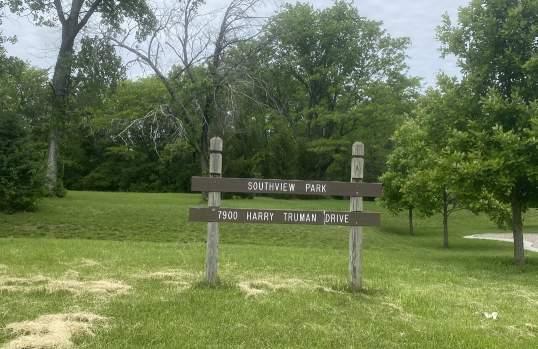
Description: Southview serves northern Grandview neighborhoods. Southview Park has a shade structure, picnic tables, a playground, and a walking path with some open field and wooded spaces.
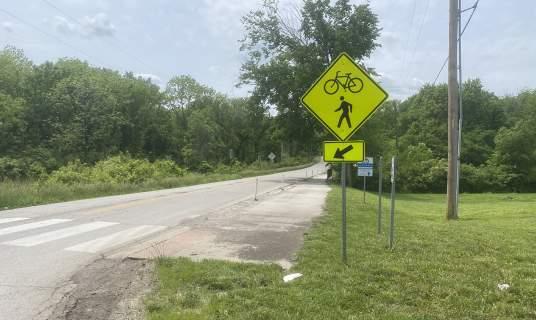
Inventory of Amenities:
Playground
Picnic Area
Open turf Trail Connection
PUBLIC OPEN HOUSE REQUESTS:
Fitness stations
More trails
84
AMENITIES - AT A GLANCE

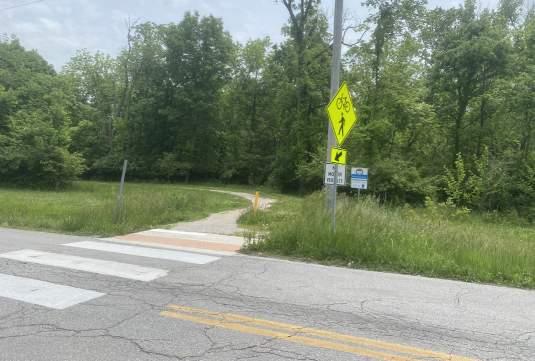
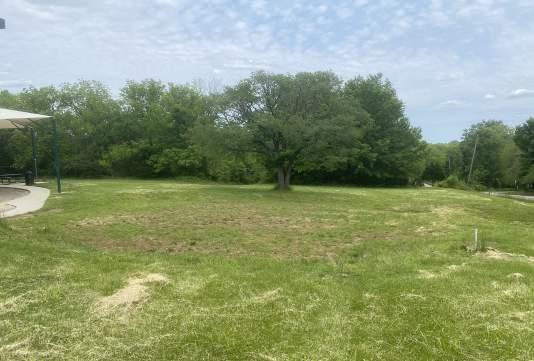
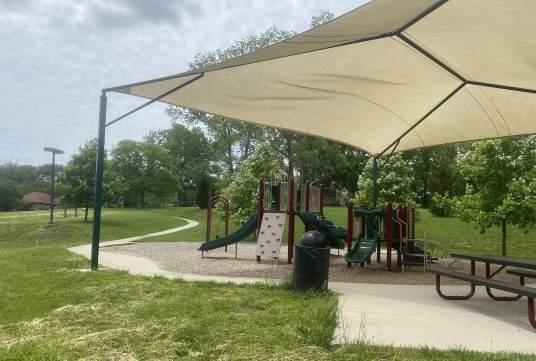
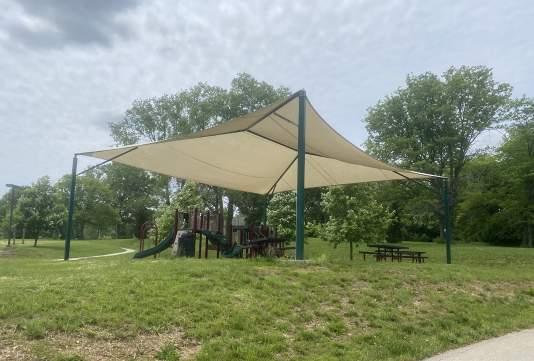
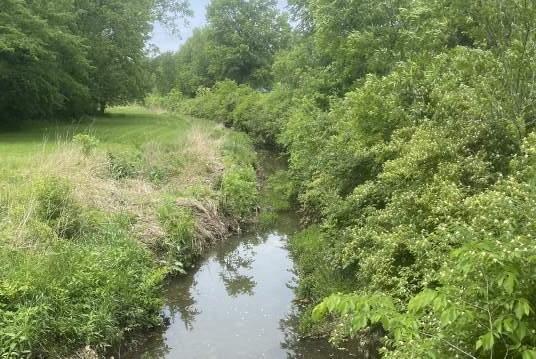
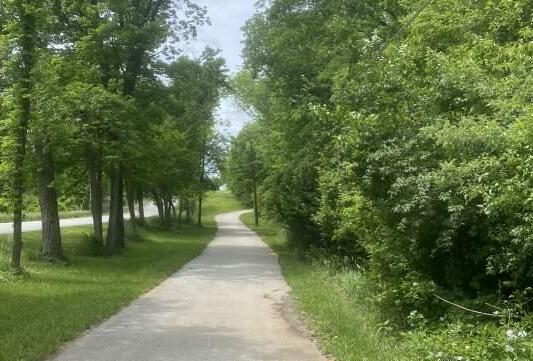
85 High Level Maintenance
LEVEL OF QUALITY
POOR
POOR
Accessibility:
Key Issues:
Key Issues:
FAIR
FAIR GOOD
POOR FAIR GOOD
Park accessibility is very poor as there is no parking lot and a dangerous path on the road that is not ADA. There is good visibility from the road and from the main usable park space, however, there is no clear park entrance.
Character:
POOR FAIR GOOD
In general the character of Southview Park is fair but has very few amenities for its size. There is a walking path, a shade structure, picnic tables, and a small playground. There are no landscape plantings but the park generally appears maintained.
Connectivity:
POOR FAIR GOOD
Pedestrian connectivity to Southview Park is fair as it connects to nearby neighborhoods and is not too far from Mapleview park via sidewalk connections. A Presidential Trailhead is also located across the street which spans a good portion of Grandview.
Usability:
POOR FAIR GOOD
Usability is poor as it is hard to access and has few amenities that appeal to multiple generations. Consider expanding amenities, trails, and accessibility to increase usability.
Condition:
POOR FAIR GOOD
The condition of amenities is fair with a number of aging amenities. Consider replacing playground equipment, playground surfacing and other amenities in 2-5 years.
• Playground equipment is outdated.
• Lack of parking and access to park amenities.
• Dangerous sidewalk access to park.
• Mulch surfacing is compacted and dissipating around the edges.
• Vegetation is dense and needs clearing out.
• Creek vegetation catches debris.
• Limited park amenities for park size.
Recommendations:
Recommendations:
• Replace play equipment and install new safety surfacing and edging.
• Add a parking lot with ADA stalls.
• Clean up vegetation along creek.
• Increase neighborhood trail connections from Southview Drive and Food Lane.
• Make stronger connection to Presidential Trail with signage.
• Add more trail connections throughout the park.
• Consider adding limestone steps down to the creek edge.
• Repair riparian corridor on eastern edge.
• Add a small shelter or gazebo near new neighborhood trail entrance.
• Add an additional park sign off west trail entrance.
• Consider moving the current southeast entry sidewalk further off the road for safety reasons.
• Consider playground and surfacing replacement in the next 2-5 years.
Opinion of Probable Costs: $775,000
86 High Level Maintenance
GOOD
PROPOSED IMPROVEMENTS:

a. Trail Connections
b. Small Parking Lot with ADA Stalls
c. Neighborhood Connections
d. Park Sign
e. Bridge Connections


f. Small Gazebo
g. Creek Bank Stabilization
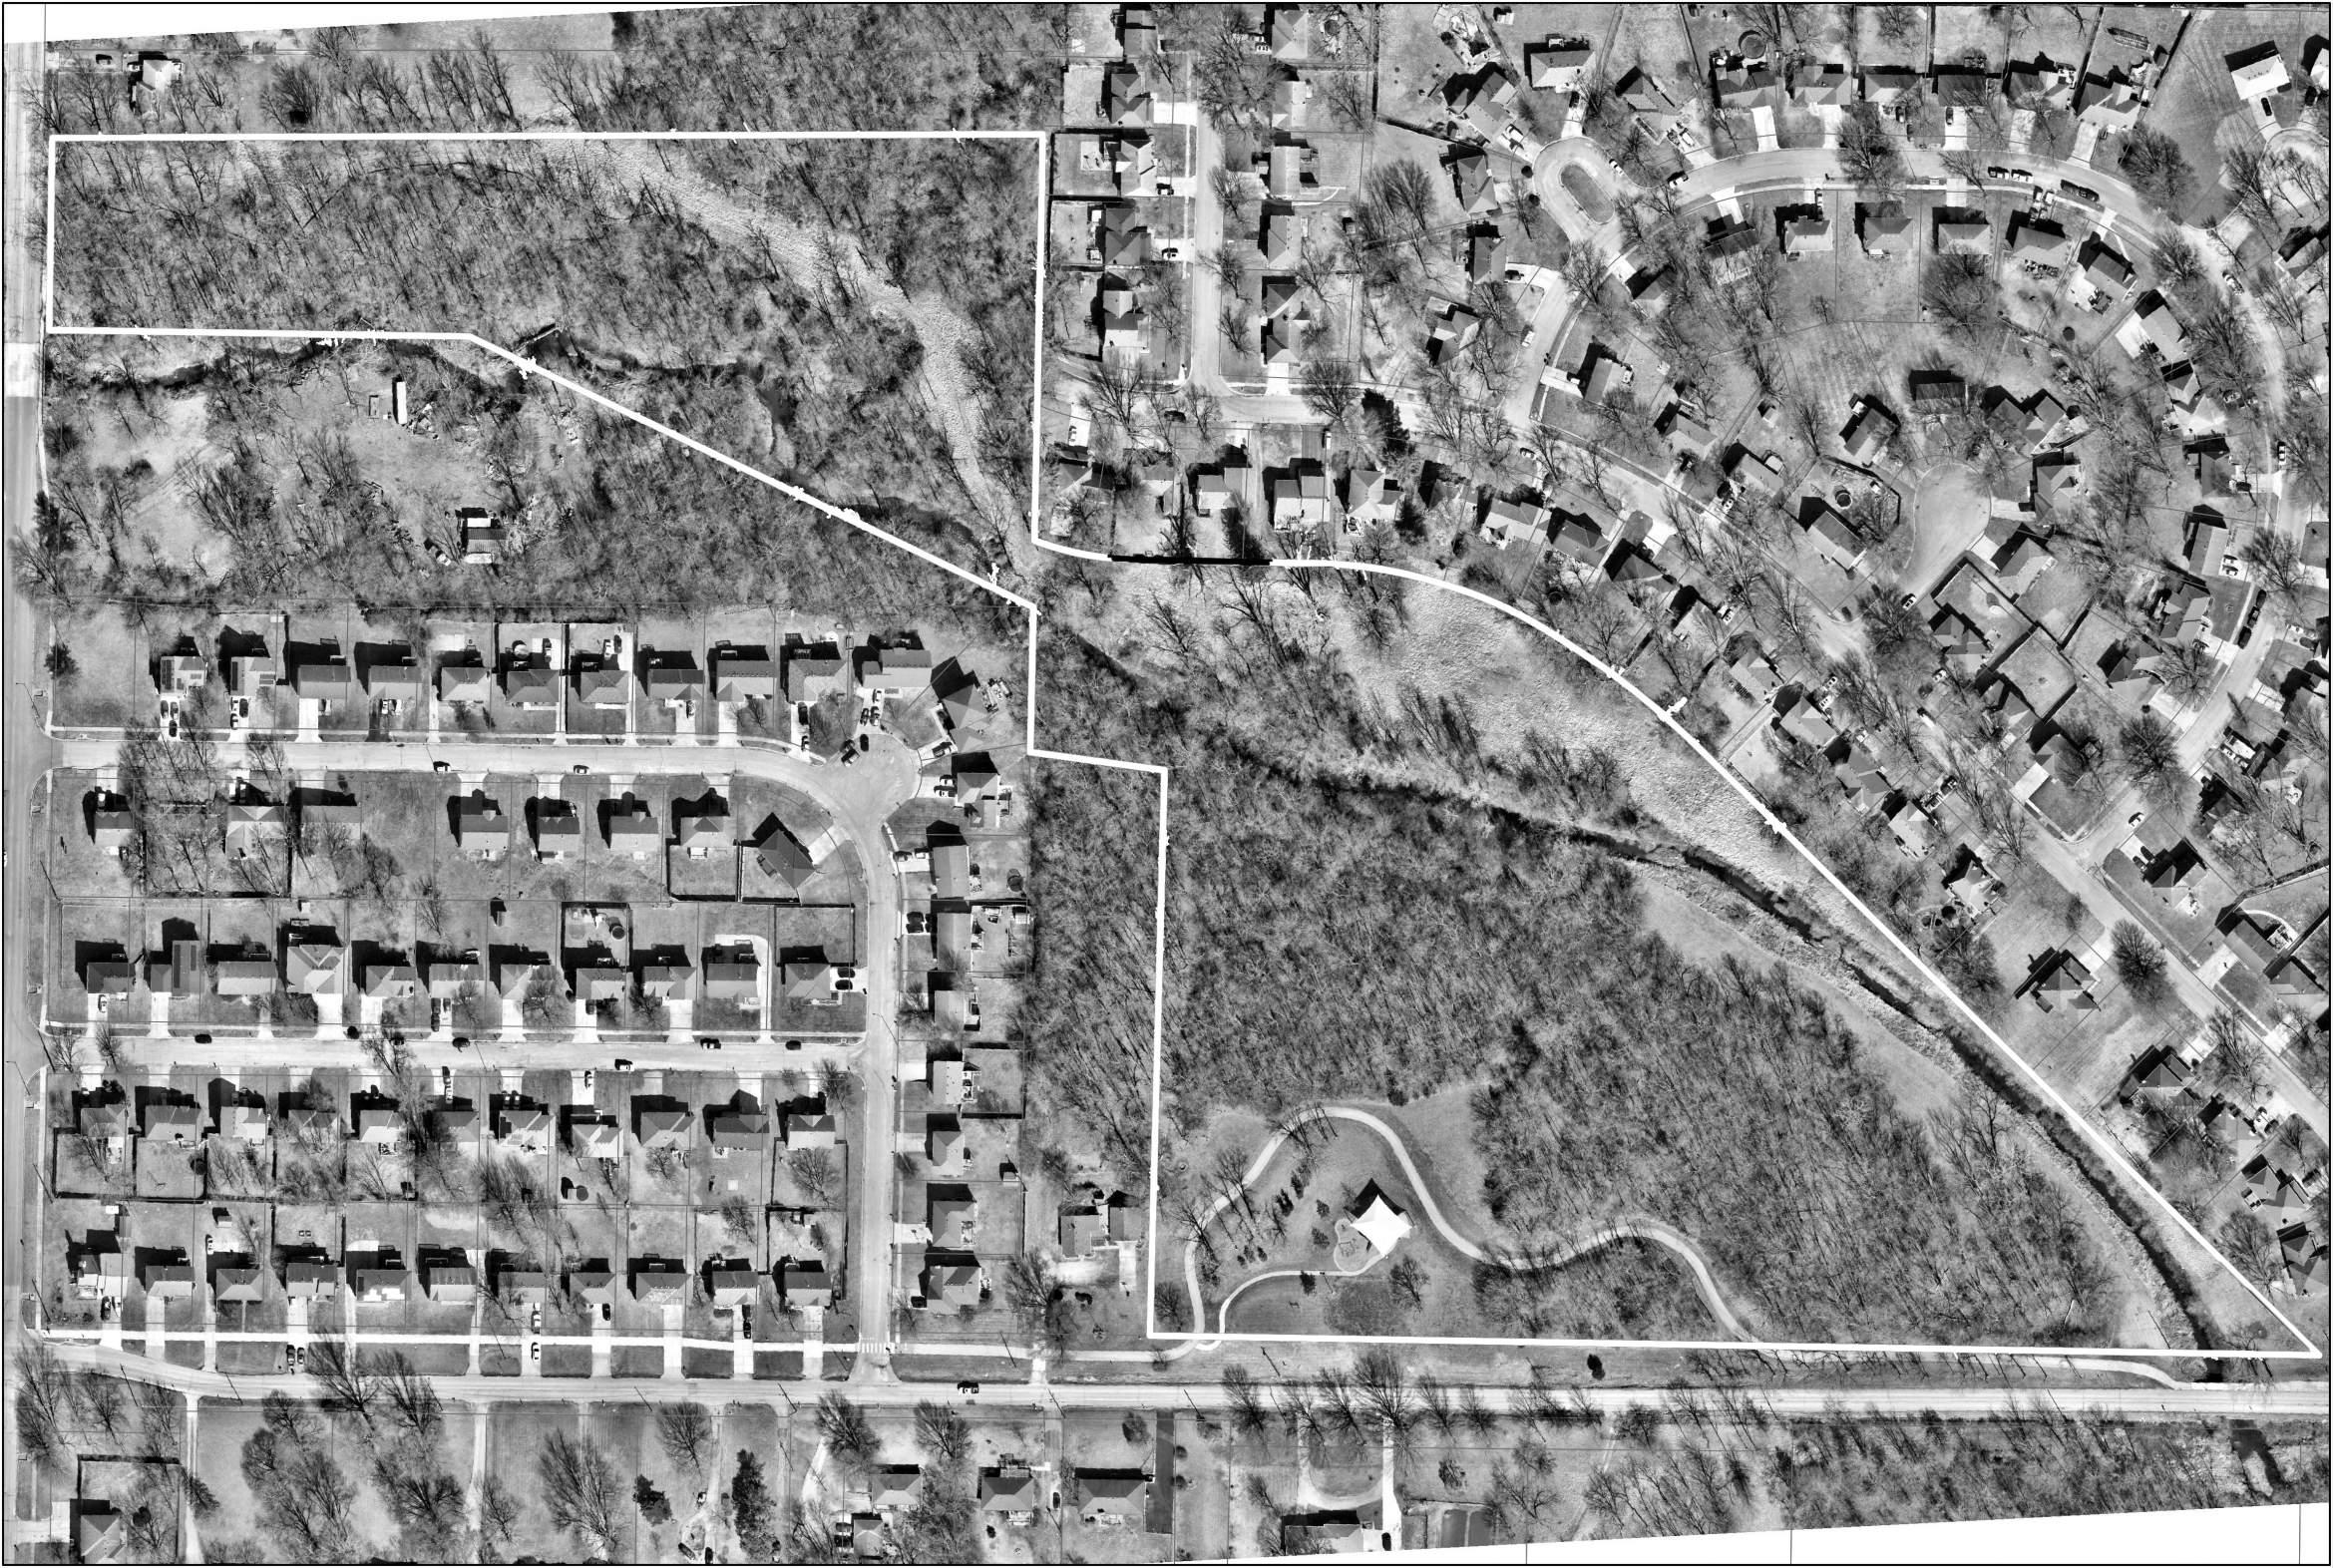
h. Limestone Steps Down to Creek Edge
i. Playground and Surfacing Replacement

HARRY S TRUMAN DR. E 122ND ST. SOUTHVIEWDR. Trail
Shade
Bridge Sign Sign Sign
Creek
Restoration Parking FOOD LN. Southview Park 1"= 140' N
Playground
Structure Trail Gazebo
Creek Steps
Bank
a a c e e b i d f h g
Tails & Trails Dog Park
2.5 min
5 min
PARK FACTS
Location: 7600 e 139th St.
Park Type: Special Use Park
Park Size: 10.2 Acres
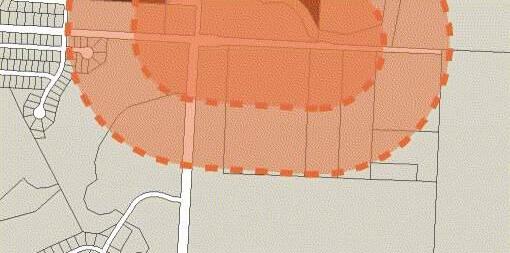
Description: This is Grandview's other special use park. Tails & Trails Dog Park serves all of the City's dog park needs with three large fenced areas complete with benches, small shade structures, water fountains, and dog obstacle equipment pieces. There is also a loop trail surrounding all fenced areas.
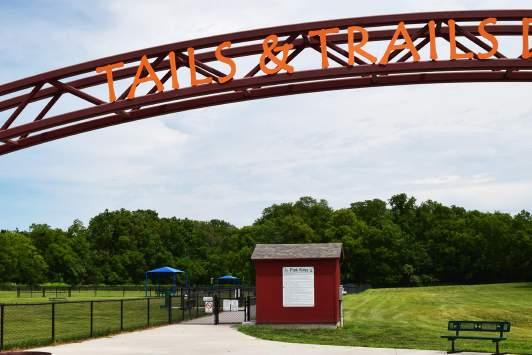
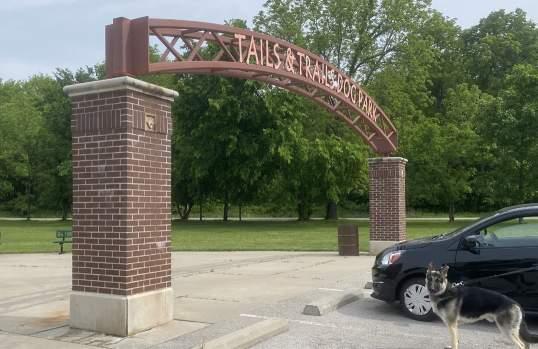
Inventory of Amenities:
Fenced Areas
Obstacle Course
Site furnishings
Drinking fountains
PUBLIC OPEN HOUSE REQUESTS:
Improve existing amenities
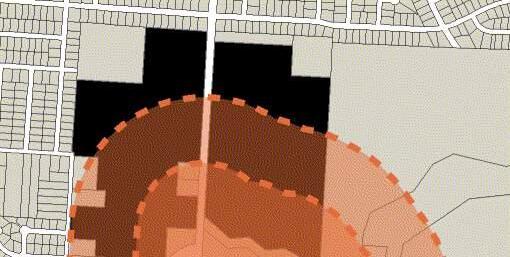
Dog shower station
Create trail connection to Meadowmere
88
AMENITIES - AT A GLANCE
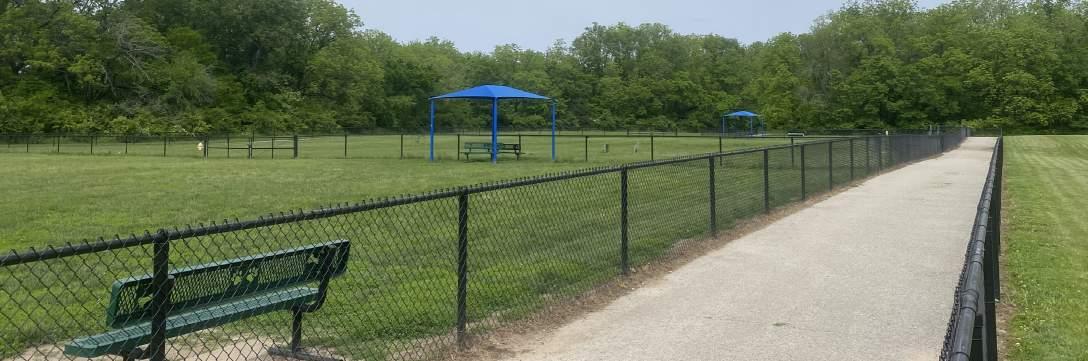
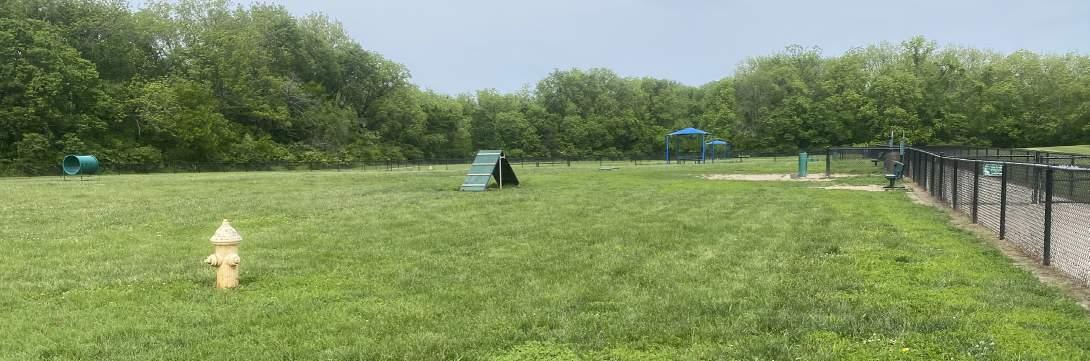
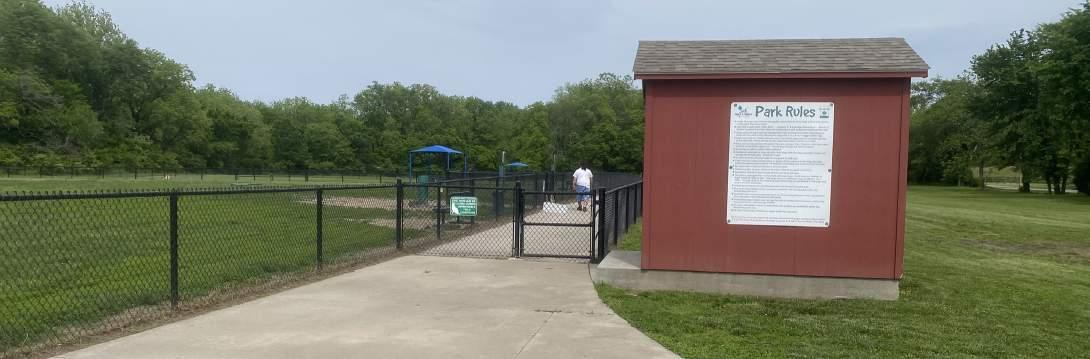
89 High Level Maintenance
LEVEL OF QUALITY
POOR
POOR
Accessibility:
FAIR
FAIR GOOD
POOR FAIR GOOD
The park is fairly easy to get to by car as there is a small parking lot with ADA stalls. Visibility is fair from the road and has a nice, large sign gateway as an entry into the park.
Character:
POOR FAIR GOOD
Generally the character of the park is poor as it does not have many unique amenities other than the park sign gateway. Limited amenities and large empty fenced in areas provide little stimulation for users.
Connectivity:
POOR FAIR GOOD
Pedestrian connectivity to Tails & Trails Dog Park is fairly good. There aren't many sidewalks to other parks or neighborhoods as they are on more major roads. However, Meadowmere Park is right next door.
Usability:
POOR FAIR GOOD
This park is fairly usable as it provides a unique functionality in the park system. Consider adding more shade structures, benches, and other site amenities to increase usability while staying in line with the parks intended purpose.
Condition:
FAIR GOOD
The condition of the limited amenities is good. Consider adding bigger shade structures, more obstacle equipment, and places to sit.
Key Issues:
Key Issues:
• Playground equipment is outdated.
• Lack of shade.
• Gate entrance grass is worn down.
• Mulch surfacing is compacted and dissipating around the edges.
• Creek vegetation catches debris.
Recommendations:
Recommendations:
• Consider planting shade trees around fence edges to provide shade over time.
• Replace play equipment and install new safety surfacing and edging.
• Clean up vegetation along creek.
• Long term planning project to link to Meadowmere Park trails to the north.
• Consider adding crushed gravel or concrete pads around entry points and amenity zones to reduce problem areas where grass won't grow.
• Additional or replacement agility course components for both large and small dogs.
• Consider adding a dog wash station
• Consider installing larger shade structures 24'x34' with additional benches.
• The large open green space to the south could be used as auxiliary pens allowing other pens to be closed for turf reestablishment. Another option might be to make this area the small dog pen and covert the 3 segments to one large pen.
90 High Level Maintenance
POOR
GOOD Opinion of Probable Costs: $348,500
PROPOSED IMPROVEMENTS:
a. Dog Wash Station
b. Park Shelter (16'x24')
c. Shade Structures (24'x36') & Benches
d. Trail Connection to Meadowmere Park
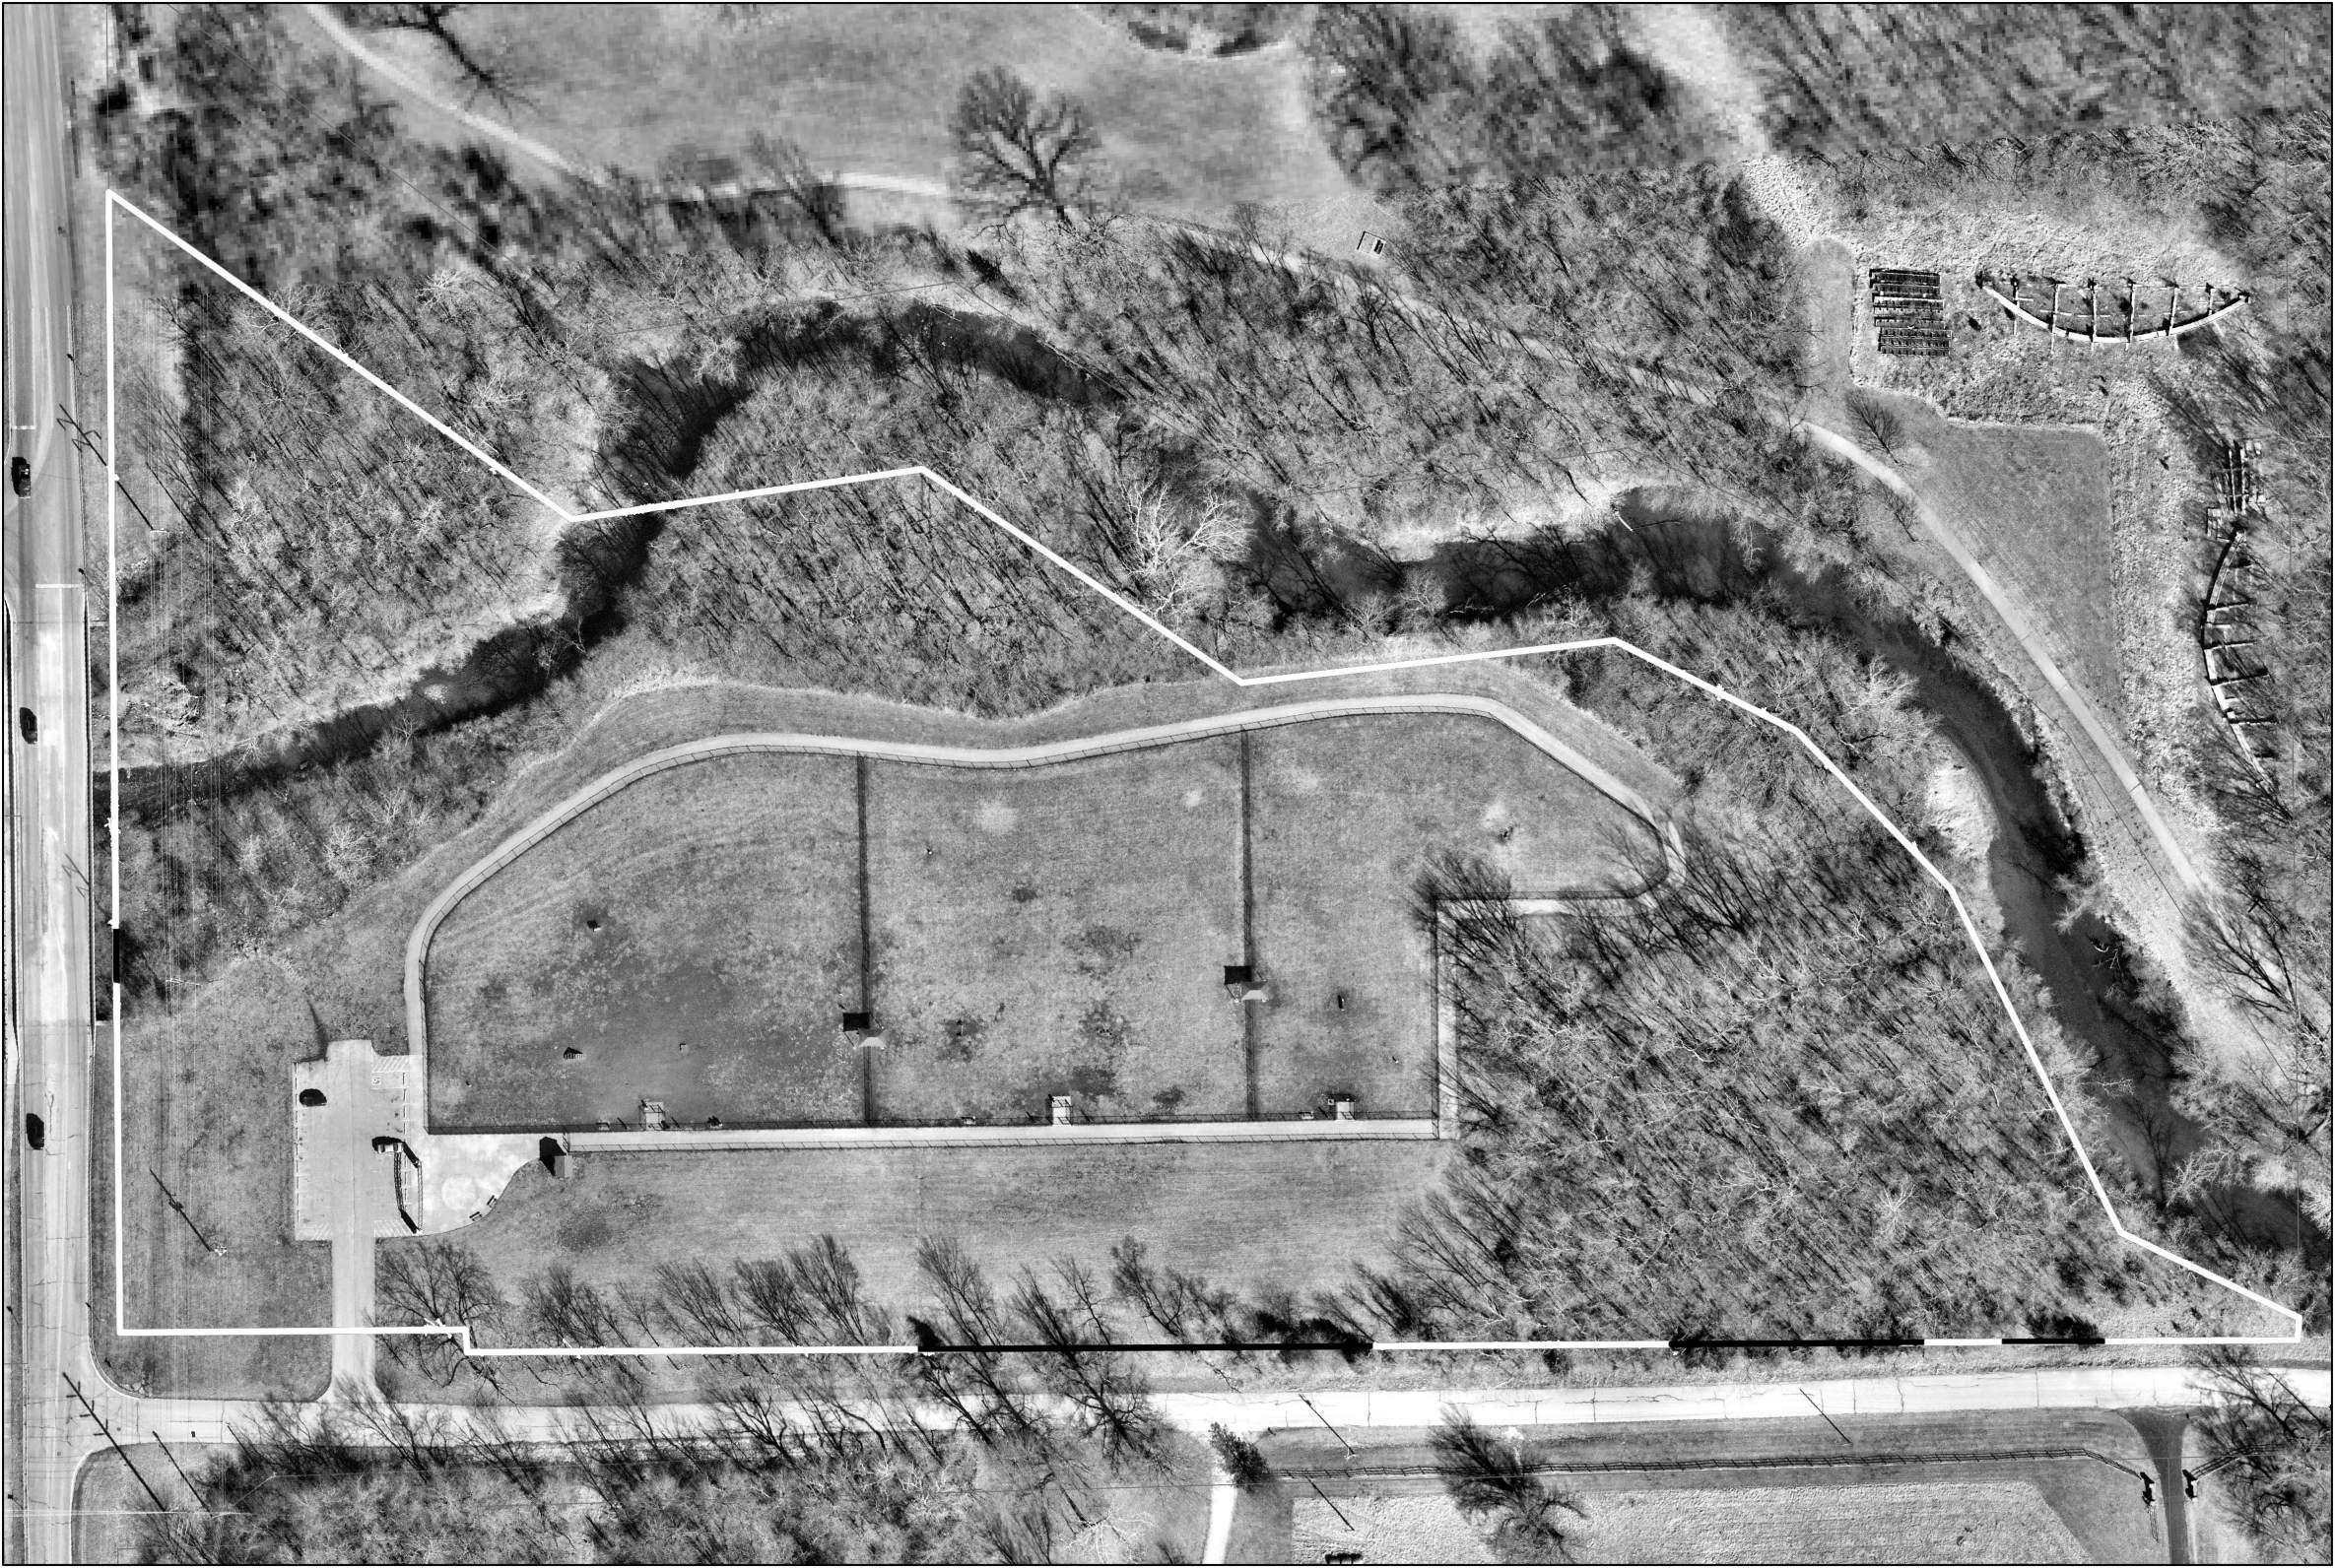
e. Gravel Entry Points


f. Agility Course Amenities
g. Shade Trees
h. Auxiliary Pens
E 139th ST. BYARS ROAD + + + + + + + + + + + + + + + + + Large Dog Medium Dog Small Dog Auxiliary Pens Maintenance Shed Parking Sign Shelter Shelter Dog Wash Station Shade Tree Bridge Trail Connection Gravel
Trails Dog Park 1"= 80' N
Tails &
a c e f b d
Terrace Park
5 min
2.5 min
PARK FACTS
Location: 1300 E 125th Terrace
Park Type: Neighborhood Park
Park Size: 1 Acre
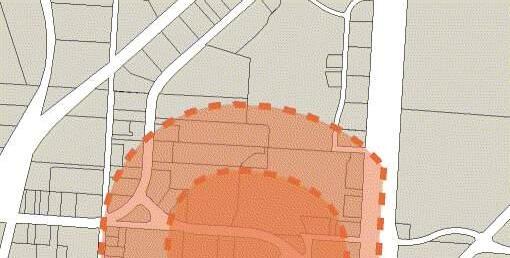
Description: Terrace Park is a unique neighborhood park and is complete with table tennis, a chess board table, horseshoes, a playground, a picnic table, and several fitness stations.
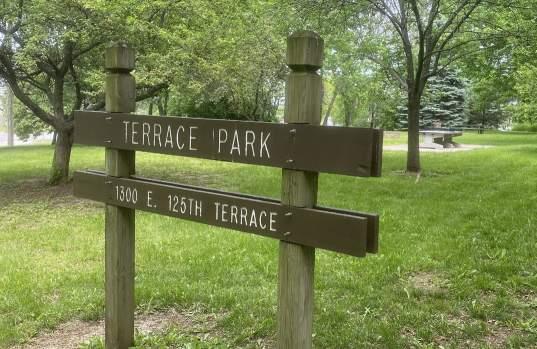
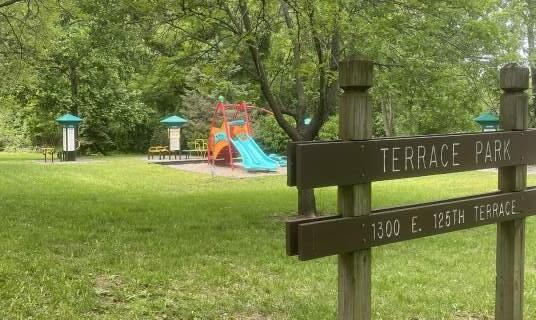
Inventory of Amenities:
Playground
Picnic Area
Ping-pong table
Chess table
Horseshoes
Fitness equipment
PUBLIC OPEN HOUSE REQUESTS:
Swing set
Pool Tennis court
Gathering space for neighborhood
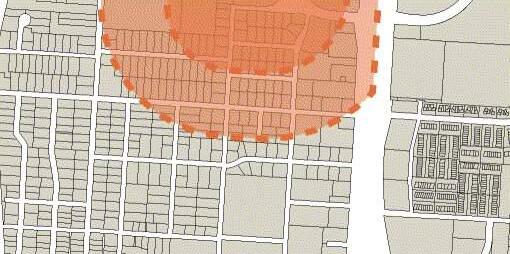
92
AMENITIES - AT A GLANCE

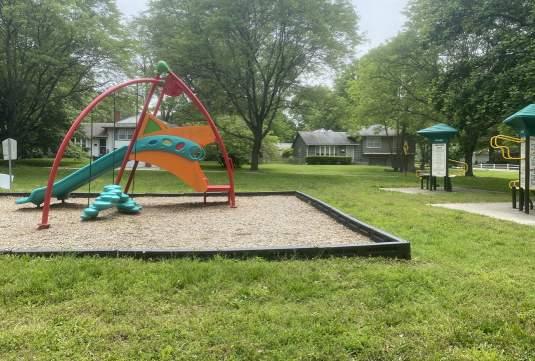
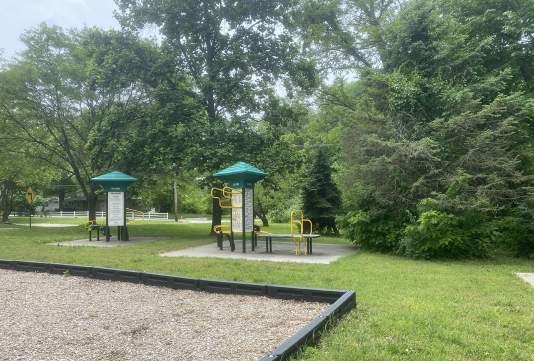
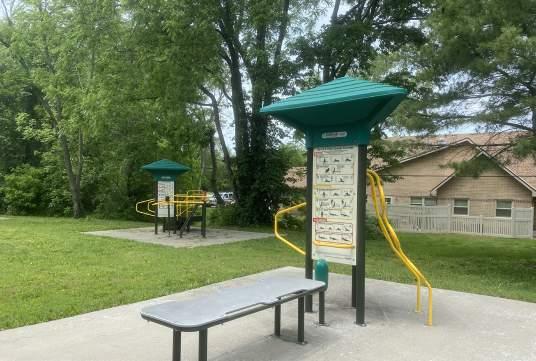
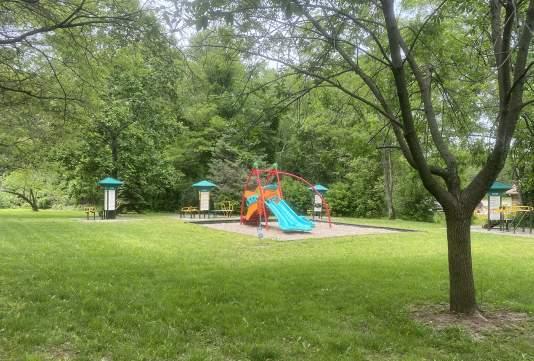
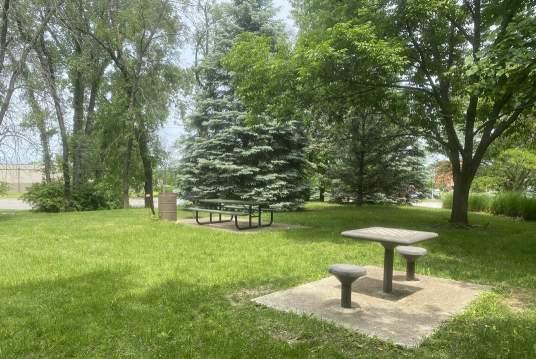
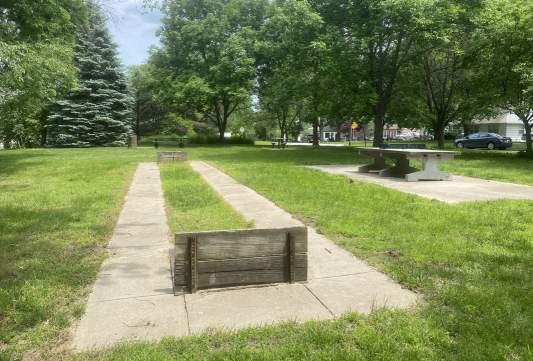
93 High Level Maintenance
LEVEL OF QUALITY
FAIR
POOR
Accessibility:
POOR FAIR GOOD
GOOD
The park is fairly easy to get to by car and by bike or foot as it is situated in a neighborhood. Unfortunately, there is not a parking lot. There is good visbility to the entire park from the road.
Character:
POOR FAIR GOOD
In general the character of Terrace Park is fairly good as it has several unique offerings and good shade. There are not any landscape plantings but overall maintenance is good
Connectivity:
POOR FAIR GOOD
Terrace Park has fair connectivity from sidewalks and to other parks as Freedom Park is only a few blocks away. Terrace Parks sits on the edge of a neighborhood and makes it fairly connected to points of interest.
Usability:
POOR FAIR GOOD
This park is fairly usable with a wide variety of amenities that cater to different age groups. Usability could be increased with interior sidewalks connecting all park amenities for ADA accessibility.
Condition:
POOR FAIR GOOD
Amenity conditions are fairly poor as they have aged and could use revitalization or replacement in 2-5 years.
Key Issues:
Key Issues:
• Playground equipment is outdated.
• Lack of ADA access to park amenities.
• Mulch surfacing is compacted and dissipating around the edges.
• No site furnishings or shelters for shade.
• No parking.
• Creek vegetation catches debris.
Recommendations:
• Replace play equipment and install new safety surfacing and edging.
Recommendations:
• Consider paved walkways to connect exercise stations and game tables.
• Clean up vegetation along creek.
• Expand and update the play area and add 5-12 age play structure. Add swing set and cornhole to tie in a variety of active multigenerational play opportunities.
• Add site furnishings like benches.
• Consider constructing a small shelter (16'x20').
94 High Level Maintenance
POOR FAIR GOOD
Opinion of Probable Costs: $335,000
HARRY
a. Playground Expansion


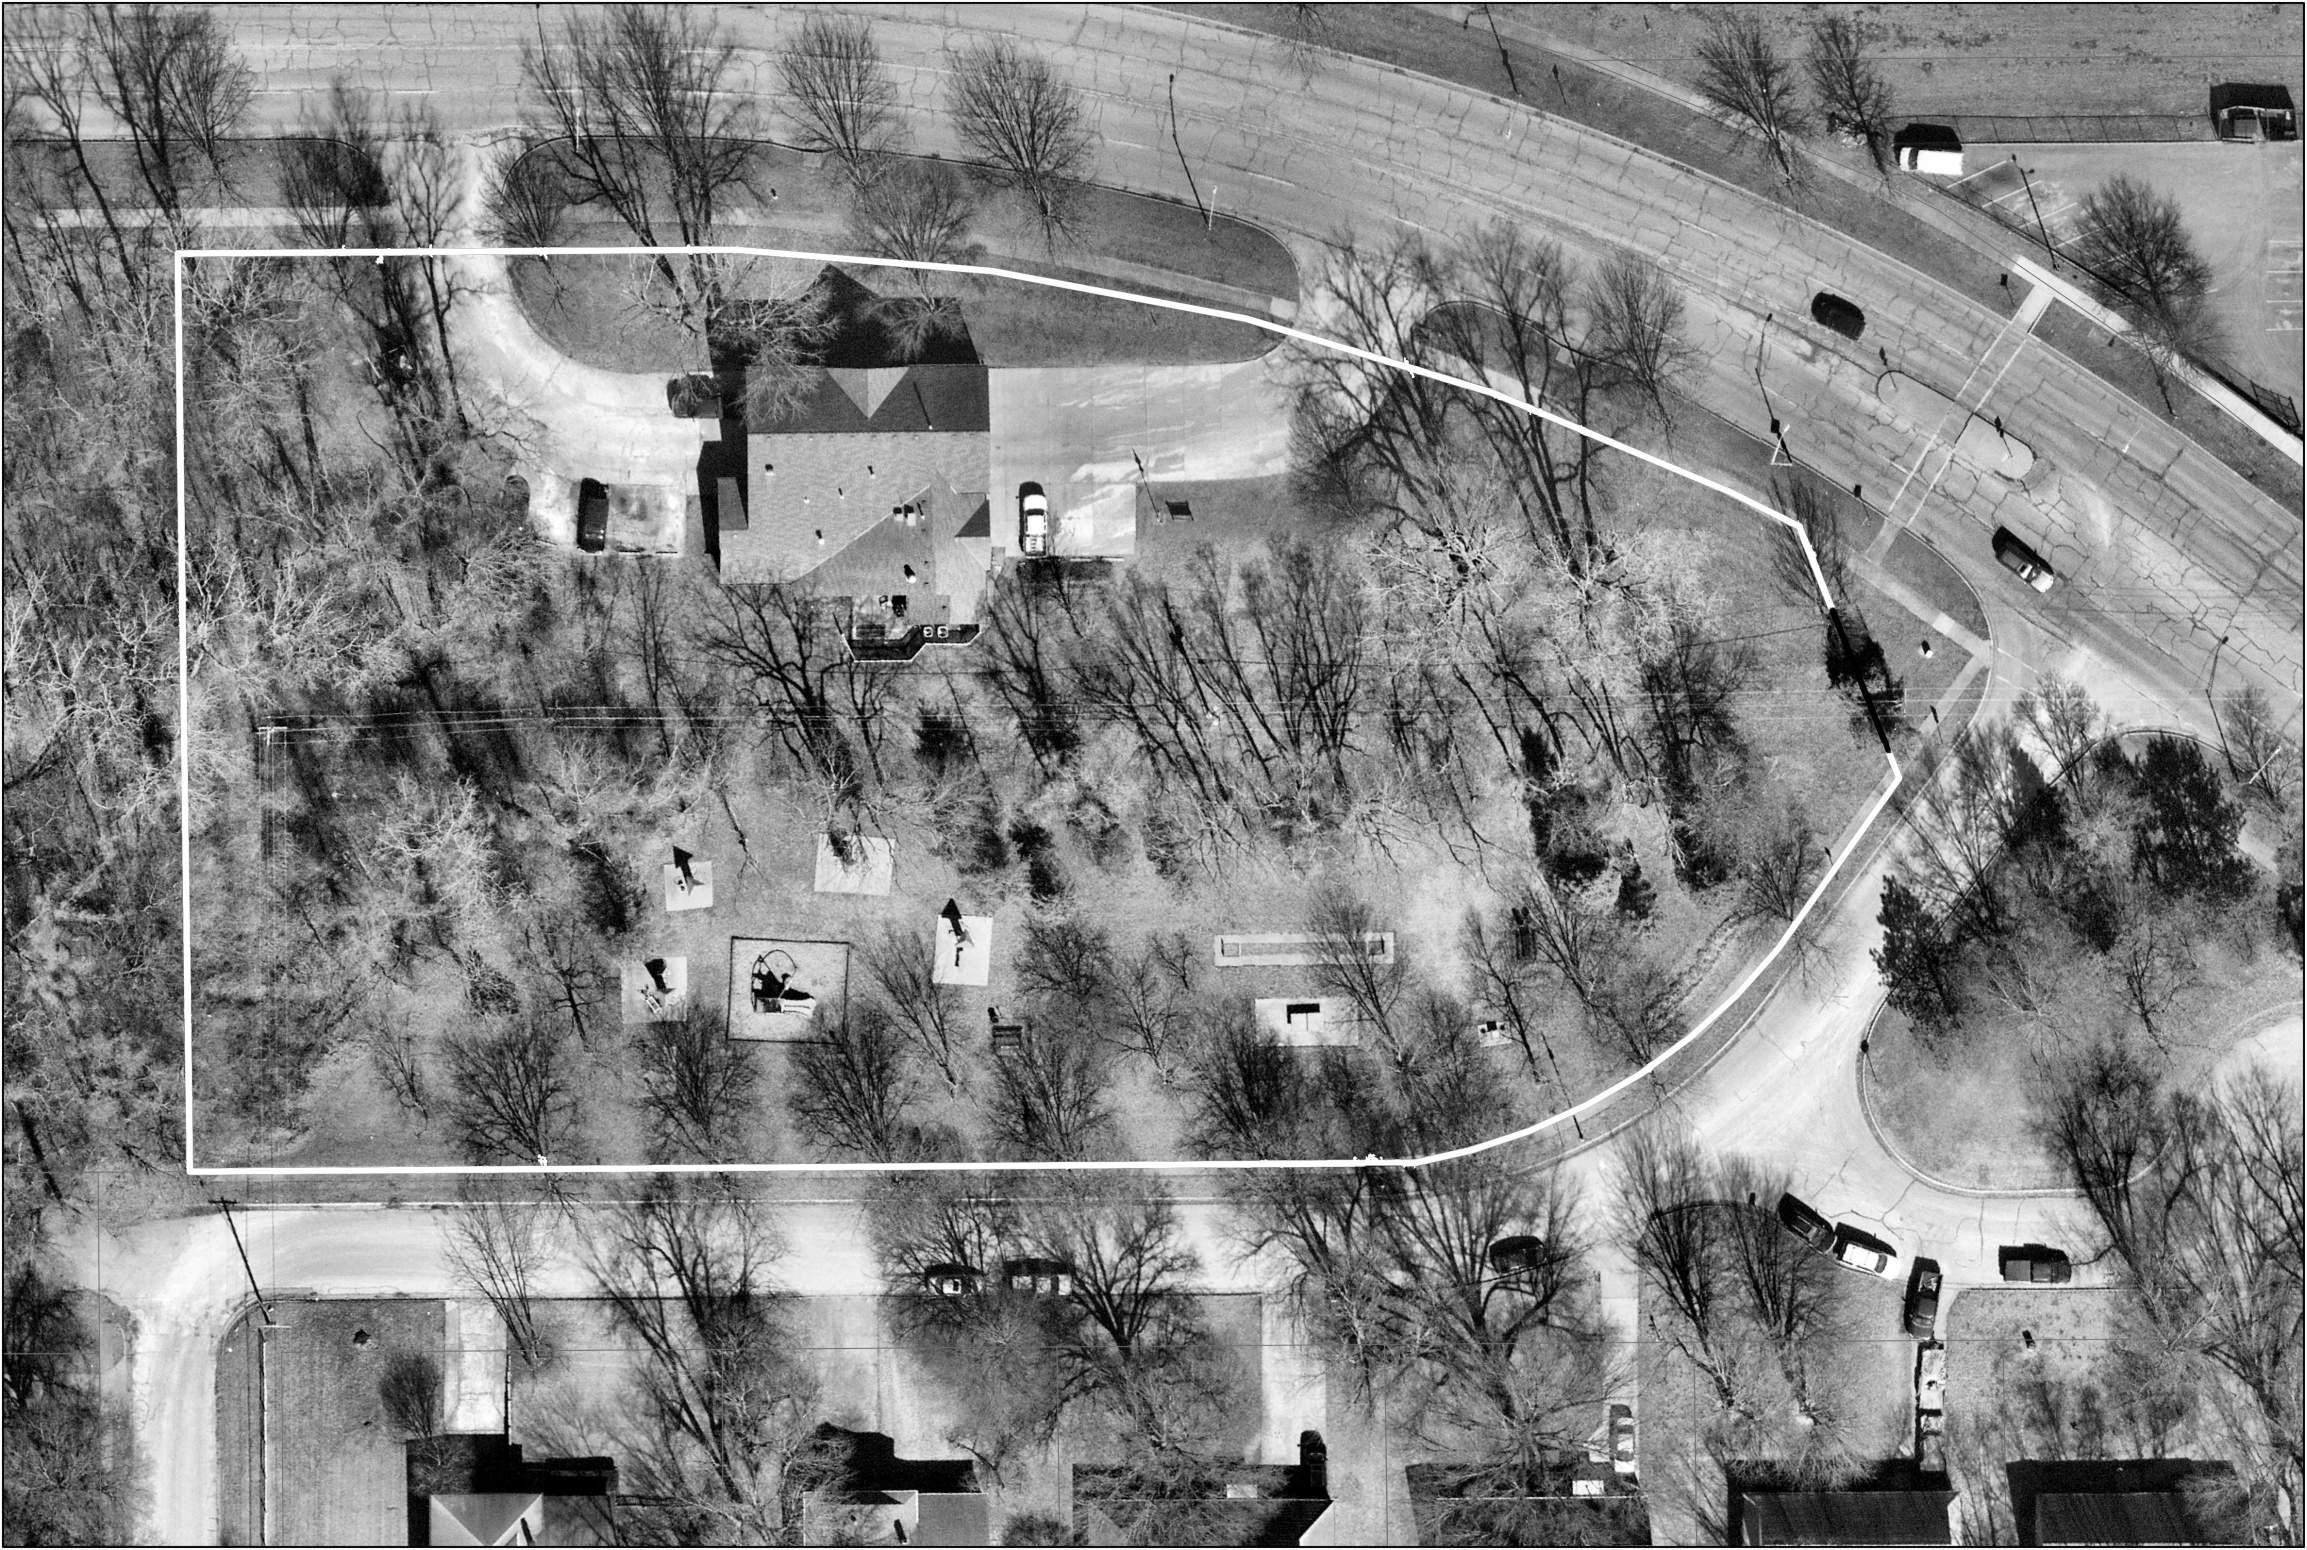
Sidewalk Connections
Cornhole
Add site furnishings

Small Shelter (16'x20')

S TRUMAN DR. E 125 TERR.
Exercise Station
Playground
Table Tennis
Horseshoes
Chess Table
Fire Station
Powerline Shelter Cornhole Terrace Park
Bench
N
1"= 40'
PROPOSED IMPROVEMENTS:
b.
c.
d.
a e c b d
e.
Valley Park
PARK FACTS
Location: 4000 E 123rd Terr.
Park Type: Neighborhood Park
Park Size: 15.31 Acres
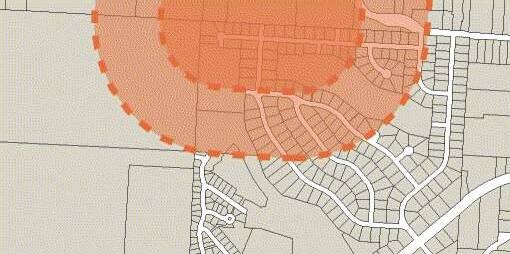
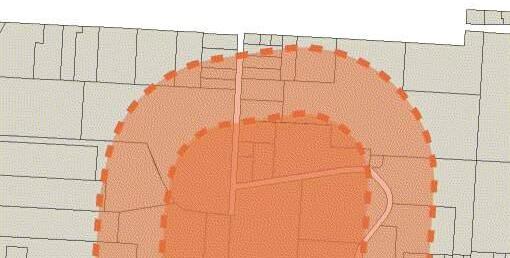
Description: Valley Park is a larger neighborhood park and serves Grandview's northwestern neighborhoods. Amenities include restrooms, a drinking fountain, rope climbing structures, two large shade structures with picnic tables, and some musical instrument play equipment.
Inventory of Amenities:
Playground
Climbing
Benches
Restroom
Picnic areas
Shade structures
PUBLIC OPEN HOUSE REQUESTS:
Mountain bike trails
Playground for 2-5 ages
Fix turf under rope play structure
E-bike station
Trails
Addtional parking
Disc golf course
Fitnes stations
Loop trail
Basketball court
96
5 min 2.5 min
AMENITIES - AT A GLANCE

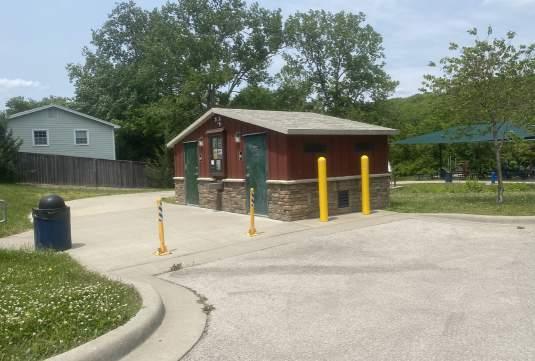
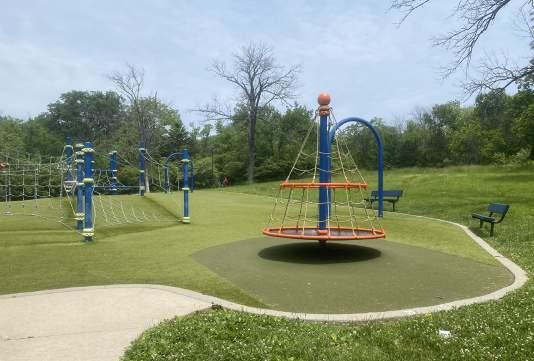
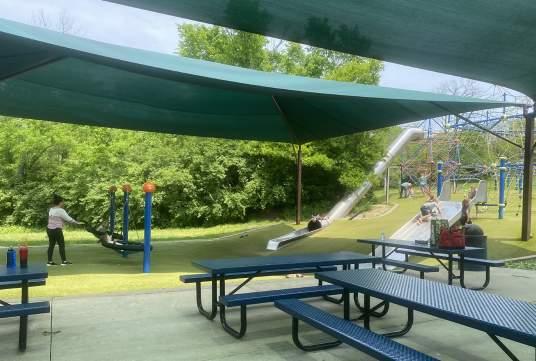
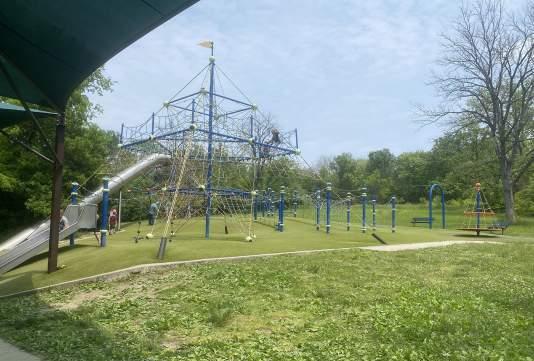
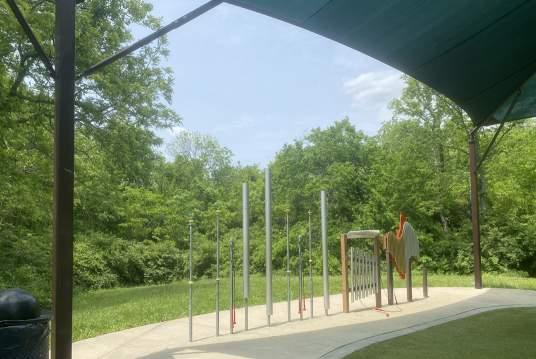
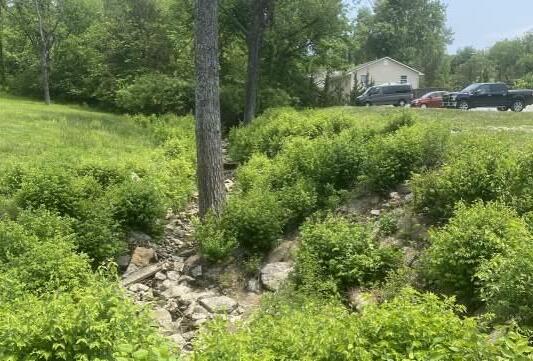
97 High Level Maintenance
LEVEL OF QUALITY
FAIR
POOR
Accessibility:
POOR FAIR GOOD
GOOD
The park is very easy to get to by foot, bike, or car as it has a small parking lot with ADA stalls and a bike rack. Almost all current park amenities are visible from the road and parking lot. The walk is ADA accessible
Character:
POOR FAIR GOOD
Valley Park's character is fair as it has some unique park equipment but some amenities are showing wear. A majority of the site is heavily wooded and provides nice shade and character, however vegetation loss has caused eroision along the creek banks.
Connectivity:
POOR FAIR GOOD
Connectivity is poor as it is the northern most park and not near any other parks. Valley Park does not have many sidewalk connections within the adjacent neighborhood or to any points of interest.
Usability:
POOR FAIR GOOD
This park is fairly usable with two large shade structures, a restroom, and various rope play strcutures. Usability can be improved by expanding further into the site with more generational amenities and walking trails.
Condition:
POOR FAIR GOOD
Majority of amenity conditions are in good condition. Water fountain and playground turf will need repair or replacement in the next 1-2 years. Consider adding additional amenities to expand and accomodate more users in the forested areas of the park.
Key Issues:
Key Issues:
• Playground equipment is outdated.
• Water fountain needs replaced.
• Mulch surfacing is compacted and dissipating around the edges.
• Creek has significant bank erosion.
• Some turf areas around the play surfacing, turf is dying due to normal wear and tear.
• Creek vegetation catches debris.
Recommendations:
• Playgroung turf is coming loose in some high traffic areas.
• Replace play equipment and install new safety surfacing and edging.
• Clean up vegetation along creek.
Recommendations:
• Add a parking lot off Greaves Road to support additional uses of the site.
• Adding a small event plaza would allow for larger gatherings or tournaments for disc golf and mountain biking.
• Design and implement mountain bike trails throughout the wooded area.
• Possible location for a 9-hole or 18-hole disc golf course.
• Creek requires more vegetative bank stabilization (e.g. trees, grasses, etc.).
• Add additional trails
• Consider adding a ninja obstacle course to increase utilization for teens and adults.
• Repair or replace synthetic turf in areas of high wear and tear.
• Replace water fountain, consider an additional one at new northern plaza.
98 High Level Maintenance
POOR FAIR GOOD
Opinion of Probable Costs: $445,000
PROPOSED IMPROVEMENTS:


a. Northern Access & Parking Lot
b. Mountain Bike Trails
c. 18-Hole Disc Golf Course
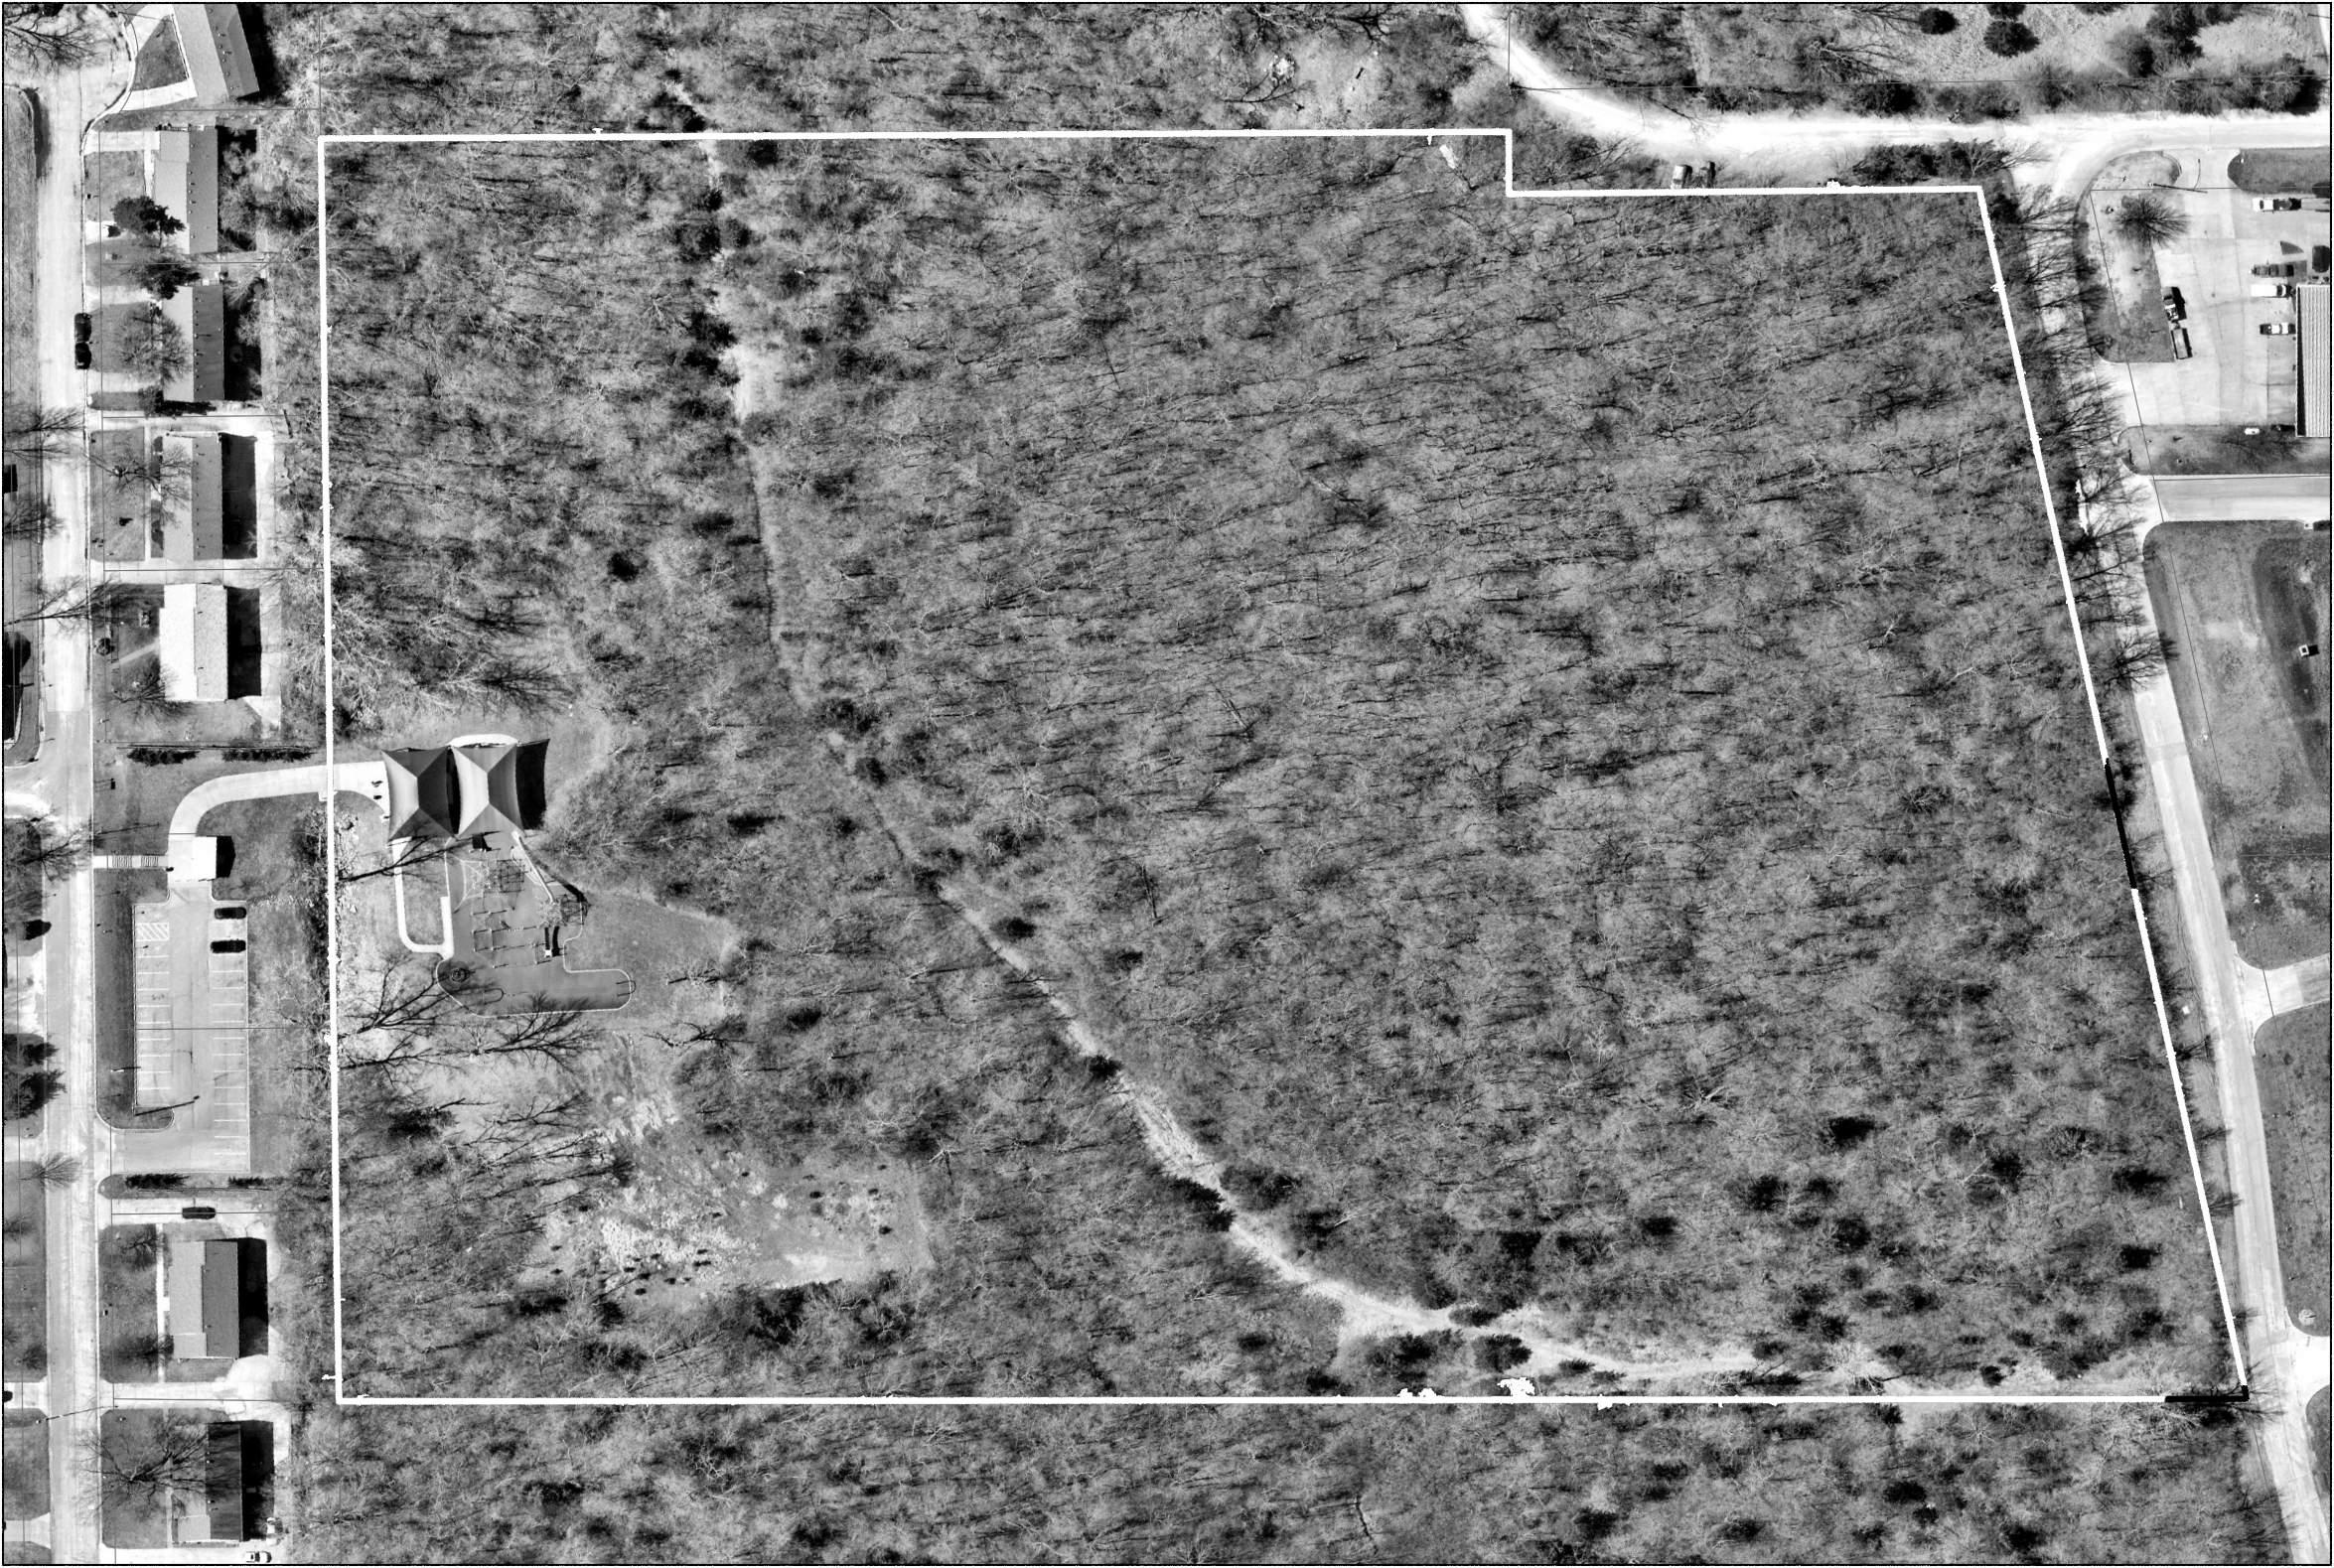
d. Ninja Obstacle Course
e. Additional Trails

f. Small Event Plaza
g. Bank Stabilization
E 123rd TERR. Trail Shade Structure Parking Restroom Playground Ninja Course Disc Golf Mountain Bike Course Drainage Way Parking Plaza Valley Park 1"= 80' N
b a c e d g f
04 Community Engagement
Community engagement
APPROACH
The approach to public input for this Plan involved a series of in-person and virtual face-to-face conversations with various community members. A stakeholder group of 16 people representing a cross section of the community gathered at the start of the project to share thoughts, ideas, needs, and desires for parks in Grandview. Next, a series of focus group meetings were held in-person with other community members and stakeholders. The results of these engagement efforts guided and informed the questions for the statistically valid survey, which was sent to every household in Grandview.
A broad range of targeted and interested parties were engaged in a way that folds their concerns and potential strategies for addressing them into this Plan. The following pages describe the methods used and input received from the community.
IN-PERSON CONVERSATIONS
Focus Groups
A series of conversations were held with elected officials, City staff, key leaders, and stakeholders. Each conversation was guided by a set of questions and participants. A total of 10 participants were engaged in small groups. Responses are shown below using a word cluster to illustrate the key words most commonly used by participants. The larger a word appears the more frequently it was used.
Open House & Pop-Up Events

The City of Grandview along with the consultants hosted an open house for the public in the fall of 2022. Community members could participate in dot-voting boards for amenities and recreation programs that they would like to see in their park system as well as leave comments for desired amenities and issues found in each of the 14 parks in the Grandview Park system. More than 100 Grandview residents participated in this open house.
What are the BEST ASPECTS or STRENGTHS of the park system?
Participants shared that one of the biggest strengths of their park system is the quality of their parks and facilities like the community center. Grandview wants to keep installing new amenities and keep improving their facilties
What are the WEAKNESSES of the park system?
The biggest opportunities identified by focus group participants is to better maintain the parks they have. Maintenace is good, but moving forward, more park and park maintenace staff is desired. Some parks lack good accessibility.
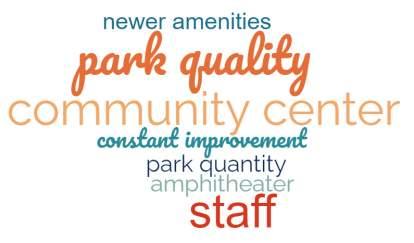
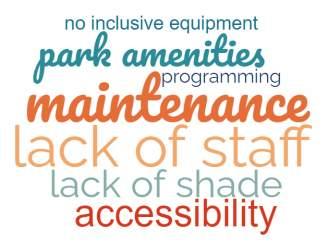
In the next 5 years, should the City focus on improving existing facilities, build new facilities, or both?
Participants shared overwhelmingly that they want to try to improve existing amenities and build new.
101 High Level Maintenance
If you could select one priority for the parks and recreation system, what would it be?
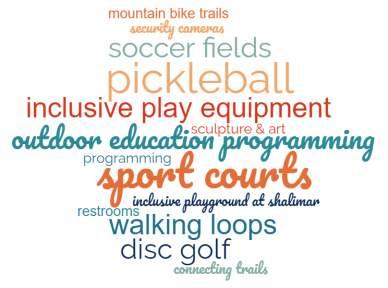
The residents of Grandview would like to see more programming, more staffing, and some connecting trails to parks and other points of interest. Other priorities to be addressed is marketing, accessibility and general infrastructure.
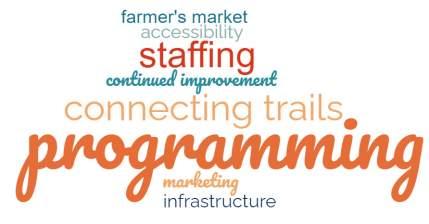
What types of park amenities would you like to see offered that are either currently are not in any parks or could be added to other parks?
Granview's park system could greatly improve by adding some more multi-sport courts, more inclusive play equipment, sports fields, and some outdoor education programs.
In 5 years, what ONE WORD OR PHRASE would you like to be able to use to describe the Grandview Parks system?
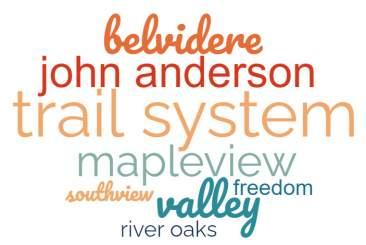
Participants generally want Grandview's park system to have continued momentum, opportunities, and sustainable practices to strive and be the "best in the metro" as the most fun, inclusive, diverse, and beautiful parks.
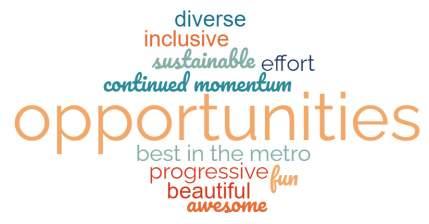
How do you find out about recreation programs and services? Do you have ideas on how the Department can do a better job in creating awareness?
Most Grandview residents hear about parks and rec programs through social media, info boards found in the parks and around the community and the parks and rec community newsletter that is published quarterly.

Which Parks do you feel are most in need of improvements?
Most of the parks are typically in pretty good shape, however, there are a few parks that could use some parking, better accessibility and improved amenities. The amenity Grandview most want to improve is their overall trail system.
Are there any specific recreation programs or activities that you would like to see offered that currently are not?
Generally, participants wanted more robust and generational programming for all users and ages. Basketball, pickleball, and softball leagues (youth & adult could be added. Arts in the park and family games could also be considered.
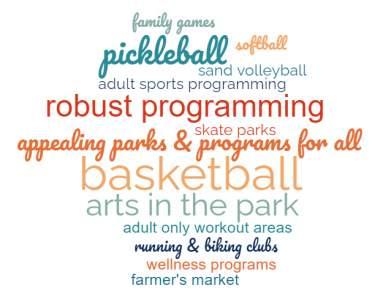
102 High Level Maintenance
Performance Ratings
Stakeholder and Focus Group participants were asked to rate the Park System on performance categories listed below from 1 to 5 (5 being the best). The results below show the average rating for each category.
Quality of Park Amenities
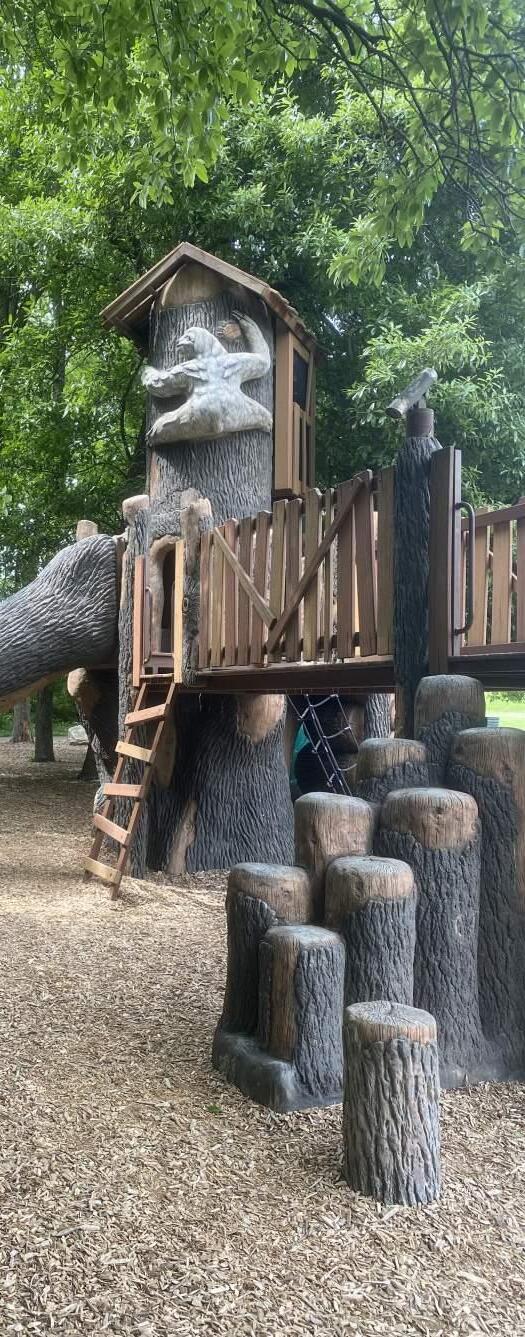
Park System Overall as a Whole
Park Maintenance, Cleanliness, and General Upkeep
Distribution of Parks (locations within the community)
Quality of Recreation Programs
Park Amenities Meet the Needs of the community
Variety of Recreation Programs
Marketing & Communication of Programs & Services
Park safety and security
Number and variety of community events in parks
Accessible amenities for limited mobility patrons
103 High Level Maintenance
4.25 4.25 4.13 4.00 3.69 3.63 3.25 3.25 3.13 3.00 2.88 1 2 3 4 5
Statistically valid survey
PURPOSE
ETC Institute administered a survey for the City of Grandview Parks and Recreation Department during the fall of 2022. The survey helped to determine park and recreation priorities to aid in the development of the parks and recreation master plan.
METHODOLOGY
ETC Institute mailed a survey packet to a random sample of households in the City of Grandview. Each survey packet contained a cover letter, a copy of the survey, and a postage-paid return envelope. Residents who received the survey were given the option of returning the survey by mail or completing it online at GrandviewSurvey.org.
After the surveys were mailed, ETC Institute followed up by sending text messages and mailing postcards to encourage participation. The text messages and postcards contained a link to the online version of the survey to make it easy for residents to complete the survey. To prevent people who were not residents of the City of Grandview from participating, everyone who completed the survey online was required to enter their home address prior to submitting the survey. ETC Institute then matched the addresses that were entered online with the addresses that were originally selected for the random sample. If the address from a survey completed online did not match one of the addresses selected for the sample, the online survey was not counted.
The goal was to complete a minimum of 300 completed surveys from residents. The goal was met with 319 completed surveys collected. The overall results for the sample of 319 households have a precision of at least +/-5.4% at the 95% level of confidence. A copy of the full report can be found in Appendix D containing:
• An executive summary of the survey findings
• Charts showing the overall results of the survey
• Priority Investment Rating (PIR) that identifies priorities for facilities and programs
• Benchmarks comparing Grandview results to National Survey Responses
• Tabular data showing the overall results for all questions on the survey
• Responses from open-ended questions
• A copy of the survey instrument
The ETC Institute developed a Priority Investment Rating (PIR) tool that evaluates the investment that should be placed on the amenity or program that residents give the highest importance. The PIR system was developed to identify the facilities, amenities, and programs that should receive the highest priority for future investment. How to analyze the PRI charts:
High Priority Areas (PIR of 100+). A rating of 100 or above generally indicates there is a relatively high level of unmet need and residents generally think it is important to fund improvements in these areas.
Medium Priority Areas (PIR of 50-99). A rating in this range generally indicates there is a medium to high level of unmet need or a significant percentage of residents generally think it is important to fund improvements in these areas.
Low Priority Areas (PIR <50). A rating in this range generally indicates there is a relatively low level of unmet need and residents do not think it is important to fund improvements in these areas. Improvements may be warranted if the needs of very specialized populations are being targeted.
DEMOGRAPHICS
Overall, the demographic makeup of respondents is representative of the City of Grandview. This suggests that the findings of the survey are generally representative of the community as a whole. The charts below and on the following page illustrate the key demographic backgrounds of respondents as well as how they compare to the overall demographic makeup of the City.
104 High Level Maintenance
Respondents' # of Years Lived in Grandview 18% 30% 20% 12% 13% 7%
0-5 years
years
years
years 21-30 years 31+ years
6-10
11-15
16-20
USE, BARRIERS, & RATINGS
USE: Eighty-three percent (84%) of respondent households indicated they had visited one of Grandview's city parks in the past year. The frequency that these households visited the parks were;
• 9% visited almost daily
• 19% visited a few times per week
• 11% visited at least once per week
• 27% visited a few times per month
• 16% visited a few times per year
• 2% visited once per year
PARK USE: Respondent households were given 14 facility options to rank their park use. Below is a chart of overall usage.
Larger community facilities were the most commonly visited such as the Grandview Community Center, Meadowmere Park and John Anderson Park.
Of this same list of facilities household respondents ranked their need for improvement. The top five priorities for improvements are:
1. Meadowmere Park (44%)
2. Grandview Community Center (41%)
3. John Anderson Park (28%)
4. Tails & Trails Dog Park (23%)
5. River Oaks Park (16%)
105 High Level Maintenance % of Total Grandview Population % of Total Survey Respondents 65+ 16% 21% 55-64 21% 45-54 11% 20% 35-44 13% 20% 18-34 19% AGE OF RESPONDENTS COMPARED TO CITY 12% 26% < $30K 24.7% 20.8% $30K-$59,999 26.7% 32.0% $60K-$99,999 23.9% 27.6% $100K-$149,999 12.9% 16.4% $150K-$199,999 4.9% 2.8% $200K+ 2.0% .4% INCOME OF RESPONDENTS COMPARED TO CITY % of Total Grandview Population % of Total Survey Respondents GENDER OF RESPONDENTS COMPARED TO CITY City Survey Male 48% Male 49% Female 52% Female 51%
Grandview Community Center Meadowmere Park John Anderson Park Tails & Trail Dog Park River Oaks Park Little Corner Park Southview Park Bobcat Park Shalimar Park Terrace Park Belvidere Park Mapleview Park Freedom Park Valley Park 56% 52% 36% 23% 16% 16% 14% 11% 11% 9% 8% 3% 3% 2% Ages Living in Households of Respondents (including respondent) Under 5 5-9 10-14 15-19 55-64 65-74 75+ 45-54 35-44 20-24 25-34 7% 6% 6% 8% 5% 9% 12% 13% 16% 10% 7%
BARRIERS: Respondent households were given ten (10) potential reasons that prevent them or members of their household from using parks and facilities in Grandview more often. The top three barriers to respondents use of parks were:
• Safety or Security Concerns (33%)
• Amenities offered don't match my interests or needs (24%)
• Lack of age-appropriate amenities (21%)
RATINGS: Of the residents that have visited any of the Grandview parks or facilities in the past year, 9% rated the overall quality as excellent, 56% rated the overall quality as good, 28% rated the overall quality as fair, and 7% rated the overall quality as poor.
SATISFACTION
The existing park facilities and services with the highest level of satisfaction, based on the sum of “very satisfied” and “satisfied” responses among residents who had an opinion, were: distribution of parks (87%), park maintenance/cleanliness/ general upkeep (82%), and the park system overall as a whole (74%). Respondents were asked for their level of satisfaction of each of the following items regarding park facilities.
106 High Level Maintenance
Very Somewhat Somewhat Very Satisfied Dissatisfied Park Maintenance, Cleanliness, and General Upkeep 13% 5% 63% 19% Park System Overall as a Whole 21% 5% 65% 9% Quality of Park Amenities 23% 5% 59% 13% Quality of Recreation Programs 27% 9% 51% 14% Park Amenities Meet the Needs of the Community 34% 5% 53% 8% Park Safety & Security 27% 12% 51% 10% Number & Variety of Community Events in Parks 33% 7% 47% 13% Variety of Recreation Programs 37% 8% 44% 11% Marketing & Communication of Events & Activities 37% 10% 43% 9% Accessible Amenities for Limited Mobility Patrons 35% 14% 44% 8% Distribution of Parks (Locations within the community) 68% 19% 9% 4% Very Somewhat Somewhat Very Satisfied Dissatisfied Bobcat Park 20% 10% 70% Freedom Park 10% 64% 26% Southview Park 12% 64% 24% Terrace Park 14% 71% 14% Mapleview Park 22% 47% 31% Little Corner Park 22% 48% 30% Shalimar Park 27% 46% 27% River Oaks Park 29% 9% 51% 11% Grandview Community Center 43% 49% 9% Tails & Trails Dog Park 20% 47% 32% 1% John Anderson Park 13% 57% 28% 2% Valley Park 8% 44% 46% 2% Meadowmere Park 9% 49% 42% 1%
Respondents were asked for their level of satisfaction with each of Grandview's park facilities. The highest rated are the two community gathering locations: Grandview Communtiy Center and Meadowmere Park which houses the Grandview amphitheater. The highest rated parks were Meadowmere (91%) and Freedom (90%). The lowest rated were Bobcat (70%) and River Oaks (61%).
AMENITY NEEDS, IMPORTANCE, & PRIORITIES
Facility Needs: Respondents were asked to identify if their household had a need for 32 park amenities and to rate how well their needs for each were currently being met. The five park amenities with the highest percentage of households that have an unmet need were:
1. Restrooms
2. Family games
3. Fishing pond/lake
4. Nature/hiking trails
5. Natural areas for passive recreation & wildlife benefits
Importance: In addition to assessing the needs for each park amenity, ETC Institute also assessed the importance that residents placed on each amenity. Based on the sum of respondents’ top five choices, the most important park amenities to residents were:
Based on the PIR, the following five park amenities were rated as high priorities for investment:
• Nature / hiking trails (PIR=178)
• Restrooms (PIR=166)
• Paved trails (PIR=154)
• Natural areas for passive recreation & wildlife benefit (PIR=146)
• Family games (PIR=138)
The chart below shows the PIR for each of the 32 park amenities that were rated.
Priorities: The Priority Investment Rating (PIR) was developed by ETC Institute to provide organizations with an objective tool for evaluating the priority that should be placed on Parks and Recreation investments. The PIR equally weighs:
(1) The importance households place on an amenity
(2) How many households have unmet needs for the amenity
107 High Level Maintenance
HIGH PRIORITY (100+) LOW PRIORITY (0-49) Skate park Picnic shelters 86 Dog parks Outdoor basketball courts Splash pad Camping areas Soccer fields (for youth) Outdoor volleyball courts Unprogrammed green space Mountain biking trails Outdoor amphitheater/event space Outdoor tennis courts Extreme fitness/ninja warrior course Outdoor pickleball courts Youth Baseball & Softball Fields Bicycle pump tracks Outdoor educational spaces Disc golf courses Horseshoe pits Soccer fields (for adults) Adult Baseball & Softball Fields Outdoor Classroom Space 85 77 57 74 48 68 46 67 44 65 41 63 37 63 35 60 35 25 24 19 MEDIUM PRIORITY (50-99) Priority Investment Ratings - Park Amenities Nature / Hiking Trails Family games 178 166 120 154 106 146 100 138 87 87 Restrooms Fishing pond/lake Paved Trails Community gardens Natural Areas Site furnishings Outdoor fitness areas Playgrounds 18 34% Nature/hiking trails Restrooms Paved trails Dog parks Natural areas for passive recreation & wildlife benefit 28% 23% 22% 18% 34%
PROGRAM NEEDS, IMPORTANCE, & PRIORITIES
Program Needs: Respondents were asked to identify if their household had a need for 34 programs and activities and to rate how well their needs for each were currently being met. The five park programs with the highest percentage of households that have an unmet need were:
1. Adult fitness & wellness programs
2. Senior health & wellness programs
3. Community special events
4. Cultural enrichment programs
5. Water fitness programs/lap swimming
Importance: In addition to assessing the needs for each park amenity, ETC Institute also assessed the importance that residents placed on each recreation program. Based on the sum of respondents’ top five choices, the most important recreation programs to residents were:
expanding older adult populations.
• The prioritization of multi-use trails and low impact fitness opportunities to maintain a healthy community.
• Respondents value both outdoor and indoor opportunities for recreation and community gathering.
• Both a senior center and teen center placed within the highest priorities.
The chart below shows the PIR for each of the 34 program and activities that were rated.
Based on the PIR, the following five programs and activities were rated as high priorities for investment:
• Adult fitness & wellness programs (PIR=200)
• Community special events (PIR=140)
• Senior health & wellness programs (PIR=125)
• Outdoor water recreation (PIR=99)
• Water fitness programs/lap swimming (PIR=95)
As the city looks to update their parks this will help serve as a guide to what the community is looking for, with trails of all sorts being the number one priority. Other desired amenities are indoor fitness facilities, community gardens, picnic shelters, and playgrounds.
• These priorities are consistent with similar regional trends for communities that have
108 High Level Maintenance 35
LOW PRIORITY (0-49) eGaming/eSports Recreation/competitive swim team Programs for at-risk youth/crime preven. 73 Senior nutrition programs After school programs for youth Leadership/prof. development Senior trips Youth visual arts/crafts/P.A. Programs relating to history Youth performing arts programs Swim lessons Programs for youth with special needs Gymnastics/tumbling programs Youth fitness & wellness classes Programs for adults with special needs Youth summer programs & camps Teen/tween programs Child watch at Community Center Adult sports leagues Youth sports programs & camps Preschool programs/early childhood Virtual programs Birthday parties Tennis lessons & leagues 68 63 48 62 47 54 44 54 43 53 42 52 42 49 41 48 40 40 37 36 32 MEDIUM PRIORITY (50-99) Priority Investment Ratings - Recreation Programs Adult fitness & wellness Water fitness programs/lap swimming 200 140 93 125 90 99 85 95 84 79 Community special events Cultural enrichment programs Senior health & wellness Senior resource, info, & service coord. Outdoor water recreation Outdoor environ./nature camps Senior educational programs STEAM classes 36 30 HIGH PRIORITY (100+)
Adult fitness & wellness programs Outdoor water recreation Community special events Senior resource, information, & service coordination Senior health & wellness programs 27% 20% 14% 13% 40%
ADDITIONAL FINDINGS FACILITY INFORMATION
73% Of respondents feel that it is very important for the City to provide high quality park facilities. Among the barriers to current park use, safety was one of the most common issues.
PROGRAMING INFORMATION
Respondents were asked to indicate how they received information regarding parks programing. The most common responses included the city recreation guide (43%) and the city newsletter (42%).
Alternatives or additions to these print mediums might need to be explored as 34% of respondents claimed the reason they don't attend park programing is because they are unaware of them. Another 35% of people say that they do not attend programs because the times are not convenient and 31% said that fees are too high.
CONCLUSION
Respondents were asked their level of agreement with the importance of various Parks and Recreation Department priorities over the next ten years. Ninety-eight percent (98%) who had an opinion either were "very satisfied" or "satisfied" that updating existing park amenities that are aging and in poor condition throughout the park system is a top priority for the Parks and Recreation Department.
To ensure that the City of Grandview continues to meet the needs and expectations of the community, based on our PIR Analysis, ETC Institute recommends that the Department sustain and/or improve the performance in areas that were identified as High Priority Areas (by the PIR). The ratings for parks and recreation amenities and programs/activities are listed below.
Amenity Priorities
• Nature / hiking trails (PIR=178)
• Restrooms (PIR=166)
• Paved trails (PIR=154)
• Natural areas for passive recreation & wildlife benefit (PIR=146)
• Family games (PIR=138)
Program Priorities
• Adult fitness & wellness programs (PIR=200)
• Community special events (PIR=140)
• Senior health & wellness programs (PIR=125)
• Outdoor water recreation (PIR=99)
• Water fitness programs/lap swimming (PIR=95)
109 High Level Maintenance
05 Action Plan
Action Plan
The purpose of this Plan is to provide a communitysupported comprehensive Parks Master Plan to guide future development and redevelopment of the City's parks, open space, and trails. The purpose of this chapter is to identify a set of goals based on identified community priorities. Also included in this chapter is a reference list of general costs for various typical park improvements that can then be used for planning and budgeting purposes.
Input from the Grandview community was solicited in a variety of ways throughout this planning process. In total, 380 interactions from the community provided guidance on development of this plan. The ways in which the public participated and the number
participants are listed below:
Park Amenities
1. Nature/hiking trails.
2. Restrooms.
3. Paved Trails.
4. Natural areas for passive recreation & wildlife.
5. Family Games.
6. Fishing pond/lake.
7. Community Gardens.
8. Site furnishings (benches, picnic tables, etc.).
Recreation Programs
1. Adult fitness & wellness.
2. Community special events.
Table 12 below illustrates the similarities in findings across different public engagement efforts. The systemwide priorities that are most important to the community were generally consistent.
The following pages identify goals and tasks for the Department over the next 10 years. These goals are driven by input obtained primarily from residents, City staff, Parks Advisory Board, Steering Committee, and professional recommendations from the consultant team. This Plan also relates to other City planning documents namely the Grandview 2030 Comprehensive Plan and the Go Grandview Walking and Biking Strategy.
While described separately, these goals build on and support each other. Future allocation of resources towards these endeavors should be commensurate with the growth of Grandview and the interests of its citizens. The following goals are explained in more detail in the following pages:
1. Update aging amenities.
2. Enhance trail networks.
3. Improve the perception of security in parks.
4. Elevate recreation program services.
Based on the results of the statistically valid survey, the following park amenities and recreation programs were identified as having a high level of priority (PIR rating greater than 100) for future investments. Residents generally think it is most important to fund these improvements. Improvements in these areas are likely to have a positive impact on the greatest number of households:
5. Add new park amenities.
111 High Level Maintenance
of
In-Person Participants 209 Statistically Valid Survey 319
In Person Statistically Valid Survey Recreation Programs Connecting Trails Staffing Continued Improvement Infrastructure & Accessibility Update Aging Amenities Enhance Trails Recreation Programming Security in Parks New Amenities
Table
12 - Comparison of Engagement Results.
Goal #1
Update Aging Amenities:
The #1 priority identified by the community is to update existing park amenities that are aging and in poor condition. Below is a list of key park amenities that are in the poorest conditions and should be a priority for restoration or replacement. Stagger replacements over the years to spread out future depreciation.
PICNIC SHELTERS, PAVILIONS & RESTROOMS
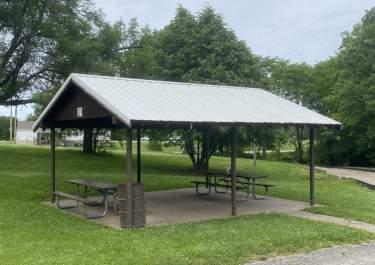
1. John Anderson Park (large pavilion)
2. Tails & Trails Dog Park (shelters)
PLAYGROUNDS
1. Belvidere Park (equipment & surfacing)
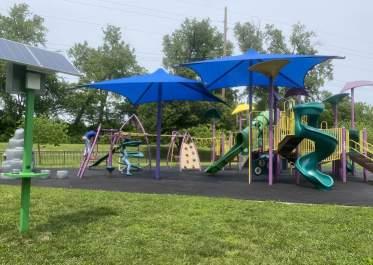
2. Freedom Park (swings)
3. John Anderson Park (equipment & surfacing)
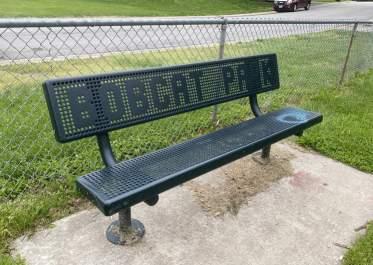
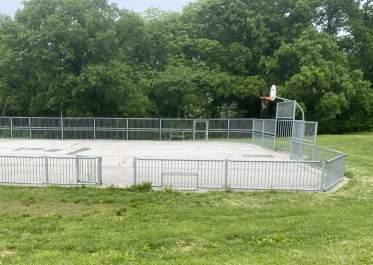
4. Little Corner Park (swingset & surfacing)
5. River Oaks Park (equipment & surfacing)
ATHLETIC FIELDS
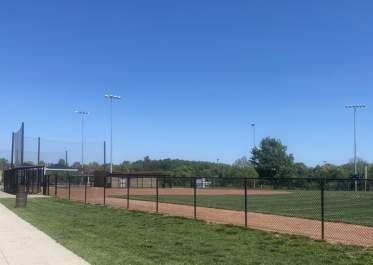
1. John Anderson Park (soccer fields)
SITE FURNISHINGS (Benches, Tables, Grills, Drinking Fountains)
1. Valley Park (drinking fountain)
2. Bobcat Park (trash receptacles)
3. Little Corner Park (benches)
TRAILS
1. John Anderson Park
2. Mapleview Park
3. Southview Park
4. Belvidere Park
NATURAL AREAS
1. Valley Park (drainage way)
2. Mapleview Park (bioswale)
3. Southview Park (riparian corridor)
STREAM CROSSINGS
1. Belvidere Park (low water crossing & bridge)
2. John Anderson Park (bridges)
3. Mapleview Park (bridge)
112
PICNIC SHELTERS
PLAYGROUNDS
SPORT COURTS
ATHLETIC FIELDS
SITE FURNISHINGS
Goal #2
Enhance Trail Networks
Challenges for walking and biking in Grandview

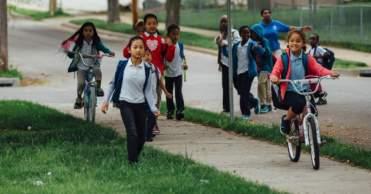
Most streets and several key corridors in Grandview have no sidewalks
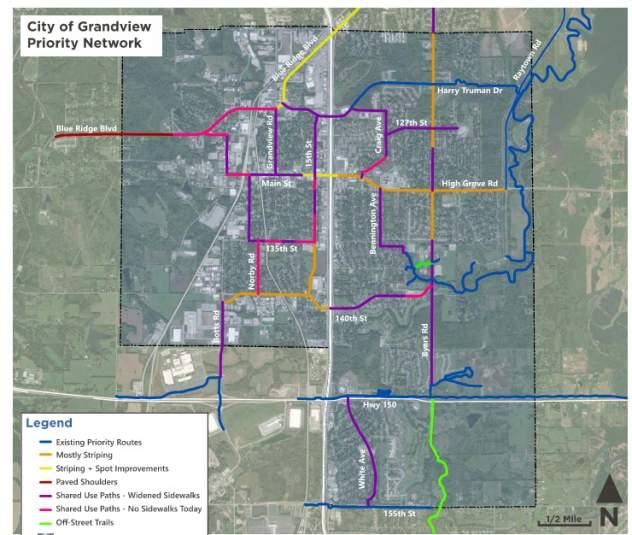
Highway-like conditions on major streets are uncomfortable for people walking and biking and discourage people spending time in retail districts.
Interstate 49 is a Major east-west barrier with few comfortable crossings.
Many destinations and services are oriented to highway frontage roads with no walking or biking infrastructure.
Regional trails including Longview Lake and Blue River are poorly connected to Grandview destinations.
There are few safe and comfortable connections to the many destinations surrounding Grandview.
Narrow railroad underpasses create safety issues and limit opportunities for connectivity.
The 2nd most important systemwide priority identified by residents is to enhance the paved trail experiences. Improve pavement conditions as necessary, expand connections, and add more benches along trails. In August of 2021 the City completed its first ever walking and biking strategy "Go Grandview". This document identified Grandview's priority walking and biking network and individual project segments. Continue to make strides towards implementation of this plan. Grandview's Priority Network focuses on the following:
• Provide Comfortable and Convenient Connections Across Interstate 49
• Link Downtown Grandview to Regional Trail Connections
• Make Community Destinations More Accessible
• Establish a Network that Serves All Parts of the Community
• Provide New Amenities that Add Value and Enhance Quality of Life
• Leverage Recent Improvements to Minimize Cost and Maximize Coverage
• Achieve an ADA Compliant Network for All Ages and Abilities
Balance the expansion of the citywide priority network with improvements to existing trails within parks. Expand trails within parks as feasible and demand warrants. Enhance the user experience by adding benches and other features (drinking fountains, art, and lighting, etc.) where feasible along them. Provide mile markers and a trail map and wayfinding signage to points of interest at key locations.
113
Goal #3
Improve the percecption of security in parks:
Survey respondents identified improving the perception of safety and security in parks as the 3rd most important priority for the Department. 33% of respondents indicated safety and security as the reason that prevents them/their household from using parks in Grandview or using them more often. Comparatively speaking, this is 23% higher than the national average (10%).
Improving the perception of safety and security in parks requires a multifaceted approach with dedicated resources and active support from city leaders, other city departments, and the community. Many efforts have already been made by the City and those efforts should continue to be expanded and strengthened, to the extent possible. Approach improving the perception of security in parks through design, programming, maintenance, and citizen involvement. Utilize and expand on the following strategies:
DESIGN - To the extent possible implement design recommendations provided in this Master Plan. Start by removing, replacing, or rejuvenating park amenities in the poorest condition. Consider the installation of additional surveillance cameras and additional lighting in parks with the highest use. To the extent possible ensure parks have clear site lines, good accessibility, and amenities that attract users.
PROGRAMMING - Increase usage of parks through programming and events. Develop and implement more programs, activities, and events in parks. Include evening events such as movies in the park and other family oriented activities. Continue to collaborate with police and fire departments and seek out other partners interested in holding activities and events in parks to increase activity in a positive manner. Expand the development of interactive programs that build relationships and strengthen bonds within the community.
MAINTENANCE - Continue to work with City Council to ensure that staffing and funding levels are adequate to support the expectations of the community and meet the Department's mission.
CITIZEN INVOLVEMENT - Continue to work with Neighborhood Associations, clubs, churches, and other organizations to increase park usage and encourage a sense of ownership and pride. Facilitate tours and hold events that encourage more widespread use.
The Grandview police department has a Community Oriented Policing philosophy that encourages input fro the community on law enforcement and quality of life issues. "Move toward the badge" is the Department's proactive community engagement initiative aimed at positive circustances to build trust. The Department strives to establish a climate of mutual respect and trust through positive interaction with citizens of the community. The Move Toward the Badge program involves all officers participating in community engagement on a regular basis including teaching classes, hosting events, ride-alongs during routine patrols, party attendance, reading stories to children, volunteering, etc. In less than one year Grandview police officers reached more than 13,500 people within the community through a variety of community support projects.
A Closer Look
PARK PROGRAMMING AND BETTER HEALTH - NRPA FACT SHEET
` "Research shows that recreation programs in parks can change the way that people interact with their environment. By providing the community with ways to get involved with and stay invested in its green spaces, effective park programming brings many benefits to health and wellbeing for residents.
The Facts
• Today, 70% of parks and recreation agencies offer programs targeted at senior citizens, and the average agency serves over 160 seniors annually.
• More than 50% of agencies administer community garden programs. Nearly 25% of agencies administer or manage farmers’ markets, and 63% rent or permit space for people to grow healthy foods.
• When Boston made park health programming highly visible by hiring veterans to teach free health classes in 18 city parks a year, park attendance dramatically increased during the summer months.
• In Los Angeles, 38% of residents said they got most of their exercise by using parks and parks programming.
• Neighborhood parks have the potential to function as a nucleus of neighborhood activity, where residents can gather for social events, recreational activities, and meetings about community issues, increasing social interaction.
• Neighborhood parks contribute substantially to moderate to vigorous physical activity. This contribution may depend less on size and facilities and more on “demand goods” – programming and activities – that draw users to a park.
• Having events at the park, including sports competitions and other attractions, appears to correlate the strongest with park use and community-level physical activity.
Goal #4
Elevate Recreation Programming Services:
Programming
• Add more adult programming to more evenly match the community demographics.
• Add enrichment/general interest as an alternative to sports programming.
• Evaluate the ability to lower fees to attract more participants.
• Offer specific open gym days/times for youth, teens, and adults and advertise.
• Reduce program offerings, eliminating those that are not successful after three seasons.
• Seek out new programming opportunities to address the mental health needs of the community such as mindfulness, tai chi, and stress relief.
• Review trends report to determine which trending programs might be relevant to Grandview.
Program Evaluation
• Create a system where programs are evaluated on a regular basis and share results.
• Ask for feedback regarding programming needs from fitness members.
• Evaluate the success of programs at the end of each season comparing courses offered to courses cancelled and participant satisfaction.
• Start to monitor program cancellation rates to maximize program planning efforts, efficiently market programs, and meet the needs of more participants. After tracking for a year, set annual goals to reduce the cancellation rates.
Staffing
• Create team building opportunities for the staff.
• Work on providing a healthy work/life balance for all team members.
• Create growth opportunities for staff to improve retention.
• Add full-time staff positions to add to the program menu.
Facility
• Evaluate the best and most efficient use of facility space that will generate increased participation –consider renovating spaces that are not used to capacity.
Goal #5
Add New Park Amenities:
Residents identified adding new park amenities as a top 5 priority. Based on survey responses 8 amenities were identified as being high priority investment opportunities. The following is a list of those amenities and park locations where those amenities are most needed or could be considered:
1. Nature/Hiking Trails:
• Valley Park
• Mapleview Park
• Shalimar woodland preservation area
2. Restrooms:
• Tails & Trails Dog Park
• Southview
• River Oaks
• Belvidere
• John Anderson
3. Paved Trails:
• Go Grandview
• Oil Creek Trail - Hwy 150 to 155th St.
• Community Center Connector
• Meadowmere
• Southview
• Dog Park creek crossing to Meadowmere
• Valley
4. Natural areas for passive recreation & wildlife:
• Valley
• Meadowmere
• Terrace
• Southview
• River Oaks
• Mapleview
• Shalimar woodland preservation
5. Family Games:
• Belvidere
• Bobcat
• Freedom
• Little Corner
• Mapleview
• River Oaks
• Southview
6. Community Gardens:
• John Anderson
• Meadowmere
7. Site Furnishings:
• Bobcat
• John Anderson
• Little Corner
• Tails & Trails Dog Park
•
GENERAL CAPITAL COSTS:
The following is a list of planning level costs to install typical park amenities. This table can be used as a tool to evaluate and budget for new improvements. Costs assume product and installation by a contractor. Where the City has the capacity to install amenities themselves, costs may be much lower. The City can also save costs by purchasing equipment and materials directly through cooperative purchasing companies such as Greenbush. Operational costs are not included but should also be considered.
116 High Level Maintenance
Terrace
PARK AMENITY BUDGET COSTS Picnic Shelter $85-$100/Sq. Ft. Playground (w/o surfacing) $50-$100 / Sq. Ft. Playground Surfacing $10- $20 / Sq. Ft. Basketball Court $25-$30 / Sq. Ft. Pickleball Court $25-$30 / Sq. Ft. Paved Trail (8'-10' wide) $100-$125 / LF Hiking Trail (earth) $3-$5 / LF Hiking Trail (mulch) $5-$7 / LF Pedestrian Bridge $1,000-$1,200 / LF Benches, picnic tables, Trash Receptacles $1,200 - $3,000 Each Drinking Fountain $6,000
Concrete Restroom (Small 2 Unisex Rooms; not
utilities) $80,000 - $125,000
Prefabricated
including
$4,500
Trees
cal. b&b)
Trees (2" cal. b&b) $400 / each Concrete Cornhole Set $1,500-$2,000 Connect 4 Outdoor Game $6,000 - $6,500 Ladder Toss Outdoor Game $1,000 - $2,000 Ping Pong (outdoor) $6,000-$6,500
Seeding (Cool Season) $2,500 / Acre Seeding (Natives)
/ Acre Shade
(2"
$500 / each Flowering/Fruit
CAPITAL NEEDS BY PARK:
The following opinion of costs were determined based on recommendations for each park and is provided for reference in determining annual budgets and future capital improvement plans.
PARK
BOBCAT PARK
FREEDOM PARK
117 High Level Maintenance
A Short-Term: B Mid-Term: C Long-Term: $4,191,000 $4,063,500 $2,257,500 Total Needs: $10,512,000 Annually (10-Years): $1,051,200 A Loop Trail with Interpretive Signage $35,000 B Parking Lot Islands $25,000 B Picnic & Family Games Area $15,000 B Replace Swings $6,500 B New Fencing $10,000 B Shade Trees $4,000 $95,500
A Add play equipment for ages 2-5. $30,000 A Consider a small shelter (16'x20'). $60,000 A Plant large canopy shade trees. $2,000 A Add family games. $5,000 A Update trash receptacles. $2,500 $99,500
A ADA Parking on 147th $50,000 A Add Park Sign on 147th $5,000 A Repave 1,300' of Asphalt Trail $91,000 A Update Playground $250,000 A Add Lighting to Fuller Ave. Parking $6,500 B Pedestrian Bridge $30,000 B Repave Fuller Ave. Parking $75,000 C Expand Asphalt Trail (500') $35,000 $542,500 BELVIDERE
JOHN ANDERSON PARK
LITTLE CORNER PARK
MAPLEVIEW PARK
118 High Level Maintenance
A Repave Trails & Parking Lot $150,000 A Family Games $5,000 A Additional Benches Around Loop Trail $10,000 A Nature Trail Walking Loop $5,000 B Picnic Shelter (24'x36') $85,000 B Add Nature Play $25,000 C Update Play Equipment and Surfacing $400,000 C Implement a Bioswale $250,000 C Additional Southern Parking Lot $50,000 C Basketball Court $120,000 C Fitness Stations $100,000 $1,200,000
A Add Site Furnishings $4,000 A Add a Small Shelter (16'x20') $60,000 A Replace and Relocate Entry Sign $5,000 A Replace Swings $15,000 B Add Nature Play $20,000 $104,000
A Disc golf course $15,000 A New shelter (24'x36') $75,000 A Family games $2,500 A Update Bridges $5,000 A Update Shelters $10,000 B Pickleball courts (2) $80,000 B Expanding trail network $400,000 B Update playground $250,000 B Splashpad equipment $300,000 C Expand playground $200,000 B Sand volleyball court $8,000 C Parking at NW Shelter $30,000 C Basketball court $80,000 $1,455,500
MEADOWMERE PARK
RIVER OAKS PARK
SHALIMAR PARK
119 High Level Maintenance
A Farmer's Market Permanent Structure $600,000 A Paved Farmer's Market Parking Lot $300,000 A E-bike Station $3,000 A 9-Hole Disc Golf Course $15,000 B Sand Volleyball Court $15,000 C Amphitheater Playground $200,000 C Outdoor Basketball Courts $200,000 C Additional Trail Connections $580,000 C Pedestrian Crossings (Byars Rd.) $4,000 C Native Prairie Landscape $350,000 $2,267,000
A Baseball/Softball Field (300' foul line) $500,000 A Soccer Fields (225'x360') $750,000 A Outdoor Batting Cages (10) $50,000 A New Sidewalks & Paved Trails $250,000 A Parking Lot Extension $350,000 A Shade Trees $16,000 A Woodland area nature trails $10,000 B Small Playground $200,000 B Extend Fencing $25,000 C Native Prairie Seeding & Enhancements $9,000 C Nature Loop Trails $5,000 $2,165,000
B Repave and Extend Trail Connections $90,000 B Expand the Playground $350,000 B Vehicular Access and Small Parking Lot $22,000 B Park Sign $5,000 B Add a Fence to Buffer Vehicular Access $8,000 C Adjacent Property Acquisition $475,000
SHOOTING RANGE PARK
SOUTHVIEW PARK
TAILS & TRAILS PARK
TERRACE PARK
120 High Level Maintenance
A Archery Range $5,000 C Loop Trail $60,000 C Picnic Shelter $120,000 C Trees $4,500 C Parking lot reduction & resurfacing $30,000 C Stormwater green solutions $150,000 C Showcase Native Pollinator Garden $750,000 $1,119,500 A Park Sign $15,000 B Trail Connections $280,000 B Small Parking Lot with ADA Stalls $25,000 B Bridge Connections $110,000 B Small Gazebo $40,000 B Creek Bank Stabilization $30,000 B Limestone Steps Down to Creek Edge $5,000 B Playground and Surfacing Replacement $250,000 $755,000 A Dog Wash Station $5,000 A Gravel Entry Points $5,000 A Agility Course Amenities $10,000 A Shade Trees $8,500 C Park Shelter (16'x24') $60,000 C Shade Structures (24'x36') & Benches $160,000 C Trail Connection to Meadowmere Park $100,000 C Auxiliary Pens $35,000 $383,500 B Playground Expansion $250,000 B Sidewalk Connections $25,000 B Cornhole $5,000 B Add site furnishings $15,000 B Small Shelter (16'x20') $40,000 $335,000
VALLEY PARK
121 High Level Maintenance
B Additional Paved Trails $70,000 B Bank Stabilization $20,000 C Northern Access & Parking Lot $75,000 C Mountain Bike Trails $15,000 C 18-Hole Disc Golf Course $40,000 C Ninja Obstacle Course $200,000 C Small Event Plaza $25,000 $445,000
TABLE OF CONTENTS
a. Statistically Valid Survey Report
B. Public Engagement Results
appendix
a Appendix
Statistically Valid Survey Report
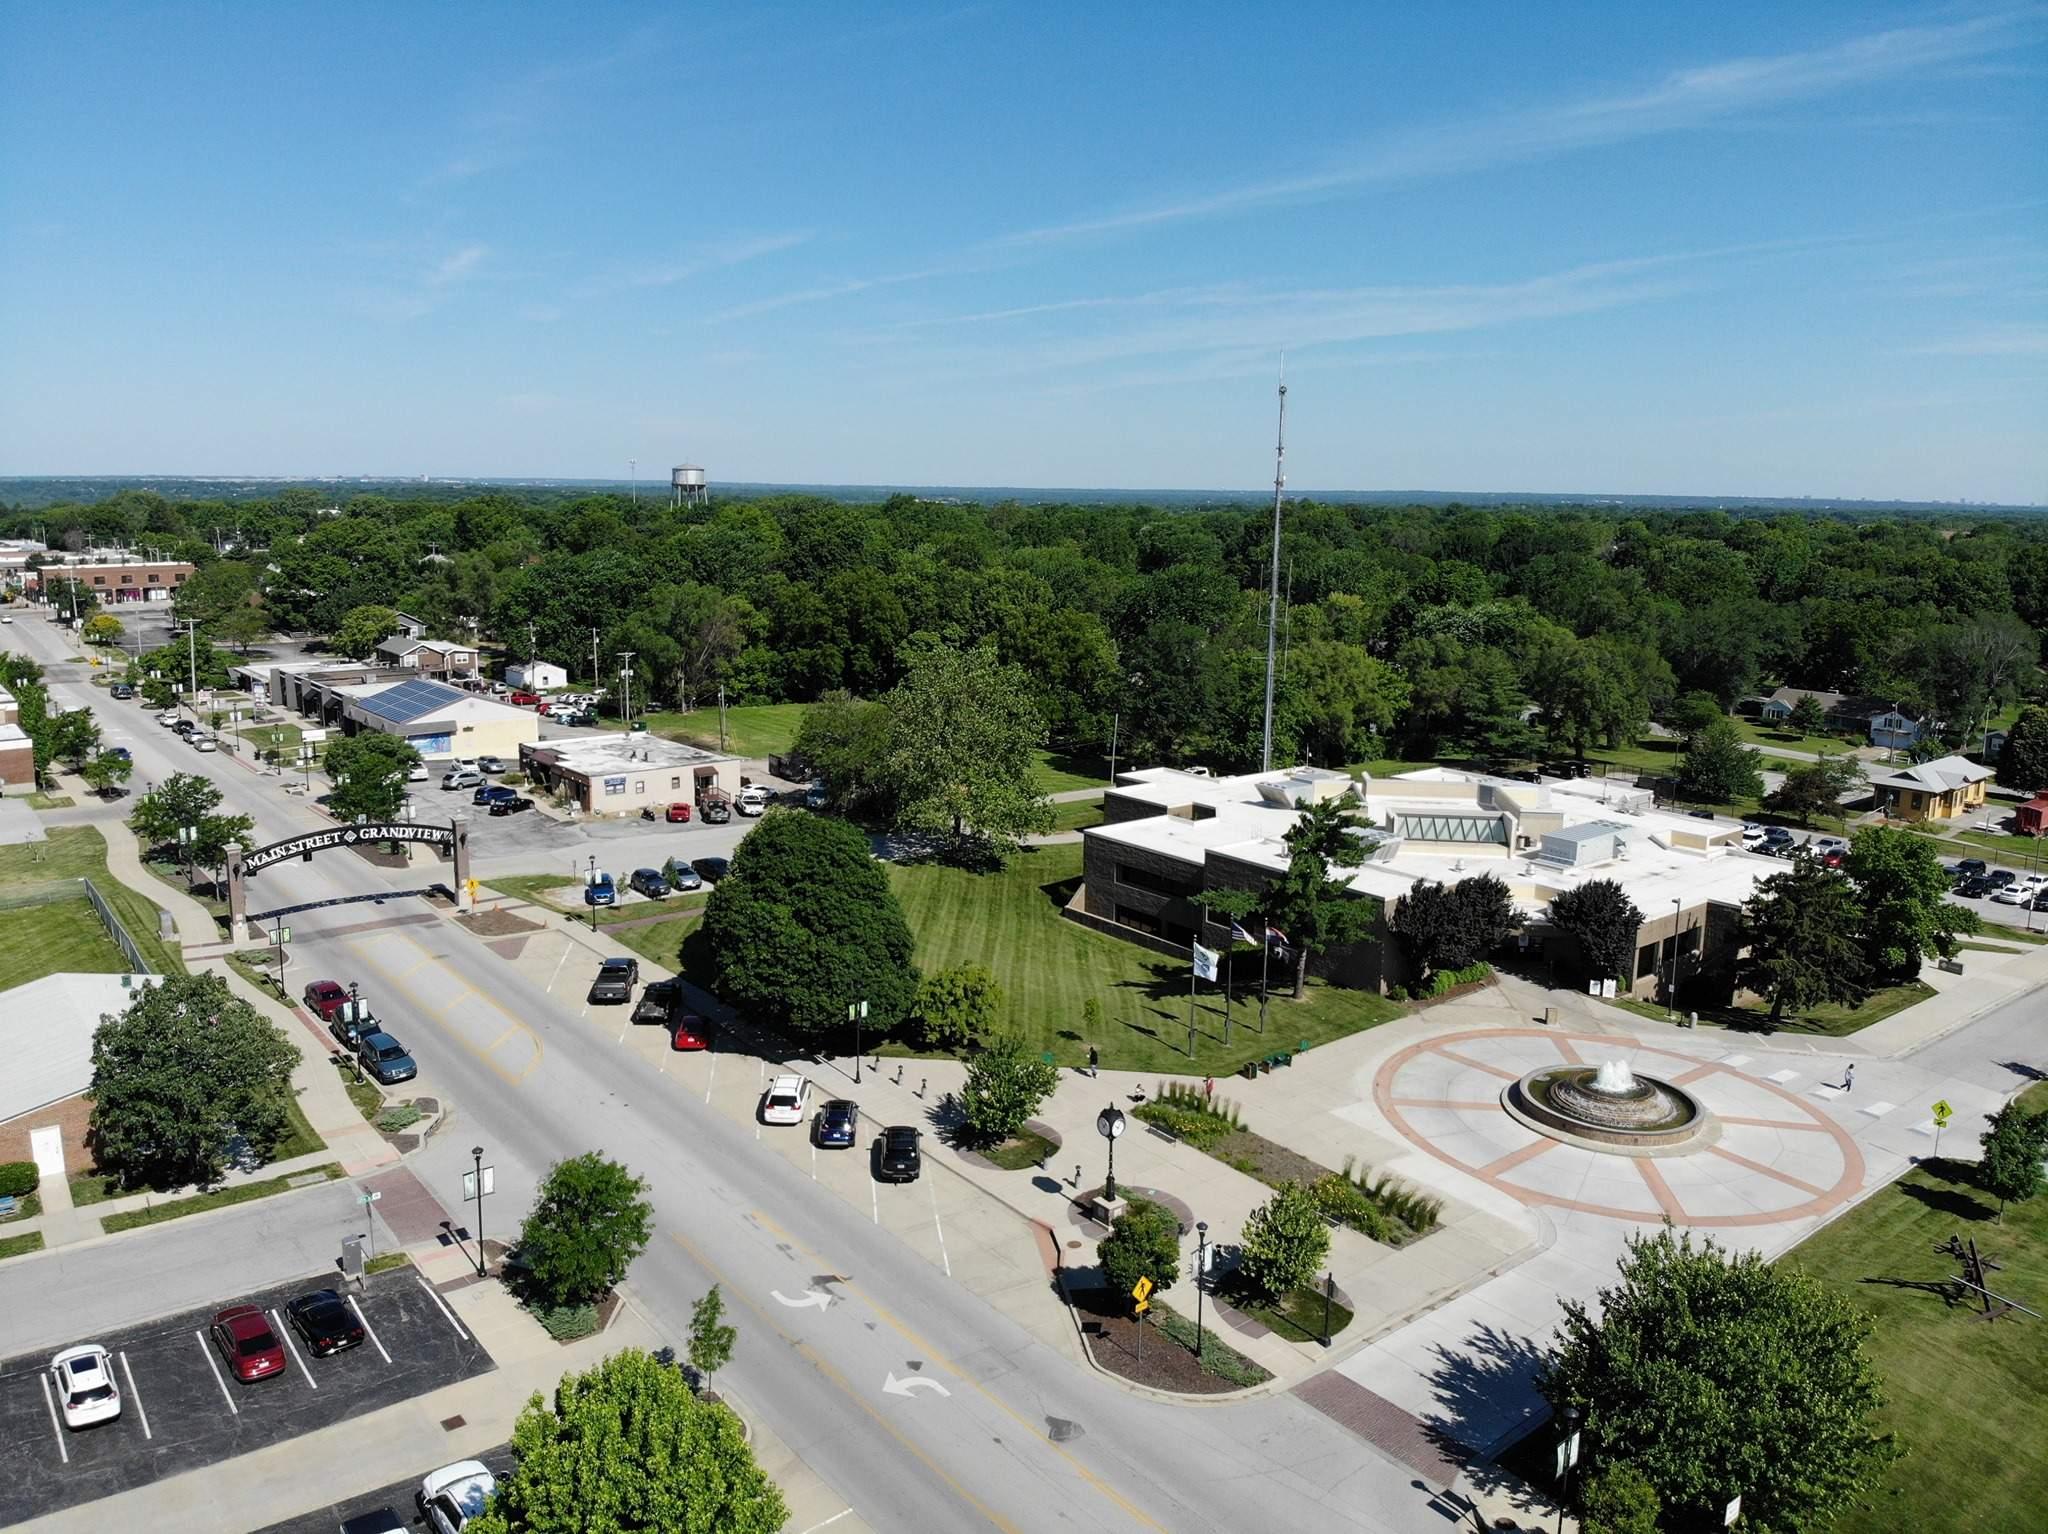


2022
Report City of Grandview, Missouri Parks and Recreation Survey
Findings


Contents Section 1: Executive Summary............................... 4 Section 2: Charts and Graphs............................... 14 Section 5: Tabular Data...................................... 64 Section 3: Priority Investment Rating .................. 47 Section 6: Open-Ended Responses...................... 101 Section 7: Survey Instrument............................ 115 Section 4: National Benchmarks.......................... 55
1 Executive Summary

2022 City of Grandview Parks and Recreation Survey Executive Summary
Overview
ETC Institute administered a survey for the City of Grandview Parks and Recreation Department during the months of fall 2022. The survey will help the City of Grandview determine park and recreation priorities to aid in the development of the parks and recreation master plan.
Methodology
ETC Institute mailed a survey packet to a random sample of households in the City of Grandview. Each survey packet contained a cover letter, a copy of the survey, and a postage‐paid return envelope. Residents who received the survey were given the option of returning the survey by mail or completing it online at GrandviewSurvey.org.
After the surveys were mailed, ETC Institute followed up by sending text messages and mailing postcards to encourage participation. The text messages and postcards contained a link to the online version of the survey to make it easy for residents to complete the survey. To prevent people who were not residents of the City of Grandview from participating, everyone who completed the survey online was required to enter their home address prior to submitting the survey. ETC Institute then matched the addresses that were entered online with the addresses that were originally selected for the random sample. If the address from a survey completed online did not match one of the addresses selected for the sample, the online survey was not included in the final database for this report.
The goal was to complete a minimum of 300 completed surveys from residents. The goal was met with 319 completed surveys collected. The overall results for the sample of 319 households have a precision of at least +/‐5.4 at the 95% level of confidence.
This report contains the following:
Charts showing the overall results of the survey (Section 2)
Priority Investment Rating (PIR) that identifies priorities for facilities and programs (Section 3)
Benchmarks comparing Grandview results to National Survey Responses (Section 4)
Tabular data showing the overall results for all questions on the survey (Section 5)
Responses from open‐ended questions (Section 6)
A copy of the survey instrument (Section 7)
The major findings of the survey are summarized on the following pages.
Grandview, MO 2022 Survey ETC Institute (2022) 4
Parks and Facilities Use
Use of Parks/Facilities. Respondents were asked to indicate if their household uses any of the 14 listed Grandview parks/facilities. The highest number of respondents (56%) use Grandview Community Center followed by Meadowmere Park (52%) and John Anderson Park (36%). Respondents who indicated they had visited the park/facility were then asked to rate their overall satisfaction. Respondents were most satisfied (rating “satisfied” or “very satisfied”) with the Grandview Community Center (92%), Meadowmere Park (91%), Freedom Park (90%), and Valley Park (90%). Each of the parks/facilities received mostly satisfactory ratings. Respondents most often visited parks a few times per month (27%).
Parks/Facilities Priorities. Respondents were asked to select the three parks/facilities that should be most prioritized by the City of Grandview over the next two years. These were the three most selected items:
Meadowmere Park (44%)
Grandview Community Center (41%)
John Anderson Park (28%).
Organizations Used. Respondents most often used the City of Grandview (74%) for parks and recreation services and relied on the City of Grandview for recreation (57%). Most respondents (73%) feel it is very important for the city to provide high quality park facilities.
Barriers to Use. The largest barriers to use of parks indicated by respondents were safety or security concerns (33%), amenities offered do not match interests or needs (24%), and lack of age‐appropriate amenities (21%).
Overall Satisfaction with Services. Respondents were asked to rate their overall level of satisfaction with 11 park services. Respondents were most satisfied (rating “satisfied” or “very satisfied”) with the distribution of parks (87%), park maintenance/cleanliness/general upkeep (82%), and the park system overall as a whole (74%).
Grandview, MO 2022 Survey ETC Institute (2022) 5
Parks and Recreation Programs
Program Participation. Respondents were asked if they had participated in any City of Grandview programs within the past two years. Thirty‐two percent (32%) of respondents said someone in their household had participated. Respondents were then asked to rate the overall quality of those programs. Most respondents (72%) rated the programs as either good (56%) or excellent (16%). Most respondents (73%) felt it was very important for the City of Grandview to provide high quality recreation programs.
Barriers to Use. The largest barriers to participation in recreation and wellness programs indicated by respondents were inconvenient program times (35%), not knowing what was offered (34%), and fees being too high (31%).
Communication Methods. Respondents most often learned about recreation programs from the city recreation guide (43%), city newsletter (42%), the city website (37%), and Facebook (37%). Respondents most preferred the city newsletter (42%), Facebook (38%), and the recreation guide (34%) to be used for communication.
Parks and Recreation Priorities
Priorities. Respondents were asked to indicate their level of agreement on prioritization of 10 potential improvements to parks and recreation over the next ten years. Respondents most agreed (rating either “strongly agree” or “agree”) that priority should be given to updating existing park amenities that are aging and in poor condition (98%), enhancing paved trail experiences (97%), improving the perception of safety and security in parks (96%), and improving the offering of recreation programs (96%).
Grandview, MO 2022 Survey ETC Institute (2022) 6
Park Amenity Needs and Priorities
Park Amenity Needs: Respondents were asked to identify if their household had a need for 32 park amenities and to rate how well their needs for each were currently being met. Based on this analysis, ETC Institute was able to estimate the number of households in the community that had the greatest “unmet” need for various amenities.
The three amenities with the highest estimated number of households that have an unmet need:
1. Restrooms– 3,640 households
2. Family Games –3,320 households
3. Fishing pond/lake – 3,320 households
The estimated number of households that have unmet needs for each of the 32 amenities assessed is shown in the chart below.
Q8c. Estimated Number of Households Whose Park Amenity Needs are Only “Partly Met” or “Not Met”
by number of households with need based on an estimated 10,859 households 3,640 3,320 2,881 2,844 2,837 2,583 2,323 2,252 2,230 1,952 1,833 1,808 1,783 1,742 1,678 1,631 1,626 1,310 1,298 1,295 1,283 1,279 1,276 1,226 1,064 1,002 962 738 737 668 592 466 Restrooms Family games Fishing pond/lake Nature/hiking trails Paved trails Community gardens Site furnishings Outdoor fitness areas Camping areas Outdoor pickleball courts Outdoor volleyball courts Outdoor basketball courts Outdoor tennis courts Picnic shelters Disc golf courses Bicycle pump tracks Splash pad Un‐programmed multi‐purpose open green space Playgrounds Extreme fitness/ninja warrior course Mountain biking trails Soccer fields (for youth) Dog parks Outdoor educational spaces Horseshoe pits Baseball/softball diamonds (for youth) Baseball/softball diamonds (for adults) Soccer fields (for adults) Outdoor amphitheater/event space Outdoor classroom space Skate park 0 1,000 2,000 3,000 Not met 4,000 Partly Met Natural areas for passive recreation & wildlife benefit Grandview, MO 2022 Survey ETC Institute (2022) 7
Park Amenities Importance: In addition to assessing the needs for each amenity, ETC Institute also assessed the importance that residents placed on each item. Based on the sum of respondents’ top four choices, these were the three most important amenities to residents:
1. Nature/hiking trails (34%)
2. Paved trails (28%)
3. Natural areas for passive recreation and wildlife benefit (23%)
4. Restrooms (22%)
The percentage of residents who selected each amenity as one of their top four choices is shown in the chart below.
Q9. Most Important Parks Amenities to Households
by percentage of respondents who selected the items as one of their top four choices
4% 34% 28% 23% 22% 18% 17% 16% 14% 14% 14% 13% 11% 9% 9% 9% 7% 7% 6% 6% 6% 5% 4% 4% 4% 2% 2% 2% 2% 2% 1% 1% Nature/hiking trails Paved trails Natural areas for passive recreation & wildlife benefit Restrooms Dog parks Playgrounds Family games Community gardens Fishing pond/lake Picnic shelters Site furnishings Mountain biking trails Outdoor basketball courts Outdoor fitness areas Outdoor amphitheater/event space Splash pad Camping areas Outdoor volleyball courts Bicycle pump tracks Outdoor tennis courts Disc golf courses Outdoor pickleball courts Soccer fields (for youth) Baseball/softball diamonds (for youth) Un‐programmed multi‐purpose open green space Horseshoe pits Outdoor educational spaces Skate park Extreme fitness/ninja warrior course Soccer fields (for adults) Baseball/softball diamonds (for adults) Outdoor classroom space 0% 10% 20% 30% 40% Top choice2nd choice3rd choice4th choice Grandview, MO 2022 Survey ETC Institute (2022) 8
Priorities for Facility Investments: The Priority Investment Rating (PIR) was developed by ETC Institute to provide organizations with an objective tool for evaluating the priority that should be placed on recreation and parks investments. The Priority Investment Rating (PIR) equally weights (1) the importance that residents place on amenities and (2) how many residents have unmet needs for the amenity. [ Details regarding the methodology for this analysis are provided in Section 3 of this report.]
Based the Priority Investment Rating (PIR), the following park amenities were rated as high priorities for investment:
Nature/hiking trails (PIR=178)
Restrooms (PIR=166)
Paved trails (PIR=154)
Natural areas for passive recreati on and wildlife benefit (PIR=146)
Family Games (PIR=138)
Fishing Pond/lake (PIR=120)
Community Gardens (PIR=106)
Site Furnishings (PIR=100)
The chart below shows the Priority Investment Rating for each of the 32 facilities/amenities assessed on the survey.
Top Priorities for Investment for Facility/Amenity Based on Priority
178 166 154 146 138 120 106 100 87 87 86 85 77 74 68 67 65 63 63 60 57 48 46 44 41 37 35 35 25 24 19 18 Nature/hiking trails Restrooms Paved trails Family games Fishing pond/lake Community gardens Site furnishings Outdoor fitness areas Playgrounds Picnic shelters Dog parks Outdoor basketball courts Camping areas Outdoor volleyball courts Mountain biking trails Outdoor tennis courts Outdoor pickleball courts Bicycle pump tracks Disc golf courses Splash pad Soccer fields (for youth) Un‐programmed multi‐purpose open green space Outdoor amphitheater/event space Extreme fitness/ninja warrior course Baseball/softball diamonds (for youth) Outdoor educational spaces Horseshoe pits Soccer fields (for adults) Baseball/softball diamonds (for adults) Outdoor classroom space Skate park 0 50 100 150 200
Investment Rating Medium Priority (50‐99) Low Priority (0‐50) High Priority (100+) Natural areas for passive recreation & wildlife benefit Grandview, MO 2022 Survey ETC Institute (2022) 9
City of Grandview Program Needs and Priorities
Program Needs: Respondents were asked to identify if their household had a need for 34 programs and to rate how well their needs for each were currently being met. Based on this analysis, ETC Institute was able to estimate the number of households in the community that had the greatest “unmet” need for various programs.
The three programs with the highest estimated number of households that have an unmet need:
1. Adult fitness and wellness programs – 4,241 households
2. Senior health and wellness programs –3,155 households
3. Community special programs – 3,051 households
The estimated number of households that have unmet needs for each of the 34 recreation programs assessed is shown in the chart below.
Q16c. Estimated Number of Households Whose Program Needs Are Met 50% Or Less
by number of households with need based on an estimated 10,859 households 4,241 3,155 3,051 2,737 2,699 2,635 2,468 2,450 2,271 2,215 2,092 1,874 1,835 1,700 1,667 1,666 1,666 1,532 1,520 1,450 1,429 1,427 1,410 1,387 1,342 1,297 1,290 1,249 1,197 1,161 1,126 1,067 1,053 1,030 Adult fitness & wellness programs Senior health & wellness programs Community special events Cultural enrichment programs Water fitness programs/lap swimming Outdoor water recreation Outdoor environmental/nature camps & programs Senior resource, information, & service coordination STEAM Classes Senior educational programs Programs for at risk youth/ crime prevention Senior nutrition programs After school programs for youth of all ages Senior trips Gymnastics/tumbling programs Programs relating to history Programs for adults with special needs Programs for youth with special needs Teen/tween programs Youth fitness & wellness classes Adult sports leagues Youth visual arts/crafts/ performing arts programs Youth sports programs & camps Youth performing arts programs Swim lessons Youth summer programs & camps Leadership/professional development Child Watch at Community Center Tennis lessons & leagues Preschool programs/early childhood education Virtual programs Recreation/competitive swim team eGaming/eSports Birthday parties 0 1,0002,0003,000 50% Met 4,000 25% Met0% Met Grandview, MO 2022 Survey ETC Institute (2022) 10
Programs Importance: In addition to assessing the needs for each program, ETC Institute also assessed the importance that residents placed on each item. Based on the sum of respondents’ top four choices, these are the three most important recreation programs to residents:
1. Adult fitness & wellness programs (44%)
2. Community special events (27%)
3. Senior health & wellness programs (20%)
4. Outdoor water recreation (17%)
The percentage of residents who selected each program as one of their top four choices is shown in the chart below.
Q17. Most Important Programs to Households
by percentage of respondents who selected the items as one of their top four choices
40% 27% 20% 14% 13% 13% 13% 11% 11% 10% 9% 9% 9% 9% 8% 7% 6% 6% 6% 5% 5% 5% 5% 5% 5% 4% 4% 4% 4% 3% 3% 3% 2% 2% Adult fitness & wellness programs Community special
Senior health & wellness programs
water
coordination Water fitness programs/lap swimming Senior educational programs Cultural enrichment programs Outdoor environmental/nature camps & programs STEAM Classes Programs for at risk youth/ crime prevention Senior nutrition programs Swim lessons Senior trips After school programs for youth of all ages Leadership/professional development Programs relating to history Gymnastics/tumbling programs Adult sports leagues Teen/tween programs Youth visual arts/crafts/ performing arts programs Preschool programs/early childhood education Programs for adults with special needs Birthday parties Youth summer programs & camps Child Watch at Community Center eGaming/eSports Youth performing arts programs Virtual programs Youth fitness & wellness classes Programs for youth with special needs Youth sports programs & camps Recreation/competitive swim team Tennis lessons & leagues 0% 10% 20% 30% 40% Top choice2nd choice3rd choice4th choice Grandview, MO 2022 Survey ETC Institute (2022) 11
events
Outdoor
recreation Senior resource, information, & service
Priorities for Recreation Activity Investments: The Priority Investment Rating (PIR) was developed by ETC Institute to provide organizations with an objective tool for evaluating the priority that should be placed on recreation and parks investments. The Priority Investment Rating (PIR) equally weights (1) the importance that residents place on each program and (2) how many residents have unmet needs for the program. [ Details regarding the methodology for this analysis are provided in Section 3 of this report.]
Based the Priority Investment Rating (PIR), the following City of Grandview programs were rated as high priorities for investment:
Adult fitness & wellness programs (PIR=200)
Community special events (PIR=140)
Senior health and wellness programs (PIR=125)
The chart below shows the Priority Investment Rating for each of the 34 programs assessed.
Top Priorities for Investment for Recreation Programs
Based on the Priority Investment Rating
200 140 125 99 95 93 90 85 84 79 73 68 63 62 54 54 53 52 49 48 48 47 44 43 42 42 41 40 40 37 36 36 32 30 Adult fitness & wellness programs Community special events Senior health & wellness programs Outdoor water recreation Water fitness programs/lap swimming Cultural enrichment programs Senior resource, information, & service coordination Outdoor environmental/nature camps & programs Senior educational programs STEAM Classes Programs for at risk youth/ crime prevention Senior nutrition programs After school programs for youth of all ages Senior trips Programs relating to history Swim lessons Gymnastics/tumbling programs Programs for adults with special needs Teen/tween programs Adult sports leagues Leadership/professional development Youth visual arts/crafts/ performing arts programs Youth performing arts programs Programs for youth with special needs Youth fitness & wellness classes Youth summer programs & camps Child Watch at Community Center Youth sports programs & camps Preschool programs/early childhood education Virtual programs Birthday parties eGaming/eSports Tennis lessons & leagues Recreation/competitive swim team 0 50 100 150 200
Medium Priority (50‐99) Low Priority (0‐50) High Priority (100+) Grandview, MO 2022 Survey ETC Institute (2022) 12
Charts & Graphs
2
Q1. Parks and Facilities Used by Respondents
by percentage of respondents 56% 52% 36% 23% 16% 16% 14% 11% 11% 9% 8% 3% 3% 2% Grandview Community Center Meadowmere Park John Anderson Park Tails & Trails Dog Park Freedom Park Valley Park Mapleview Park Belvidere Park River Oaks Park Little Corner Park Southview Park Bobcat Park Shalimar Park Terrace Park 0% 20% 40% 60% Institute (2022)
Q1a. Level of Satisfaction with Parks and Facilities
by percentage of respondents who responded "Yes" to Q1 (excluding "not provided")
49% 42% 26% 46% 24% 14% 28% 32% 31% 30% 27% 11% 43% 49% 64% 44% 64% 71% 57% 47% 47% 48% 46% 70% 51% 9% 9% 10% 8% 12% 14% 13% 20% 22% 22% 27% 20% 29% 1% 2% 2% 1% 10% 9% Grandview Community Center Meadowmere Park Freedom Park Valley Park Southview Park Terrace Park John Anderson Park Tails & Trails Dog Park Mapleview Park Little Corner Park Shalimar Park Bobcat Park River Oaks Park 0% 20% 40% 60% 80% 100%
SatisfiedSatisfiedDissatisfiedVery Dissatisfied Institute (2022)
Very
Q2. Which THREE of these parks/facilities listed in Question 1 should the City of Grandview
prioritize over the next TWO years?
by percentage of respondents who selected the items as one of their top three choices
1% 44% 41% 28% 23% 16% 14% 11% 9% 9% 7% 6% 6% 4% Meadowmere Park Grandview Community Center John Anderson Park Tails & Trails Dog Park River Oaks Park Belvidere Park Mapleview Park Freedom Park Valley Park Little Corner Park Bobcat Park Southview Park Shalimar Park Terrace Park 0% 15% 30% 45% Top choice2nd choice3rd choice Institute (2022)
Q3. On average, how often do you or other members of your household visit parks in Grandview?
A few times per month 27% A few times per week 19% Seldom or never 17% A few times per year 16% At least once per week 11% Almost daily 9% Once per year 2%
Institute (2022)
by percentage of respondents (excluding “not provided")
Q4. Which of the following reasons PREVENT you or other members of your household from using parks in Grandview, or from using them more often? by
be
33% 24% 21% 20% 20% 18% 13% 8% 6% 5% Safety or security concerns Lack of age‐appropriate amenities Not interested/too busy Condition of amenities Other Too hard to find parking Facilities too crowded ADA accessibility is lacking 0% 10% 20% 30%
offered don't match my interests or needs
of maintenance & repair of existing facilities Institute (2022)
percentage of respondents (multiple selections could
made)
Amenities
Lack
Q5. How important do you feel it is for the City to provide high quality PARK FACILITIES?
by percentage of respondents (excluding "don’t know")
Very important 73%
Somewhat important 22%
Not important at all 2%
Somewhat not important 3%
Institute (2022)
Q6. Which of the following organizations do you and other members of your household use for parks and recreation services?
by percentage of respondents (excluding "none of these") (multiple selections could be made)
74% 44% 19% 15% 5% City of Grandview
Local schools Other 0% 20% 40% 60% 80% Institute (2022)
Other local City/County Parks & Rec. Departments Churches or other religious organizations
Q7. Which ONE of the organizations listed in Question 6 do you rely on most?
by percentage of respondents (excluding “none of these" and "none chosen”)
Churches or other religious organizations
Other local City/County Parks & Rec. Departments
City of Grandview 57% 24% 13% Local schools 4% Other 2%
Institute (2022)
Q8. Respondents With Need for Park Amenity
Nature/hiking trails
Paved trails
Site furnishings
Natural areas for passive recreation & wildlife benefit
Picnic shelters
Playgrounds
Family games
Fishing pond/lake
Community gardens
Splash pad Dog parks
Outdoor amphitheater/event space
Outdoor fitness areas
Outdoor basketball courts
Un‐programmed multi‐purpose open green space
Mountain biking trails
Camping areas
Bicycle pump tracks
Outdoor tennis courts
Outdoor pickleball courts
Outdoor volleyball courts
Disc golf courses
Soccer fields (for youth)
Baseball/softball diamonds (for youth)
Outdoor educational spaces
Skate park
Extreme fitness/ninja warrior course
Horseshoe pits
Soccer fields (for adults)
Baseball/softball diamonds (for adults)
Outdoor classroom space
by percentage of respondents 58% 53% 51% 45% 44% 41% 40% 34% 32% 30% 29% 29% 29% 28% 21% 21% 21% 20% 20% 19% 19% 18% 17% 16% 14% 13% 13% 13% 11% 10% 9% 9%
Restrooms
0% 15% 30% 45% 60%
Institute (2022)
Q8a. Estimated Number of Households With Need for Park Amenity
by number of households based on an estimated 10,859 households 6,331 5,723 5,484 4,832 4,800 4,463 4,289 3,681 3,442 3,236 3,171 3,127 3,095 2,997 2,313 2,313 2,280 2,215 2,183 2,074 2,041 1,976 1,835 1,770 1,564 1,433 1,401 1,357 1,162 1,086 956 956 Restrooms Nature/hiking trails Paved trails Site furnishings Picnic shelters Playgrounds Family games Fishing pond/lake Community gardens Splash pad Dog parks Outdoor amphitheater/event space Outdoor fitness areas Outdoor basketball courts Un‐programmed multi‐purpose open green space Mountain biking trails Camping areas Bicycle pump tracks Outdoor tennis courts Outdoor pickleball courts Outdoor volleyball courts Disc golf courses Soccer fields (for youth)
diamonds (for youth) Outdoor educational spaces Skate park Extreme fitness/ninja warrior course Horseshoe pits Soccer fields (for adults) Baseball/softball diamonds (for adults) Outdoor classroom space 0 2,000 4,000 6,000 Natural areas for passive recreation & wildlife benefit Institute (2022)
Baseball/softball
Q8b. How Well Households’ Need For Park Amenity Is Currently Being Met
Natural areas for passive recreation &
benefit
by percentage of respondents who answered “Yes” to Q8 42% 25% 21% 25% 23% 29% 18% 20% 19% 16% 19% 14% 13% 10% 14% 14% 10% 12% 10% 7% 13% 7% 5% 11% 2% 7% 3% 4% 4% 2% 2% 3% 37% 45% 46% 38% 38% 30% 35% 33% 32% 28% 25% 29% 28% 28% 24% 18% 18% 16% 16% 19% 13% 16% 18% 6% 14% 7% 9% 7% 6% 8% 6% 3% 17% 26% 24% 33% 29% 23% 38% 40% 37% 23% 30% 42% 40% 36% 19% 25% 41% 28% 29% 23% 36% 23% 23% 26% 22% 17% 22% 9% 14% 19% 17% 14% 5% 5% 9% 5% 10% 19% 8% 7% 13% 33% 26% 16% 19% 26% 43% 43% 31% 44% 45% 51% 38% 54% 55% 58% 62% 69% 66% 80% 76% 72% 75% 81% Outdoor amphitheater/event space Playgrounds Skate park Picnic shelters Dog parks Splash pad Site furnishings Paved trails Nature/hiking trails Mountain biking trails Un‐programmed multi‐purpose open green space Restrooms Baseball/softball diamonds (for youth) Outdoor classroom space Soccer fields (for adults) Community gardens Soccer fields (for youth) Outdoor educational spaces Outdoor fitness areas Bicycle pump tracks Outdoor basketball courts Baseball/softball diamonds (for adults) Fishing pond/lake Outdoor tennis courts Horseshoe pits Camping areas Disc golf courses Outdoor pickleball courts Family games Outdoor volleyball courts Extreme fitness/ninja warrior course 0% 20% 40% 60% 80% 100% Fully metMostly MetPartly MetNot met
wildlife
Institute (2022)
Q8c. Estimated Number of Households Whose Park Amenity Needs are
Only
or
by number of households with need based on an estimated 10,859 households 3,640 3,320 2,881 2,844 2,837 2,583 2,323 2,252 2,230 1,952 1,833 1,808 1,783 1,742 1,678 1,631 1,626 1,310 1,298 1,295 1,283 1,279 1,276 1,226 1,064 1,002 962 738 737 668 592 466 Restrooms Family games Fishing pond/lake Nature/hiking trails Paved trails Community gardens Site furnishings Outdoor fitness areas Camping areas Outdoor pickleball courts Outdoor volleyball courts Outdoor basketball courts Outdoor tennis courts Picnic shelters Disc golf courses Bicycle pump tracks Splash pad Un‐programmed multi‐purpose open green space Playgrounds Extreme fitness/ninja warrior course Mountain biking trails Soccer fields (for youth) Dog parks Outdoor educational spaces Horseshoe pits Baseball/softball diamonds (for youth) Baseball/softball diamonds (for adults) Soccer fields (for adults) Outdoor amphitheater/event space Outdoor classroom space Skate park 0 1,000 2,000 3,000 4,000 Not metPartly Met Natural areas for passive recreation & wildlife benefit Institute (2022)
“Partly Met”
“Not Met”
Q9. Most Important Parks Amenities to Households
by percentage of respondents who selected the items as one of their top four choices
Nature/hiking trails
Paved trails
Natural areas for passive recreation & wildlife benefit
Restrooms Dog parks
Playgrounds
Family games
Community gardens
Fishing pond/lake
Picnic shelters
Site furnishings
Mountain biking trails
Outdoor basketball courts
Outdoor fitness areas
Outdoor amphitheater/event space
Splash pad
Camping areas
Outdoor volleyball courts
Bicycle pump tracks
Outdoor tennis courts
Disc golf courses
Outdoor pickleball courts
Soccer fields (for youth)
Baseball/softball diamonds (for youth)
Un‐programmed multi‐purpose open green space
Horseshoe pits
Outdoor educational spaces
Skate park
Extreme fitness/ninja warrior course
Soccer fields (for adults)
Baseball/softball diamonds (for adults)
Outdoor classroom space
Top choice2nd choice3rd choice4th choice
1% 4% 34% 28% 23% 22% 18% 17% 16% 14% 14% 14% 13% 11% 9% 9% 9% 7% 7% 6% 6% 6% 5% 4% 4% 4% 2% 2% 2% 2% 2% 1%
0% 10% 20% 30% 40%
Institute (2022)
Q10. Level of Satisfaction with Parks and Recreation
Quality of recreation programs
Park amenities meet needs of the community
Number & variety of community events in parks
Variety of recreation programs
Marketing & communication of programs & services
Accessible amenities for limited mobility patrons
19% 19% 9% 13% 14% 8% 10% 13% 11% 9% 8% 68% 63% 65% 59% 51% 53% 51% 47% 44% 43% 44% 9% 13% 21% 23% 27% 34% 27% 33% 37% 37% 35% 4% 5% 5% 5% 9% 5% 12% 7% 8% 10% 14% Distribution
Park system overall as a whole
by percentage of respondents (excluding "don’t know")
of parks Park maintenance, cleanliness, & general upkeep
Quality of park amenities
Park
safety & security
0% 20% 40% 60% 80% 100%
Dissatisfied Institute (2022)
Very SatisfiedSatisfiedDissatisfiedVery
Q11. Has your household participated in any recreation and wellness programs offered by the City of Grandview (for all ages) during the last 2 years?
No 68% Yes 32% by percentage of respondents Institute (2022)
Q11a. How would you rate the overall quality of the City of Grandview recreation programs in which your household has participated? Excellent
by percentage of respondents (excluding "don’t know")
16%
56%
26%
2%
Good
Fair
Poor
Institute (2022)
Q12. Barriers to Recreation and Wellness Programs Use
by percentage of respondents (multiple selections could be made)
Program times are not convenient
I don't know what is offered
Fees are too high
Too busy/not interested
Program not offered
Use programs of other agencies
Lack of quality programs
Lack of quality instructors
Classes are full
Poor customer service by staff
Old & outdated facilities
Lack of right program equipment
Lack of transportation
Registration is difficult
Too far from your home
Lack of trust in government
Language/cultural barriers
35% 34% 31% 19% 13% 9% 9% 7% 7% 6% 5% 5% 5% 4% 3% 3% 1%
0% 10% 20% 30% Institute (2022)
Q13. Ways Respondents Learn About City Recreation Programs
percentage of respondents (multiple selections could be made) 43% 42% 37% 37% 32% 19% 16% 15% 12% 12% 11% 7% 6% 5% 3% City recreation guide City newsletter City website Facebook Banners at parks or City facilities Friends & neighbors Materials at parks or recreation facilities Flyers Promotions at special events Email/eBlasts from City Nextdoor app for neighborhoods Newspaper Instagram Conversations with recreation staff Twitter 0% 10% 20% 30% 40% Institute (2022)
by
Q14. Preferred Communication Methods
by percentage of respondents who selected the items as one of their top four choices
42% 38% 34% 32% 26% 21% 16% 11% 9% 6% 6% 5% 4% 3% 1% City newsletter Facebook City recreation guide City website Email/eBlasts from City Banners at parks or City facilities Flyers Materials at parks or recreation facilities Nextdoor app for neighborhoods Promotions at special events Newspaper Instagram Friends & neighbors Conversations with recreation staff Twitter 0% 10% 20% 30% 40% Top choice2nd choice3rd choice Institute (2022)
Q15. How important do you feel it is for the City of Grandview to provide high quality RECREATION PROGRAMS?
Somewhat important 22%
Somewhat not important 3%
important 73%
Very
know") Institute (2022)
Not important at all 2% by percentage of respondents (excluding "don’t
Q16. Respondents With Need for Programs
Adult fitness & wellness programs
Community special events
Senior health & wellness programs
Water fitness programs/lap swimming
Cultural enrichment programs
Senior resource, information, & service coordination
Senior educational programs
Outdoor environmental/nature camps & programs
Outdoor water recreation
Senior trips
STEAM Classes
Swim lessons
Senior nutrition programs
After school programs for youth of all ages
Programs for at risk youth/ crime prevention
Youth sports programs & camps
Programs for adults with special needs
Programs relating to history
Youth summer programs & camps
Birthday parties
Youth fitness & wellness classes
Gymnastics/tumbling programs
Youth performing arts programs
Youth visual arts/crafts/ performing arts programs
Adult sports leagues
Child Watch at Community Center
Teen/tween programs
Programs for youth with special needs
Leadership/professional development
Preschool programs/early childhood education
Tennis lessons & leagues
Virtual programs
Recreation/competitive swim team
eGaming/eSports
by percentage of respondents 63% 44% 40% 30% 30% 28% 27% 26% 26% 24% 24% 23% 22% 21% 20% 19% 18% 18% 17% 17% 17% 17% 16% 16% 16% 16% 15% 15% 14% 13% 12% 11% 11% 10%
0% 15% 30% 45% 60%
Institute (2022)
Q16a. Estimated Number of Households Who Have a Need for Programs
Adult fitness & wellness programs
Community special events
Senior health & wellness programs
Water fitness programs/lap swimming
Cultural enrichment programs
Senior resource, information, & service coordination
Senior educational programs
Outdoor environmental/nature camps & programs
Outdoor water recreation
Senior trips
STEAM Classes
Swim lessons
Senior nutrition programs
After school programs for youth of all ages
Programs for at risk youth/ crime prevention
Youth sports programs & camps
Programs for adults with special needs
Programs relating to history
Youth summer programs & camps
Birthday parties
Youth fitness & wellness classes
Gymnastics/tumbling programs
Youth performing arts programs
Youth visual arts/crafts/ performing arts programs
Adult sports leagues
Child Watch at Community Center Teen/tween programs
Programs for youth with special needs
Leadership/professional development
Preschool programs/early childhood education
Tennis lessons & leagues
Virtual programs
Recreation/competitive swim team
by number of households based on an estimated 10,859 households 6,874 4,767 4,322 3,269 3,236 3,062 2,888 2,856 2,791 2,552 2,552 2,454 2,378 2,248 2,139 2,041 1,944 1,911 1,868 1,835 1,835 1,803 1,770 1,770 1,705 1,705 1,672 1,629 1,499 1,401 1,325 1,227 1,194 1,053
eGaming/eSports 0 2,000 4,000 6,000
Institute (2022)
Q16b. How Well Households’ Need For Program Is Currently Being Met
Senior resource, information, & service coordination
Youth visual arts/crafts/ performing arts programs
After school programs for youth of all ages
Water fitness programs/lap swimming
Preschool programs/early childhood education Adult sports leagues
Cultural enrichment programs
Programs for adults with special needs
Leadership/professional development
Outdoor environmental/nature camps & programs Programs relating to history
Recreation/competitive swim team
Tennis lessons & leagues
Teen/tween programs Virtual programs
Gymnastics/tumbling programs
Programs for youth with special needs
Outdoor water recreation
Programs for at risk youth/ crime prevention
19% 15% 11% 10% 13% 10% 8% 7% 13% 5% 5% 6% 5% 4% 8% 4% 7% 9% 2% 4% 7% 3% 6% 5% 4% 4% 4% 3% 26% 29% 27% 26% 21% 21% 22% 20% 13% 18% 16% 15% 16% 16% 11% 14% 11% 9% 14% 12% 7% 11% 8% 8% 7% 7% 10% 9% 4% 8% 6% 3% 2% 13% 32% 37% 41% 21% 18% 14% 28% 30% 27% 8% 15% 16% 24% 6% 22% 33% 6% 19% 21% 10% 14% 18% 26% 6% 18% 10% 12% 4% 8% 15% 7% 11% 12% 23% 12% 10% 17% 23% 18% 11% 16% 20% 17% 16% 21% 21% 16% 19% 18% 21% 34% 23% 30% 21% 19% 20% 15% 17% 14% 13% 15% 17% 13% 9% 10% 26% 16% 19% 12% 14% 6% 23% 33% 44% 29% 23% 33% 54% 43% 42% 40% 56% 41% 28% 43% 42% 35% 55% 53% 49% 46% 67% 57% 68% 64% 71% 73% 70% 78% 62% 72%
by percentage of respondents who answered “Yes” to Q16
Birthday parties
fitness &
Senior trips Youth sports
summer
&
Senior health &
at
Senior educational
Senior
&
Swim lessons
Adult
wellness programs Community special events
programs & camps Youth
programs
camps
wellness programs Child Watch
Community Center
programs Youth performing arts programs
nutrition programs Youth fitness
wellness classes
STEAM Classes
eGaming/eSports 0% 20% 40% 60% 80% 100% 100% Met75% Met50% Met25% Met0% Met
Institute (2022)
Q16c. Estimated Number of Households Whose Program Needs Are Met
50%
by number of households with need based on an estimated 10,859
4,241 3,155 3,051 2,737 2,699 2,635 2,468 2,450 2,271 2,215 2,092 1,874 1,835 1,700 1,667 1,666 1,666 1,532 1,520 1,450 1,429 1,427 1,410 1,387 1,342 1,297 1,290 1,249 1,197 1,161 1,126 1,067 1,053 1,030 Adult fitness & wellness programs Senior health & wellness programs Community special events Cultural enrichment programs Water fitness programs/lap swimming Outdoor water recreation Outdoor environmental/nature camps & programs
Classes Senior educational programs Programs for at risk youth/ crime prevention Senior nutrition programs After school programs for youth of all ages Senior trips Gymnastics/tumbling programs Programs relating to history Programs for adults with special needs Programs for youth with special needs Teen/tween programs Youth fitness & wellness classes Adult sports leagues Youth visual arts/crafts/ performing arts programs Youth sports programs & camps Youth performing arts programs Swim lessons Youth summer programs & camps Leadership/professional development Child Watch at Community Center Tennis lessons & leagues Preschool programs/early childhood education Virtual programs Recreation/competitive swim team eGaming/eSports Birthday parties 0 1,0002,0003,0004,000 50% Met25% Met0% Met Senior resource, information, & service coordination Institute (2022)
Or Less
households
STEAM
Q17. Most Important Programs to Households
by percentage of respondents who selected the items as one of their top four choices
Adult fitness & wellness programs
Community special events
Senior health & wellness programs
Outdoor water recreation
Senior resource, information, & service coordination
Water fitness programs/lap swimming
Senior educational programs
Cultural enrichment programs
Outdoor environmental/nature camps & programs
STEAM Classes
Programs for at risk youth/ crime prevention
Senior nutrition programs
Swim lessons
Senior trips
After school programs for youth of all ages
Leadership/professional development
Programs relating to history
Gymnastics/tumbling programs
Adult sports leagues
Teen/tween programs
Youth visual arts/crafts/ performing arts programs
Preschool programs/early childhood education
Programs for adults with special needs
Birthday parties
Youth summer programs & camps
Child Watch at Community Center
eGaming/eSports
Youth performing arts programs
Virtual programs
Youth fitness & wellness classes
Programs for youth with special needs
Youth sports programs & camps
Recreation/competitive swim team
Tennis lessons & leagues
Top choice2nd choice3rd choice4th choice
40% 27% 20% 14% 13% 13% 13% 11% 11% 10% 9% 9% 9% 9% 8% 7% 6% 6% 6% 5% 5% 5% 5% 5% 5% 4% 4% 4% 4% 3% 3% 3% 2% 2%
0% 10% 20% 30% 40%
Institute (2022)
Q18. Level of Agreement Regarding Parks and Recreation Priorities
by percentage of respondents (excluding "don’t know")
Update existing park amenities that are aging & in poor condition throughout park system
Enhance paved trail experiences. Improve pavement conditions as necessary, expand connections, & add more benches along trails
Improve the perception of safety & security in parks
Improve the offering of recreation programs
Add new park amenities
Improve marketing & communication of recreation programs & events
Provide amenities such as a large shelter & site furnishings to improve the farmers market experience & encourage more vendors to attend
Add more multi‐generational amenities throughout the parks
Increase the number & quality of events at the amphitheater
Focus on the beautification of parks 0%20%40%60%80%100%
Very SatisfiedSatisfiedDissatisfiedVery Dissatisfied
65% 56% 66% 49% 50% 46% 53% 50% 38% 43% 33% 41% 30% 47% 45% 47% 40% 43% 52% 45% 2% 3% 3% 3% 4% 4% 5% 6% 8% 10% 1% 1% 1% 2% 2% 2% 2% 2% 2% 2%
Institute (2022)
Q19. Approximately how many years has your household resided in Grandview?
by percentage of respondents (excluding “not provided")
0‐5 18% 6‐10 13% 11‐15 7% 16‐20 12% 21‐30 20% 31+ 30%
Institute (2022)
Q20. Respondent Age
by percentage of respondents (excluding “not provided")
65+ 21% 55‐64 21% 35‐44 20% 45‐54 20% 18‐34 19%
Institute (2022)
Q21. Which of the following best describes your race?
by percentage of respondents (multiple selections could be made)
50.8% 35.1% 11.6% 1.6% 1.6% 0.6%
Hispanic/Spanish/Latino/a/x
Other American Indian or Alaska Native 0.0%10.0%20.0%30.0%40.0%50.0% Institute (2022)
White or Caucasian Black or African American
Asian or Asian Indian
Q22. Counting yourself, how many people in your household are in the following age groups?
by percentage of persons in household
Ages 55‐64 16%
Ages 20‐24 5%
Ages 10‐14 6%
Ages 5‐9 6%
Ages 45‐54 13%
Ages 75+ 7%
Ages 35‐44
12%
Ages 65‐74 10%
Ages 25‐34 9%
Under age 5 7%
Ages 15‐19 8%
Institute (2022)
Q23. With which gender do you identify most?
Female 51% Male 49%
Institute (2022)
by percentage of respondents
Q24. Annual Household Income
by percentage of respondents (excluding “prefer not to answer")
$30K‐$59,999 32.0% $60K‐$99,999 27.6% Under $30K 20.8% $100K‐$149,999 16.4% $150K‐$199,999 2.8% $200K+ 0.4%
Institute (2022)
Priority Investment Rating
3
Priority Investment Rating Grandview, Missouri
The Priority Investment Rating (PIR) was developed by ETC Institute to provide governments with an objective tool for evaluating the priority that should be placed on parks and recreation investments. The Priority Investment Rating was developed by ETC Institute to identify the facilities and programs residents think should receive the highest priority for investment. The priority investment rating reflects the importance residents place on items (sum of top 4 choices) and the unmet needs (needs that are not met or only partly met) for each facility/program relative to the facility/program that rated the highest overall. Since decisions related to future investments should consider both the level of unmet need and the importance of facilities and programs, the PIR weights each of these components equally.
The PIR reflects the sum of the Unmet Needs Rating and the Importance Rating as shown in the equation below:
PIR = UNR + IR
For example, if the Unmet Needs Rating for Community Gardens were 98.9 (out of 100) and the Importance Rating for Community Gardens were 21.6 (out of 100), the Priority Investment Rating for the Farmer’s Market would be 120.5 (out of 200).
How to Analyze the Charts:
High Priority Areas are those with a PIR of at least 100. A rating of 100 or above generally indicates there is a relatively high level of unmet need and residents generally think it is important to fund improvements in these areas. Improvements in this area are likely to have a positive impact on the greatest number of households.
Medium Priority Areas are those with a PIR of 50‐99. A rating in this range generally indicates there is a medium to high level of unmet need or a significant percentage of residents generally think it is important to fund improvements in these areas.
Low Priority Areas are those with a PIR below 50. A rating in this range generally indicates there is a relatively low level of unmet need and residents do not think it is important to fund improvements in these areas. Improvements may be warranted if the needs of very specialized populations are being targeted.
The following pages show the Unmet Needs Rating, Importance Rating, and Priority Investment Rating for facilities and programs.
Grandview, MO 2022 Survey ETC Institute (2022) 47
Unmet Needs Rating for Facility
the rating for the item with the most unmet need=100 the rating of all other items reflects the relative amount of unmet need for each item compared to the item with the most unmet need
Restrooms
Family games
Fishing pond/lake
Nature/hiking trails
Natural areas for passive recreation & wildlife benefit
Paved trails
Community gardens
Site furnishings
Outdoor fitness areas
Camping areas
Outdoor pickleball courts
Outdoor volleyball courts
Outdoor basketball courts
Outdoor tennis courts
Picnic shelters
Disc golf courses
Bicycle pump tracks
Splash pad
Un‐programmed multi‐purpose open green space
Playgrounds
Extreme fitness/ninja warrior course
Mountain biking trails
Soccer fields (for youth)
Dog parks
Outdoor educational spaces
Horseshoe pits
Baseball/softball diamonds (for youth)
Baseball/softball diamonds (for adults)
Soccer fields (for adults)
Outdoor amphitheater/event space
Outdoor classroom space
100.0 91.2 79.1 78.1 77.9 71.0 63.8 61.9 61.3 53.6 50.4 49.7 49.0 47.9 46.1 44.8 44.7 36.0 35.6 35.6 35.2 35.1 35.1 33.7 29.2 27.5 26.4 20.3 20.3 18.4 16.2 12.8
0.0 20.0 40.0 60.0 80.0100.0
Skate park
Institute (2022)
Importance Rating for Facility
the rating for the item rated as the most important=100 the rating of all other items reflects the relative level of importance for each item compared to the item rated as the most important
Nature/hiking trails
Natural areas for passive recreation & wildlife benefit
Community gardens
Fishing pond/lake Picnic shelters
Site furnishings
Mountain biking trails
Outdoor basketball courts
Outdoor fitness areas
Outdoor amphitheater/event space
Splash pad
Camping areas
Outdoor volleyball courts
Bicycle pump tracks
Outdoor tennis courts
Disc golf courses
Outdoor pickleball courts
Soccer fields (for youth)
Baseball/softball diamonds (for youth)
Un‐programmed multi‐purpose open green space
100.0 83.5 68.4 65.8 51.6 51.0 46.3 41.9 40.7 39.8 37.8 31.6 27.7 26.0 26.0 21.2 20.4 18.6 18.0 16.8 15.6 13.0 13.0 10.3 10.3 7.1 5.6 5.3 5.3 4.7 3.5 2.7
Dog
Paved trails Restrooms
parks Playgrounds Family games
Outdoor
spaces Skate park Extreme fitness/ninja warrior course Soccer fields (for adults) Baseball/softball diamonds (for adults) Outdoor classroom space 0.0 20.0 40.0 60.0 80.0100.0
Horseshoe pits
educational
Institute (2022)
Top Priorities for Investment for Facility/Amenity Based on Priority Investment Rating
Natural areas for passive recreation & wildlife benefit
pad
Soccer fields (for youth)
Un‐programmed multi‐purpose open green space
Outdoor amphitheater/event space
Extreme fitness/ninja warrior course
Baseball/softball diamonds (for youth)
Outdoor educational spaces
Horseshoe pits
Soccer fields (for adults)
Baseball/softball diamonds (for adults)
Outdoor classroom space
178 166 154 146 138 120 106 100 87 87 86 85 77 74 68 67 65 63 63 60 57 48 46 44 41 37 35 35 25 24 19 18
trails Restrooms Paved trails Family games Fishing pond/lake Community gardens Site furnishings Outdoor fitness areas Playgrounds Picnic shelters Dog parks Outdoor basketball courts Camping areas Outdoor volleyball courts Mountain biking trails Outdoor tennis courts
pickleball
Splash
Nature/hiking
Outdoor
courts Bicycle pump tracks Disc golf courses
Skate
0 50 100 150 200
park
Medium Priority (50‐99) Low Priority (0‐50) High Priority (100+)
Institute (2022)
Unmet Needs Rating for Programs
the rating for the item with the most unmet need=100 the rating of all other items reflects the relative amount of unmet need for each item compared to the item with the most unmet need
Adult fitness & wellness programs
Senior health & wellness programs
Community special events
Cultural enrichment programs
Water fitness programs/lap swimming
Outdoor water recreation
Outdoor environmental/nature camps & programs
Senior resource, information, & service coordination
STEAM Classes
Senior educational programs
Programs for at risk youth/ crime prevention
Senior nutrition programs
After school programs for youth of all ages
Senior trips
Gymnastics/tumbling programs
Programs relating to history
Programs for adults with special needs
Programs for youth with special needs
Teen/tween programs
Youth fitness & wellness classes
Adult sports leagues
Youth visual arts/crafts/ performing arts programs
Youth sports programs & camps
Youth performing arts programs
Swim lessons
Youth summer programs & camps
Leadership/professional development
Child Watch at Community Center
Tennis lessons & leagues
Preschool programs/early childhood education
Virtual programs
Recreation/competitive swim team
eGaming/eSports
Birthday parties
100.0 74.4 71.9 64.6 63.7 62.1 58.2 57.8 53.6 52.2 49.3 44.2 43.2 40.1 39.3 39.3 39.3 36.1 35.8 34.2 33.7 33.6 33.3 32.7 31.7 30.6 30.4 29.5 28.2 27.4 26.5 25.2 24.8 24.3
0.0 20.0 40.0 60.0 80.0 100.0
Institute (2022)
Importance Rating for Recreation Activities
the rating for the item rated as the most important=100 the rating of all other items reflects the relative level of importance for each item compared to the item rated as the most important
Adult fitness & wellness programs
Community special events
Senior health & wellness programs
Outdoor water recreation
Senior resource, information, & service coordination
Water fitness programs/lap swimming
Senior educational programs
Cultural enrichment programs
Outdoor environmental/nature camps & programs
STEAM Classes
Programs for at risk youth/ crime prevention
Senior nutrition programs
Swim lessons
Senior trips
After school programs for youth of all ages
Leadership/professional development
Programs relating to history
Gymnastics/tumbling programs
Adult sports leagues
Teen/tween programs
Youth visual arts/crafts/ performing arts programs
Preschool programs/early childhood education
Programs for adults with special needs
Birthday parties
Youth summer programs & camps
Child Watch at Community Center
eGaming/eSports
Youth performing arts programs
Virtual programs
Youth fitness & wellness classes
Programs for youth with special needs
Youth sports programs & camps
Recreation/competitive swim team
Tennis lessons & leagues
100.0 67.6 50.1 36.5 32.4 31.6 31.6 28.6 26.8 25.3 23.8 23.8 22.3 21.5 20.0 17.2 14.9 14.2 14.2 13.4 12.9 12.7 12.4 11.9 11.4 11.1 11.1 10.9 10.1 7.8 6.8 6.8 4.6 3.8
0.0 20.0 40.0 60.0 80.0 100.0
Institute (2022)
Top Priorities for Investment for Recreation Programs
Based on the Priority Investment Rating
Senior resource, information, & service coordination
STEAM Classes
Senior nutrition programs
Senior trips
Programs relating to history
Swim lessons
Gymnastics/tumbling programs
Programs for adults with special needs
Teen/tween programs
Adult sports leagues
Leadership/professional development
Youth visual arts/crafts/ performing arts programs
Youth performing arts programs
Programs for youth with special needs
Youth fitness & wellness classes
Youth summer programs & camps
Child Watch at Community Center
Youth sports programs & camps
Preschool programs/early childhood education
Virtual programs
Birthday parties
eGaming/eSports
Tennis lessons & leagues
Recreation/competitive swim team
200 140 125 99 95 93 90 85 84 79 73 68 63 62 54 54 53 52 49 48 48 47 44 43 42 42 41 40 40 37 36 36 32 30
fitness & wellness programs Community special
Senior health & wellness programs Outdoor
fitness
Adult
events
water recreation Water
programs/lap swimming Cultural enrichment programs Outdoor environmental/nature camps & programs
Senior educational programs
Programs for at risk youth/ crime prevention
After school programs for youth of all ages
0 50 100 150 200
Medium Priority (50‐99) Low Priority (0‐50) High Priority (100+)
Institute (2022)
4
Benchmarks
Institute (2022)
Satisfaction with Recreation Programs
Percentage of respondents who rate the quality of all the recreation programs they've participated in as Excellent
Percentage of respondents who rate the quality of all the recreation programs they've participated in as Excellent or Good
by percentage of respondents
16% 72% 23% 79% 0% 25% 50% 75% 100% Grandview (2022)National Average
Institute (2022)
Satisfaction with Parks
by percentage of respondents who rated their satisfaction as either "satisfied" or "very satisfied”
Grandview (2022)National Average
82% 78% Overall
0%25%50%75%100%
Maintenance of Parks
Institute (2022)
Barriers to Facilities and Programs Use
Program times are not convenient
I don't know what is offered
Safety or security concerns
Fees are too high Program not offered
Lack of maintenance & repair of existing facilities
Use programs of other agencies
Lack of quality programs
Too hard to find parking
Classes are full
Poor customer service by staff
ADA accessibility lacking
Lack of right program equipment
Lack of transportation
Registration is difficult
Too far from home
by % of respondents
35% 34% 33% 31% 18% 13% 9% 9% 8% 7% 6% 5% 5% 5% 4% 3% 16% 33% 10% 13% 9% 16% 10% 9% 7% 5% 4% 4% 9% 3% 3% 12%
0% 10% 20% 30% 40% Grandview (2022)National Average
Institute (2022)
Ways Households Learn About Programs
by percentage of respondents
43% 37% 37% 19% 15% 12% 11% 7% 6% 3% 40% 34% 36% 45% 19% 17% 2% 30% 3% 2% City recreation guide City website Facebook Friends and neighbors Flyers Email Nextdoor Newspaper Instagram Twitter 0% 10% 20% 30% 40% 50% Grandview (2022)National Average Institute (2022)
Respondents with Need for Park Amenity
by
percentage of respondents
53% 51% 44% 41% 40% 32% 30% 29% 29% 29% 21% 19% 17% 13% 47% 64% 50% 46% 38% 31% 29% 25% 28% 29% 20% 12% 13% 10% Nature/hiking trails Paved trails Picnic shelters Playgrounds Fishing pond/lake
gardens Splash pad Dog parks
amphitheater
basketball
golf courses Skate park 0% 25% 50% Grandview (2022)National Average
& wildlife benefit Institute (2022)
Community
Outdoor
Outdoor
courts Pickleball courts Disc
Natural areas for passive recreation
Respondents with Need for Programs
by percentage of respondents
Adult fitness & wellness programs
Community special events
Water fitness programs
Outdoor environmental programs
Swim lessons
After school programs
Youth summer programs & camps
Birthday parties
Youth fitness classes
Gymnastics/tumbling
Youth performing arts
Adult sports league
Teen programs
Preschool programs/early childhood education
Tennis lessons & leagues
63% 44% 30% 26% 23% 21% 17% 17% 17% 17% 16% 16% 15% 13% 12% 10% 46% 37% 26% 29% 22% 15% 18% 18% 17% 13% 16% 22% 14% 12% 14% 6%
eGaming/eSports 0% 15% 30% 45% 60% Grandview (2022)National Average Institute (2022)
Organizations Used for Recreation
by
respondents
percentage of
56% 14% 11% 44% 14% 14% City government Churches or other religious organizations Local schools 0% 15% 30% 45% 60%
(2022)National Average Institute (2022)
Grandview
Tabular Data 5
Q1. Please indicate if you or any members of your household use the following parks and facilities provided by the City of Grandview.
(N=319)
YesNo Q1-1. Belvidere Park 11.3% 88.7% Q1-2. Bobcat Park 3.4% 96.6% Q1-3. Freedom Park 15.7% 84.3% Q1-4. Grandview Community Center 55.8% 44.2% Q1-5. John Anderson Park 36.4% 63.6% Q1-6. Little Corner Park 8.5% 91.5% Q1-7. Mapleview Park 14.1% 85.9% Q1-8. Meadowmere Park 52.4% 47.6% Q1-9. River Oaks Park 11.3% 88.7% Q1-10. Shalimar Park 3.4% 96.6% Q1-11. Southview Park 7.8% 92.2% Q1-12. Tails & Trails Dog Park 22.6% 77.4% Q1-13. Terrace Park 2.2% 97.8% Q1-14. Valley Park 15.7% 84.3% Grandview, MO 2022 Survey ETC Institute (2022) 64
Q1. If you indicate "yes," please rate your overall satisfaction using a scale of 1 to 4, where 4 means "Very Satisfied" and 1 means "Very Dissatisfied."
(N=280)
Very Very satisfied Satisfied Dissatisfied dissatisfied Not provided Q1-1. Belvidere Park 13.9% 58.3% 19.4% 2.8% 5.6% Q1-2. Bobcat Park 0.0% 63.6% 18.2% 9.1% 9.1% Q1-3. Freedom Park 26.0% 64.0% 10.0% 0.0% 0.0% Q1-4. Grandview Community Center 48.3% 42.7% 8.4% 0.0% 0.6% Q1-5. John Anderson Park 27.6% 55.2% 12.9% 1.7% 2.6% Q1-6. Little Corner Park 29.6% 48.1% 22.2% 0.0% 0.0% Q1-7. Mapleview Park 31.1% 46.7% 22.2% 0.0% 0.0% Q1-8. Meadowmere Park 41.9% 47.9% 8.4% 0.6% 1.2% Q1-9. River Oaks Park 11.1% 50.0% 27.8% 8.3% 2.8% Q1-10. Shalimar Park 27.3% 45.5% 27.3% 0.0% 0.0% Q1-11. Southview Park 24.0% 64.0% 12.0% 0.0% 0.0% Q1-12. Tails & Trails Dog Park 31.9% 45.8% 19.4% 1.4% 1.4% Q1-13. Terrace Park 14.3% 71.4% 14.3% 0.0% 0.0% Q1-14. Valley Park 44.0% 42.0% 8.0% 2.0% 4.0% Grandview, MO 2022 Survey ETC Institute (2022) 65
(WITHOUT "NOT PROVIDED")
Q1. If you indicate "yes," please rate your overall satisfaction using a scale of 1 to 4, where 4 means "Very Satisfied" and 1 means "Very Dissatisfied." (without "not provided") (N=280)
Q2. Which THREE of these parks/facilities listed in Question 1 should the City of Grandview prioritize over the next TWO years?
Very Very satisfied Satisfied Dissatisfied dissatisfied Q1-1. Belvidere Park 14.7% 61.8% 20.6% 2.9% Q1-2. Bobcat Park 0.0% 70.0% 20.0% 10.0% Q1-3. Freedom Park 26.0% 64.0% 10.0% 0.0% Q1-4. Grandview Community Center 48.6% 42.9% 8.5% 0.0% Q1-5. John Anderson Park 28.3% 56.6% 13.3% 1.8% Q1-6. Little Corner Park 29.6% 48.1% 22.2% 0.0% Q1-7. Mapleview Park 31.1% 46.7% 22.2% 0.0% Q1-8. Meadowmere Park 42.4% 48.5% 8.5% 0.6% Q1-9. River Oaks Park 11.4% 51.4% 28.6% 8.6% Q1-10. Shalimar Park 27.3% 45.5% 27.3% 0.0% Q1-11. Southview Park 24.0% 64.0% 12.0% 0.0% Q1-12. Tails & Trails Dog Park 32.4% 46.5% 19.7% 1.4% Q1-13. Terrace Park 14.3% 71.4% 14.3% 0.0% Q1-14. Valley Park 45.8% 43.8% 8.3% 2.1%
Q2. Top choice Number Percent Belvidere Park 16 5.0 % Bobcat Park 9 2.8 % Freedom Park 7 2.2 % Grandview Community Center 82 25.7 % John Anderson Park 35 11.0 % Little Corner Park 7 2.2 % Mapleview Park 13 4.1 % Meadowmere Park 40 12.5 % River Oaks Park 12 3.8 % Shalimar Park 2 0.6 % Southview Park 6 1.9 % Tails & Trails Dog Park 24 7.5 % Valley Park 4 1.3 % None chosen 62 19.4 % Total 319 100.0 % Grandview, MO 2022 Survey ETC Institute (2022) 66
Q2. Which THREE of these parks/facilities listed in Question 1 should the City of Grandview prioritize over the next TWO years?
Q2. Which THREE of these parks/facilities listed in Question 1 should the City of Grandview prioritize over the next TWO years?
Q2. 2nd choice Number Percent Belvidere Park 19 6.0 % Bobcat Park 7 2.2 % Freedom Park 8 2.5 % Grandview Community Center 25 7.8 % John Anderson Park 25 7.8 % Little Corner Park 8 2.5 % Mapleview Park 15 4.7 % Meadowmere Park 63 19.7 % River Oaks Park 18 5.6 % Shalimar Park 4 1.3 % Southview Park 4 1.3 % Tails & Trails Dog Park 26 8.2 % Terrace Park 2 0.6 % Valley Park 9 2.8 % None chosen 86 27.0 % Total 319 100.0 %
Q2.
choice Number Percent Belvidere Park 11 3.4 % Bobcat Park 4 1.3 % Freedom Park 13 4.1 % Grandview Community Center 24 7.5 % John Anderson Park 30 9.4 % Little Corner Park 7 2.2 % Mapleview Park 7 2.2 % Meadowmere Park 36 11.3 % River Oaks Park 22 6.9 % Shalimar Park 7 2.2 % Southview Park 8 2.5 % Tails & Trails Dog Park 23 7.2 % Valley Park 15 4.7 % None chosen 112 35.1 % Total 319 100.0 % Grandview, MO 2022 Survey ETC Institute (2022) 67
3rd
Q2. Which THREE of these parks/facilities listed in Question 1 should the City of Grandview prioritize over the next TWO years? (top 3)
Q3. On average, how often do you or other members of your household visit parks in Grandview?
Q3. How
(WITHOUT "NOT PROVIDED")
Q3. On average, how often do you or other members of your household visit parks in Grandview? (without "not provided")
Q3.
Q2. Top choice Number Percent Belvidere Park 46 14.4 % Bobcat Park 20 6.3 % Freedom Park 28 8.8 % Grandview Community Center 131 41.1 % John Anderson Park 90 28.2 % Little Corner Park 22 6.9 % Mapleview Park 35 11.0 % Meadowmere Park 139 43.6 % River Oaks Park 52 16.3 % Shalimar Park 13 4.1 % Southview Park 18 5.6 % Tails & Trails Dog Park 73 22.9 % Terrace Park 2 0.6 % Valley Park 28 8.8 % None chosen 62 19.4 % Total 759
often
household visit parks in Grandview Number Percent Almost daily 28 8.8 % A few times per week 59 18.5 % At least once per week 33 10.3 % A few times per month 83 26.0 % A few times per year 50 15.7 % Once per year 6 1.9 % Seldom or never 53 16.6 % Not provided 7 2.2 % Total 319 100.0 %
do members of your
household visit parks in Grandview Number Percent Almost daily 28 9.0 % A few times per week 59 18.9 % At least once per week 33 10.6 % A few times per month 83 26.6 % A few times per year 50 16.0 % Once per year 6 1.9 % Seldom or never 53 17.0 % Total 312 100.0 % Grandview, MO 2022 Survey ETC Institute (2022) 68
How often do members of your
Q4. Which of the following reasons PREVENT you or other members of your household from using parks in Grandview, or from using them more often?
Q4. Which following reasons prevent your household from using parks in Grandview or from using them more often
Q5. How important do you feel it is for the City to provide high quality PARK FACILITIES?
Q5. How important is it for City to provide high quality
(WITHOUT "DON’T KNOW")
Q5. How important do you feel it is for the City to provide high quality PARK FACILITIES? (without "don't know")
Q5. How important is it for City to provide high quality
Q6. Which of the following organizations do you and other members of your household use for parks and recreation services?
Q6. Which following organizations do members of your
use for parks
Number Percent Too hard to find parking 26 8.2 % ADA accessibility is lacking 17 5.3 % Condition of amenities 63 19.7 % Lack of age-appropriate amenities 67 21.0 % Safety or security concerns 106 33.2 % Lack of maintenance & repair of existing facilities 57 17.9 % Not interested/too busy 65 20.4 % Amenities offered don't match my interests or needs 75 23.5 % Facilities too crowded 18 5.6 % Other 41 12.9 % Total 535
park facilities Number Percent Very important 226 70.8 % Somewhat important 69 21.6 % Somewhat not important 9 2.8 % Not important at all 5 1.6 % Don't know 10 3.1 % Total 319 100.0 %
facilities Number Percent Very important 226 73.1 % Somewhat important 69 22.3 % Somewhat not important 9 2.9 % Not important at all 5 1.6 % Total 309 100.0 %
park
household
& recreation services Number Percent City of Grandview 177 55.5 % Other local City/County Parks & Rec. Departments 104 32.6 % Local schools 36 11.3 % Churches or other religious organizations 45 14.1 % Other 12 3.8 % None of these 82 25.7 % Total 456 Grandview, MO 2022 Survey ETC Institute (2022) 69
(WITHOUT "NONE OF THESE")
Q6. Which of the following organizations do you and other members of your household use for parks and recreation services? (without "none of these")
Q6. Which following organizations do members of your household use for parks & recreation services
Q7. Which ONE of the organizations listed in Question 6 do you rely on most?
Q7. One organization you rely on most
Number Percent City of Grandview 176 74.3 % Other local City/County Parks & Rec. Departments 104 43.9 % Local schools 36 15.2 % Churches or other religious organizations 45 19.0 % Other 12 5.1 % Total 373
Number Percent City of Grandview 129 40.4 % Other local City/County Parks & Rec. Departments 54 16.9 % Local schools 10 3.1 % Churches or other religious organizations 29 9.1 % Other 4 1.3 % None of these 41 12.9 % None chosen 52 16.3 % Total 319 100.0 % Grandview, MO 2022 Survey ETC Institute (2022) 70
Q8. Please indicate if you or any members of your household have a need or desire for each of the park amenities listed below.
(N=319) Yes No Q8-1. Baseball/softball diamonds (for adults) 8.8% 91.2% Q8-2. Baseball/softball diamonds (for youth) 14.4% 85.6% Q8-3. Bicycle pump tracks 20.1% 79.9% Q8-4. Camping areas 20.4% 79.6% Q8-5. Community gardens 29.8% 70.2% Q8-6. Disc golf courses 16.9% 83.1% Q8-7. Dog parks 28.8% 71.2% Q8-8. Family games (bocce ball, shuffleboard, cornhole, etc.) 33.9% 66.1% Q8-9. Fishing pond/lake 31.7% 68.3% Q8-10. Horseshoe pits 10.7% 89.3% Q8-11. Mountain biking trails 21.0% 79.0% Q8-12. Natural areas for passive recreation & wildlife benefit 44.2% 55.8% Q8-13. Nature/hiking trails 52.7% 47.3% Q8-14. Outdoor amphitheater/event space 28.5% 71.5% Q8-15. Outdoor basketball courts 21.3% 78.7% Q8-16. Outdoor classroom space 8.8% 91.2% Q8-17. Outdoor educational spaces 13.2% 86.8% Q8-18. Outdoor pickleball courts 18.8% 81.2% Q8-19. Outdoor tennis courts 19.1% 80.9% Q8-20. Outdoor volleyball courts 18.2% 81.8% Grandview, MO 2022 Survey ETC Institute (2022) 71
Q8. Please indicate if you or any members of your household have a need or desire for each of the park amenities listed below.
Yes No Q8-21. Outdoor fitness areas 27.6% 72.4% Q8-22. Extreme fitness/ninja warrior course 12.5% 87.5% Q8-23. Paved trails 50.5% 49.5% Q8-24. Picnic shelters 41.1% 58.9% Q8-25. Site furnishings (benches, picnic tables, etc.) 44.5% 55.5% Q8-26. Playgrounds 39.5% 60.5% Q8-27. Splash pad 29.2% 70.8% Q8-28. Restrooms 58.3% 41.7% Q8-29. Skate park 12.9% 87.1% Q8-30. Soccer fields (for adults) 10.0% 90.0% Q8-31. Soccer fields (for youth) 16.3% 83.7% Q8-32. Un-programmed multi-purpose open green space 21.3% 78.7% Q8-33. Other 7.5% 92.5% Grandview, MO 2022 Survey ETC Institute (2022) 72
Q8. If "Yes," please rate all of the park amenities of this type using a scale of 1 to 4, where 4 means the needs of your household are currently "Fully Met" and 1 means "Not Met."
(N=293) Fully met Mostly met Partly met Not met Q8-1. Baseball/softball diamonds (for adults) 4.5% 18.2% 22.7% 54.5% Q8-2. Baseball/softball diamonds (for youth) 10.3% 28.2% 35.9% 25.6% Q8-3. Bicycle pump tracks 12.8% 12.8% 36.2% 38.3% Q8-4. Camping areas 3.4% 8.5% 22.0% 66.1% Q8-5. Community gardens 10.3% 17.9% 41.0% 30.8% Q8-6. Disc golf courses 4.4% 6.7% 8.9% 80.0% Q8-7. Dog parks 22.8% 38.0% 29.1% 10.1% Q8-8. Family games (bocce ball, shuffleboard, cornhole, etc.) 2.2% 7.6% 18.5% 71.7% Q8-9. Fishing pond/lake 10.5% 5.8% 25.6% 58.1% Q8-10. Horseshoe pits 6.9% 6.9% 17.2% 69.0% Q8-11. Mountain biking trails 15.8% 28.1% 22.8% 33.3% Q8-12. Natural areas for passive recreation & wildlife benefit 13.4% 27.6% 40.2% 18.9% Q8-13. Nature/hiking trails 18.8% 31.5% 36.9% 12.8% Q8-14. Outdoor amphitheater/event space 41.8% 36.7% 16.5% 5.1% Q8-15. Outdoor basketball courts 6.6% 16.4% 23.0% 54.1% Q8-16. Outdoor classroom space 14.3% 23.8% 19.0% 42.9% Q8-17. Outdoor educational spaces 9.7% 16.1% 29.0% 45.2% Q8-18. Outdoor pickleball courts 4.1% 6.1% 14.3% 75.5% Q8-19. Outdoor tennis courts 2.0% 14.0% 22.0% 62.0% Grandview, MO 2022 Survey ETC Institute (2022) 73
Q8. If "Yes," please rate all of the park amenities of this type using a scale of 1 to 4, where 4 means the needs of your household are currently "Fully Met" and 1 means "Not Met."
Fully met Mostly met Partly met Not met Q8-20. Outdoor volleyball courts 2.1% 6.4% 17.0% 74.5% Q8-21. Outdoor fitness areas 6.8% 18.9% 23.0% 51.4% Q8-22. Extreme fitness/ninja warrior course 2.8% 2.8% 13.9% 80.6% Q8-23. Paved trails 20.0% 32.9% 40.0% 7.1% Q8-24. Picnic shelters 24.8% 37.6% 33.0% 4.6% Q8-25. Site furnishings (benches, picnic tables, etc.) 18.3% 35.0% 38.3% 8.3% Q8-26. Playgrounds 24.5% 45.3% 25.5% 4.7% Q8-27. Splash pad 28.8% 30.0% 22.5% 18.8% Q8-28. Restrooms 13.8% 28.8% 41.9% 15.6% Q8-29. Skate park 21.2% 45.5% 24.2% 9.1% Q8-30. Soccer fields (for adults) 14.3% 17.9% 25.0% 42.9% Q8-31. Soccer fields (for youth) 11.6% 16.3% 27.9% 44.2% Q8-32. Un-programmed multi-purpose open green space 19.3% 24.6% 29.8% 26.3% Q8-33. Other 0.0% 4.8% 28.6% 66.7% Grandview, MO 2022 Survey ETC Institute (2022) 74
Q9. Which FOUR types of parks/amenities from the list in Question 8 are MOST IMPORTANT to your household?
Q9. Top choice
Number Percent Baseball/softball diamonds (for adults) 3 0.9 % Baseball/softball diamonds (for youth) 4 1.3 % Bicycle pump tracks 6 1.9 % Camping areas 7 2.2 % Community gardens 12 3.8 % Disc golf courses 8 2.5 % Dog parks 23 7.2 % Family games (bocce ball, shuffleboard, cornhole, etc.) 13 4.1 % Fishing pond/lake 16 5.0 % Horseshoe pits 1 0.3 % Mountain biking trails 13 4.1 % Natural areas for passive recreation & wildlife benefit 20 6.3 % Nature/hiking trails 34 10.7 % Outdoor amphitheater/event space 6 1.9 % Outdoor basketball courts 13 4.1 % Outdoor classroom space 1 0.3 % Outdoor pickleball courts 5 1.6 % Outdoor tennis courts 3 0.9 % Outdoor volleyball courts 2 0.6 % Outdoor fitness areas 4 1.3 % Extreme fitness/ninja warrior course 2 0.6 % Paved trails 20 6.3 % Picnic shelters 9 2.8 % Site furnishings (benches, picnic tables, etc.) 6 1.9 % Playgrounds 19 6.0 % Splash pad 2 0.6 % Restrooms 21 6.6 % Soccer fields (for youth) 4 1.3 % None chosen 42 13.2 % Total 319 100.0 % Grandview, MO 2022 Survey ETC Institute (2022) 75
Q9. Which FOUR types of parks/amenities from the list in Question 8 are MOST IMPORTANT to your household?
Q9. 2nd choice
Number Percent Baseball/softball diamonds (for adults) 1 0.3 % Baseball/softball diamonds (for youth) 6 1.9 % Bicycle pump tracks 5 1.6 % Camping areas 9 2.8 % Community gardens 6 1.9 % Disc golf courses 2 0.6 % Dog parks 15 4.7 % Family games (bocce ball, shuffleboard, cornhole, etc.) 16 5.0 % Fishing pond/lake 13 4.1 % Horseshoe pits 1 0.3 % Mountain biking trails 7 2.2 % Natural areas for passive recreation & wildlife benefit 22 6.9 % Nature/hiking trails 30 9.4 % Outdoor amphitheater/event space 8 2.5 % Outdoor basketball courts 11 3.4 % Outdoor pickleball courts 2 0.6 % Outdoor tennis courts 6 1.9 % Outdoor volleyball courts 6 1.9 % Outdoor fitness areas 8 2.5 % Extreme fitness/ninja warrior course 2 0.6 % Paved trails 26 8.2 % Picnic shelters 12 3.8 % Site furnishings (benches, picnic tables, etc.) 10 3.1 % Playgrounds 10 3.1 % Splash pad 11 3.4 % Restrooms 15 4.7 % Skate park 2 0.6 % Soccer fields (for youth) 3 0.9 % None chosen 54 16.9 % Total 319 100.0 % Grandview, MO 2022 Survey ETC Institute (2022) 76
Q9. Which FOUR types of parks/amenities from the list in Question 8 are MOST IMPORTANT to your household?
Q9. 3rd choice
Number Percent Baseball/softball diamonds (for youth) 1 0.3 % Bicycle pump tracks 4 1.3 % Camping areas 2 0.6 % Community gardens 15 4.7 % Disc golf courses 1 0.3 % Dog parks 8 2.5 % Family games (bocce ball, shuffleboard, cornhole, etc.) 13 4.1 % Fishing pond/lake 11 3.4 % Horseshoe pits 3 0.9 % Mountain biking trails 7 2.2 % Natural areas for passive recreation & wildlife benefit 11 3.4 % Nature/hiking trails 25 7.8 % Outdoor amphitheater/event space 10 3.1 % Outdoor basketball courts 4 1.3 % Outdoor classroom space 1 0.3 % Outdoor educational spaces 5 1.6 % Outdoor pickleball courts 3 0.9 % Outdoor tennis courts 4 1.3 % Outdoor volleyball courts 8 2.5 % Outdoor fitness areas 9 2.8 % Extreme fitness/ninja warrior course 1 0.3 % Paved trails 24 7.5 % Picnic shelters 12 3.8 % Site furnishings (benches, picnic tables, etc.) 10 3.1 % Playgrounds 19 6.0 % Splash pad 6 1.9 % Restrooms 21 6.6 % Skate park 2 0.6 % Soccer fields (for adults) 4 1.3 % Soccer fields (for youth) 2 0.6 % Un-programmed multi-purpose open green space 4 1.3 % None chosen 69 21.6 % Total 319 100.0 % Grandview, MO 2022 Survey ETC Institute (2022) 77
Q9. Which FOUR types of parks/amenities from the list in Question 8 are MOST IMPORTANT to your household?
4th choice Number Percent Bicycle pump tracks 4 1.3 % Camping areas 4 1.3 % Community gardens 12 3.8 % Disc golf courses 6 1.9 % Dog parks 10 3.1 % Family games (bocce ball, shuffleboard, cornhole, etc.) 8 2.5 % Fishing pond/lake 4 1.3 % Horseshoe pits 3 0.9 % Mountain biking trails 7 2.2 % Natural areas for passive recreation & wildlife benefit 21 6.6 % Nature/hiking trails 19 6.0 % Outdoor amphitheater/event space 4 1.3 % Outdoor basketball courts 2 0.6 % Outdoor classroom space 1 0.3 % Outdoor educational spaces 1 0.3 % Outdoor pickleball courts 4 1.3 % Outdoor tennis courts 5 1.6 % Outdoor volleyball courts 4 1.3 % Outdoor fitness areas 7 2.2 % Extreme fitness/ninja warrior course 1 0.3 % Paved trails 20 6.3 % Picnic shelters 10 3.1 % Site furnishings (benches, picnic tables, etc.) 15 4.7 % Playgrounds 7 2.2 % Splash pad 4 1.3 % Restrooms 14 4.4 % Skate park 2 0.6 % Soccer fields (for adults) 1 0.3 % Soccer fields (for youth) 5 1.6 % Un-programmed multi-purpose open green space 7 2.2 % None chosen 107 33.5 % Total 319 100.0 % Grandview, MO 2022 Survey ETC Institute (2022) 78
Q9.
(SUM OF TOP 4)
Q9. Which FOUR types of parks/amenities from the list in Question 8 are MOST IMPORTANT to your household? (top 4)
Q9. Top choice Number Percent Baseball/softball diamonds (for adults) 4 1.3 % Baseball/softball diamonds (for youth) 11 3.4 % Bicycle pump tracks 19 6.0 % Camping areas 22 6.9 % Community gardens 45 14.1 % Disc golf courses 17 5.3 % Dog parks 56 17.6 % Family games (bocce ball, shuffleboard, cornhole, etc.) 50 15.7 % Fishing pond/lake 44 13.8 % Horseshoe pits 8 2.5 % Mountain biking trails 34 10.7 % Natural areas for passive recreation & wildlife benefit 74 23.2 % Nature/hiking trails 108 33.9 % Outdoor amphitheater/event space 28 8.8 % Outdoor basketball courts 30 9.4 % Outdoor classroom space 3 0.9 % Outdoor educational spaces 6 1.9 % Outdoor pickleball courts 14 4.4 % Outdoor tennis courts 18 5.6 % Outdoor volleyball courts 20 6.3 % Outdoor fitness areas 28 8.8 % Extreme fitness/ninja warrior course 6 1.9 % Paved trails 90 28.2 % Picnic shelters 43 13.5 % Site furnishings (benches, picnic tables, etc.) 41 12.9 % Playgrounds 55 17.2 % Splash pad 23 7.2 % Restrooms 71 22.3 % Skate park 6 1.9 % Soccer fields (for adults) 5 1.6 % Soccer fields (for youth) 14 4.4 % Un-programmed multi-purpose open green space 11 3.4 % None chosen 42 13.2 % Total 1046 Grandview, MO 2022 Survey ETC Institute (2022) 79
Q10. Using a scale of 1 to 4, where 4 means "Very Satisfied" and 1 means "Very Dissatisfied," please rate your level of satisfaction with the following items. (N=319)
Very Very satisfied Satisfied Dissatisfied dissatisfied Don't know Q10-1. Park maintenance, cleanliness, & general upkeep 16.9% 56.1% 11.9% 4.4% 10.7% Q10-2. Park safety & security 8.5% 41.1% 22.3% 9.4% 18.8% Q10-3. Quality of park amenities 11.3% 49.2% 19.1% 4.4% 16.0% Q10-4. Park amenities meet needs of the community 6.6% 41.7% 26.3% 3.8% 21.6% Q10-5. Accessible amenities for limited mobility patrons 4.1% 24.1% 18.8% 7.5% 45.5% Q10-6. Distribution of parks (locations within the community) 15.0% 54.2% 6.9% 3.1% 20.7% Q10-7. Quality of recreation programs 8.5% 31.0% 16.3% 5.6% 38.6% Q10-8. Variety of recreation programs 6.6% 26.6% 22.9% 5.0% 38.9% Q10-9. Number & variety of community events in parks 8.5% 32.0% 22.3% 4.7% 32.6% Q10-10. Marketing & communication of programs & services 6.6% 31.7% 27.3% 7.5% 27.0% Q10-11. Park system overall as a whole 7.8% 54.9% 17.9% 3.8% 15.7% Grandview, MO 2022 Survey ETC Institute (2022) 80
(WITHOUT
"DON’T KNOW")
Q10. Using a scale of 1 to 4, where 4 means "Very Satisfied" and 1 means "Very Dissatisfied," please rate your level of satisfaction with the following items. (without "don't know")
Q11. Has your household participated in any recreation and wellness programs offered by the City of Grandview (for all ages) during the last 2 years? Q11. Has your household participated in any recreation & wellness programs during last 2 years
Very Very satisfied Satisfied Dissatisfied dissatisfied Q10-1. Park maintenance, cleanliness, & general upkeep 18.9% 62.8% 13.3% 4.9% Q10-2. Park safety & security 10.4% 50.6% 27.4% 11.6% Q10-3. Quality of park amenities 13.4% 58.6% 22.8% 5.2% Q10-4. Park amenities meet needs of the community 8.4% 53.2% 33.6% 4.8% Q10-5. Accessible amenities for limited mobility patrons 7.5% 44.3% 34.5% 13.8% Q10-6. Distribution of parks (locations within the community) 19.0% 68.4% 8.7% 4.0% Q10-7. Quality of recreation programs 13.8% 50.5% 26.5% 9.2% Q10-8. Variety of recreation programs 10.8% 43.6% 37.4% 8.2% Q10-9. Number & variety of community events in parks 12.6% 47.4% 33.0% 7.0% Q10-10. Marketing & communication of programs & services 9.0% 43.3% 37.3% 10.3% Q10-11. Park system overall as a whole 9.3% 65.1% 21.2% 4.5%
Number Percent Yes 101 31.7 % No 218 68.3 % Total 319 100.0 % Grandview, MO 2022 Survey ETC Institute (2022) 81
(N=319)
Q11a. How would you rate the overall quality of the City of Grandview recreation programs in which your household has participated?
Q11a. How would you rate overall quality of recreation programs
(WITHOUT "NOT PROVIDED")
Q11a. How would you rate the overall quality of the City of Grandview recreation programs in which your household has participated? (without "not provided")
Q11a. How would you rate overall quality of recreation programs
Q12. Which of the following reasons PREVENT you or other members of your household from using recreation and wellness programs offered by the City of Grandview, or from using them more often?
Q12. Which following reasons prevent your household from using recreation & wellness programs, or from using them more often
Number Percent Excellent 16 15.8 % Good 56 55.4 % Fair 26 25.7 % Poor 2 2.0 % Not provided 1 1.0 % Total 101 100.0 %
Number Percent Excellent 16 16.0 % Good 56 56.0 % Fair 26 26.0 % Poor 2 2.0 % Total 100 100.0 %
Number Percent Lack of quality instructors 22 6.9 % Old & outdated facilities 16 5.0 % Use programs of other agencies 29 9.1 % I don't know what is offered 108 33.9 % Lack of quality programs 28 8.8 % Fees are too high 100 31.3 % Too far from your home 11 3.4 % Program times are not convenient 110 34.5 % Classes are full 21 6.6 % Program not offered 42 13.2 % Registration is difficult 13 4.1 % Poor customer service by staff 20 6.3 % Lack of transportation 15 4.7 % Lack of right program equipment 16 5.0 % Too busy/not interested 59 18.5 % Lack of trust in government 9 2.8 % Language/cultural barriers 2 0.6 % Other 27 8.5 % Total 648 Grandview, MO 2022 Survey ETC Institute (2022) 82
Q13. From the following list, please CHECK ALL the ways you learn about City of Grandview Recreation programs (for all ages).
Q13. All the ways you learn about City recreation programs for all ages
Q13-16. Other
Q14. From the list in Question 13, which THREE methods of communication would you MOST PREFER the City use to communicate with you about recreation programs and activities?
Number Percent City recreation guide 138 43.3 % Nextdoor app for neighborhoods 36 11.3 % City website 119 37.3 % Materials at parks or recreation facilities 50 15.7 % Conversations with recreation staff 17 5.3 % Newspaper 23 7.2 % Friends & neighbors 61 19.1 % Promotions at special events 39 12.2 % Banners at parks or City facilities 101 31.7 % Email/eBlasts from City 38 11.9 % City newsletter 133 41.7 % Facebook 117 36.7 % Twitter 8 2.5 % Instagram 20 6.3 % Flyers 48 15.0 % Other 6 1.9 % Total 954
Q13-16. Other Number Percent Info found inside the View 1 16.7 % Word of mouth 1 16.7 % Home Association newsletters 1 16.7 % Annual parks report 1 16.7 % Grandview Report 1 16.7 % COMMUNITY BOARD-OUTDOOR AT LIBRARY, CITY HALL, ETC. 1 16.7 % Total 6 100.0 %
Q14. Top choice Number Percent City recreation guide 68 21.3 % Nextdoor app for neighborhoods 11 3.4 % City website 36 11.3 % Materials at parks or recreation facilities 10 3.1 % Conversations with recreation staff 1 0.3 % Newspaper 8 2.5 % Promotions at special events 2 0.6 % Banners at parks or City facilities 10 3.1 % Email/eBlasts from City 42 13.2 % City newsletter 45 14.1 % Facebook 44 13.8 % Instagram 2 0.6 % Flyers 13 4.1 % None chosen 27 8.5 % Total 319 100.0 % Grandview, MO 2022 Survey ETC Institute (2022) 83
Q14. From the list in Question 13, which THREE methods of communication would you MOST PREFER the City use to communicate with you about recreation programs and activities?
Q14. From the list in Question 13, which THREE methods of communication would you MOST PREFER the City use to communicate with you about recreation programs and activities?
Q14. 2nd choice Number Percent City recreation guide 16 5.0 % Nextdoor app for neighborhoods 7 2.2 % City website 47 14.7 % Materials at parks or recreation facilities 10 3.1 % Conversations with recreation staff 1 0.3 % Newspaper 7 2.2 % Friends & neighbors 7 2.2 % Promotions at special events 7 2.2 % Banners at parks or City facilities 23 7.2 % Email/eBlasts from City 27 8.5 % City newsletter 52 16.3 % Facebook 44 13.8 % Twitter 1 0.3 % Instagram 10 3.1 % Flyers 15 4.7 % None chosen 45 14.1 % Total 319 100.0 %
Q14. 3rd choice Number Percent City recreation guide 25 7.8 % Nextdoor app for neighborhoods 12 3.8 % City website 20 6.3 % Materials at parks or recreation facilities 16 5.0 % Conversations with recreation staff 8 2.5 % Newspaper 3 0.9 % Friends & neighbors 5 1.6 % Promotions at special events 10 3.1 % Banners at parks or City facilities 33 10.3 % Email/eBlasts from City 14 4.4 % City newsletter 37 11.6 % Facebook 34 10.7 % Twitter 3 0.9 % Instagram 3 0.9 % Flyers 24 7.5 % None chosen 72 22.6 % Total 319 100.0 % Grandview, MO 2022 Survey ETC Institute (2022) 84
(SUM OF TOP 3)
Q14. From the list in Question 13, which THREE methods of communication would you MOST PREFER the City use to communicate with you about recreation programs and activities? (top 3)
Q15. How important do you feel it is for the City of Grandview to provide high quality RECREATION PROGRAMS?
Q15. How important is it for City to provide high quality
(WITHOUT “DON’T KNOW")
Q15. How important do you feel it is for the City of Grandview to provide high quality RECREATION PROGRAMS? (without "don't know")
Q15. How important is it for City to provide high quality
Top choice Number Percent City recreation guide 109 34.2 % Nextdoor app for neighborhoods 30 9.4 % City website 103 32.3 % Materials at parks or recreation facilities 36 11.3 % Conversations with recreation staff 10 3.1 % Newspaper 18 5.6 % Friends & neighbors 12 3.8 % Promotions at special events 19 6.0 % Banners at parks or City facilities 66 20.7 % Email/eBlasts from City 83 26.0 % City newsletter 134 42.0 % Facebook 122 38.2 % Twitter 4 1.3 % Instagram 15 4.7 % Flyers 52 16.3 % None chosen 27 8.5 % Total 840
Q14.
recreation programs Number Percent Very important 226 70.8 % Somewhat important 69 21.6 % Somewhat not important 8 2.5 % Not important at all 7 2.2 % Don't know 9 2.8 % Total 319 100.0 %
recreation programs Number Percent Very important 226 72.9 % Somewhat important 69 22.3 % Somewhat not important 8 2.6 % Not important at all 7 2.3 % Total 310 100.0 % Grandview, MO 2022 Survey ETC Institute (2022) 85
Q16. Please indicate if you or any members of your household have a need for each of the alphabetically listed parks, recreation, and senior programs in the City of Grandview listed below.
(N=319) Yes No Q16-1. Adult fitness & wellness programs 63.3% 36.7% Q16-2. Adult sports leagues 15.7% 84.3% Q16-3. After school programs for youth of all ages 20.7% 79.3% Q16-4. Birthday parties 16.9% 83.1% Q16-5. Child Watch at Community Center (while adult uses amenities) 15.7% 84.3% Q16-6. Community special events 43.9% 56.1% Q16-7. Cultural enrichment programs 29.8% 70.2% Q16-8. eGaming/eSports 9.7% 90.3% Q16-9. Gymnastics/tumbling programs 16.6% 83.4% Q16-10. Leadership/professional development 13.8% 86.2% Q16-11. Outdoor environmental/nature camps & programs 26.3% 73.7% Q16-12. Outdoor water recreation (canoeing, kayaking, etc.) 25.7% 74.3% Q16-13. Preschool programs/early childhood education 12.9% 87.1% Q16-14. Programs for adults with special needs 17.9% 82.1% Q16-15. Programs for at risk youth/ crime prevention 19.7% 80.3% Q16-16. Programs for youth with special needs 15.0% 85.0% Q16-17. Programs relating to history 17.6% 82.4% Grandview, MO 2022 Survey ETC Institute (2022) 86
Q16. Please indicate if you or any members of your household have a need for each of the alphabetically listed parks, recreation, and senior programs in the City of Grandview listed below.
Yes No Q16-18. Recreation/competitive swim team 11.0% 89.0% Q16-19. Senior educational programs 26.6% 73.4% Q16-20. Senior health & wellness programs 39.8% 60.2% Q16-21. Senior nutrition programs 21.9% 78.1% Q16-22. Senior resource, information, & service coordination 28.2% 71.8% Q16-23. Senior trips 23.5% 76.5% Q16-24. STEAM (science, technology, engineering, arts & mathematics)/Tech Classes 23.5% 76.5% Q16-25. Swim lessons 22.6% 77.4% Q16-26. Teen/tween programs 15.4% 84.6% Q16-27. Tennis lessons & leagues 12.2% 87.8% Q16-28. Virtual programs 11.3% 88.7% Q16-29. Water fitness programs/lap swimming 30.1% 69.9% Q16-30. Youth fitness & wellness classes 16.9% 83.1% Q16-31. Youth performing arts programs (dance/music) 16.3% 83.7% Q16-32. Youth sports programs & camps 18.8% 81.2% Q16-33. Youth summer programs & camps 17.2% 82.8% Q16-34. Youth visual arts/crafts/ performing arts programs 16.3% 83.7% Q16-35. Other 3.4% 96.6% Grandview, MO 2022 Survey ETC Institute (2022) 87
Q16. If "Yes," please rate how well your needs for programs of this type are being met using a scale of 1 to 5, where 5 means they are "100% Met" and 1 means "0% Met." (N=299)
100% met 75% met 50% met 25% met 0% met Q16-1. Adult fitness & wellness programs 11.4% 26.9% 37.1% 10.2% 14.4% Q16-2. Adult sports leagues 2.3% 14.0% 18.6% 23.3% 41.9% Q16-3. After school programs for youth of all ages 4.1% 14.3% 22.4% 18.4% 40.8% Q16-4. Birthday parties 14.6% 29.3% 31.7% 12.2% 12.2% Q16-5. Child Watch at Community Center (while adult uses amenities) 13.3% 13.3% 30.0% 20.0% 23.3% Q16-6. Community special events 9.6% 26.3% 41.2% 16.7% 6.1% Q16-7. Cultural enrichment programs 3.8% 11.5% 20.5% 29.5% 34.6% Q16-8. eGaming/eSports 0.0% 0.0% 12.0% 16.0% 72.0% Q16-9. Gymnastics/tumbling programs 0.0% 7.5% 7.5% 12.5% 72.5% Q16-10. Leadership/professional development 2.8% 11.1% 13.9% 19.4% 52.8% Q16-11. Outdoor environmental/ nature camps & programs 6.1% 7.6% 18.2% 19.7% 48.5% Q16-12. Outdoor water recreation (canoeing, kayaking, etc.) 2.8% 2.8% 6.9% 9.7% 77.8% Q16-13. Preschool programs/early childhood education 8.6% 8.6% 5.7% 34.3% 42.9% Q16-14. Programs for adults with special needs 7.1% 7.1% 9.5% 21.4% 54.8% Q16-15. Programs for at risk youth/ crime prevention 0.0% 2.1% 10.6% 25.5% 61.7% Q16-16. Programs for youth with special needs 0.0% 6.1% 15.2% 9.1% 69.7% Q16-17. Programs relating to history 5.1% 7.7% 25.6% 15.4% 46.2% Grandview, MO 2022 Survey ETC Institute (2022) 88
Q16. If "Yes," please rate how well your needs for programs of this type are being met using a scale of 1 to 5, where 5 means they are "100% Met" and 1 means "0% Met."
100% met 75% met 50% met 25% met 0% met Q16-18. Recreation/competitive swim team 3.6% 7.1% 17.9% 14.3% 57.1% Q16-19. Senior educational programs 5.0% 18.3% 26.7% 16.7% 33.3% Q16-20. Senior health & wellness programs 6.7% 20.2% 28.1% 15.7% 29.2% Q16-21. Senior nutrition programs 6.4% 14.9% 14.9% 21.3% 42.6% Q16-22. Senior resource, information, & service coordination 3.6% 16.4% 23.6% 16.4% 40.0% Q16-23. Senior trips 12.5% 20.8% 20.8% 22.9% 22.9% Q16-24. STEAM (science, technology, engineering, arts & mathematics)/Tech Classes 3.7% 7.4% 5.6% 16.7% 66.7% Q16-25. Swim lessons 18.9% 26.4% 13.2% 22.6% 18.9% Q16-26. Teen/tween programs 0.0% 9.1% 12.1% 15.2% 63.6% Q16-27. Tennis lessons & leagues 0.0% 9.7% 9.7% 12.9% 67.7% Q16-28. Virtual programs 4.2% 4.2% 4.2% 16.7% 70.8% Q16-29. Water fitness programs/lap swimming 6.7% 10.7% 33.3% 21.3% 28.0% Q16-30. Youth fitness & wellness classes 5.3% 15.8% 15.8% 21.1% 42.1% Q16-31. Youth performing arts programs (dance/music) 5.4% 16.2% 8.1% 16.2% 54.1% Q16-32. Youth sports programs & camps 10.3% 20.5% 17.9% 17.9% 33.3% Q16-33. Youth summer programs & camps 8.3% 22.2% 13.9% 11.1% 44.4% Q16-34. Youth visual arts/crafts/ performing arts programs 8.3% 11.1% 5.6% 19.4% 55.6% Q16-35. Other 0.0% 10.0% 0.0% 0.0% 90.0% Grandview, MO 2022 Survey ETC Institute (2022) 89
Q16-35. Other
Q17. Which FOUR programs from the list in Question 16 are MOST IMPORTANT to your household?
Q16-35. Other Number Percent Outdoor swimming pool 2 18.2 % Gardens 1 9.1 % A hot tub 1 9.1 % Pet programs such as training and agility 1 9.1 % Community transportation/bus 1 9.1 % Public pool 1 9.1 % Swimming pool 1 9.1 % Splash pad at some parks, or an outdoor pool for summer 1 9.1 % More swimming pools and winter sports 1 9.1 % Weight training & jogging track 1 9.1 % Total 11 100.0 %
Q17. Top choice Number Percent Adult fitness & wellness programs 90 28.2 % Adult sports leagues 3 0.9 % After school programs for youth of all ages 12 3.8 % Birthday parties 7 2.2 % Child Watch at Community Center (while adult uses amenities) 4 1.3 % Community special events 26 8.2 % Cultural enrichment programs 5 1.6 % eGaming/eSports 1 0.3 % Gymnastics/tumbling programs 8 2.5 % Leadership/professional development 1 0.3 % Outdoor environmental/nature camps & programs 6 1.9 % Outdoor water recreation (canoeing, kayaking, etc.) 7 2.2 % Preschool programs/early childhood education 2 0.6 % Programs for adults with special needs 2 0.6 % Programs for at risk youth/crime prevention 5 1.6 % Programs for youth with special needs 2 0.6 % Programs relating to history 3 0.9 % Senior educational programs 9 2.8 % Senior health & wellness programs 20 6.3 % Senior nutrition programs 2 0.6 % Senior resource, information, & service coordination 3 0.9 % Senior trips 5 1.6 % STEAM (science, technology, engineering, arts & mathematics)/Tech Classes 7 2.2 % Swim lessons 10 3.1 % Teen/tween programs 3 0.9 % Tennis lessons & leagues 1 0.3 % Water fitness programs/lap swimming 14 4.4 % Youth performing arts programs (dance/music) 1 0.3 % Youth sports programs & camps 3 0.9 % Youth summer programs & camps 1 0.3 % Youth visual arts/crafts/performing arts programs 4 1.3 % None chosen 52 16.3 % Total 319 100.0 % Grandview, MO 2022 Survey ETC Institute (2022) 90
Q17. Which FOUR programs from the list in Question 16 are
MOST IMPORTANT
to your household?
Q17. 2nd choice Number Percent Adult fitness & wellness programs 23 7.2 % Adult sports leagues 9 2.8 % After school programs for youth of all ages 6 1.9 % Birthday parties 5 1.6 % Child Watch at Community Center (while adult uses amenities) 4 1.3 % Community special events 22 6.9 % Cultural enrichment programs 8 2.5 % eGaming/eSports 6 1.9 % Gymnastics/tumbling programs 3 0.9 % Leadership/professional development 11 3.4 % Outdoor environmental/nature camps & programs 11 3.4 % Outdoor water recreation (canoeing, kayaking, etc.) 18 5.6 % Preschool programs/early childhood education 7 2.2 % Programs for adults with special needs 10 3.1 % Programs for at risk youth/crime prevention 8 2.5 % Programs for youth with special needs 1 0.3 % Programs relating to history 3 0.9 % Recreation/competitive swim team 3 0.9 % Senior educational programs 10 3.1 % Senior health & wellness programs 17 5.3 % Senior nutrition programs 7 2.2 % Senior resource, information, & service coordination 10 3.1 % Senior trips 4 1.3 % STEAM (science, technology, engineering, arts & mathematics)/Tech Classes 2 0.6 % Swim lessons 6 1.9 % Teen/tween programs 8 2.5 % Tennis lessons & leagues 2 0.6 % Virtual programs 1 0.3 % Water fitness programs/lap swimming 11 3.4 % Youth fitness & wellness classes 1 0.3 % Youth performing arts programs (dance/music) 3 0.9 % Youth sports programs & camps 3 0.9 % Youth summer programs & camps 5 1.6 % Youth visual arts/crafts/performing arts programs 2 0.6 % None chosen 69 21.6 % Total 319 100.0 % Grandview, MO 2022 Survey ETC Institute (2022) 91
Q17. Which FOUR programs from the list in Question 16 are
MOST IMPORTANT to your household?
Q17. 3rd choice Number Percent Adult fitness & wellness programs 8 2.5 % Adult sports leagues 4 1.3 % After school programs for youth of all ages 4 1.3 % Birthday parties 2 0.6 % Child Watch at Community Center (while adult uses amenities) 3 0.9 % Community special events 21 6.6 % Cultural enrichment programs 8 2.5 % eGaming/eSports 4 1.3 % Gymnastics/tumbling programs 5 1.6 % Leadership/professional development 3 0.9 % Outdoor environmental/nature camps & programs 9 2.8 % Outdoor water recreation (canoeing, kayaking, etc.) 15 4.7 % Preschool programs/early childhood education 4 1.3 % Programs for adults with special needs 3 0.9 % Programs for at risk youth/crime prevention 8 2.5 % Programs for youth with special needs 3 0.9 % Programs relating to history 8 2.5 % Recreation/competitive swim team 2 0.6 % Senior educational programs 8 2.5 % Senior health & wellness programs 20 6.3 % Senior nutrition programs 8 2.5 % Senior resource, information, & service coordination 15 4.7 % Senior trips 8 2.5 % STEAM (science, technology, engineering, arts & mathematics)/Tech Classes 11 3.4 % Swim lessons 8 2.5 % Teen/tween programs 4 1.3 % Virtual programs 9 2.8 % Water fitness programs/lap swimming 3 0.9 % Youth fitness & wellness classes 6 1.9 % Youth performing arts programs (dance/music) 7 2.2 % Youth sports programs & camps 2 0.6 % Youth summer programs & camps 4 1.3 % Youth visual arts/crafts/performing arts programs 4 1.3 % None chosen 88 27.6 % Total 319 100.0 % Grandview, MO 2022 Survey ETC Institute (2022) 92
Q17. Which FOUR programs from the list in Question 16 are
Q17. 4th
MOST IMPORTANT to your household?
choice Number Percent Adult fitness & wellness programs 5 1.6 % Adult sports leagues 2 0.6 % After school programs for youth of all ages 3 0.9 % Birthday parties 1 0.3 % Child Watch at Community Center (while adult uses amenities) 3 0.9 % Community special events 16 5.0 % Cultural enrichment programs 15 4.7 % eGaming/eSports 3 0.9 % Gymnastics/tumbling programs 2 0.6 % Leadership/professional development 7 2.2 % Outdoor environmental/nature camps & programs 8 2.5 % Outdoor water recreation (canoeing, kayaking, etc.) 6 1.9 % Preschool programs/early childhood education 3 0.9 % Programs for adults with special needs 1 0.3 % Programs for at risk youth/crime prevention 9 2.8 % Programs for youth with special needs 3 0.9 % Programs relating to history 5 1.6 % Recreation/competitive swim team 1 0.3 % Senior educational programs 13 4.1 % Senior health & wellness programs 6 1.9 % Senior nutrition programs 13 4.1 % Senior resource, information, & service coordination 13 4.1 % Senior trips 10 3.1 % STEAM (science, technology, engineering, arts & mathematics)/Tech Classes 12 3.8 % Swim lessons 4 1.3 % Teen/tween programs 2 0.6 % Tennis lessons & leagues 2 0.6 % Virtual programs 3 0.9 % Water fitness programs/lap swimming 12 3.8 % Youth fitness & wellness classes 3 0.9 % Youth performing arts programs (dance/music) 3 0.9 % Youth sports programs & camps 1 0.3 % Youth summer programs & camps 4 1.3 % Youth visual arts/crafts/performing arts programs 6 1.9 % None chosen 119 37.3 % Total 319 100.0 % Grandview, MO 2022 Survey ETC Institute (2022) 93
(SUM OF TOP 4)
Q17. Which FOUR programs from the list in Question 16 are MOST IMPORTANT to your household? (top 4)
Q17. Top choice Number Percent Adult fitness & wellness programs 126 39.5 % Adult sports leagues 18 5.6 % After school programs for youth of all ages 25 7.8 % Birthday parties 15 4.7 % Child Watch at Community Center (while adult uses amenities) 14 4.4 % Community special events 85 26.6 % Cultural enrichment programs 36 11.3 % eGaming/eSports 14 4.4 % Gymnastics/tumbling programs 18 5.6 % Leadership/professional development 22 6.9 % Outdoor environmental/nature camps & programs 34 10.7 % Outdoor water recreation (canoeing, kayaking, etc.) 46 14.4 % Preschool programs/early childhood education 16 5.0 % Programs for adults with special needs 16 5.0 % Programs for at risk youth/crime prevention 30 9.4 % Programs for youth with special needs 9 2.8 % Programs relating to history 19 6.0 % Recreation/competitive swim team 6 1.9 % Senior educational programs 40 12.5 % Senior health & wellness programs 63 19.7 % Senior nutrition programs 30 9.4 % Senior resource, information, & service coordination 41 12.9 % Senior trips 27 8.5 % STEAM (science, technology, engineering, arts & mathematics)/Tech Classes 32 10.0 % Swim lessons 28 8.8 % Teen/tween programs 17 5.3 % Tennis lessons & leagues 5 1.6 % Virtual programs 13 4.1 % Water fitness programs/lap swimming 40 12.5 % Youth fitness & wellness classes 10 3.1 % Youth performing arts programs (dance/music) 14 4.4 % Youth sports programs & camps 9 2.8 % Youth summer programs & camps 14 4.4 % Youth visual arts/crafts/performing arts programs 16 5.0 % None chosen 52 16.3 % Total 1000 Grandview, MO 2022 Survey ETC Institute (2022) 94
Q18. Please indicate how much you agree that the following are important priorities for the Parks and Recreation Department over the next 10 years using a scale of 1 to 4, where 4 means "Strongly Agree" and 1 means "Strongly Disagree." (N=319)
Update existing park amenities that are aging & in poor condition
necessary, expand connections,
Provide amenities such as a large shelter & site furnishings to improve the farmers market experience
Strongly Strongly agree Agree Disagree disagree Don't know Q18-1.
throughout park system 58.6% 29.8% 1.6% 0.6% 9.4% Q18-2. Add new park amenities 42.0% 37.9% 3.1% 1.6% 15.4% Q18-3. Improve the offering of recreation programs 40.8% 39.5% 2.2% 1.6% 16.0% Q18-4.
&
benches
trails 49.2% 36.1% 2.2% 1.3% 11.3% Q18-5. Improve the perception of safety & security in parks 58.3% 26.0% 2.5% 0.9% 12.2% Q18-6. Improve marketing & communication of recreation programs & events 39.5% 40.4% 3.8% 1.6% 14.7% Q18-7. Add more multi-generational amenities throughout the parks 40.8% 35.1% 4.7% 1.6% 17.9% Q18-8. Focus on the beautification of parks 32.0% 43.9% 6.9% 1.3% 16.0% Q18-9. Increase the number & quality of events at the amphitheater 33.2% 35.1% 8.2% 1.6% 21.9% Q18-10.
to attend 44.5% 33.9% 4.1% 1.6% 16.0% Q18-11. Other 100.0% 0.0% 0.0% 0.0% 0.0% Grandview, MO 2022 Survey ETC Institute (2022) 95
Enhance paved trail experiences. Improve pavement conditions as
add more
along
& encourage more vendors
(WITHOUT "DON’T KNOW")
Q18. Please indicate how much you agree that the following are important priorities for the Parks and Recreation Department over the next 10 years using a scale of 1 to 4, where 4 means "Strongly Agree" and 1 means "Strongly Disagree." (without "don't know") (N=319)
Update existing park amenities that are aging & in poor condition
Improve pavement conditions as necessary, expand connections,
amenities such as a large shelter & site furnishings to improve the farmers market experience &
Strongly Strongly agree Agree Disagree disagree Q18-1.
throughout park system 64.7% 32.9% 1.7% 0.7% Q18-2. Add new park amenities 49.6% 44.8% 3.7% 1.9% Q18-3. Improve the
of recreation programs 48.5% 47.0% 2.6% 1.9% Q18-4.
more benches along trails 55.5% 40.6% 2.5% 1.4% Q18-5. Improve the perception of
& security in parks 66.4% 29.6% 2.9% 1.1% Q18-6. Improve marketing & communication of recreation programs & events 46.3% 47.4% 4.4% 1.8% Q18-7. Add more multi-generational amenities throughout the parks 49.6% 42.7% 5.7% 1.9% Q18-8. Focus on the beautification of parks 38.1% 52.2% 8.2% 1.5% Q18-9. Increase the number & quality of events at the amphitheater 42.6% 45.0% 10.4% 2.0% Q18-10.
encourage more vendors to attend 53.0% 40.3% 4.9% 1.9% Q18-11. Other 100.0% 0.0% 0.0% 0.0% Grandview, MO 2022 Survey ETC Institute (2022) 96
offering
Enhance paved trail experiences.
& add
safety
Provide
Q19. Approximately how many years has your household resided in Grandview?
Q19. How many years has your household resided in Grandview
(WITHOUT "NOT PROVIDED")
Q19. Approximately how many years has your household resided in Grandview? (without "not provided")
Q19. How many years has your household resided in Grandview
Q20. What is your age?
(WITHOUT "NOT PROVIDED")
Q20. What is your age? (without "not provided")
Q20. Your age
Number Percent 0-5 56 17.6 % 6-10 42 13.2 % 11-15 22 6.9 % 16-20 37 11.6 % 21-30 62 19.4 % 31+ 93 29.2 % Not provided 7 2.2 % Total 319 100.0 %
Number Percent 0-5 56 17.9 % 6-10 42 13.5 % 11-15 22 7.1 % 16-20 37 11.9 % 21-30 62 19.9 % 31+ 93 29.8 % Total 312 100.0 %
Q20. Your age Number Percent 18-34 59 18.5 % 35-44 62 19.4 % 45-54 61 19.1 % 55-64 64 20.1 % 65+ 66 20.7 % Not provided 7 2.2 % Total 319 100.0 %
Number Percent 18-34 59 18.9 % 35-44 62 19.9 % 45-54 61 19.6 % 55-64 64 20.5 % 65+ 66 21.2 % Total 312 100.0 % Grandview, MO 2022 Survey ETC Institute (2022) 97
Q21. Which of the following best describes your race?
Q21-7. Self-describe your race:
Self-describe your race
Q22. Including yourself, how many people in your household are...
Q21. Your race Number Percent Asian or Asian Indian 5 1.6 % Black or African American 112 35.1 % American Indian or Alaska Native 2 0.6 % White or Caucasian 162 50.8 % Hispanic/Spanish/Latino/a/x 37 11.6 % Other 5 1.6 % Total 323
Number Percent Mixed 2 40.0 % British 1 20.0 % More than one 1 20.0 % Multi-racial 1 20.0 % Total 5 100.0 %
Q21-7.
Mean Sum number 2.8 874 Under age 5 0.2 65 Ages 5-9 0.2 53 Ages 10-14 0.2 51 Ages 15-19 0.2 66 Ages 20-24 0.2 48 Ages 25-34 0.3 80 Ages 35-44 0.3 105 Ages 45-54 0.4 114 Ages 55-64 0.5 143 Ages 65-74 0.3 84 Ages 75+ 0.2 65 Grandview, MO 2022 Survey ETC Institute (2022) 98
Q23. With which gender do you identify most?
Q23-5. Self-describe your gender identity:
Self-describe your gender
Q24. Which of the following BEST describes your annual household income?
(WITHOUT "PREFER NOT TO ANSWER")
Q24. Which of the following BEST describes your annual household income? (without "prefer not to answer")
Q24. Your annual household income
Q23. Your gender Number Percent Male 156 48.9 % Female 160 50.2 % Non-binary 1 0.3 % LGBTQIA+ 1 0.3 % Other 1 0.3 % Total 319 100.0 %
Q23-5.
Number Percent Female/LGTQIA 1 100.0 % Total 1 100.0 %
Q24.
annual household income Number Percent Under $30K 52 16.3 % $30K-$59,999 80 25.1 % $60K-$99,999 69 21.6 % $100K-$149,999 41 12.9 % $150K-$199,999 7 2.2 % $200K+ 1 0.3 % Prefer not to answer 69 21.6 % Total 319 100.0 %
Your
Number
Under $30K 52 20.8 % $30K-$59,999 80 32.0 % $60K-$99,999 69 27.6 % $100K-$149,999 41 16.4 % $150K-$199,999 7 2.8 % $200K+ 1 0.4 % Total 250 100.0 % Grandview, MO 2022 Survey ETC Institute (2022) 99
Percent
6
Open-Ended Responses
Q4—“Other”: Which of the following reasons PREVENT you or other members of your household from using parks in Grandview, or from using them more often?
ALWAYS LOCKED
bathrooms being closed
Be working all the time
Couldn't decide on the date
disability
Don’t know where to find any of those parks
Have family in other areas of KC and visit their parks as well
health
health
health
I cannot walk or stand for very long at a time.
I don't have children, so I typically just walk through parks with my dogs. I don't like spending a lot of time in them because of the noise.
I work part time and classes that I want are not available on the days I am off.
I WORK TOO MUCH
Just some times time in the day
Lack of walking trails, and shade during the summer.
mobility/health issues
My time constraints. Days getting shorter. Its all on me.
no bathroom
no bathroom, cold weather
no parking
No sidewalk for pedestrians going over the blind hill by the railroad tracks on 135th st. We cannot see cars coming and they cannot see pedestrians. Very dangerous. How are people get to the park safely?
no Swimming pool
Not enough advertising, don't know about them.
Not feeling well enough to walk far.
Proximity
Setting priorities
Southview park ‐it would be nice to add monkey bars another table and a water fountain. The View‐ should discount or credit monthly memberships when they are closed for unexpectedly or without notice.
Specifically the belvedere Park there is no age appropriate toys for way younger children to play on and that Park is literally right down the street from my house I would love to be able to take my kids to play there but my one and two year old can't even play there because there's nothing their age to play with
The lap pool at the view is not often available for true laps, not long enough, not private enough (only laps!), difficult to figure out its schedule.
Open‐Ended Questions
Responses
Grandview, MO 2022 Survey ETC Institute (2022) 101
There needs to be a survey for new residents to Grandview. I have not had time yet to enjoy any of the parks in Grandview yet.
There’s nothing preventing me from coming more often other than I work a lot!! When my grandkids come over we let them choose a park to go to!!
times when open
Use for my great grandchildren that live out of town.
use parks for holidays
Usually just the timing with the weather and our schedule
view needs upgrade
we don’t have children of the age to use the facilities.
We go as often as we can/ schedule and weather permitting. On average, once per week, but sometimes several. I don’t visit Freedom park alone with my kids after a man with an iPad was watching kids and then another time witnessing a mom screaming and swearing at her kids. It felt unsafe after those two incidents. I go to Valley Park most, because I can see all my kids from one spot and it offers something for most ages. I also love Meadowmere, though I think it needs some shade canopies.
We have 17 acres of land. I haul out to trail ride my horses at Blue River Park and James A Reed. Plenty of land at home to maintain and room to roam without going to a local park. Grandsons fish in our pond and ride their ATVs in our pastures. (I probably shouldn’t be taking this survey since it doesn’t apply to me although we do live in Grandview.)
We need an outdoor community pool.
Grandview, MO 2022 Survey ETC Institute (2022) 102
Q6—“Other Local City/County Parks and Recreation Departments—Where?”: Which of the following organizations do you and other members of your household use for parks and recreation services?
Belton
Belton
Belton
Belton
Belton
Belton
Belton and Raymore
Belton and Raymore
Belton Memorial Park
Belton, Overland Park
Belton and Raymore
Blue River Parkway
Blue Springs
City Hall
Community Center
Downtown KC parks
Jackson County parks
Jackson County parks
Jackson County Parks & Rec, Lee's Summit Parks & Recreation (but only because I work in maintenance with LS Parks)
Jackson County Parks and Rec, Cass County Parks and Rec
Jackson County Trails
Johnson County
Johnson County
Johnson County (KS), City of Leawood, City of Overland Park
Kansas City
Kansas city
Kansas City
Kansas City and Johnson County KS
Kansas City and Raytown
Kansas City, Missouri facilities by Longview Lake and off the Blue River
Kansas City, MO Parks and Rec
Kansas City Parks and Recreation
"Kansas City
Leawood"
Kansas City, Overland Park
KC parks
KCMO
KCMO
KCMO
Lake Longview
Leawood area off I‐35 and State Line.
Leawood City park, Gozer 135th
Leawood, Belton
Leawood, KS, Gezer Park
Leawood, Overland Park
Leawood, Overland Park, Belton
Leawood, Prairie Village
Lee's Summit
Lee's Summit
Lee's Summit
Lee's Summit, Leawood
Lee's Summit, Overland Park, Leawood
Lee's Summit, Penguin Park
Lee’s Summit and KC
Lee's Summit
Lee's Summit
Lee's Summit
Lee's Summit
Lee's summit legacy park, Longview Rec Center
Lee's Summit parks or Belton parks for age appropriate play toys
Lee's Summit, Belton, Blue Springs, Bonner Springs, Overland Park, others that have disc golf courses
Lee's Summit, Blue Springs, Independence
Longview Lake
Longview Lake
Longview Lake
Longview Lake
Longview Rec Ctr, Longview park & trails, biking
Grandview, MO 2022 Survey ETC Institute (2022) 103
Longview Lake but Jackson County parks and recreation always has all the area's gates closed and locked all the time.
Longview Lake trails and picnic areas
Longview, Lee's Summit, St. Clair County
Loose Park, Thesis Park
Minor park
Minor Park, Sunnyside Park, Swope Park, Loose Park, KC Zoo, Starlight KC Parks and Rec, Longview Lake, Jacamo Lake Jackson County Parks and Rec, Smithville Lake Clay County Parks and Rec
Olathe
Overland Park
Overland Park
Overland Park, South Kansas City
Overland Park, Leawood
Overland Park, Roe Park, Strang Park, Meadowbrook Park
Raymore
"Raymore Lee's Summit "
Soccer competition
Some parks in Overland Park, KS
Sometimes Lee’s Summit because my daughter lives there with my granddaughter
Swope Park
The View Community Center
We walk the arboretum in Stilwell KS. Years ago, we loved to walk the trail around Longview Lake, but we stopped using it when it became too dangerous.
Q6‐3 “Local Schools (Where?)”: Which of the following organizations do you and other members of your household use for parks and recreation services?
All for picnics, or field trips
Belvidere
Belvidere
Belvidere
Belvidere
Belvidere
Belvidere
Belvidere Elementary
Belvidere when they have it unlocked
Blue Ridge Christian
Butcher Greene Elementary School
ConWest
ConWest
GHS football field
Grandview High
Grandview High School
Grandview High School
Grandview High School
Grandview High School
Grandview High School
Grandview High School tennis courts
Grandview Middle
Grandview Middle School
Grandview Middle School, Grandview High School
Grandview Senior High
High Grove
High school
Lee's Summit, Independence, Blue Springs
Meadowmere
Meadowmere
Meadowmere, Grandview Middle and High School
Meadowmere, Grandview Middle School, Grandview High School
The high school
Truman, Ingles
Grandview, MO 2022 Survey ETC Institute (2022) 104
Q6‐4 “Churches or other religious organizations (Where?)”: Which of the following organizations do you and other members of your household use for parks and recreation services?
Amphitheater
Belton Assembly of God
Church of Jesus Christ of Latter‐Day Saints
Coordination of Our Lady
Coronation of Our Lady
Coronation Parish
Covenant Presbyterian Church
First Baptist Church Grandview
First Baptist Church Grandview
Forerunner
Forerunner
Forerunner Church
Grandview Holy Trinity Lutheran
Holy Trinity Lutheran
Holy Trinity Lutheran Church
IHOPKC Shiloh
KCMO
Lee's Summit
Multiply Church
Our Lady of the Presentation
Paseo Baptist
Resurrection in Leawood
Revive KC Church
Saint Thomas More
Second Missionary
Second Presbyterian
South Haven Baptist Church, Belton, MO
Southview Christian Church
St James/St Luke's UMC
St. Paul's UMC
Three Trails Community
Trinity Temple
Trinity Temple, New Life in Christ
Q6‐5 “Other”: Which of the following organizations do you and other members of your household use for parks and recreation services?
Belton
Family gathering
Family get together
Grandview Historical Society
Longview Golf Course
State parks
The Greenfield Village Park
The View
The View
Truman Lake
Grandview, MO 2022 Survey ETC Institute (2022) 105
Q8—“Other”: Please indicate if you or any member of your household has a need or desire for each of the park amenities listed below.
A city outdoor pool
accessible equipment
ADULT SWIMMING POOL
Archery Range
community orchards
flowers
golf
Kite flying.
landscaping
Larger classrooms ‐ we are very crowded in the current classroom for silver sneakers and short on equipment (bands, balls, weights)
More places for family or defined single spaces to cook out with seating plus
extra seating. Need outlets to play electronics or charge a cell phone.
More swings and play equipment.
Need a community outdoor swimming pool
Outdoor swimming pool
Outdoor swimming pool
Outdoor swimming pool
Outdoor swimming pool/waterpark
pickleball
public pool
soccer for kids
Swimming pool
walking trails/running
WIFFLE BALL FIELD
Youth football fields (flag and tackle)
Q12—“Other”: Which of the following reasons PREVENT you or other members of your household from using recreation and wellness programs offered by the City of Grandview, or from using them more often?
Cost
Covid concerns I am immunocompromised
Current illness....broken leg
Desire to not run into students from school.
handicap access
health
home gym
I have a chronic illness and energy is often low. It is hard to make it a priority some days.
I WORK TOO MUCH
I’m very busy
Little offered for solo seniors, except bingo
Me and my time restraints
New to city. May visit next spring and summer
No interest by other family members. I ride my bike and walk the trails by Longview Lake and O'Donnell Park which isn't listed.
NOT RIGHT AGE GROUPS
physical limitations
removing John Anderson park pool was a horrible idea. they cited reason as lack of people using it. it was rarely open and the hours open were not hours when adults could come.
Safety
Grandview, MO 2022 Survey ETC Institute (2022) 106
security
Sure wish Grandview, Center had hot tubs & whirlpools.
There is nothing preventing us from using recreation and wellness programs offered by the City of Grandview, or from using them more often.
Times classes are offered and lack of a variety of classes for adults.
To many people in the water aerobics class and inferior instructors. Pool not designed for that many people in the pool at one time. The original classes were limited as it was an extra fee to join and the instructor was superior! She told you were what the exercise was for the current instructor only wants to play volleyball! I was an original member. I opted out! Too many people in the silver sneakers exercise class to same teacher
We wanted a pass for the View, but the pools was broken for months with no reduction in membership price.
Q18—“Other”:
Important priorities for Parks and Recreation over the next 10 years
Add Swimming pools including southwest side of Grandview, with Evening Adults only swimming hours.
Build an outdoor public swimming pool for the youth and adults in Grandview
convert lighting to solar
DOG WATER FOUNTAINS
Expand parking and knowledge about the Farmers Market, Years ago there used to be an agency called The Welcome Wagon. They would mail out coupons from various business and give knowledge about annual or semiannual events to those persons who were new to the city/town.
focus on youth
Implement programs for dogs
lighting on paved paths
make trails safer
Making parks modern and handicap welcoming I think draws others into our city who bring their commerce. Its the best investment that can be made.
more fences. More toddler playgrounds
More lighting and games at parks
Outdoor pool/waterpark
pick up litter
safety
safety
Grandview, MO 2022 Survey ETC Institute (2022) 107
Q25‐‐ Please tell us if you have any other suggestions or comments to improve the overall quality of Grandview Parks and Recreation or about the potential for future parks in the City of Grandview.
1.outdoor pool/aquatic center. 2. More bike trails/walking trails, sidewalks. 3. restrooms at playgrounds, open and ventilated. 4. more toddler playground equipment. Restroom at Valley Park stinks. 2. Park visitors use parking lot when restroom is locked in winter. 3. Too many after hour visitors. 4. Overcrowded. 5. Too loud. 6. Xylophone needs to be removed. 7. Redirect security light. 8. Lawn crew shows up at 6:45 am on Sunday with mower. 8. Buses from Kansas with up to 40 kids come and stay for hours. 9. Parties bring grills to shelters. 10. Police do not enforce no parking areas. 11. Fence on westside of Valley Park in poor condition. 12. Handrail never replaced on steps. 13. Hours should be dawn to dusk all year. 14. Visitors playing extremely loud music. 15. Fence on west and north side does not extend far enough for privacy.
A guide to trails an markers to show miles we walk.
Add swings in parks
At the View , the lap pool edges are filthy. One shower in Women’s locker room has low water pressure and is cold. New personnel at The View have explained why the pool temperature cannot be regulated. Hire more lifeguards that are pleasurable like the young lady who exercises out of water with us not like the young man who was looking off and not even watching the seniors. When she is there, I feel like she will rescue me if need be. When he is there, I do not feel safe. Just keep trying to improve the parks system the best you can with the money you have.
Bathrooms being open is hugely important.
Besides having a clear vision and goals to build and implement the plans, more important is the passionate staff that cares.
Change the hours of The View back to closing at 10pm
Cleanliness
Community orchards , botanical gardens, arboretum.
Consistent Lap Pool Times, Lane dividers. Interested in Senior Activities & Education. Investment & Retirement Groups
Costs are to high for monthly programs. No basketball or tennis courts to play outside. If we want to play we have to pay the View. Frustrated. So we drive to other community parks.
CREATE OPEN BASEBALL FIELDS FOR ANY AGES, NOT JUST SOFTBALL FIELDS, FIELD WITH A 90 FT BASES AND 300‐400 FT FENCE
Finish Southview Park. Mow the field. Maintain the trail.
Get rid of the big ugly bridge that is an eye sore on the walking path. Has been there for years.
Grandview amazing place to live thank u for all you do for are community.
Grandview mostly serves young children. We need events for older kids, adults, and seniors as well.
Green space in some parks should be used to add more shelters, activity space, basketball court, tennis court, splash pad, etc.
HAVE BAGS FOR PEOPLE WHEN THEY WALK THE DOGS, MORE TRASH CANS.
Have park and rec staff that actually care
Having adequate space for exercise program . update the equipment and add to it.
Grandview, MO 2022 Survey ETC Institute (2022) 108
"I am an avid swimmer. I love the pool. I am very disappointed to have the pool closed from 11‐3 daily.
I’ve been a member at other gyms and no lifeguard is required for adults that sign a waiver. Please consider this.
Also, if funding becomes available, consider installing a sauna. They are very beneficial after a workout. "
I have absolutely loved what Susan did with the parks and Rec dept. Lots of new development. I look forward to the next person building. My biggest hurl in using the facilities is cleanliness, broken glass & safety concerns.
I know maintenance is a factor but we need an outdoor pool.
I live very close to Belvidere park and cannot stand the park anymore. The Zipline for older kids is just lame.
I love the parks. Would love to see a focus on maintaining existing features, ensure projects are sustainable long term
I really miss the outdoor swimming pool. Would love to have a hot tub/spa at the community center. Would love to have senior fitness classes (both gym and water) offered in the evenings and weekends for those of us that work jobs during the day. The dog park needs to be cleaned more often. More and better lighting at park trails.
I think Grandview is a hidden gem. We need to keep improving and doing what we can to let others known.
I would appreciate hands on opportunities for singles, such as pottery and other crafts.
I would go to senior exercise/wellness classes but day pass costs too much.
I would like shade for parking, more play equipment, have the park be cleaner, have clean bathrooms that are useable. Maplewood park is always very dirty with spilled sticky messes and trash on the ground. The tables are almost unusable from being dirty. The bathroom is very gross and unusable. There are not enough swings or things for tween children to do. Other wise is it an extremally beautiful location and we enjoy going there to walk the short train and be in nature.
I would like to see better enforcement of the leash laws. I really hate having to carry pepper spray gel to deter loose, aggressive dogs because their owners think the rules don't apply to them.
If you do a bicycle path do not make it paved not chatty like the current path at Longview. Very hard to ride on.
Improve communication
Improve parks , streets, litter everywhere.
Improve safety of the parks...there is a nice one 127th (in the neighborhood behind martha truman) and it always looks sketchy and it's nice. Also collaborate with Jackson County Parks & Rec (Longview Lake area) to make it safe. There has been a sexual assault on a child during dying, suicide by cop, a body burned, a body dumped and a homicide (double shooting) during daylight all in 2022. The perception must be that Grandview is a safe place to commit crimes as there is a clear increase. We walk/bike the trail that connects our parks to longiview lake and it's become very scary to consider walking anymore. It is not safe and needs to be addressed. I'm surprised Jackson County is willing to let Longview Lake go and Grandview doesn't seem to have the resources/know how to address these concerns going on in our parks.
Grandview, MO 2022 Survey ETC Institute (2022) 109
It would be nice to have an outdoor pool. Teens/adults do not go to splash parks.
I've been really disappointed with the big park having just gotten a dog. I've gone to Leawood now because there's just so much poop and trash in our dog park. Also, the small dog area has a clear opening into the sewer and my dog almost went into it.
Keep bathrooms open all year. Improve safety and quality of John Anderson playground. More toddler playgrounds. Pave all bike trails near the view. Make the view splash park free or cheap.
Last upgrade , they discarded the most heavily used equipment. Need awareness of floor customers.
Let the View be free to residents.
Make parks accessible for all. keep parks clean. make them useful.
make the amphitheater more handicap available
More benches along the trails for those who need a rest break. More water fitness outside of normal daytime working hours. Either early morning, late evenings or weekends. Currently have to go to other cities for these things
More cameras, more security officers driving in the parks, make people feel more secure.
More cycling amenities, paved pump tracks are awesome for adults and kids. More paved trails to connect parks and areas of city.
more handicap accessible
More lighting
More native plants, flowers, fruit trees/berry bushes‐ free for all. Community garden .
More shade in Mapleview, especially over baby swing. No more teeter totter (huge hazard). Mapleview’s old, sprawling play structure was better. The current design makes it difficult for multiple children to enjoy and the ladder to the slide is poorly designed where legs can slip in and get caught. The kids loved the rocks. The mulch invites spiders that like to crawl on the play equipment. The swings are surrounded by concrete slabs that are unfinished and ugly. In my opinion, they are too close to the swings. A child could potentially stumble off the swing and fall headlong into the sharp edge. I’d prefer no wall around swings. This park used to be attended by playgroups and such and is now more quiet. My kids find every other park more interesting, but this is the only one in easy walking distance.
Need a bus service.
Need an outdoor pool. Kids need this. I love the Little Blue trails but most women will not walk it alone, or even with their kids. Need more security.
Need more water fitness classes for people after work hours. Only have classes for seniors now
Need to feel very safe to attend events
Need to not let parks be a hang out for youth. They need supervision and they scare younger kids.
Need to work on the Harry Truman Rd trail from Southview Rd to Raytown rd. The gravel is being overwhelmed by the grass and other vegetation.
New to the area. Still exploring.
Not able to use. Are they wheel chair accessible?
One of the things that brought us to Grandview, over Lee's Summit or Belton was the great Parks and Rec systems. I would love to participate more, but just have not had the energy/ capacity.
Grandview, MO 2022 Survey ETC Institute (2022) 110
Overall happy with the Silver Sneakers classes at the View, extremely happy with instructor Erin. We do arrive 20‐25 minutes before the class starts to insure to have a chair and equipment needed for the class. It gets very crowded at times, and not everyone gets the equipment needed as there is a shortage.
Overall, Grandview Parks are nice. Some of the activities offered could have more flexible time offered. Such as water aerobics to be specific.
Parks need more attention and maintenance regularly. Need to offer more. Add up to date activities for the kids to do , more art and activities for adults.
Parks should be safe. Patrols to keep safety there.
"Partner w Grandview High School on some of the sports offerings. I talked with some of the varsity coaches and they are not feeling like the quality of athletes coming out of parks and rec into their programs are sufficient. I think there's an opportunity there to have rec leagues and competitive leagues (see this in Belton and LS) for kids of different levels to 1) have fun at their level, and 2) be challenged to grow. Think this could be a big community win and collaboration.
On another note, we're into youth football, but there's nothing in Grandview area so we're heading north into KC to participate. If there were opportunities for a team to establish roots in GV I think the community would support it and would be another win for the community. Right now there's just no infrastructure for it in place so hard to get going."
Partner with other community organizations to help provide services. At Mighty Roots Academy we off many outdoor nature classes and programing in Grandview. With funding support those could be offered in the evening or weekend as well.
People do not feel safe
Pick up trash.
Please add some trees to the dog park. Also, could use better water fountains with drainage so our animals aren't super muddy. Have been to other dog parks and our park has the worst fountains. Put shrubs along the outside perimeter of the fence, especially on the parking lot side. This would be helpful keeping dogs from charging the fence when new animals arrive.
Please keep restrooms open.
Please put bathroom at Southview Park(even a porta potty).
Please, free use of elevated track in the community center during inclement weather.
Prices at the view are way too high for a family. And safety is a great concern in other parts such as Belvedere and around town
Prior bonds were passed to provide a senior/youth recreation area.
Prioritize helping the poor before you allocate for the parks. But, please don't decrease how much you are putting towards the parks.
Programs at the View I don't go to since I'm not a member of it
Put in parking lot at Southside park on harry truman
Safety above all else
security
Security is a huge issue after the View is closed or even open. Don’t feel safe with the recent crimes that have happened around town.
Silver Sneakers class is allowed to get too full. Chairs need to be replaces. Floor is badly marked up. Need another class to accommodate all. Teacher Erin is excellent
Grandview, MO 2022 Survey ETC Institute (2022) 111
Safety is very important! Also more benches—especially with so many people having long‐covid lung and heart problems. Teen activities would be great. And Bobcat park has zero parking. It seems to be only for the people who live close. And as a female, I don’t want to walk on a trail deep into the woods—not trying to get attacked Instead of focusing on connecting 9 mile long trails maybe put a soft‐surface track plus a jungle gyn for kids. Maybe open an outdoor pool back up at John Anderson Park. Belton Memorial took Grandview’s thunder but it is going downhill because it closes early and is way overcrowded.
Soccer fields set up like Belton has
The dog poop all over at Meadowmere is a problem. I’d love to see poop bag stations, more trash cans, and tickets written to known offenders.
The only thing I would have to say is more younger children amenities like from ages one to five there's hardly anything for little or kids to do they want to play just like the big kids but they can't so there needs to be smaller amenities like the bigger kids if possible so they can have a chance to play and have fun as well and not just run around because there's nothing they can do
The track at the View needs new “tile” that has more cushion.
There are many people in Grandview and not enough swimming pools to enjoy. a large indoor pool on west side and at least 1 more outdoor pool north of Main St. are much needed and make them open from 9am until 10‐11pm.
There need to be well kept restrooms at each park. When I am able to get back to senior events, hope it is midday or later.
There should be an open walking trail for seniors, meaning no trees, bushes and wheelchair accessible.
THEY SHOULD HAVE MORE STREETLIGHTS ON THE RESIDENTS STREET‐WE CANT SEE AT NIGHT. THEY NEED MORE FREE WATER PARKS LIKE ANDERSON PARK
To reserve for parties, should cost less to rent a shelter.
We love the amount of parks in the area and even in just the last 2 years we have seen a lot of improvements. We have found things like used condoms and syringes in the parks, though, and I'm not sure what can be done to keep people from leaving things like that. Or if more upkeep could be scheduled. But we do enjoy Grandview and it has felt mostly safe in the last 2.5 years we have lived here.
We need a city outdoor pool.
We need a public pool
We need an outdoor pool for adults and older kids. Splash parks are great for young children but that's only a portion of the Grandview residence.
We need an outdoor pool/waterpark and family fun center.
would like new/more training obstacles and bathrooms at the Tails/Trails dog park.
Would love larger sports or after school for my kids so we would not have to always go outside our city.
Would love to see more cycle lanes. It would be fantastic if we could connect our city to the Longview Loop cycling circuit and add bike lanes on the Grandview section of the loop. It’s a big training destination for cyclists and triathletes. It would be great if we could connect The View and other parts of the city to that loop.
Grandview, MO 2022 Survey ETC Institute (2022) 112
You should include questions that are relevant to persons new to Grandview. For example, on Q39 it asks how many YEARS you have resided in Grandview. There is not an option to state how many months/ days I have resided in Grandview.
Your staff does a great job. Thank you.
Grandview, MO 2022 Survey ETC Institute (2022) 113
Survey Instrument 7
Fall 2022
Dear Resident,
Your response to the enclosed survey is very important. We need to know what YOU think!
The City of Grandview is updating their Parks and Recreation Master Plan. The purpose of the project is to develop a community-supported comprehensive Parks and Recreation Master Plan that provides guidance for future development and redevelopment of the City’s parks. The Parks and Recreation Master Plan will help guide policy development, assist in prioritizing demands and opportunities, and generate a strategic action plan. This plan will create a clear set of goals, policies, and objectives thus providing direction to City staff, the Park Board, and City Council.
We appreciate your time.
We realize that this survey will take approximately 10 minutes to complete, but each question is important. The time you invest in completing this survey will aid the City in taking a resident-driven approach to making decisions that will enrich the future of our community and positively affect the lives of all its residents.
Please complete and return your survey within the next two weeks. We have selected ETC Institute, an independent consulting company, as our partner to administer this survey. They will compile the data received and present the results to the City later this year.
Your responses will remain confidential.
Please return your completed survey in the enclosed postage-paid envelope addressed to ETC Institute, 725 W. Frontier Circle, Olathe, KS 66061. If you prefer, you can complete the survey online at Grandviewsurvey.org.
If you have any questions about the Parks Master Plan project, please feel free to contact Jared Elbert, Parks & Recreation Director, at (816) 316-4880.
If you have any questions about how to complete the survey, contact ETC Institute at (913) 254-4514 or by email at jason.morado@etcinstitute.com.
At the end of the survey, to say thank you for your time and feedback, you can enter to win one of two prizes for completing the survey: a 1-year individual membership to The View Community Center, and a $500 Visa gift card will be given away.
Sincerely,
Jared Elbert Director of Parks & Recreation
Grandview, MO 2022 Survey ETC Institute (2022) 115
This survey should be completed by one adult representing a single household. Input will be used to assess park and recreation needs and priorities for all parks within Grandview. You may complete the survey on-line at Grandviewsurvey.org. If you have questions, please call Jared Elbert, Director of Parks and Recreation, at 816-316-4880.
1.Please indicate if you or any member of your household use the following parks and facilities provided by the City of Grandview by circling either "Yes" or "No" next to each. If you indicate "Yes," please rate your overall satisfaction using a scale of 1 to 4, where 4 means "Very Satisfied" and 1 means "Very Dissatisfied."
Do you use this park or facility?
satisfied are you with this park or facility?
2.Which THREE of these parks/facilities should the City of Grandview prioritize over the next TWO years? [Write in your answers below using the numbers from the list in Question 1.]
3. On average, how often do you or other members of your household visit parks in Grandview?
____(1) Almost daily
____(2) A few times per week
____(3) At least once per week
____(4) A few times per month
____(5) A few times per year
____(6) Once per year
____(7) Seldom or never
4.Which of the following reasons PREVENT you or other members of your household from using parks in Grandview, or from using them more often? [Check all that apply.]
____(01) Too hard to find parking
____(02) ADA accessibility is lacking
____(03) Condition of amenities
____(04) Lack of age-appropriate amenities
____(05) Safety or security concerns
____(06) Lack of maintenance and repair of existing facilities
____(07) Not interested/too busy
____(08) Amenities offered don't match my interests or needs
____(09) Facilities too crowded
____(10) Other: ____________________________________________
5.How important do you feel it is for the City to provide high quality PARK FACILITIES?
____(4) Very important
____(3) Somewhat important
____(2) Somewhat not important
____(1) Not important at all
____(9) Don't know
6.Which of the following organizations do you and other members of your household use for parks and recreation services? [Check all that apply.]
____(1) City of Grandview
____(2) Other Local City/County Parks & Rec. Departments (Where? _________________________________)
____(3) Local Schools (Where? ______________________)
____(4) Churches or other religious organizations (Where? _____________________________)
____(5) Other: _______________________________
____(6) None of these
©2022 ETC Institute Page 1
Parks/Facilities
If "Yes,"
Very Satisfied Satisfied Dissatisfied Very Dissatisfied 01. Belvidere Park Yes No 4 3 2 1 02. Bobcat Park Yes No 4 3 2 1 03. Freedom Park Yes No 4 3 2 1 04. Grandview Community Center Yes No 4 3 2 1 05. John Anderson Park Yes No 4 3 2 1 06. Little Corner Park Yes No 4 3 2 1 07. Mapleview Park Yes No 4 3 2 1 08. Meadowmere Park Yes No 4 3 2 1 09. River Oaks Park Yes No 4 3 2 1 10. Shalimar Park Yes No 4 3 2 1 11. Southview Park Yes No 4 3 2 1 12. Tails & Trails Dog Park Yes No 4 3 2 1 13. Terrace Park Yes No 4 3 2 1 14. Valley Park Yes No 4 3 2 1
how
1st: ____ 2nd: ____ 3rd: ____
Grandview, MO 2022 Survey ETC Institute (2022) 116
7. Which ONE of the organizations listed in Question 6 on the previous page do you rely on most?
[Write in your answer below using the numbers from the list in Question 6.]
Organization Relied on Most: ______
8. Please indicate if you or any member of your household has a need or desire for each of the park amenities listed below by circling either "Yes" or "No." If "Yes," please rate all of the park amenities of this type using a scale of 1 to 4, where 4 means the needs of your household are currently "Fully Met" and 1 means "Not Met."
Do you have a need/desire for this park or amenity?
If "Yes," how well are your needs currently being met?
9. Which FOUR types of parks/amenities from the list in Question 8 are MOST IMPORTANT to your household? [Write in your answers below using the numbers from the list in Question 8, or circle "NONE."]
©2022 ETC Institute Page 2
Type of Park or Park Amenity
Fully Met Mostly Met Partly Met Not Met 01. Baseball/Softball diamonds (for adults) Yes No 4 3 2 1 02. Baseball/Softball diamonds (for youth) Yes No 4 3 2 1 03. Bicycle pump tracks Yes No 4 3 2 1 04. Camping areas Yes No 4 3 2 1 05. Community gardens Yes No 4 3 2 1 06. Disc golf courses Yes No 4 3 2 1 07. Dog parks Yes No 4 3 2 1 08. Family games (bocce ball, shuffleboard, cornhole, etc.) Yes No 4 3 2 1 09. Fishing pond/lake Yes No 4 3 2 1 10. Horseshoe pits Yes No 4 3 2 1 11. Mountain biking trails Yes No 4 3 2 1 12. Natural areas for passive recreation and wildlife benefit Yes No 4 3 2 1 13. Nature/hiking trails Yes No 4 3 2 1 14. Outdoor amphitheater/event space Yes No 4 3 2 1 15. Outdoor basketball courts Yes No 4 3 2 1 16. Outdoor classroom space Yes No 4 3 2 1 17. Outdoor educational spaces Yes No 4 3 2 1 18. Outdoor pickleball courts Yes No 4 3 2 1 19. Outdoor tennis courts Yes No 4 3 2 1 20. Outdoor volleyball courts Yes No 4 3 2 1 21. Outdoor fitness areas Yes No 4 3 2 1 22. Extreme fitness/ninja warrior course Yes No 4 3 2 1 23. Paved trails Yes No 4 3 2 1 24. Picnic shelters Yes No 4 3 2 1 25. Site Furnishings (benches, picnic tables, etc.) Yes No 4 3 2 1 26. Playgrounds Yes No 4 3 2 1 27. Splash pad Yes No 4 3 2 1 28. Restrooms Yes No 4 3 2 1 29. Skate park Yes No 4 3 2 1 30. Soccer fields (for adults) Yes No 4 3 2 1 31. Soccer fields (for youth) Yes No 4 3 2 1 32. Un-programmed multi-purpose open green space Yes No 4 3 2 1 33. Other: _______________________________________ Yes No 4 3 2 1
1st: ____ 2nd:
3rd:
4th:
NONE Grandview, MO 2022 Survey ETC Institute (2022) 117
____
____
____
10. Using a scale of 1 to 4, where 4 means "Very Satisfied" and 1 means "Very Dissatisfied," please rate your level of satisfaction with the following items.
11. Has your household participated in any recreation and wellness programs offered by the City of Grandview (for all ages) during the last 2 years?
____(1) Yes [Answer Q11a.] ____(2) No [Skip to Q12.]
11a. How would you rate the overall quality of the City of Grandview recreation programs in which your household has participated?
____(4) Excellent ____(3) Good ____(2) Fair ____(1) Poor
12. Which of the following reasons PREVENT you or other members of your household from using recreation and wellness programs offered by the City of Grandview, or from using them more often? [Check all that apply.]
____(01) Lack of quality instructors
____(02) Old and outdated facilities
____(03) Use programs of other agencies
____(04) I don't know what is offered
____(05) Lack of quality programs
____(06) Fees are too high
____(07) Too far from your home
____(08) Program times are not convenient
____(09) Classes are full
____(10) Program not offered
____(11) Registration is difficult
____(12) Poor customer service by staff
____(13) Lack of transportation
____(14) Lack of right program equipment
____(15) Too busy/Not interested
____(16) Lack of trust in government
____(17) Language/cultural barriers
____(18) Other: ____________________________________________
13. From the following list, please CHECK ALL the ways you learn about City of Grandview Recreation programs (for all ages).
____(01) City recreation guide
____(02) Nextdoor app for neighborhoods
____(03) City website
____(04) Materials at parks or recreation facilities
____(05) Conversations with recreation staff
____(06) Newspaper
____(07) Friends and neighbors
____(08) Promotions at special events
____(09) Banners at parks or City facilities
____(10) Email/Eblasts from City
____(11) City newsletter
____(12) Facebook
____(13) Twitter
____(14) Instagram
____(15) Flyers
____(16) Other: _______________________________________
14. From the list in Question 13, which THREE methods of communication would you MOST PREFER the City use to communicate with you about recreation programs and activities? [Write in your answers below using the numbers from the list in Question 13, or circle "NONE."]
©2022 ETC Institute Page 3
Very Satisfied Satisfied Dissatisfied Very Dissatisfied Don't Know 01. Park maintenance, cleanliness, and general upkeep 4 3 2 1 9 02. Park safety and security 4 3 2 1 9 03. Quality of park amenities 4 3 2 1 9 04. Park amenities meet the needs of the community 4 3 2 1 9 05. Accessible amenities for limited mobility patrons 4 3 2 1 9 06. Distribution of parks (locations within the community) 4 3 2 1 9 07. Quality of recreation programs 4 3 2 1 9 08. Variety of recreation programs 4 3 2 1 9 09. Number and variety of community events in parks 4 3 2 1 9 10. Marketing and communication of programs and services 4 3 2 1 9 11. Park system overall as a whole 4 3 2 1 9
1st: ____ 2nd: ____ 3rd: ____ NONE Grandview, MO 2022 Survey ETC Institute (2022) 118
15. How important do you feel it is for the City of Grandview to provide high quality RECREATION PROGRAMS?
____(4) Very important
____(3) Somewhat important
____(2) Somewhat not important
____(1) Not important at all
____(9) Don't know
16. Please indicate if you or any member of your household has a need for each of the alphabetically listed parks, recreation, and senior programs in the City of Grandview listed below by circling either "Yes" or "No." If "Yes," please rate how well your needs for programs of this type are being met using a scale of 1 to 5, where 5 means they are "100% Met" and 1 means "0% Met."
17. Which FOUR programs from the list in Question 16 are MOST IMPORTANT to your household? [Write in your
©2022 ETC Institute Page 4
Type of Program (Listed Alphabetically) Do you have a need for this program? If "Yes," how well are your needs being met? 100% Met 75% Met 50% Met 25% Met 0% Met 01. Adult fitness and wellness programs Yes No 5 4 3 2 1 02. Adult sports leagues Yes No 5 4 3 2 1 03. After school programs for youth of all ages Yes No 5 4 3 2 1 04. Birthday parties Yes No 5 4 3 2 1 05. Child Watch at Community Center (while adult uses amenities) Yes No 5 4 3 2 1 06. Community special events Yes No 5 4 3 2 1 07. Cultural enrichment programs Yes No 5 4 3 2 1 08. E-gaming/E-sports Yes No 5 4 3 2 1 09. Gymnastics/tumbling programs Yes No 5 4 3 2 1 10. Leadership/professional development Yes No 5 4 3 2 1 11. Outdoor environmental/nature camps and programs Yes No 5 4 3 2 1 12. Outdoor water recreation (canoeing, kayaking, etc.) Yes No 5 4 3 2 1 13. Preschool programs/early childhood education Yes No 5 4 3 2 1 14. Programs for adults with special needs Yes No 5 4 3 2 1 15. Programs for at risk youth/crime prevention Yes No 5 4 3 2 1 16. Programs for youth with special needs Yes No 5 4 3 2 1 17. Programs relating to history Yes No 5 4 3 2 1 18. Recreation/competitive swim team Yes No 5 4 3 2 1 19. Senior educational programs Yes No 5 4 3 2 1 20. Senior health and wellness programs Yes No 5 4 3 2 1 21. Senior nutrition programs Yes No 5 4 3 2 1 22. Senior resource, information, and service coordination Yes No 5 4 3 2 1 23. Senior trips Yes No 5 4 3 2 1 24. STEAM (science, technology, engineering, arts and mathematics)/Tech Classes Yes No 5 4 3 2 1 25. Swim lessons Yes No 5 4 3 2 1 26. Teen/Tween programs Yes No 5 4 3 2 1 27. Tennis lessons and leagues Yes No 5 4 3 2 1 28. Virtual programs Yes No 5 4 3 2 1 29. Water fitness programs/lap swimming Yes No 5 4 3 2 1 30. Youth fitness and wellness classes Yes No 5 4 3 2 1 31. Youth performing arts programs (dance/music) Yes No 5 4 3 2 1 32. Youth sports programs and camps Yes No 5 4 3 2 1 33. Youth summer programs and camps Yes No 5 4 3 2 1 34. Youth visual arts/crafts/performing arts programs Yes No 5 4 3 2 1 35. Other: Yes No 5 4 3 2 1
the numbers
in
1st: ____ 2nd: ____ 3rd: ____ 4th: ____ NONE Grandview, MO 2022 Survey ETC Institute (2022) 119
answers below using
from the list
Question 16, or circle "NONE."]
18. Please indicate how much you agree that the following are important priorities for the Parks and Recreation Department over the next 10 years using a scale of 1 to 4, where 4 means "Strongly Agree" and 1 means "Strongly Disagree."
Demographics
19. Approximately how many years have your household resided in Grandview? ______ years
20. What is your age? ______ years
21. Which of the following best describes your race? [Check all that apply.]
____(01) Asian or Asian Indian
____(02) Black or African American
____(03) American Indian or Alaska Native ____(04) White or Caucasian
____(05) Native Hawaiian or other Pacific Islander
____(06) Hispanic/Spanish/Latino/a/x
____(99) Other: _____________________________________________
22. Including yourself, how many people in your household are...
Under age 5: ____
Ages 5-9: ____
Ages 10-14: ____
Ages 15-19: ____
Ages 20-24: ____
Ages 25-34: ____
23. With which gender do you identify most?
Ages 35-44: ____
Ages 45-54: ____
Ages 55-64: ____
Ages 65-74: ____
Ages 75+: ____
Male ____(2) Female ____(3) Non-binary ____(4) LGBTQIA+ ____(5) Other: _____________________________________________
24. Which of the following BEST describes your annual household income?
Under $30,000
$30,000-$59,999
$60,000-$99,999
____(4) $100,000-$149,999 ____(5) $150,000-$199,999 ____(6) $200,000 or more
Prefer not to answer
25. Please tell us if you have any other suggestions or comments to improve the overall quality of Grandview Parks and Recreation or about the potential for future parks in the City of Grandview.
©2022 ETC Institute Page 5
Strongly Agree Agree Disagree Strongly Disagree Don't Know 01. Update existing park amenities that are aging and in poor condition throughout the park system 4 3 2 1 9 02. Add new park amenities 4 3 2 1 9 03. Improve the offering of recreation programs 4 3 2 1 9 04. Enhance paved trail experiences. Improve pavement conditions as necessary, expand connections, and add more benches along trails 4 3 2 1 9 05. Improve the perception of safety and security in parks 4 3 2 1 9 06. Improve marketing and communication of recreation programs and events 4 3 2 1 9 07. Add more multi-generational amenities throughout the parks 4 3 2 1 9 08. Focus on the beautification of parks 4 3 2 1 9 09. Increase the number and quality of events at the amphitheater. 4 3 2 1 9 10. Provide amenities such as a large shelter and site furnishings to improve the farmers market experience and encourage more vendors to attend 4 3 2 1 9 11. Other: 4 3 2 1 9
____(1)
____(1)
____(2)
____(3)
____(7)
____________________________________________________________________________________________________ ____________________________________________________________________________________________________ Grandview, MO 2022 Survey ETC Institute (2022) 120
26. Would you be willing to participate in future surveys sponsored by the City of Grandview?
____(1) Yes [Please answer Q26a.] ____(2) No
26a. Please provide your contact information.
Mobile Phone Number: _____________________________________________
Email Address: ___________________________________________________
27. As a way to say thank you for your time, we will be randomly selecting a survey respondent to receive a $500 Visa gift card, and another to receive a 1-year individual membership to The View Community Center. To enter the drawing, please provide your email and/or phone number below.
Phone Number: _____________________________________________
Email Address: _____________________________________________
This concludes the survey. Thank you for your time!
Please return your completed survey in the enclosed postage-paid envelope addressed to: ETC Institute, 725 W. Frontier Circle, Olathe, KS 66061
©2022 ETC Institute Page 6
Grandview, MO 2022 Survey ETC Institute (2022) 121
Your responses will remain completely confidential. The information to the right will ONLY be used to help identify the level of need in your area. Thank you.
B Appendix
Public Engagement Results
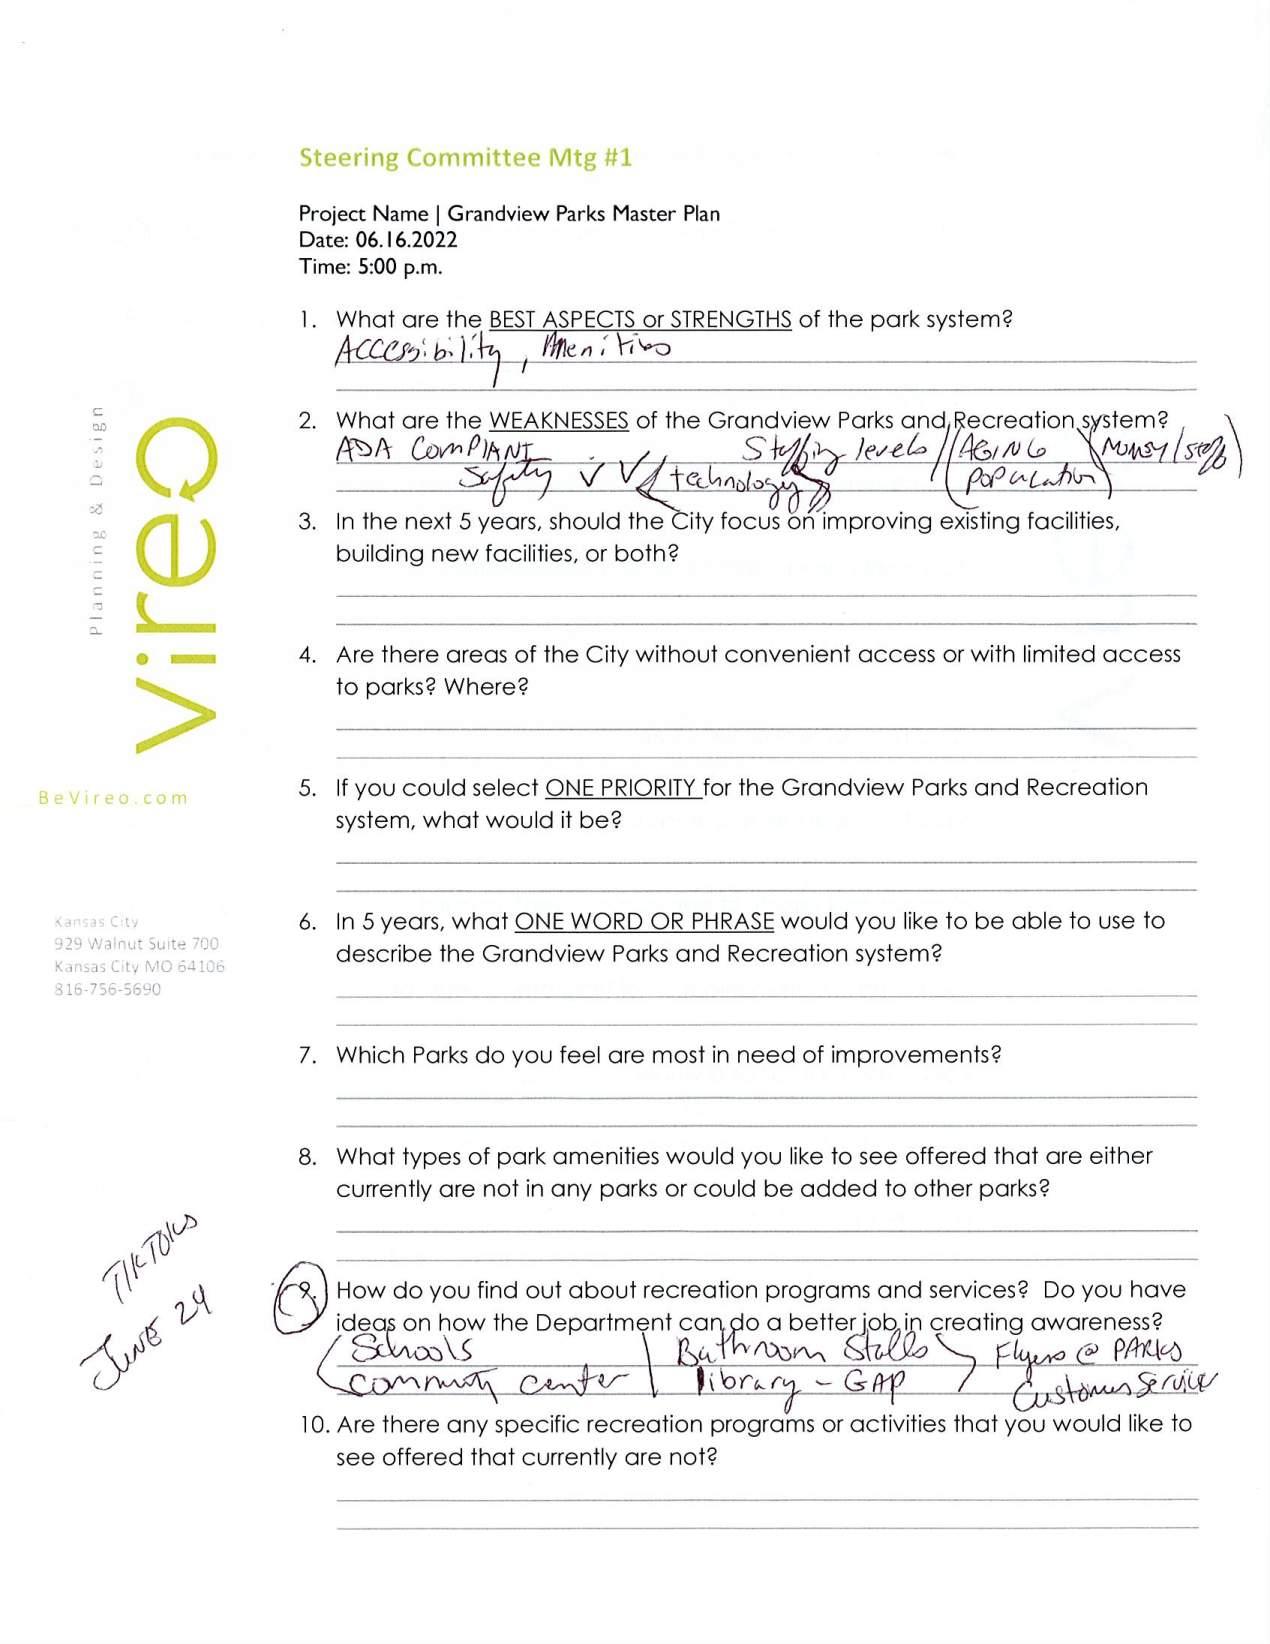
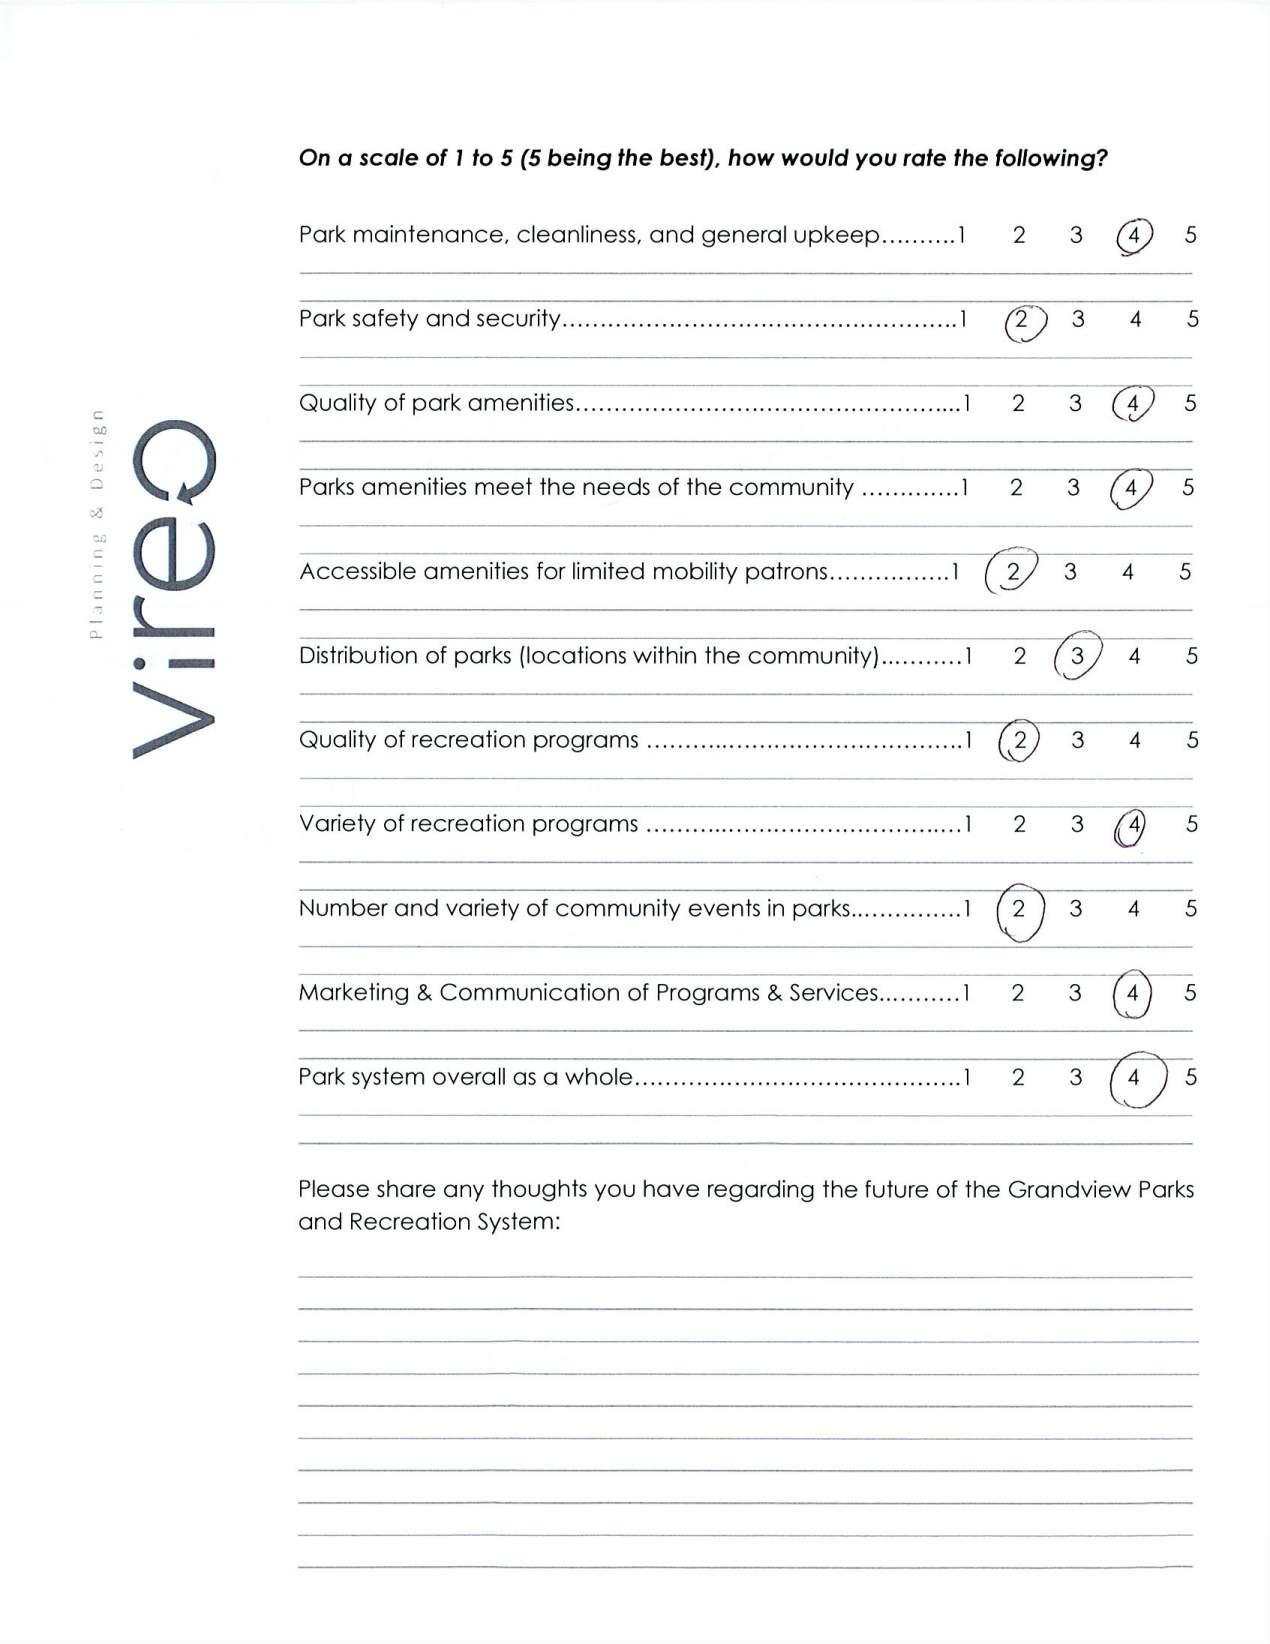
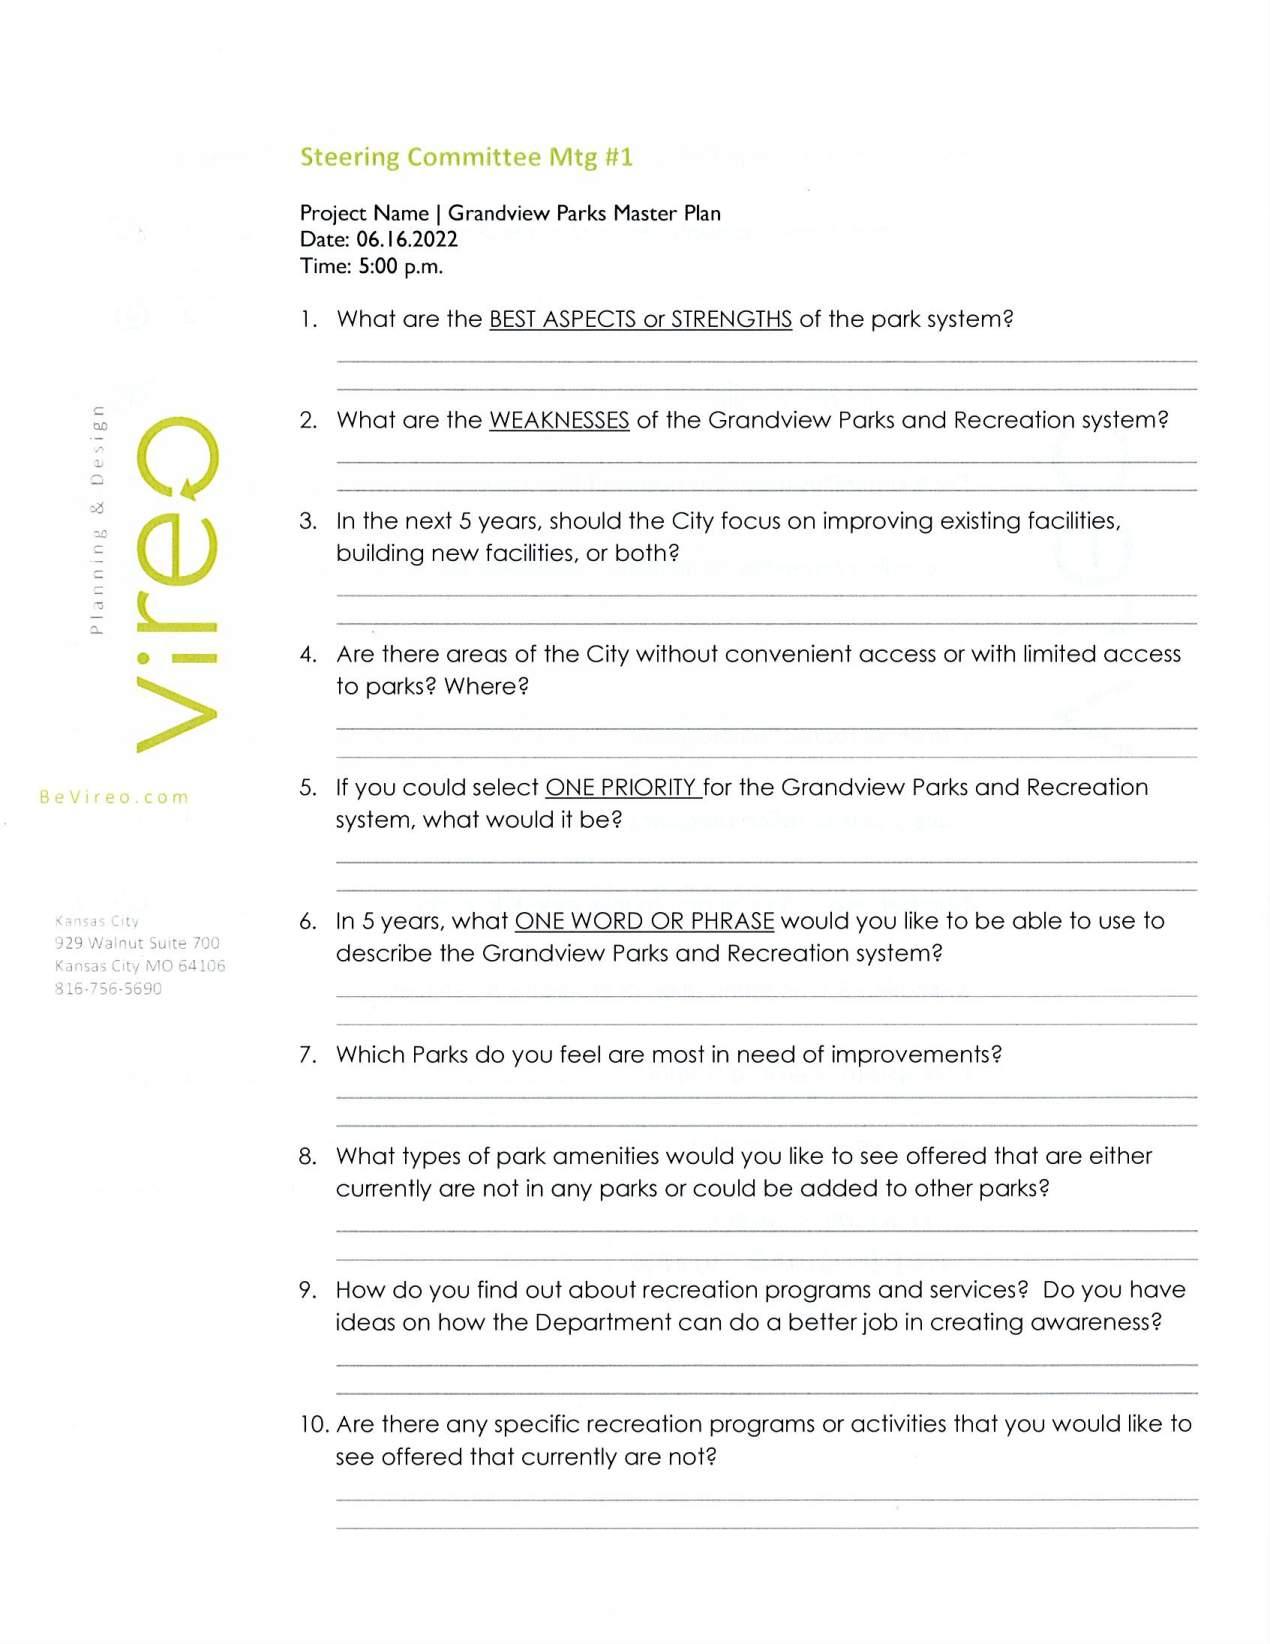
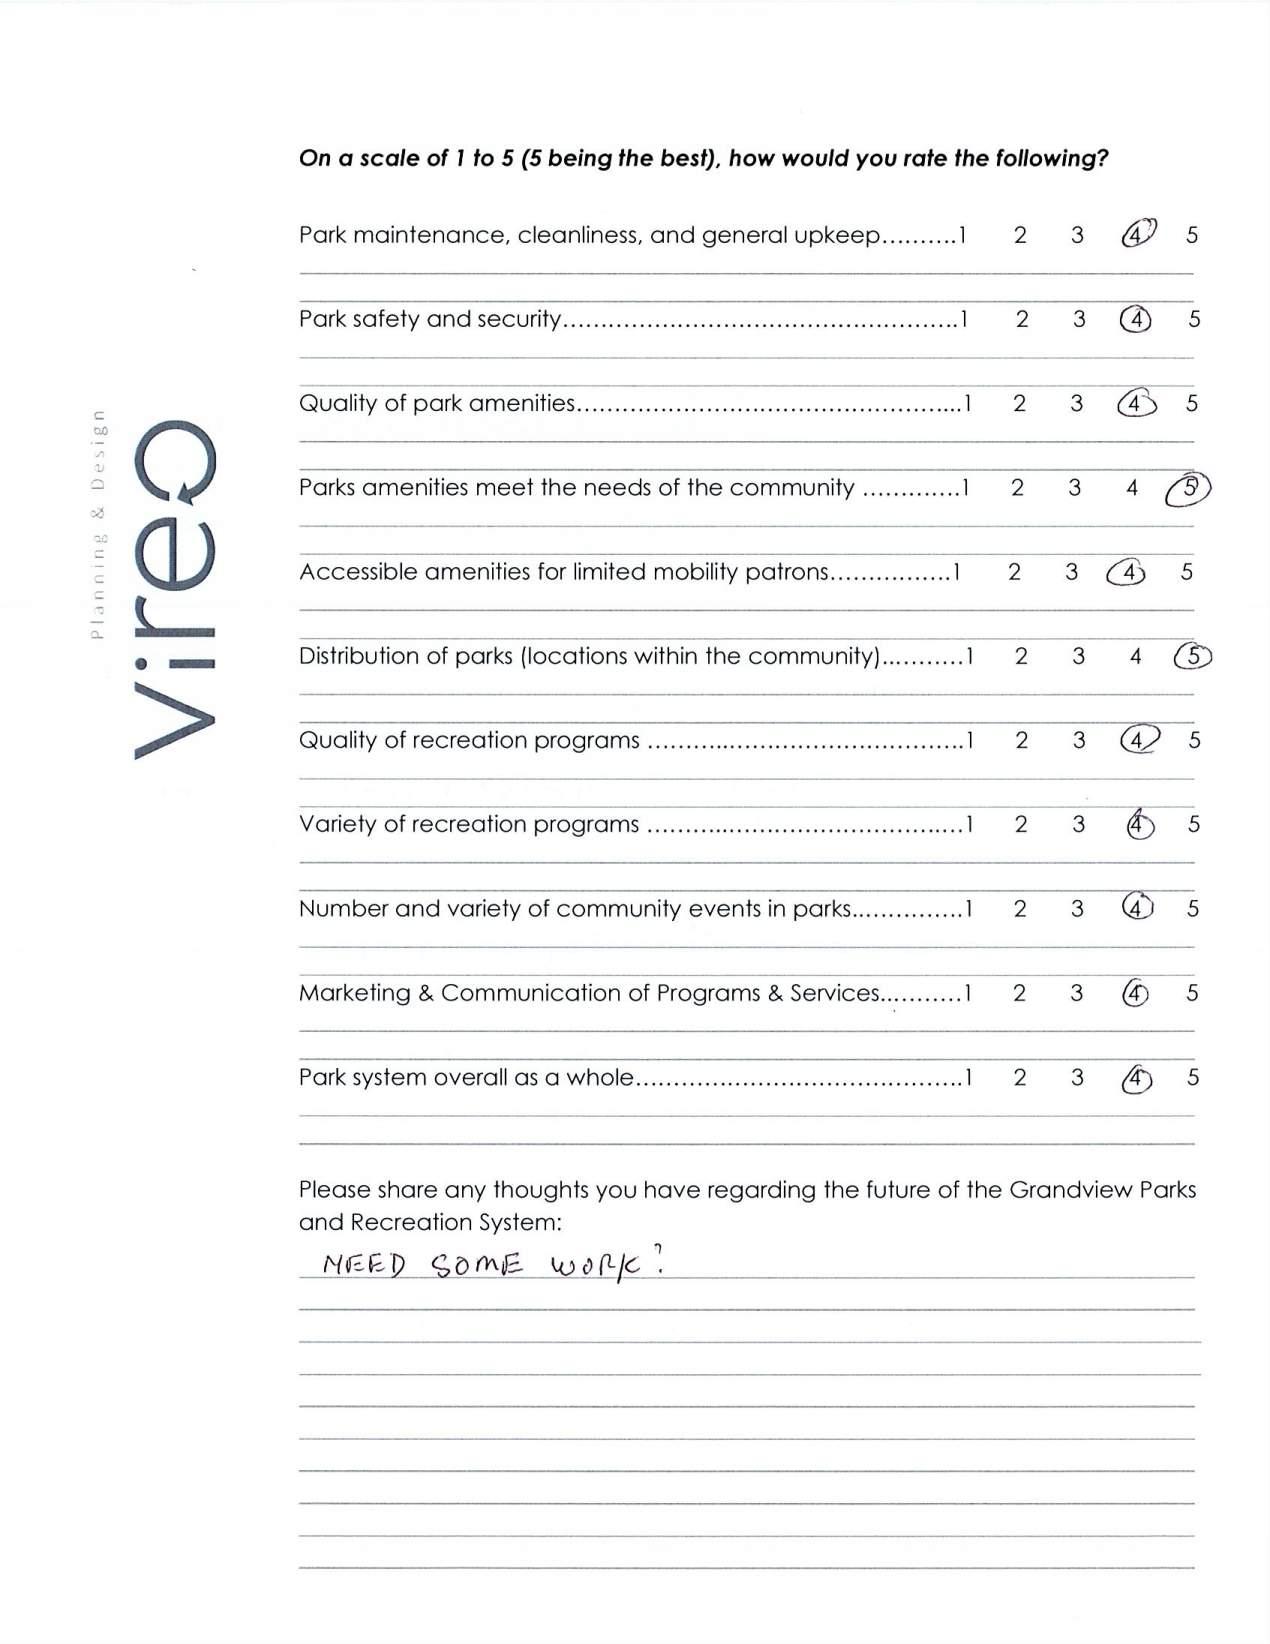
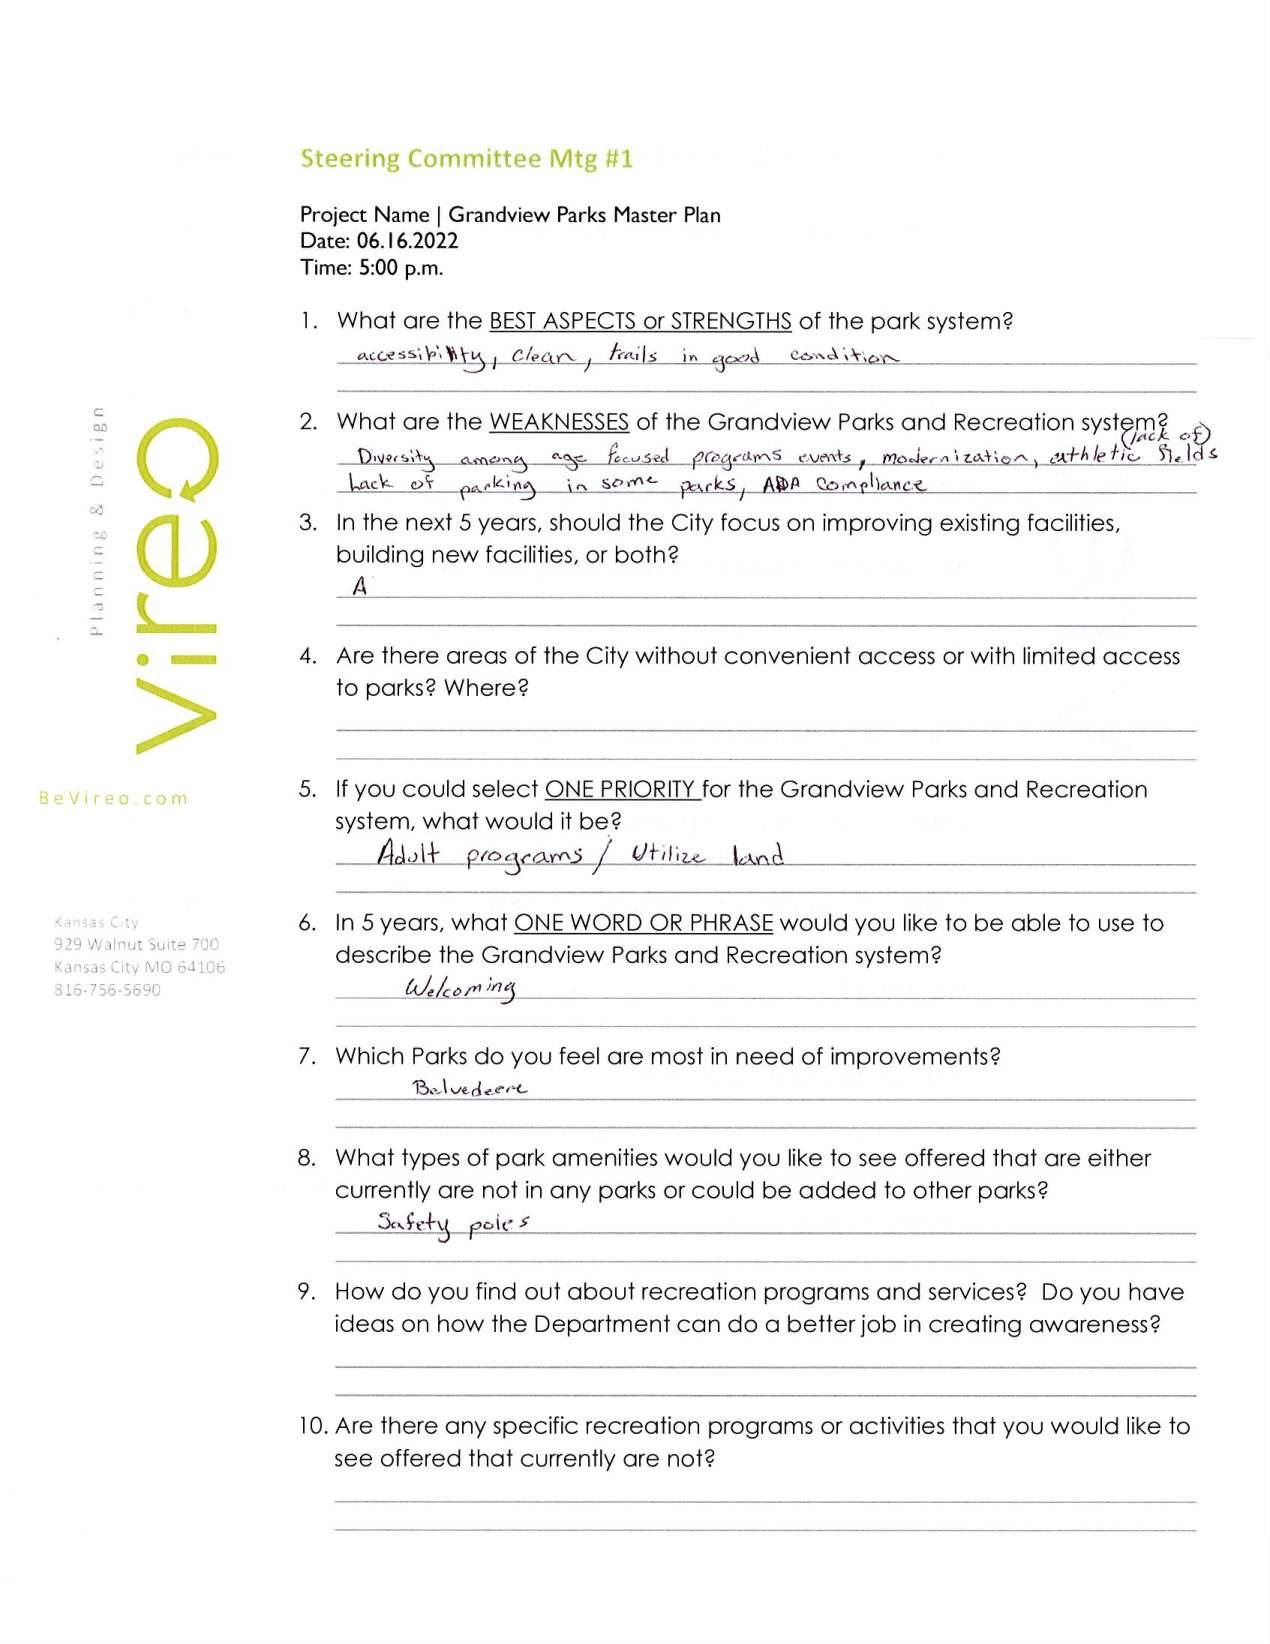
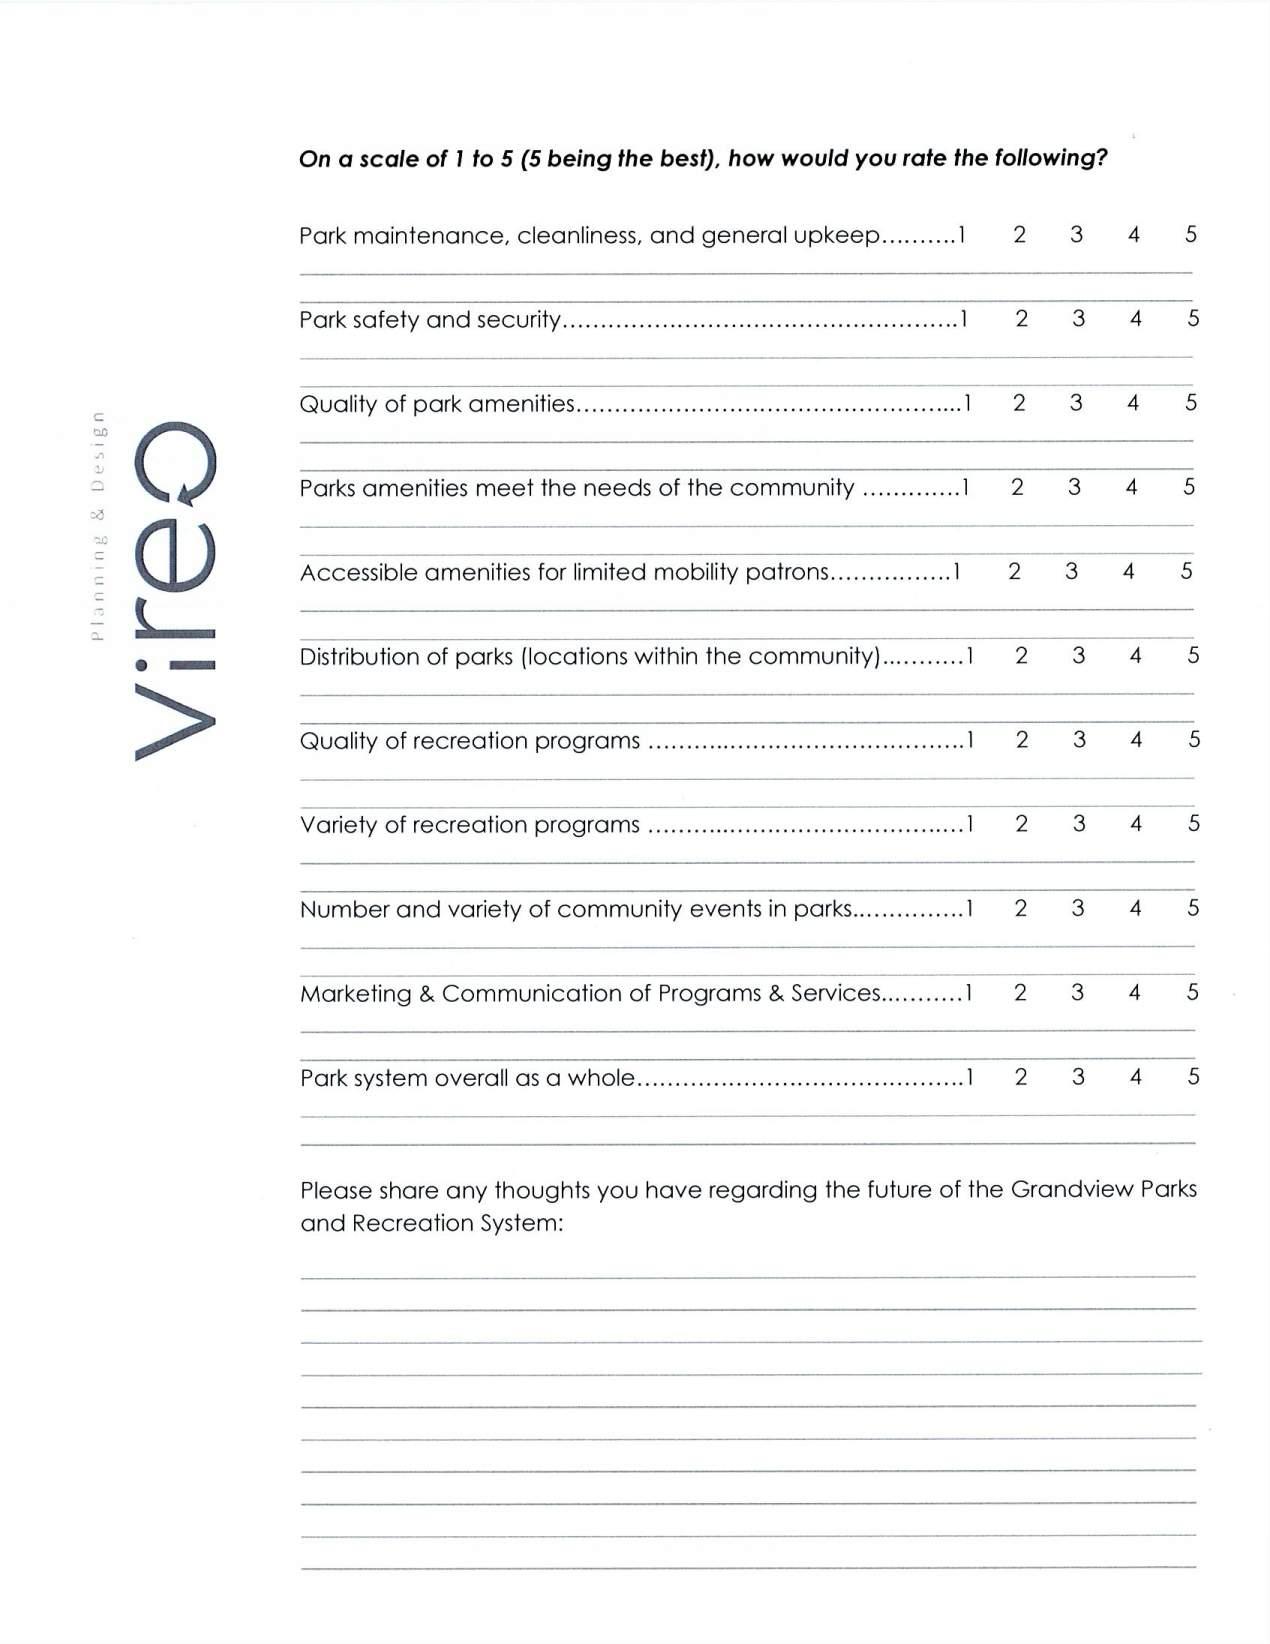
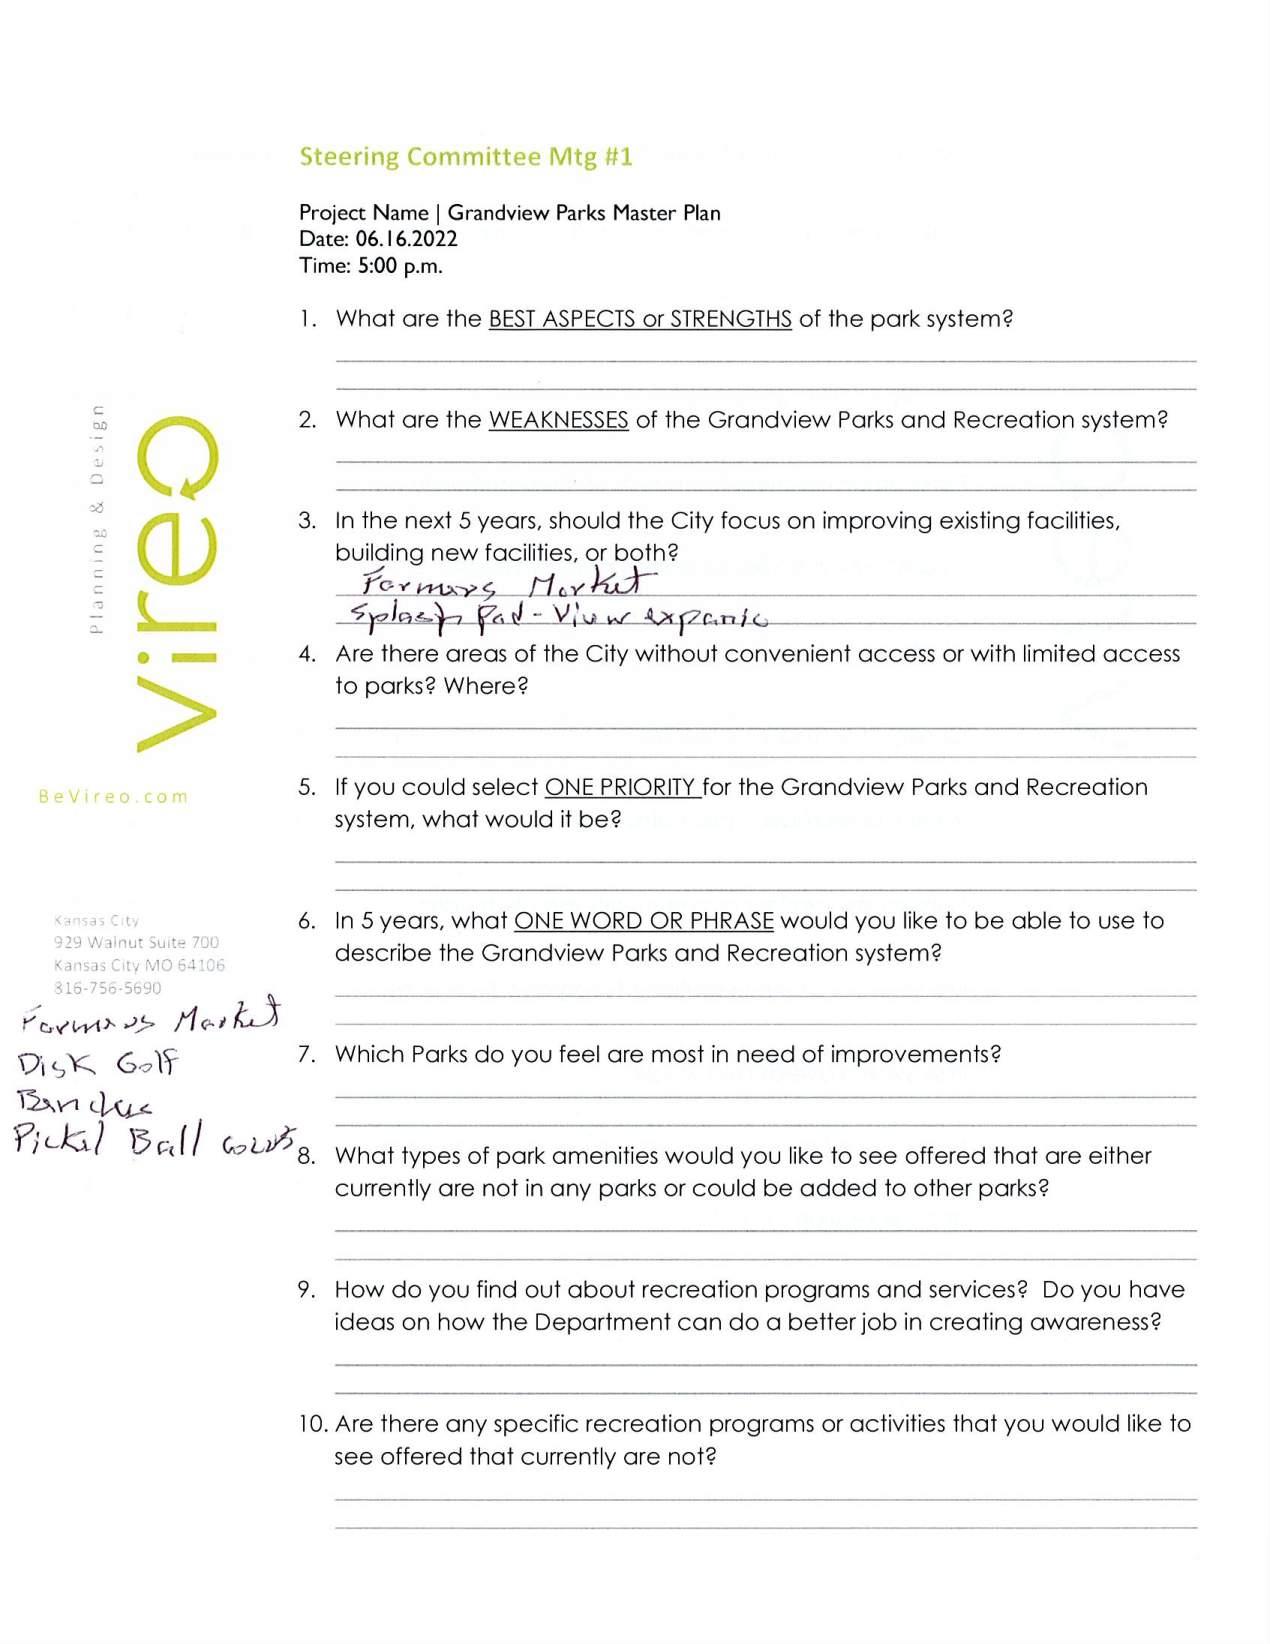
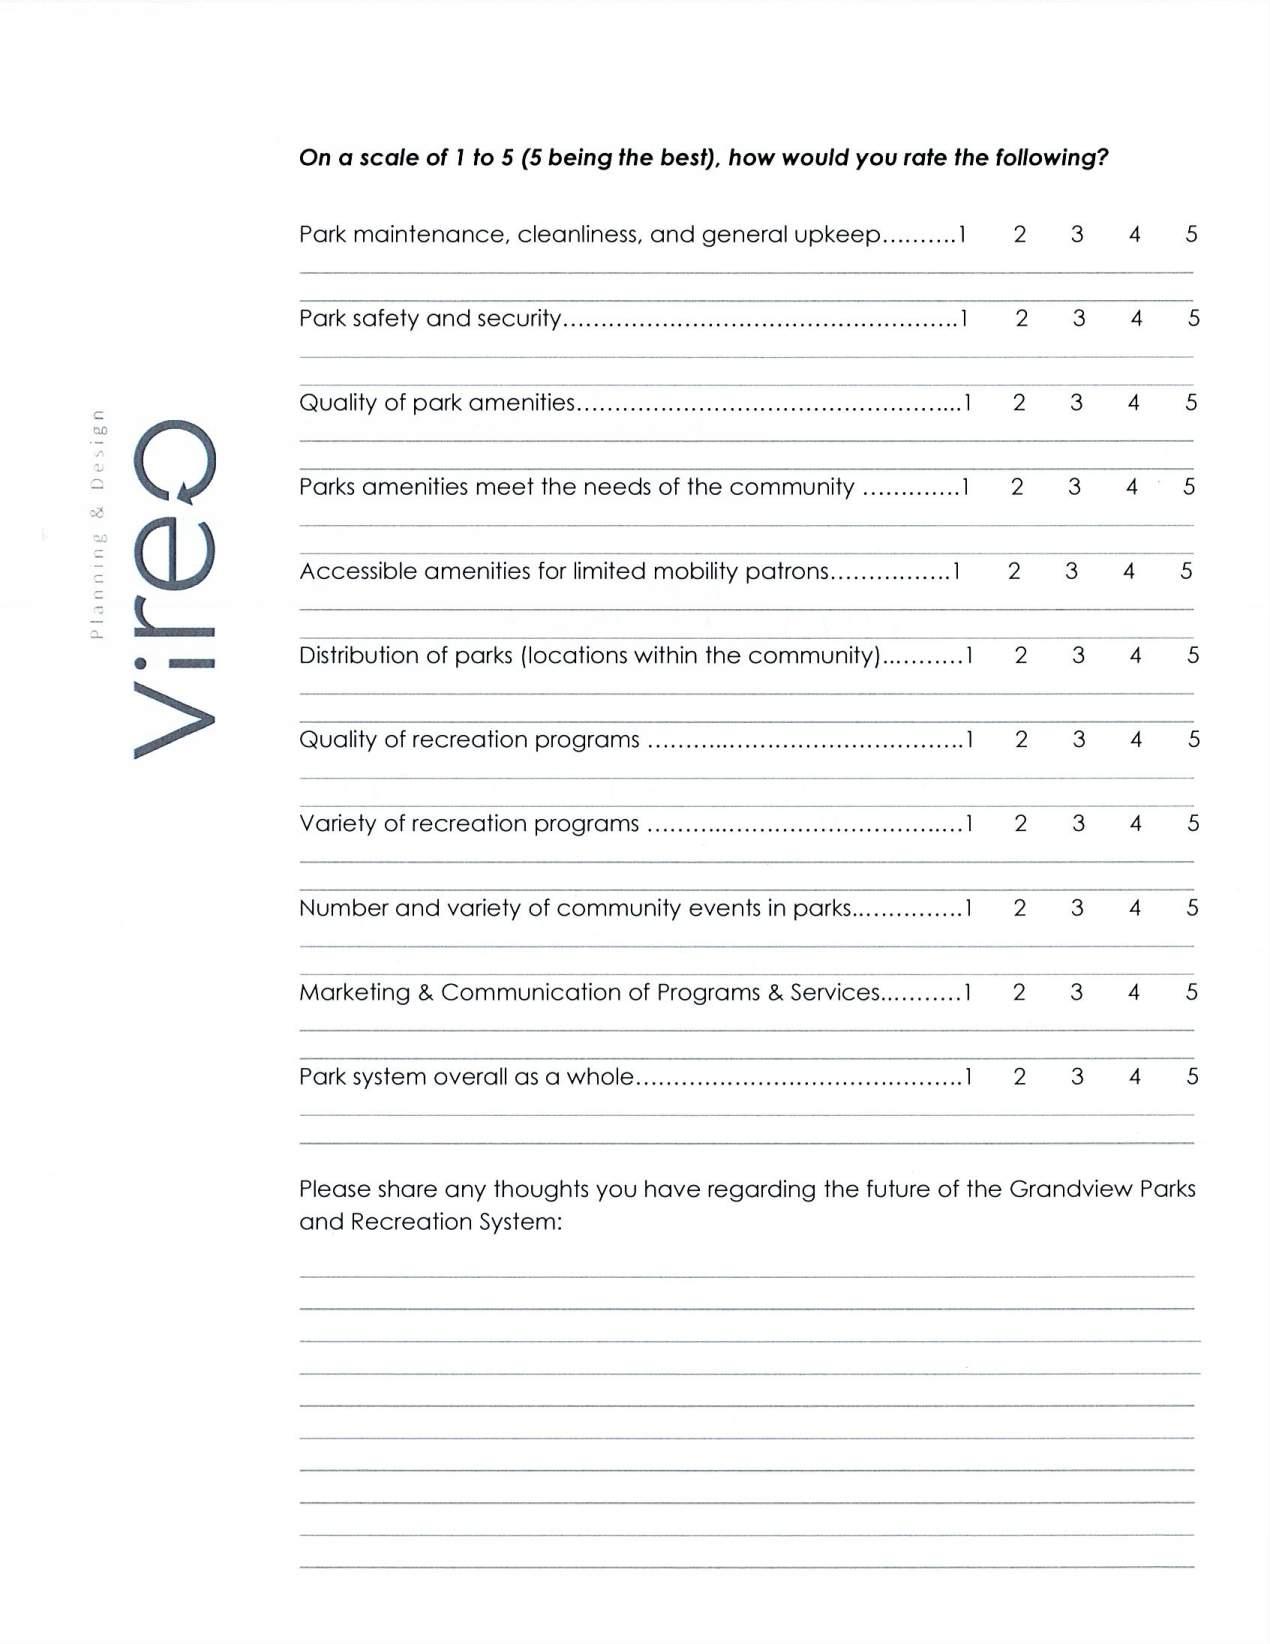
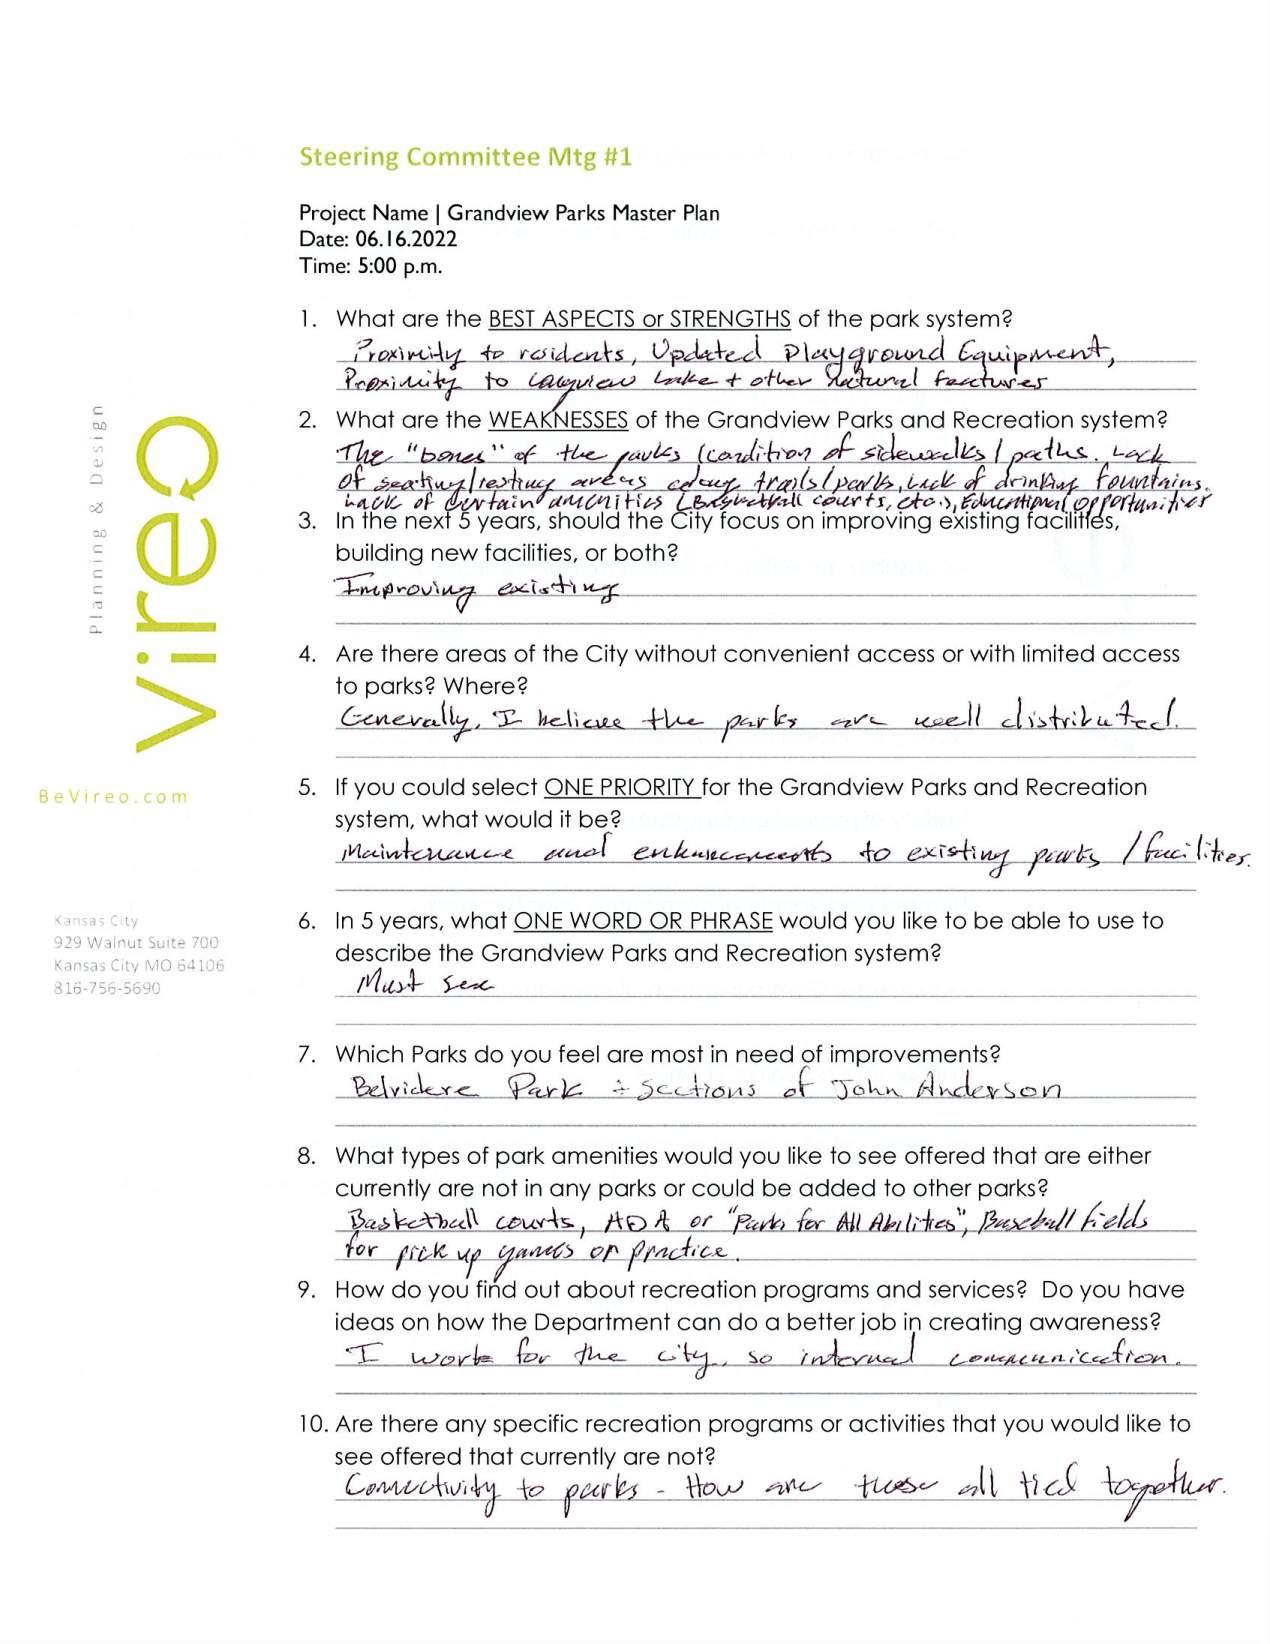

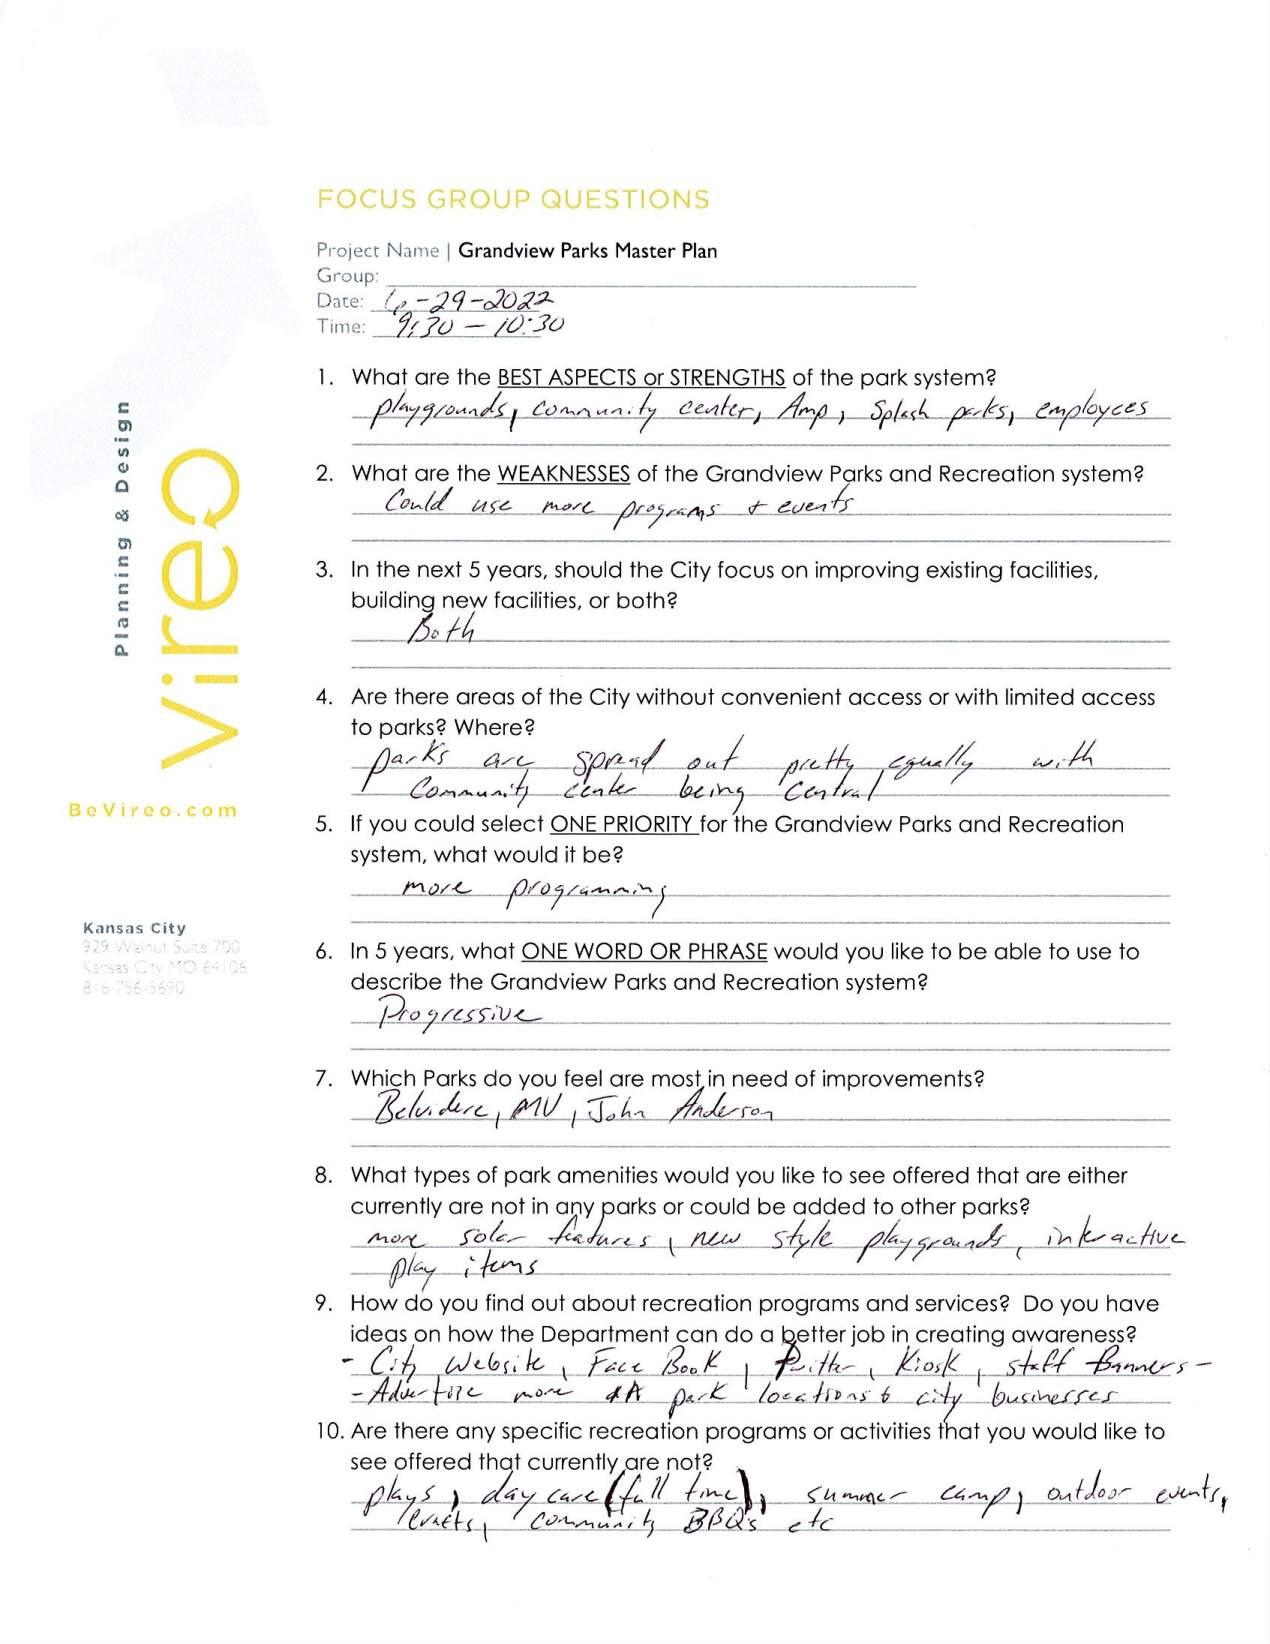
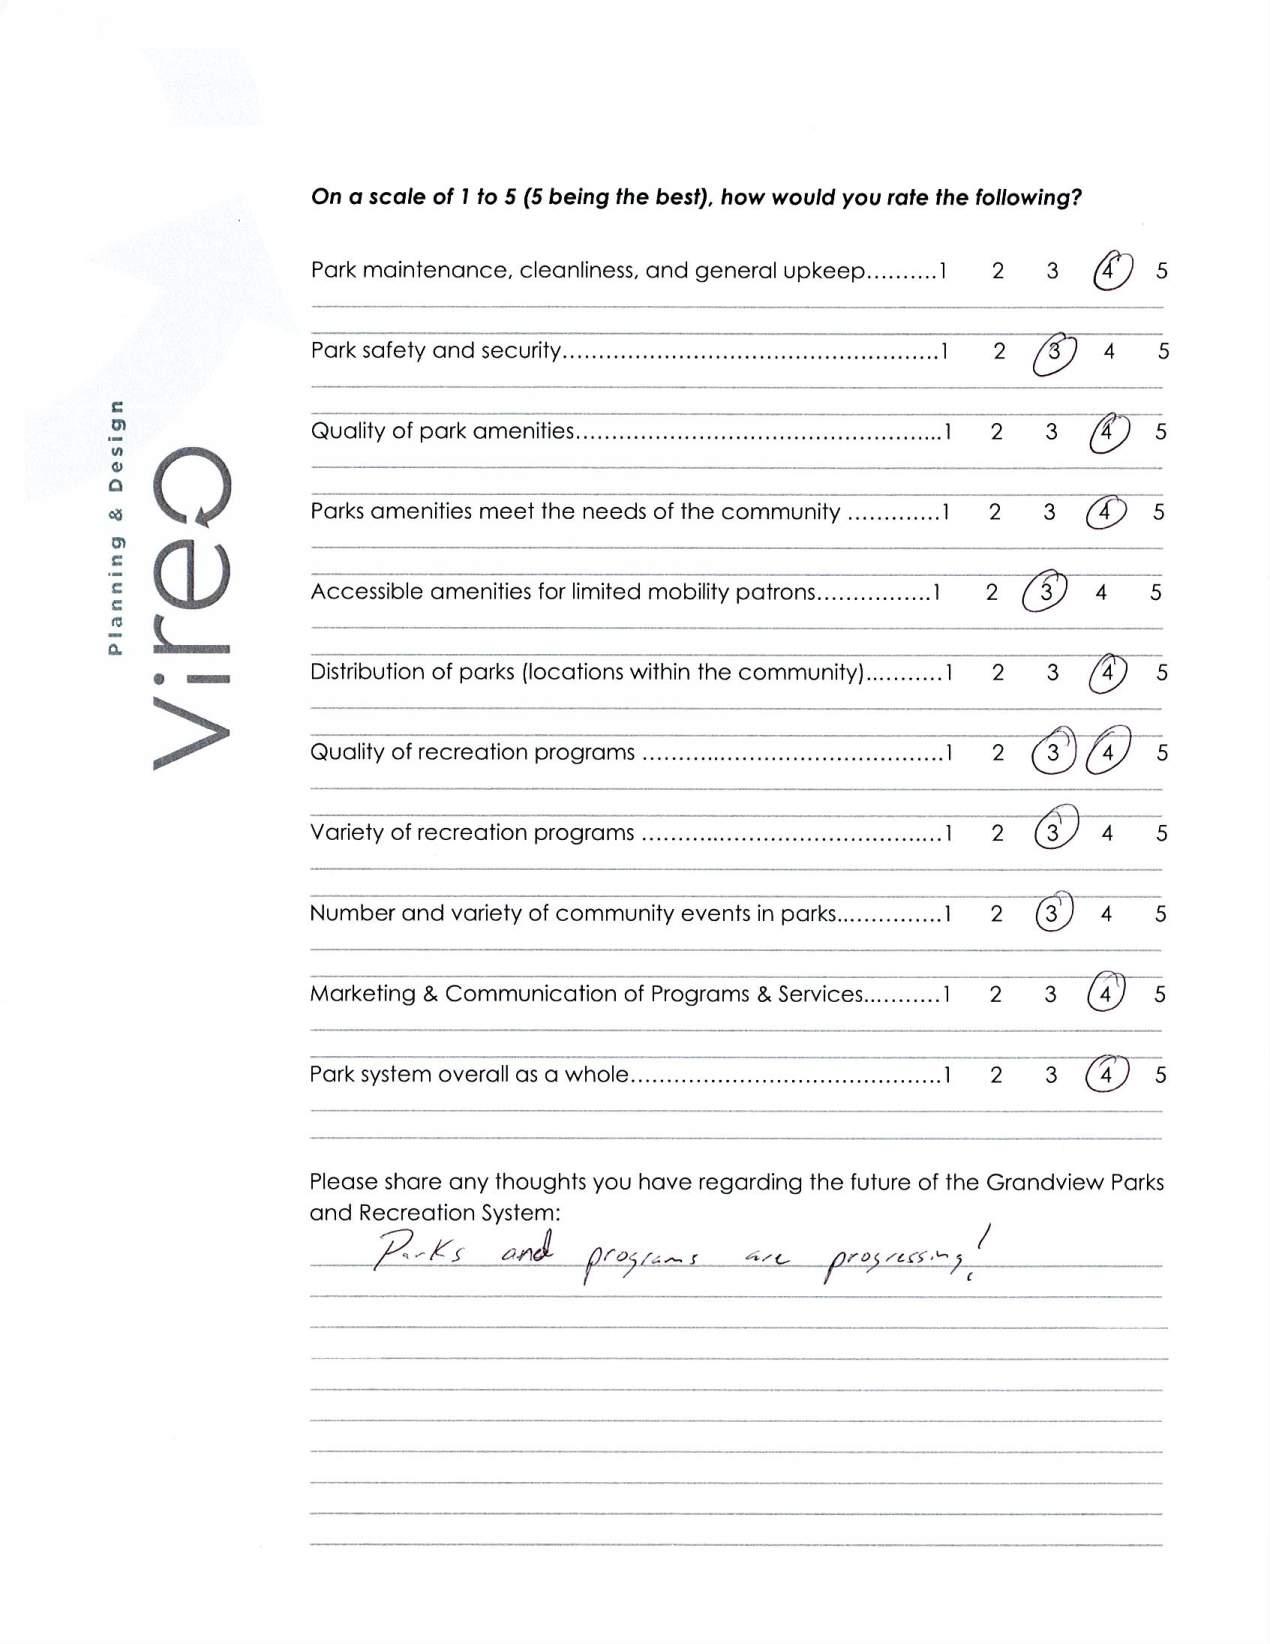
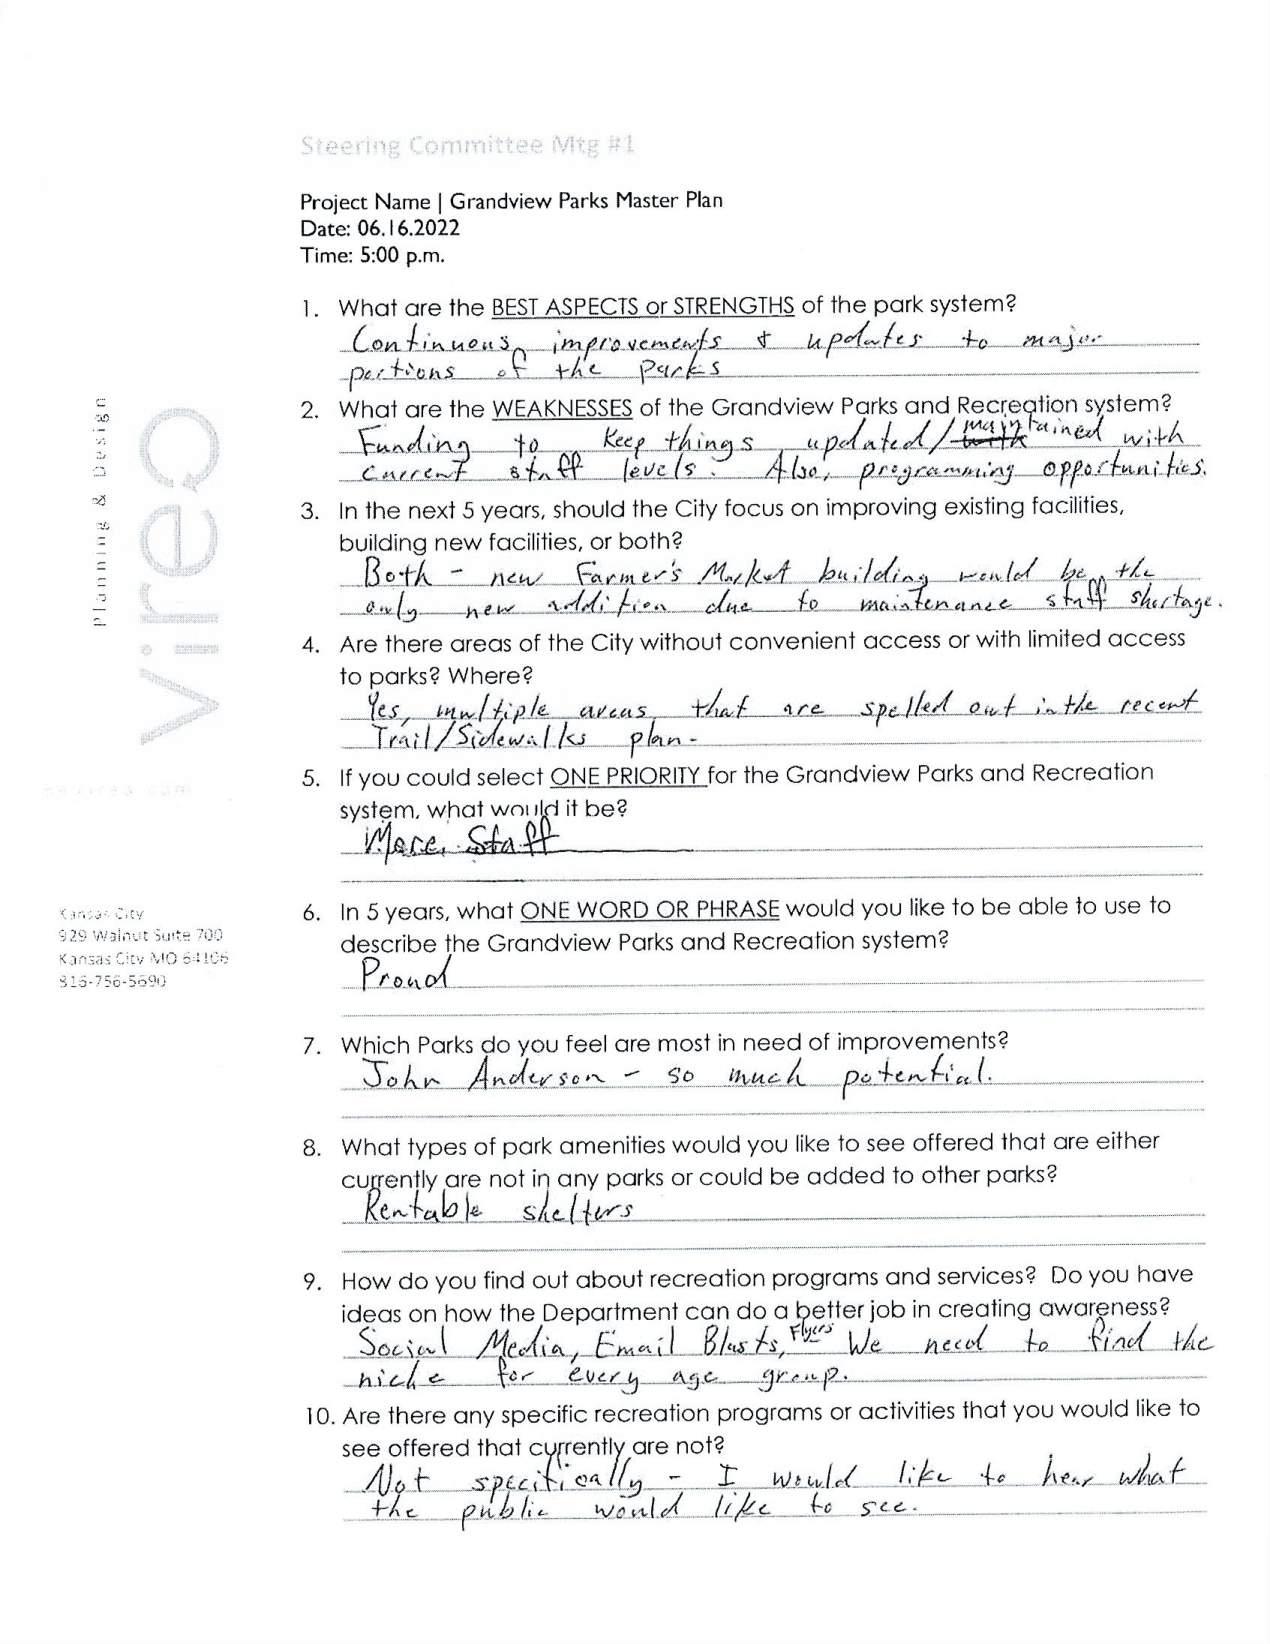
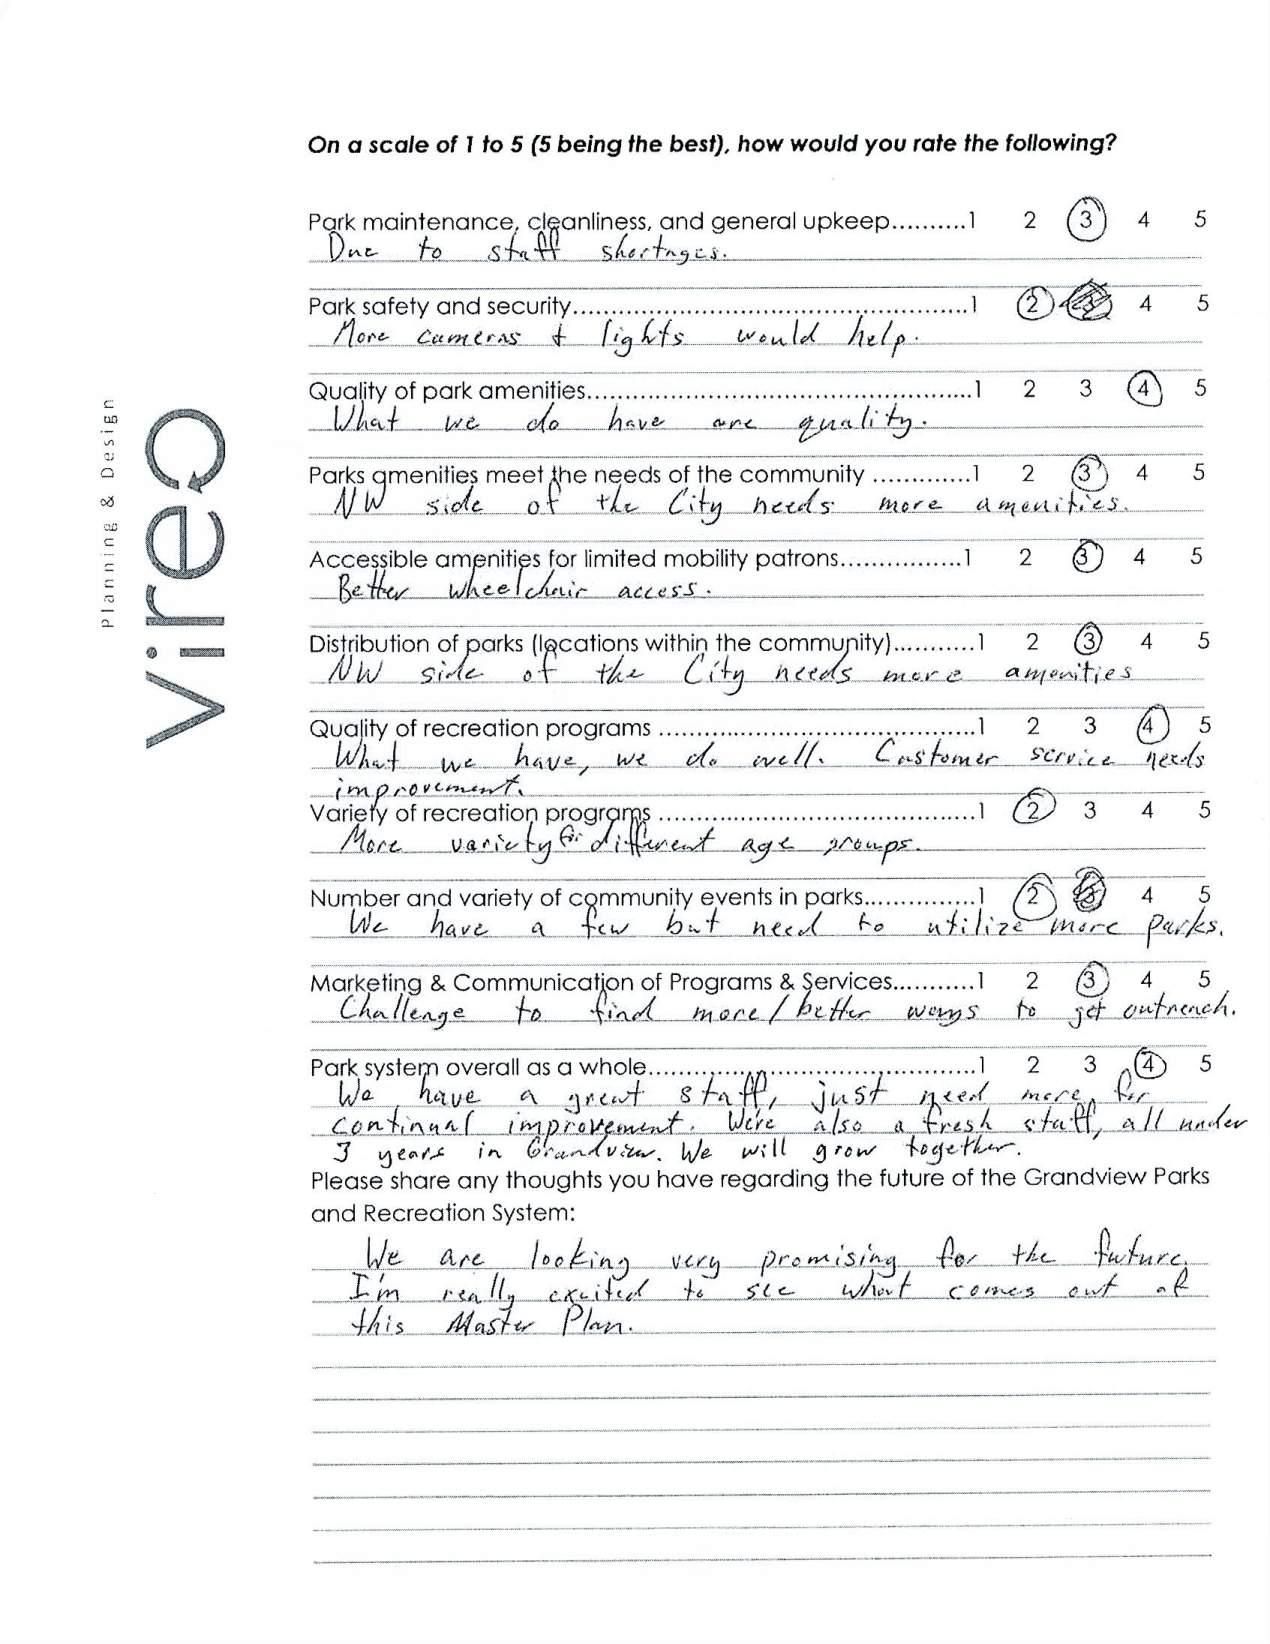
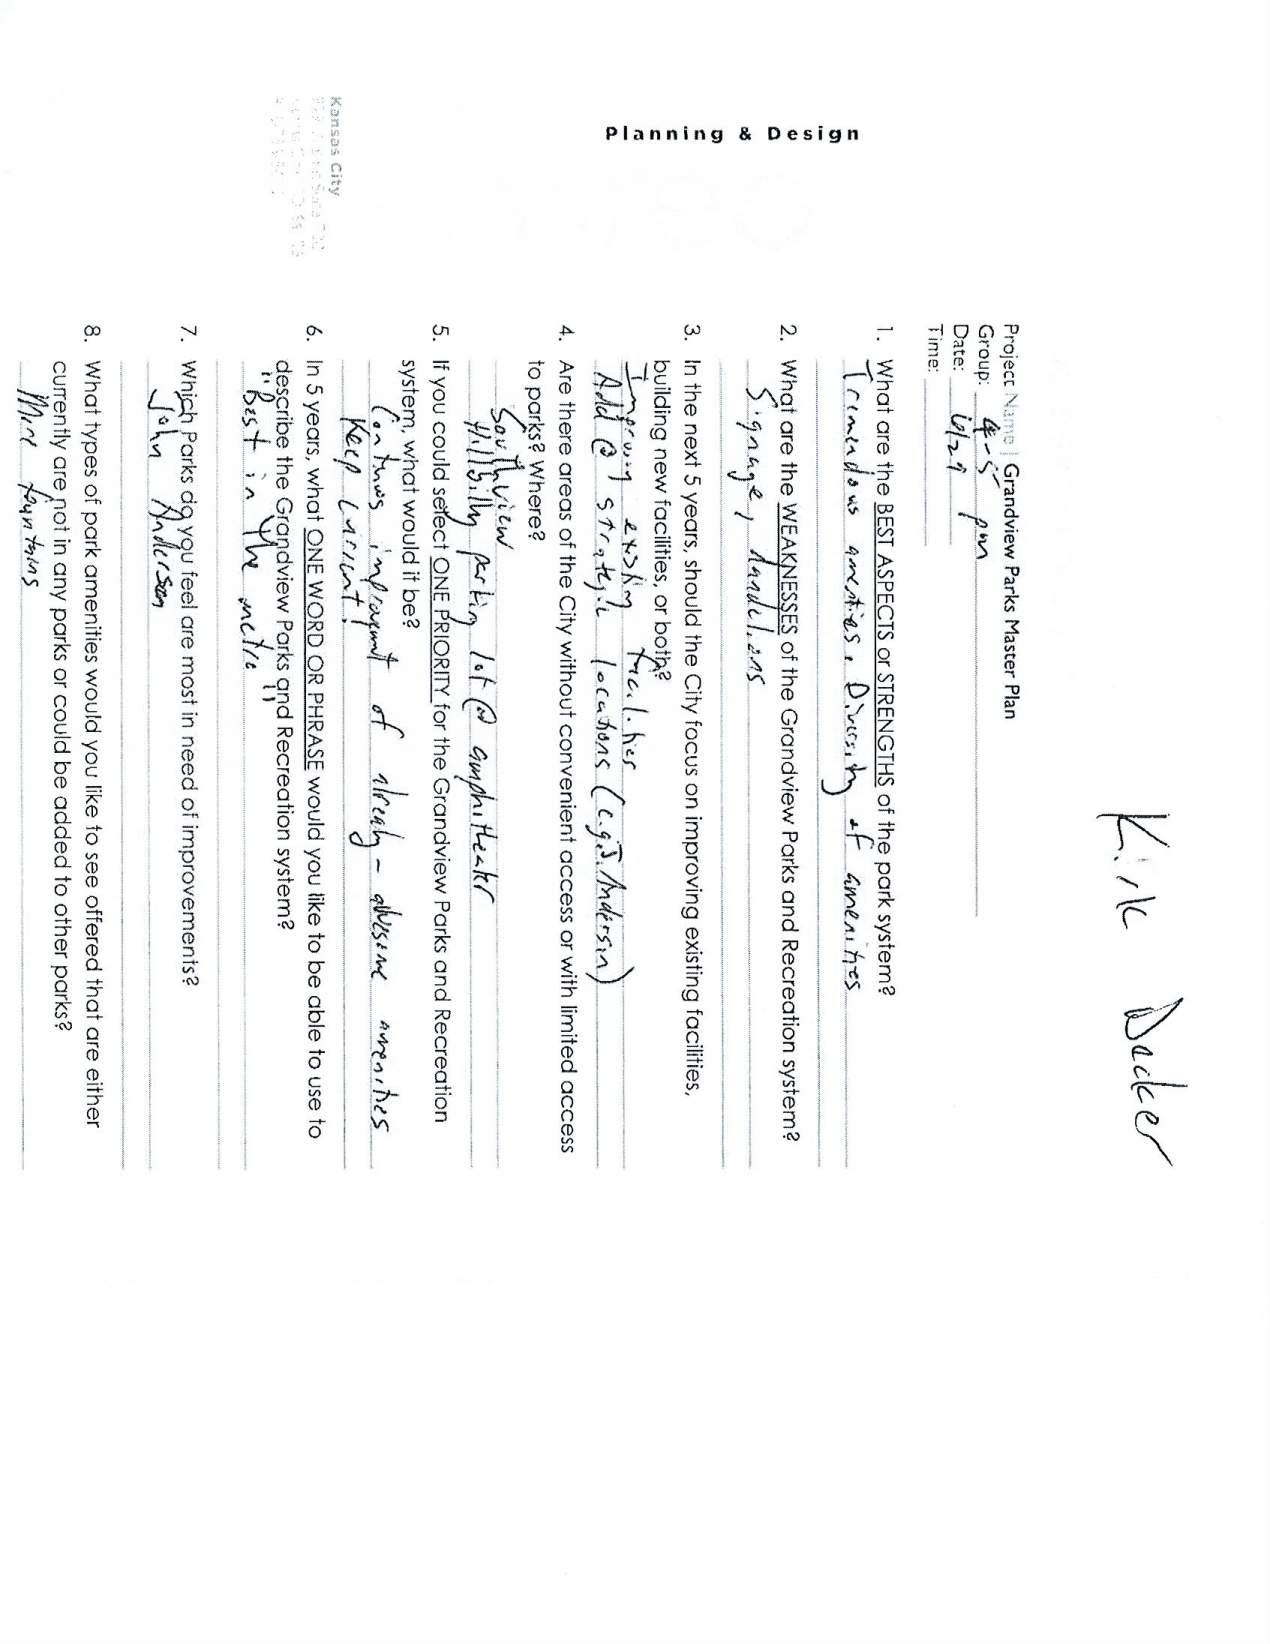
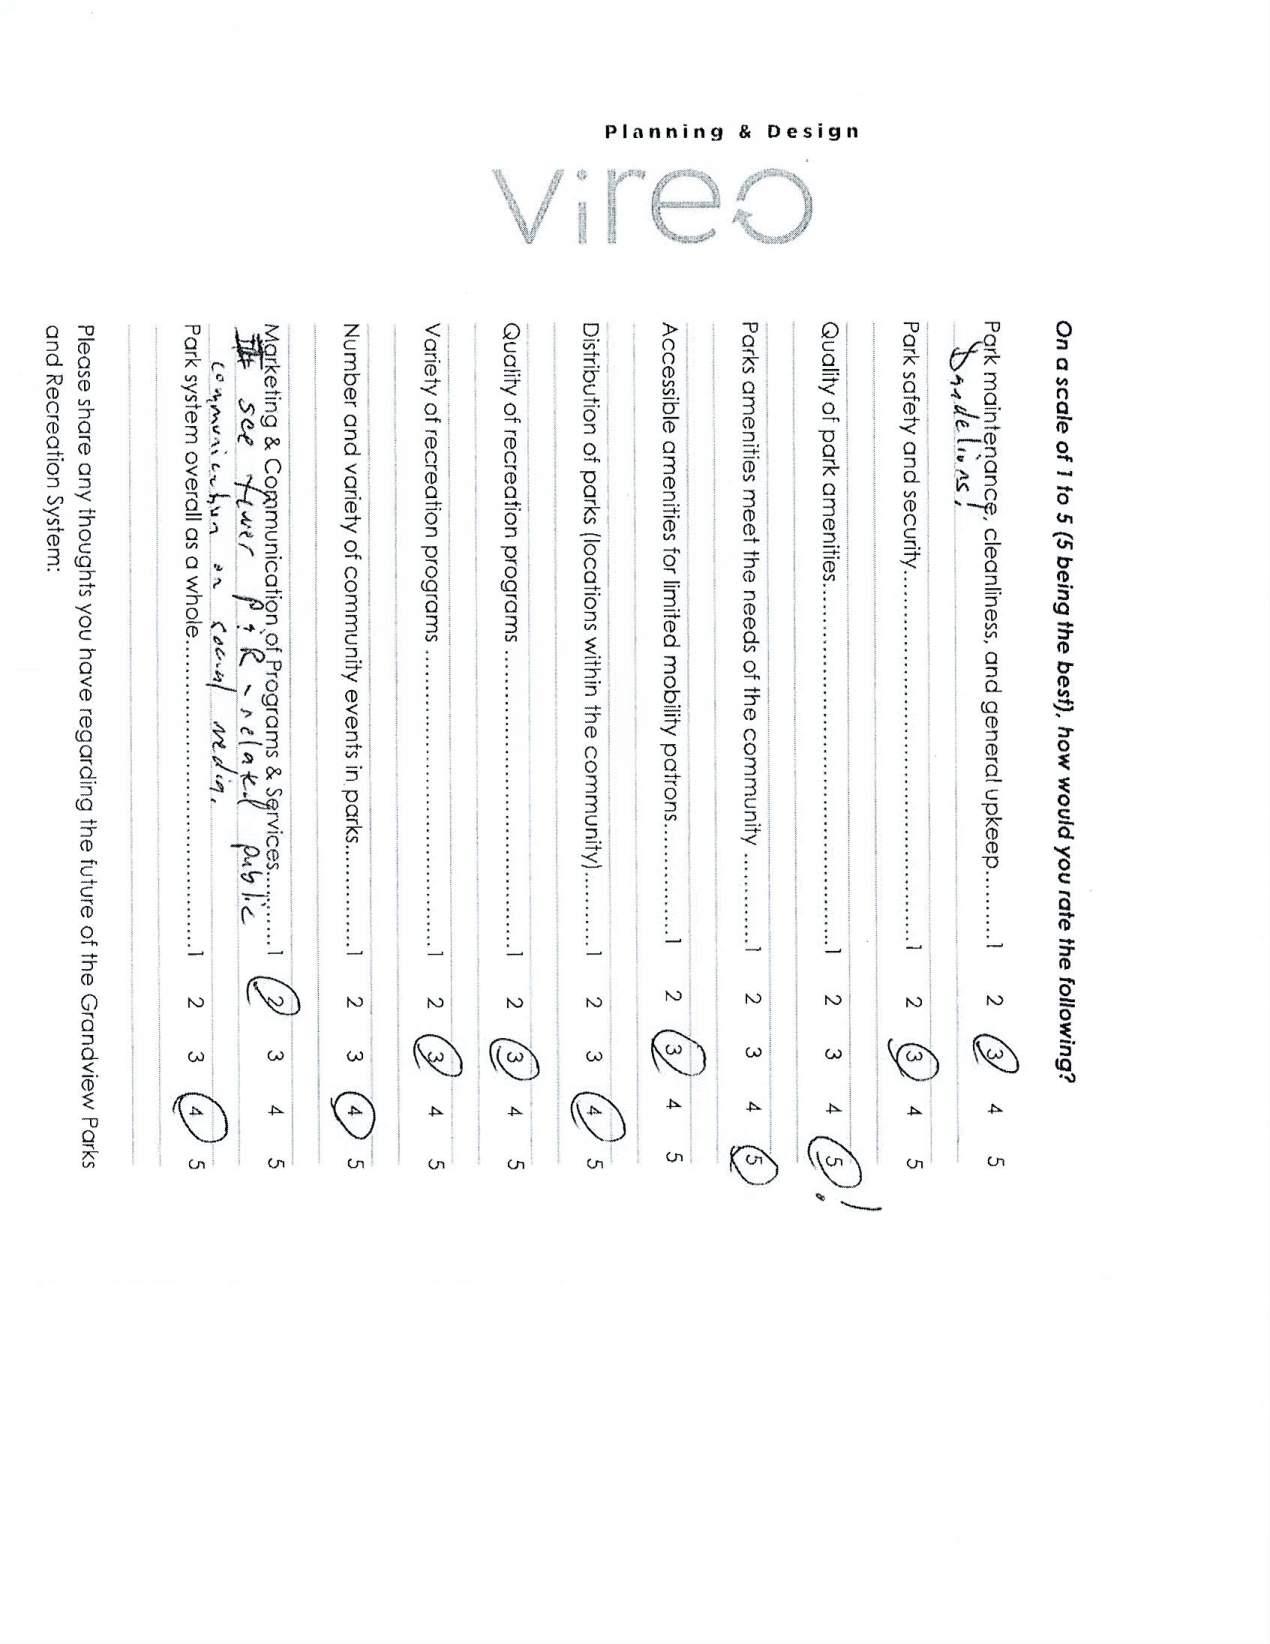
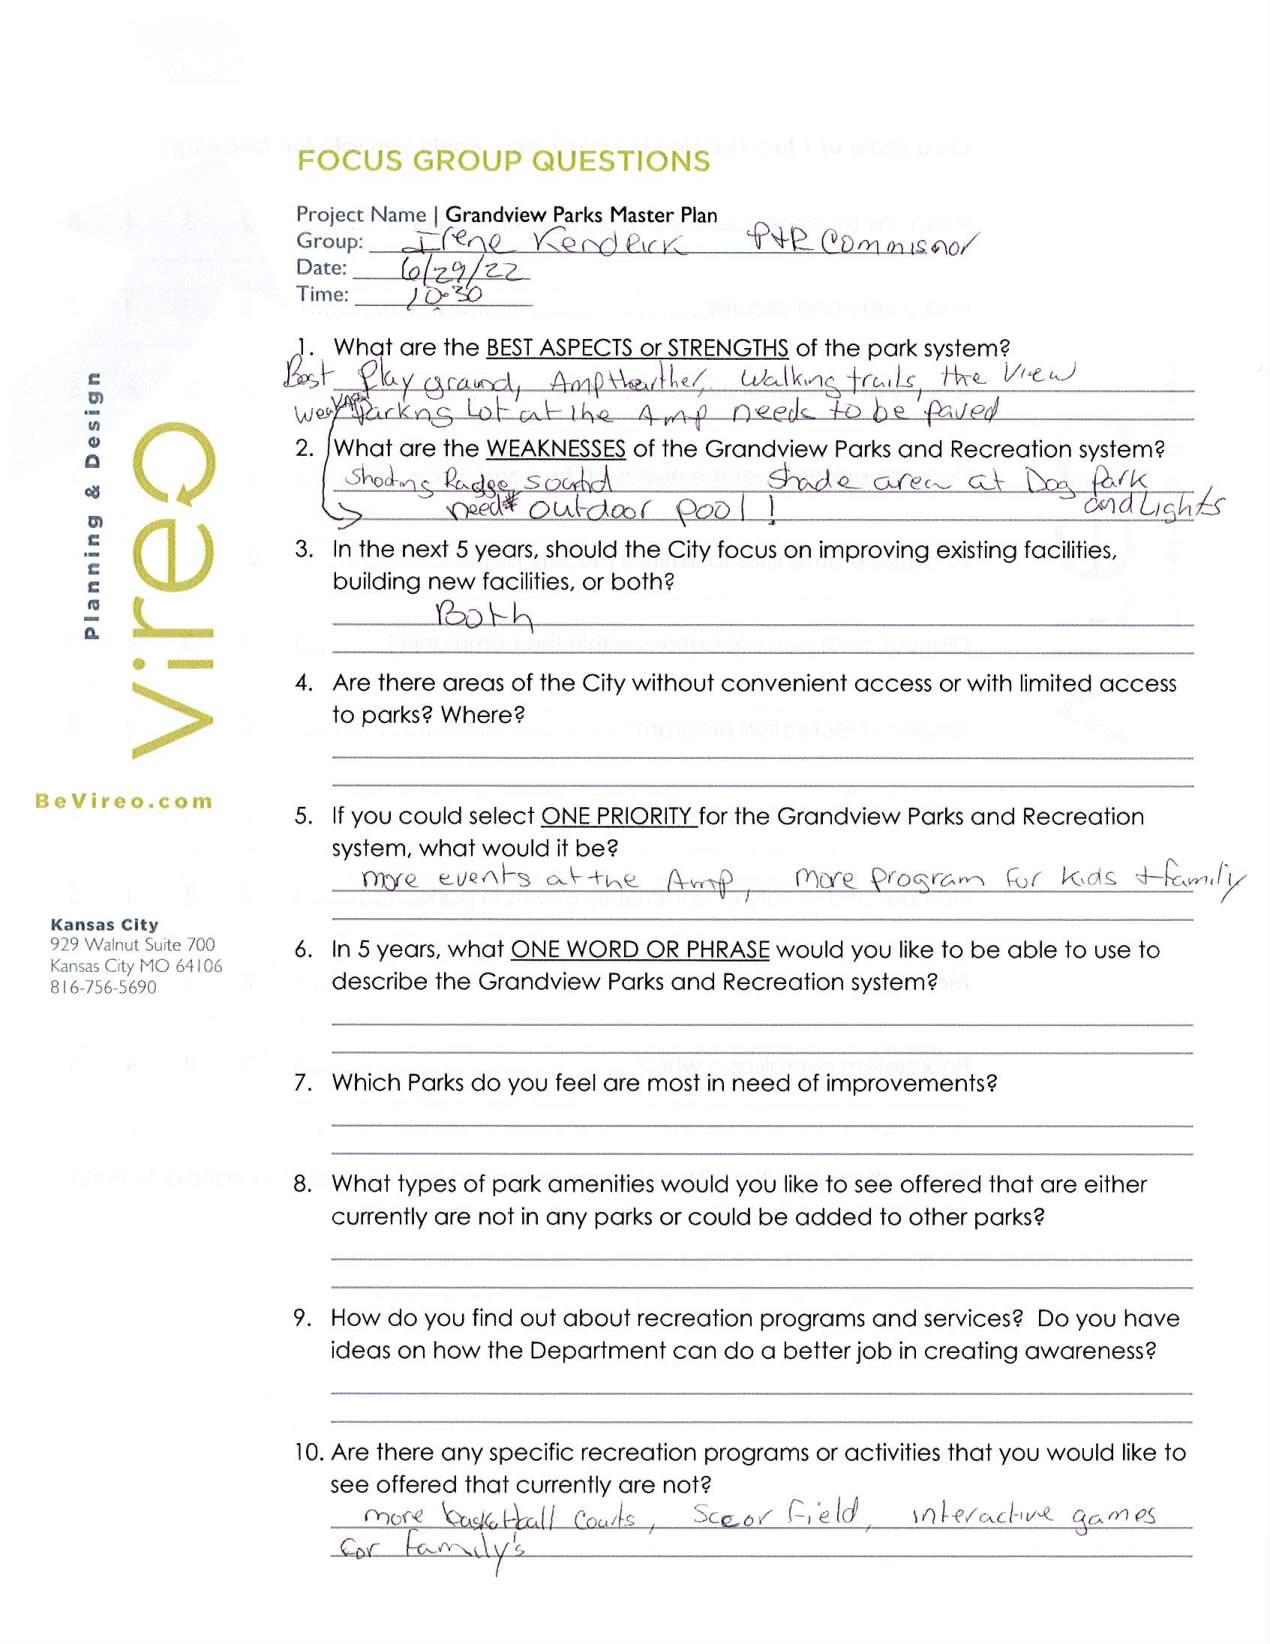
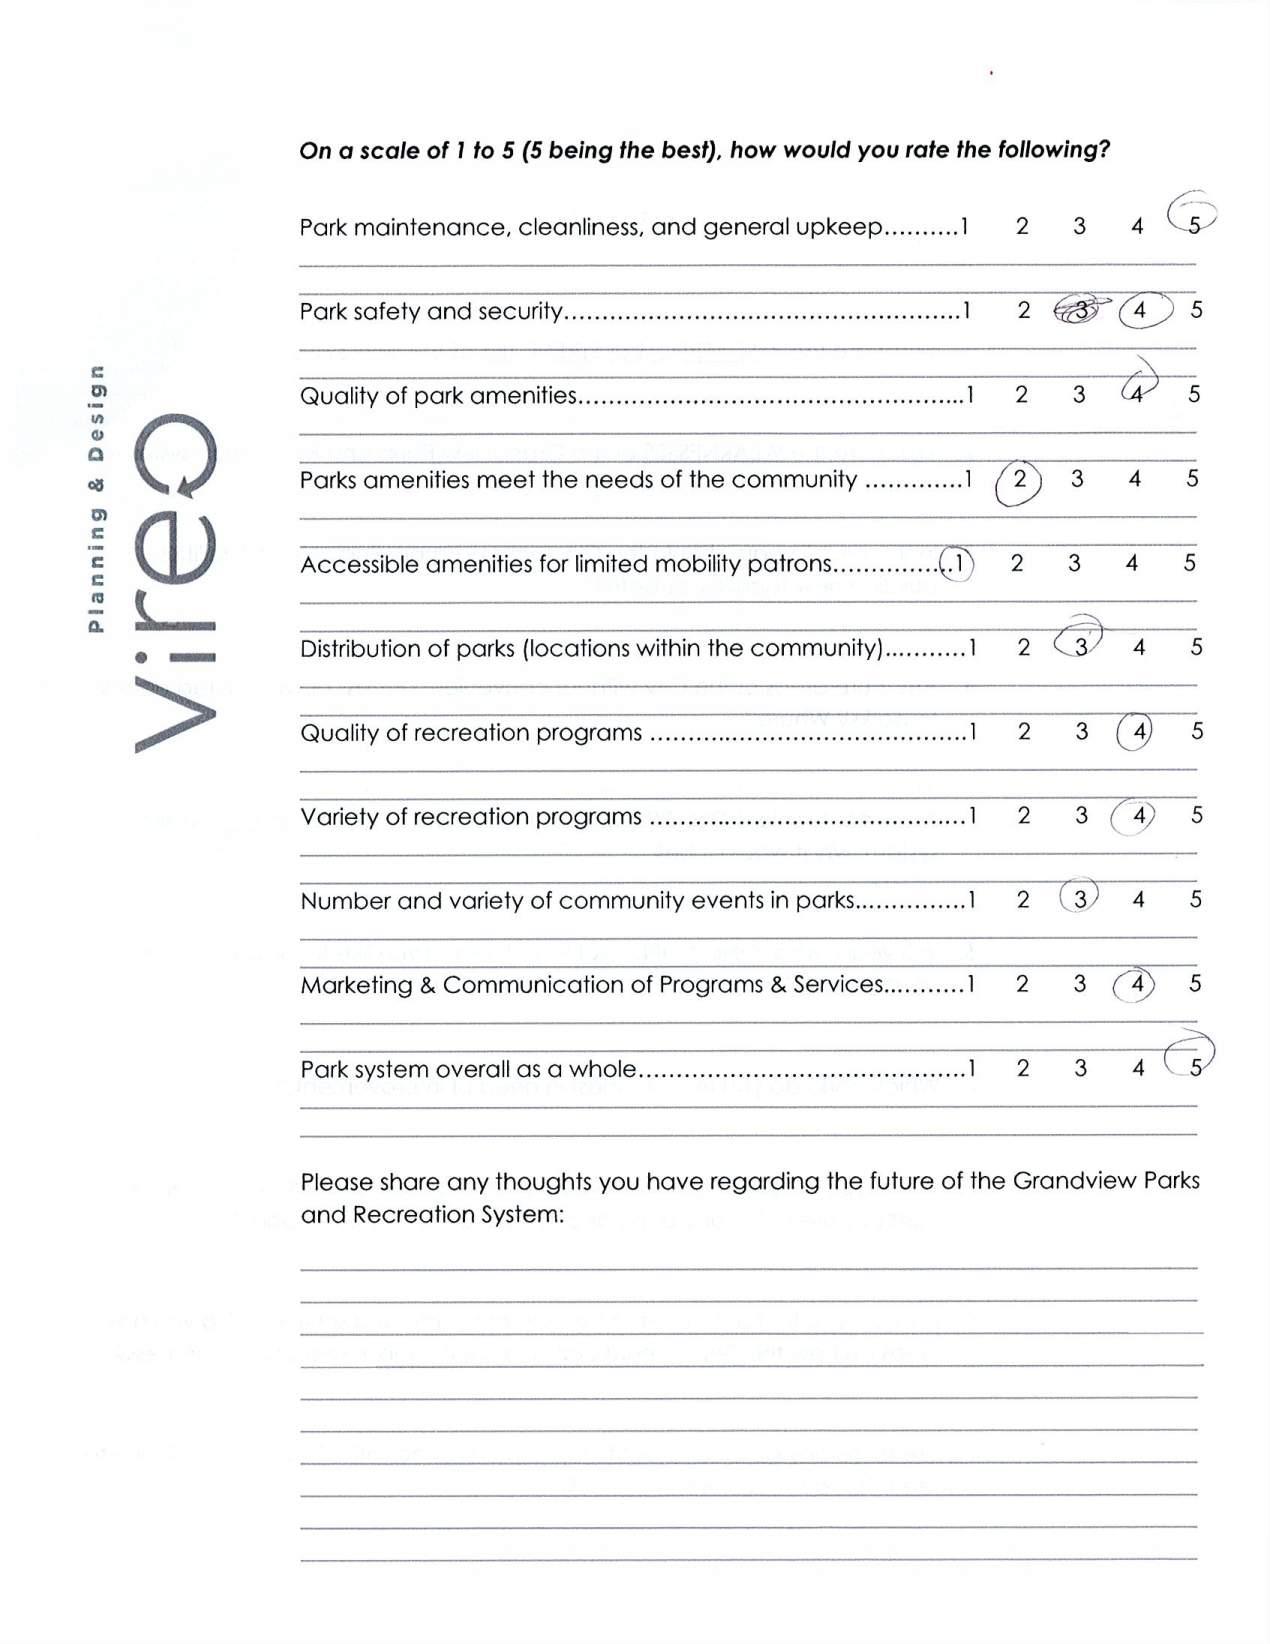
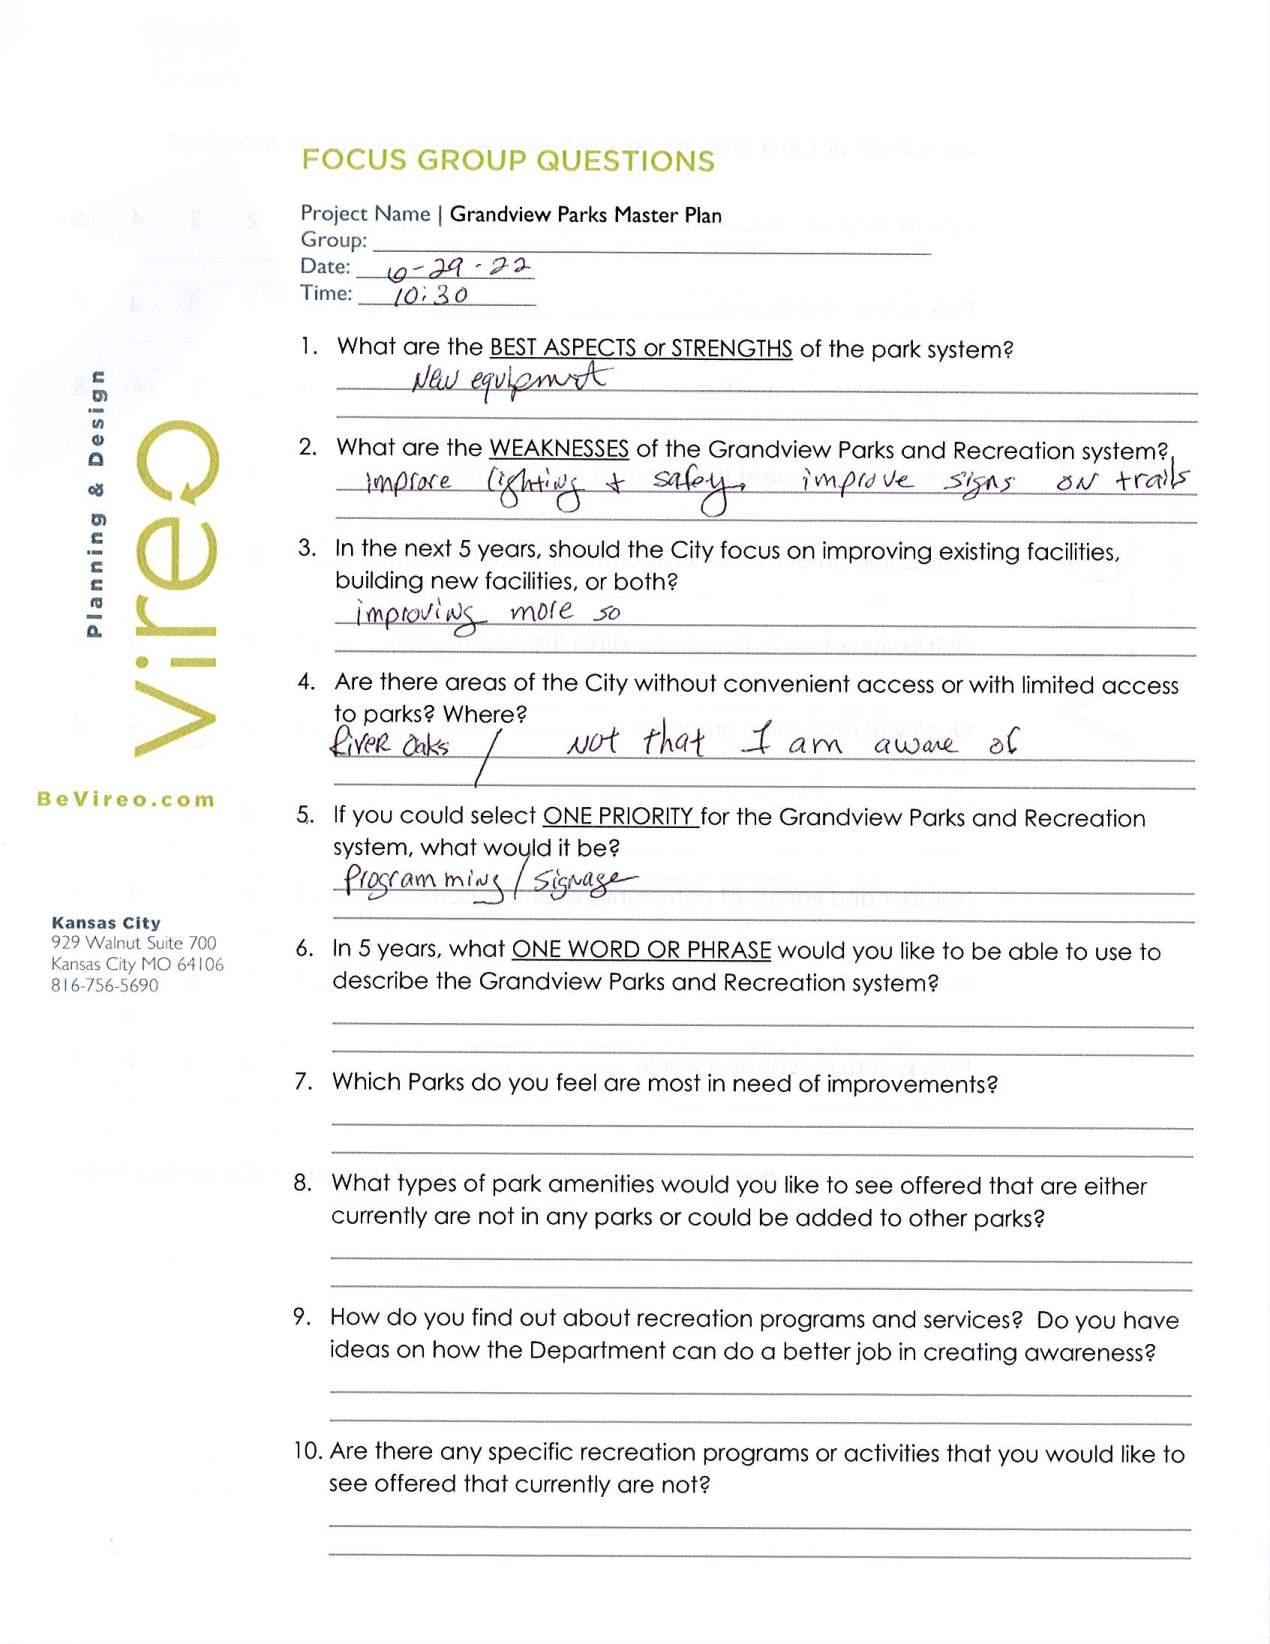
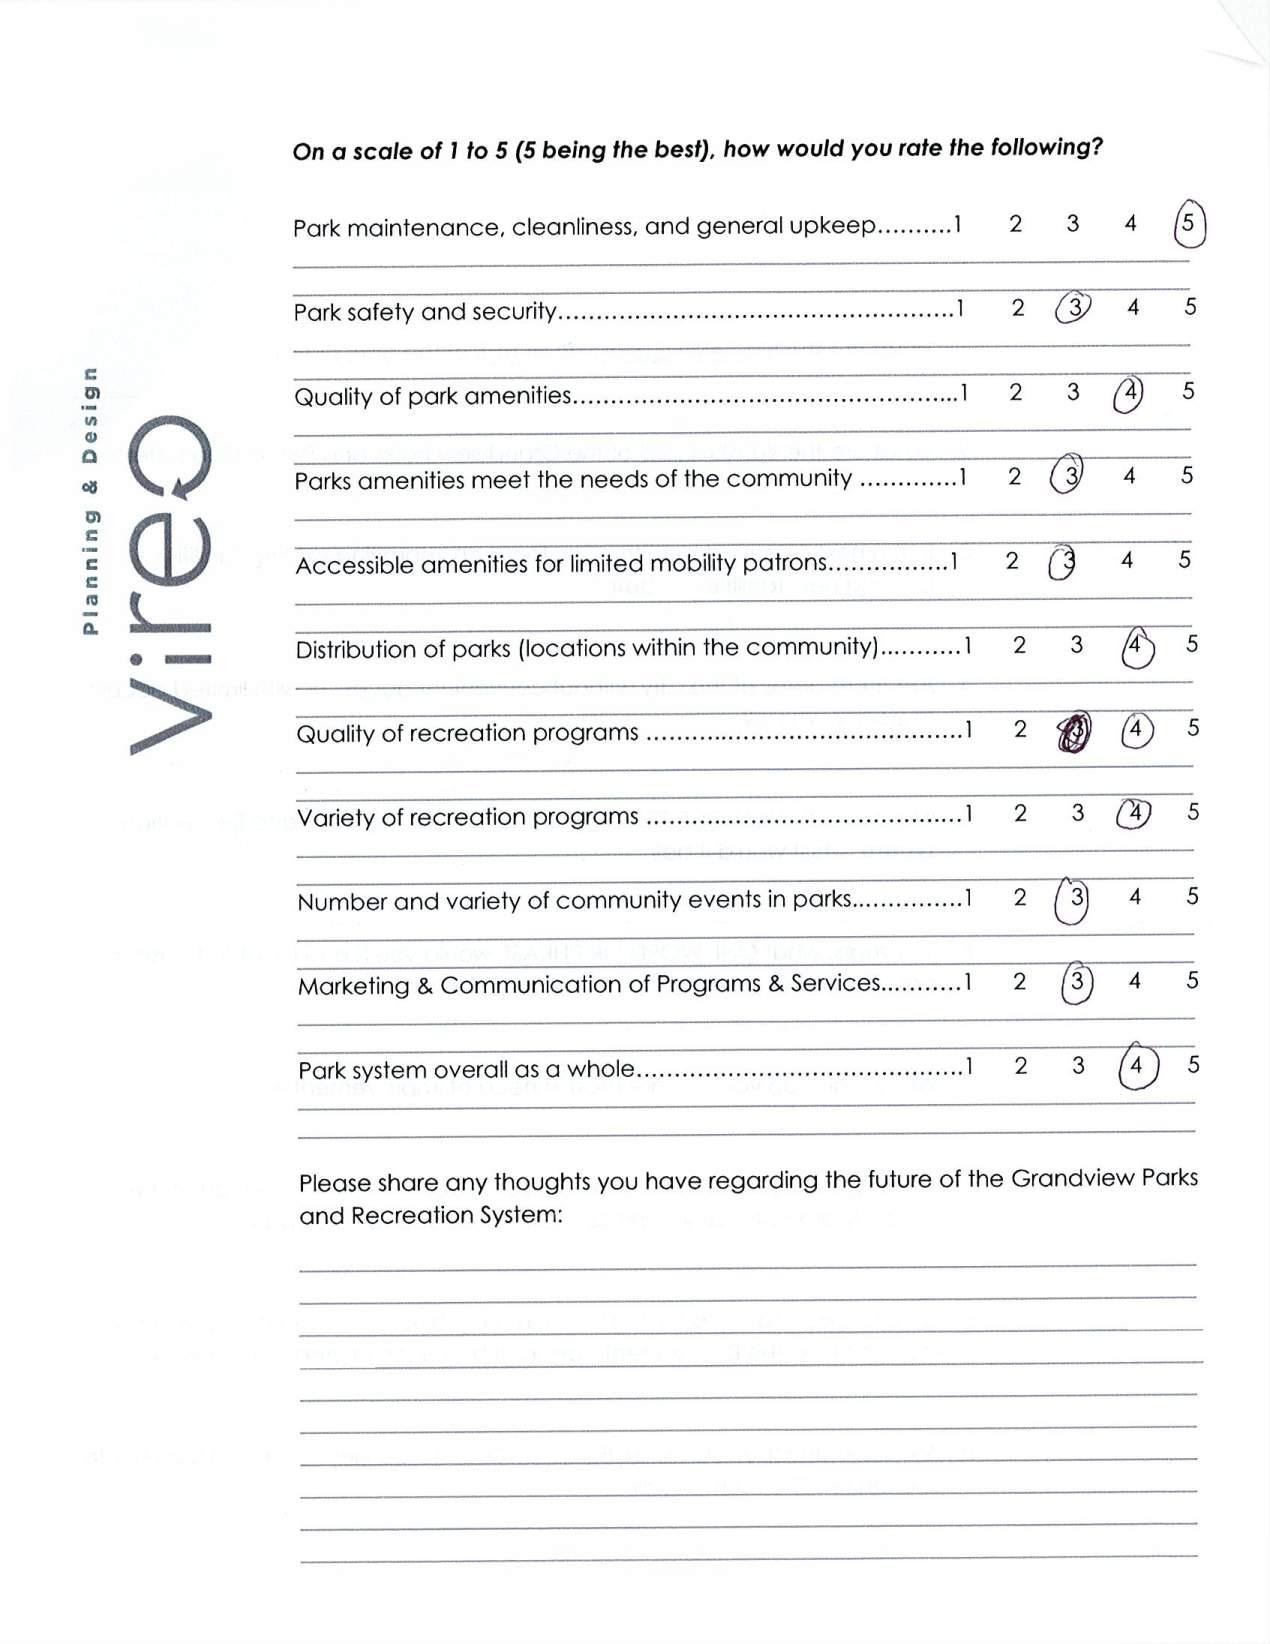
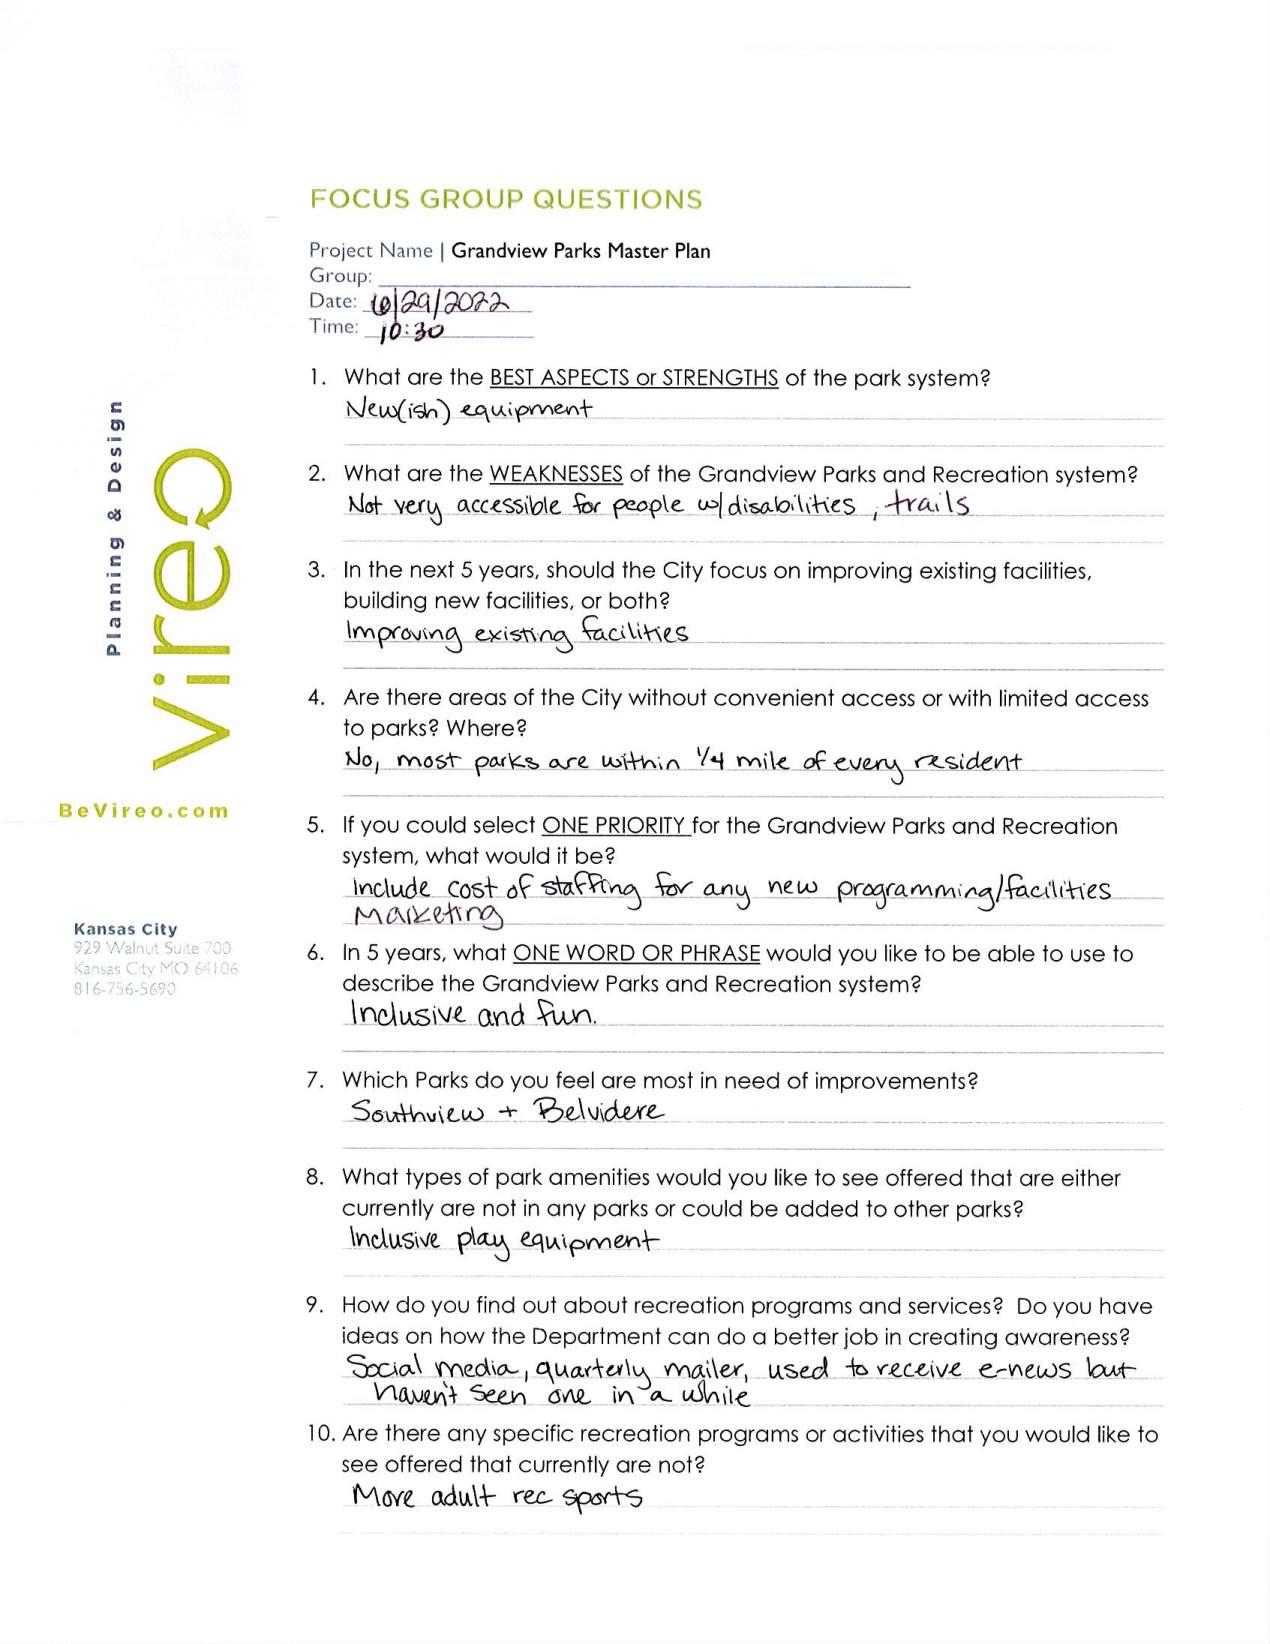
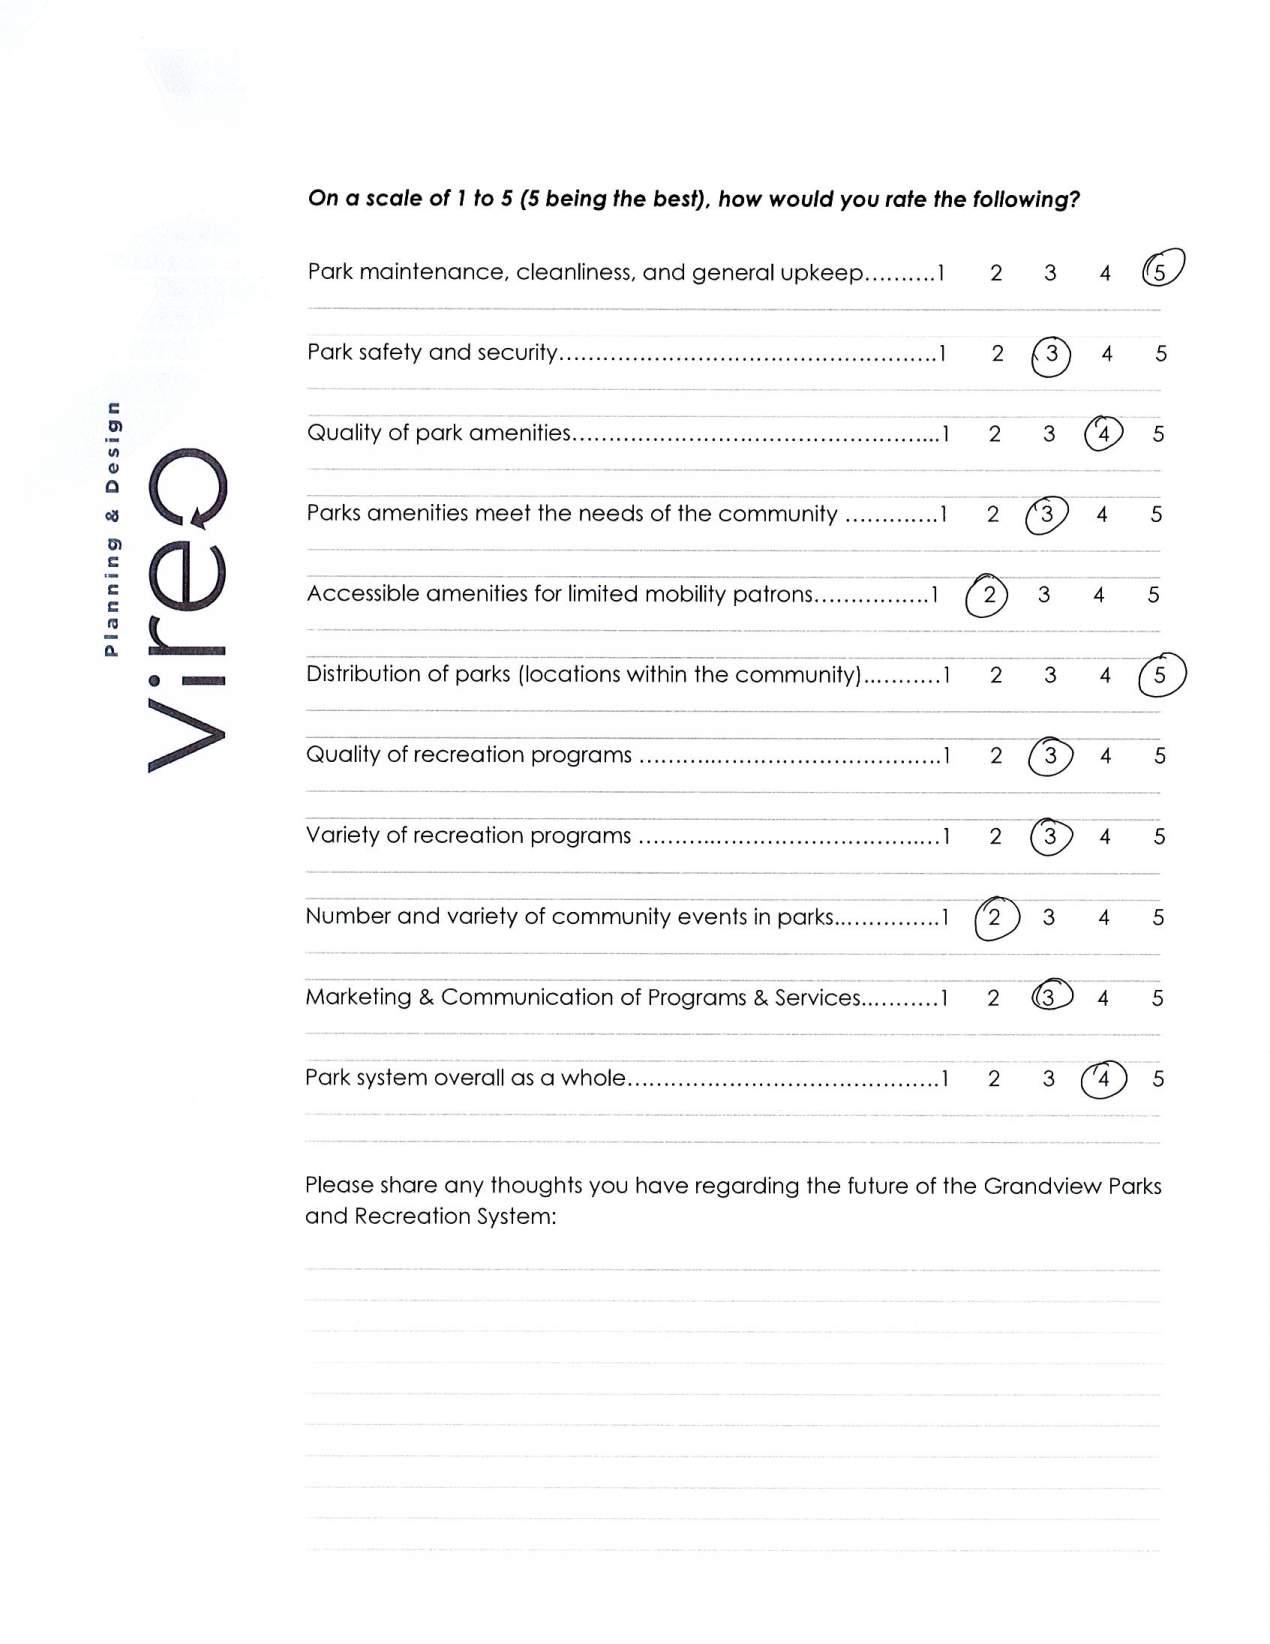
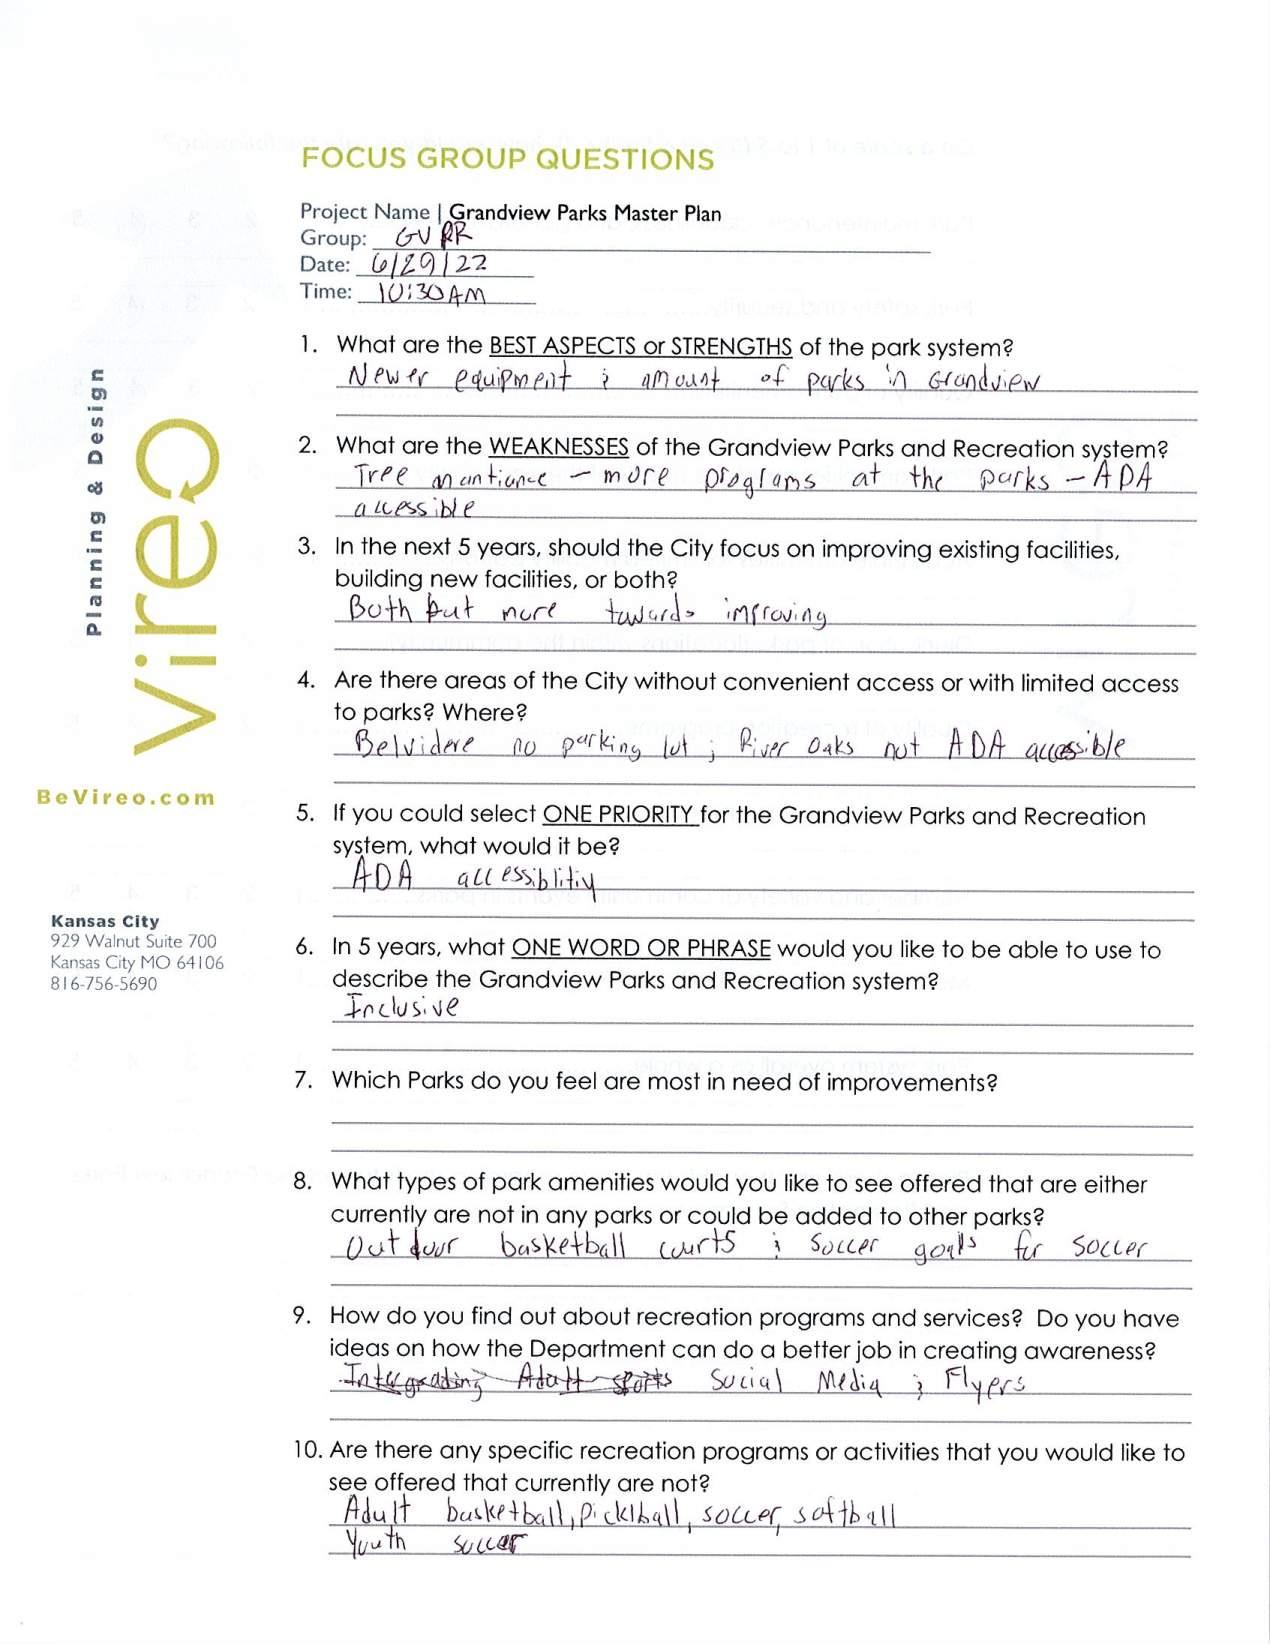
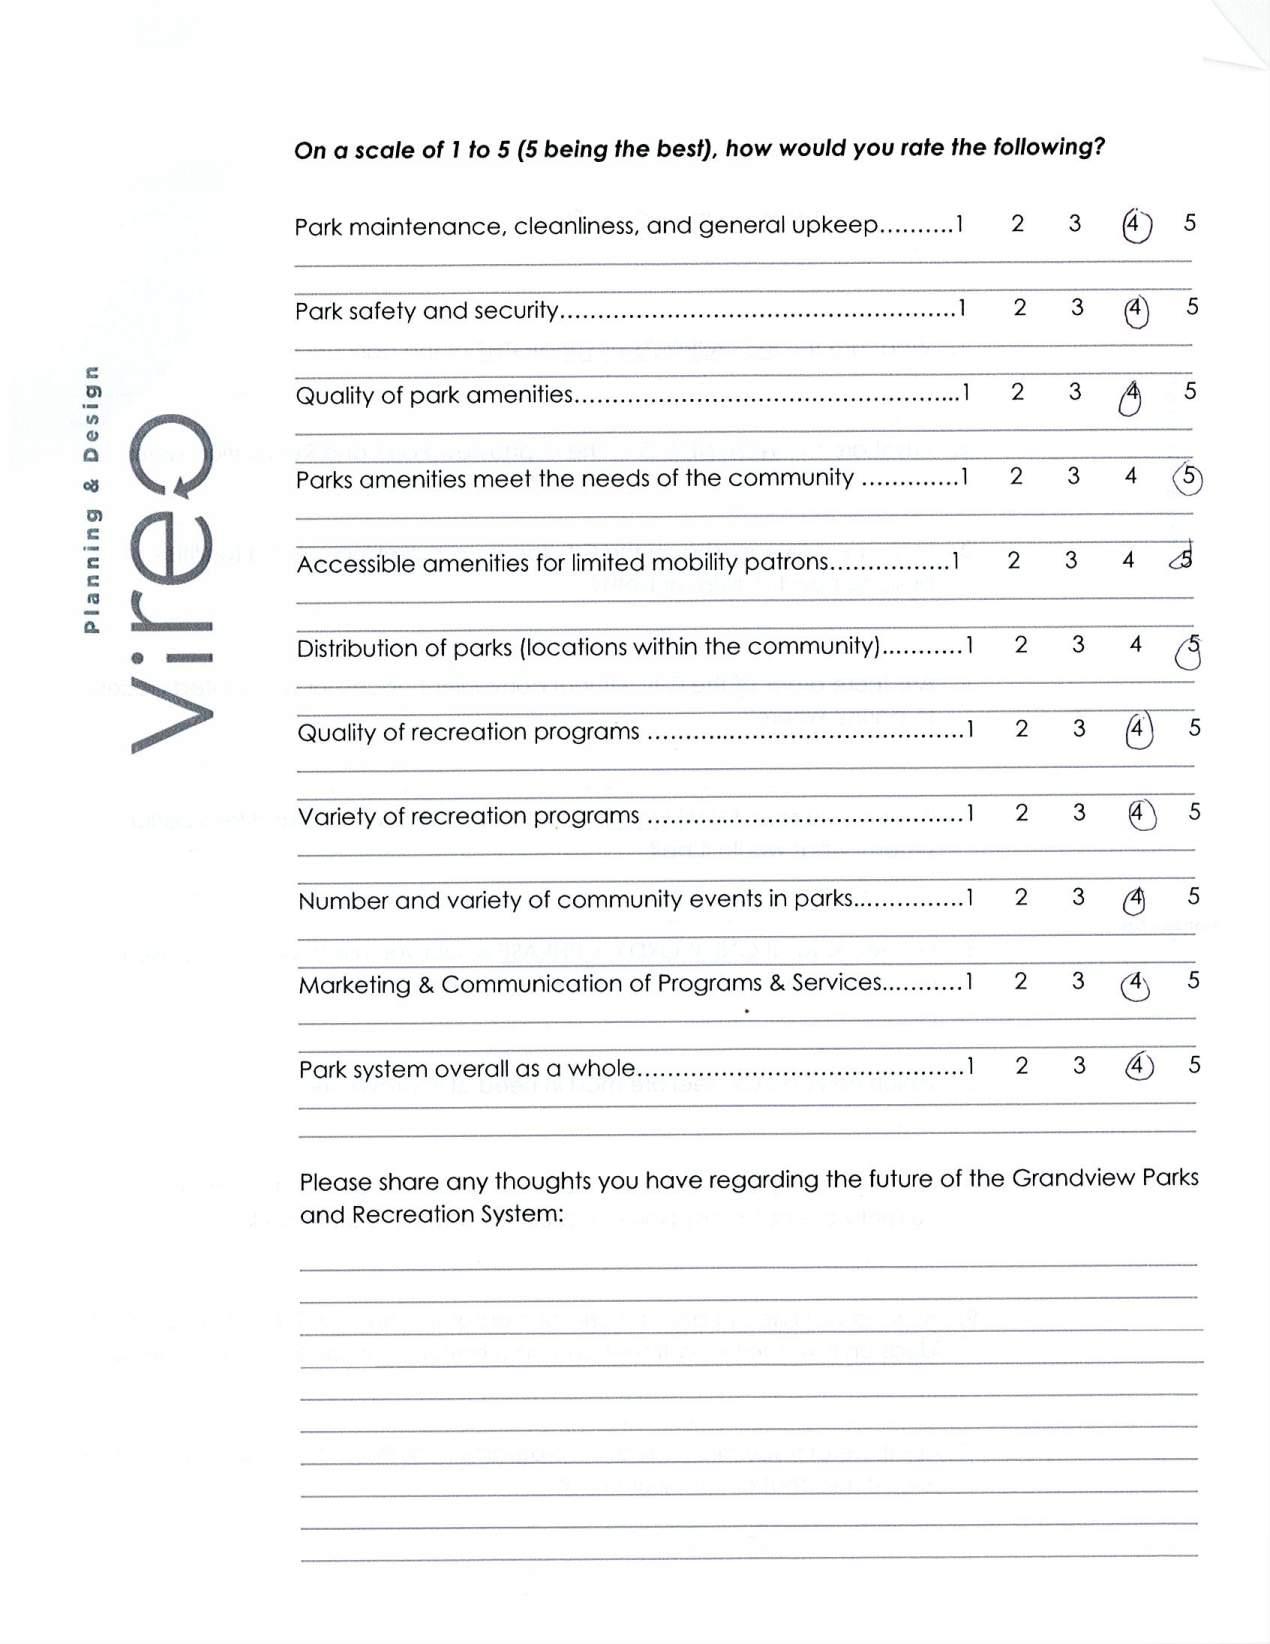
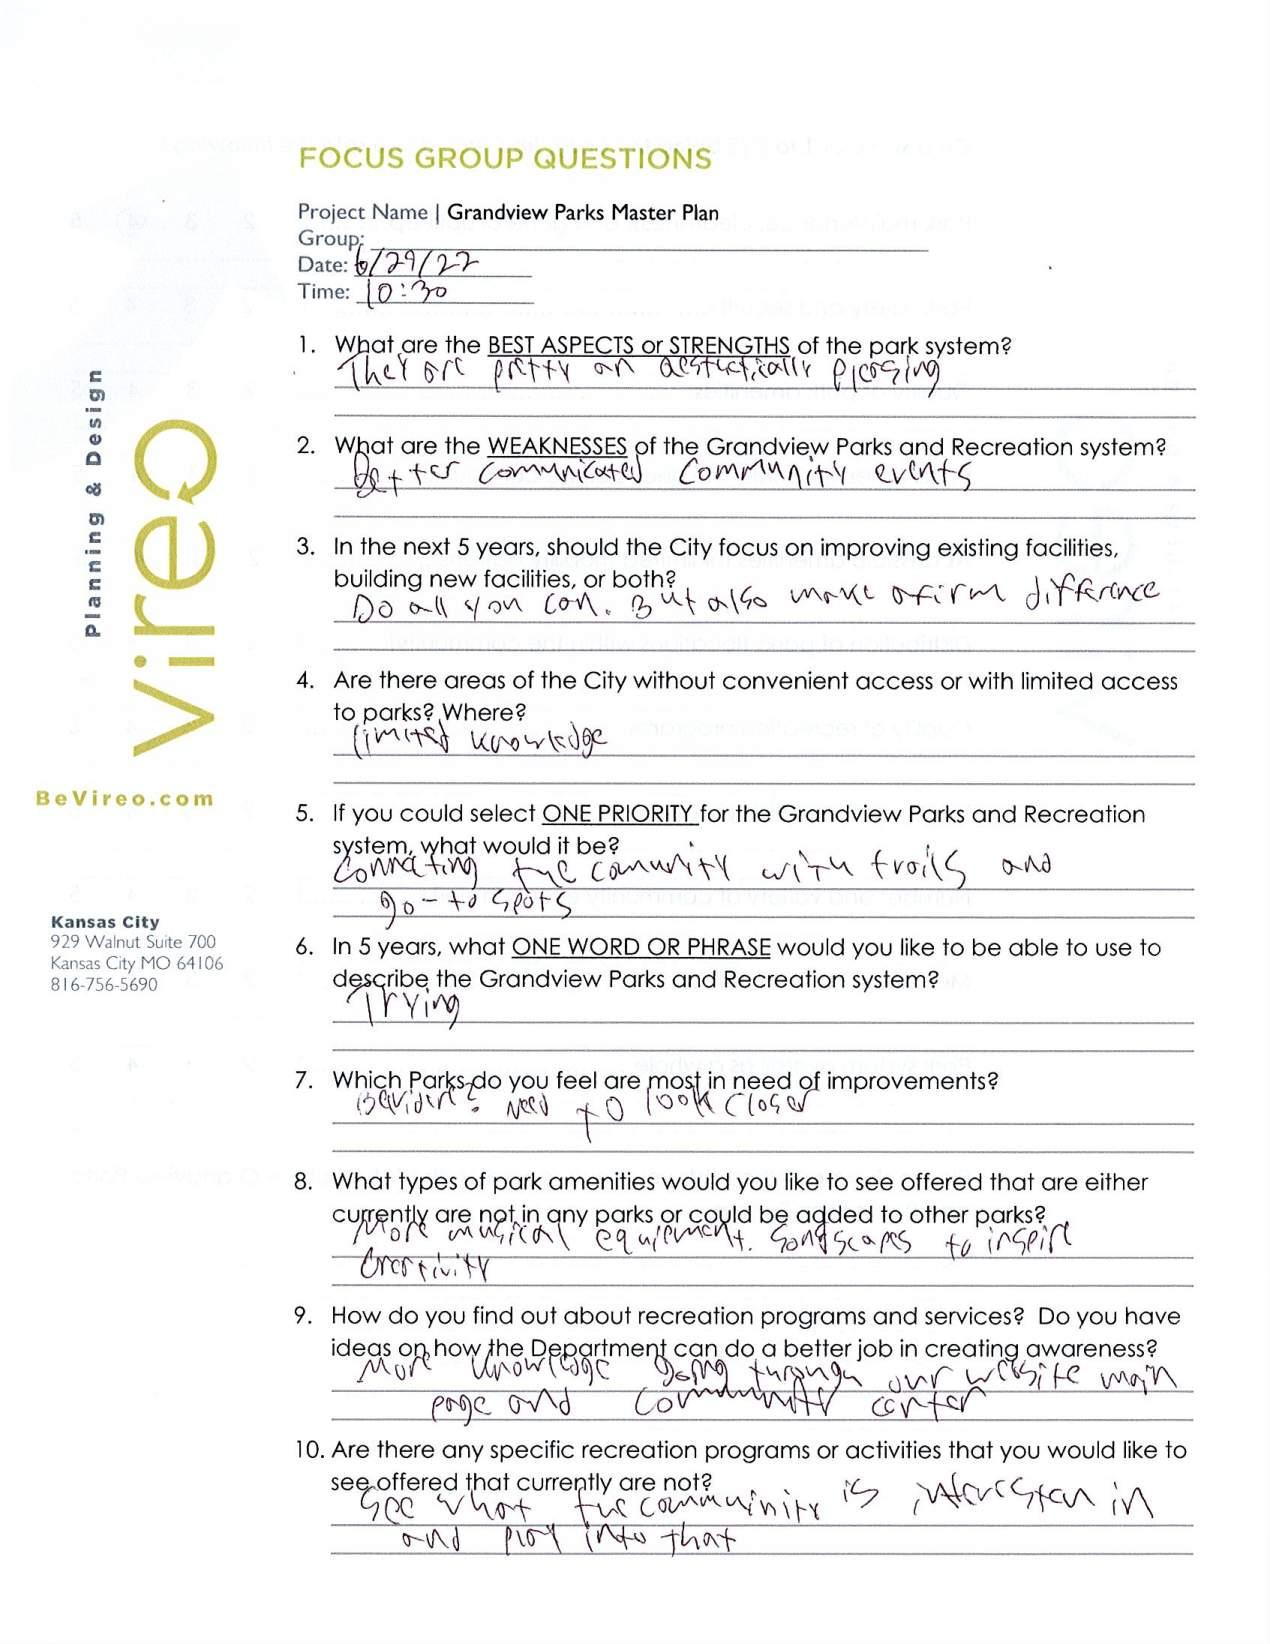
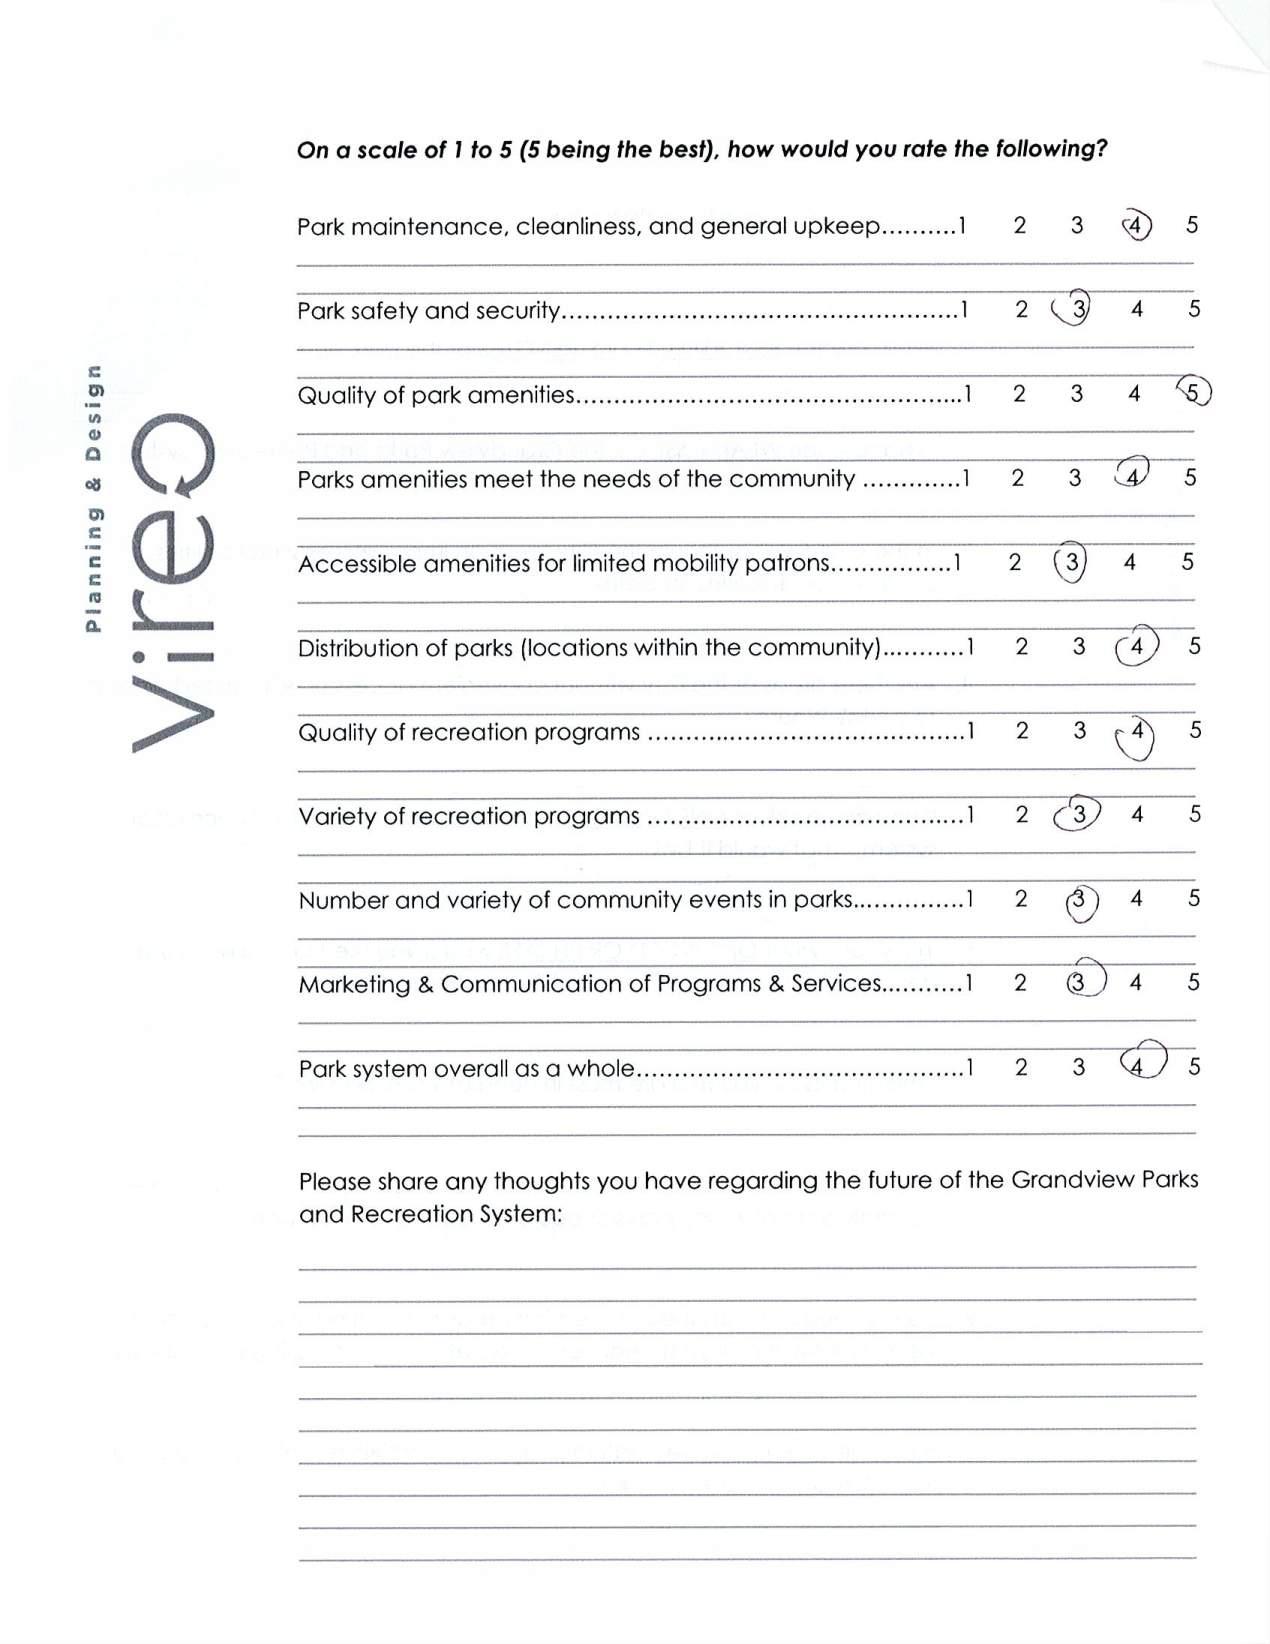
Grandview Parks Master Plan – Focus Group Mtg. #1
June 29, 2022
Participants: 7
• Andy Larson
• Tyler Mossman
• Kenny Pulce
• Irene Kendrick
• Liz Ogle
• Damon Green
• Courtney Pitcher
Q1. Best Aspects or Strengths?
• Strong playgrounds and amenities 08 & 14 – newish equipment.
• Beautiful and lots of green space
• Amphitheater
• A lot of parks – one within a quarter mile of every resident.
• Great community center
• Biggest user base is buying day pass for basketball court/multi-use court at CC
Q2. Weaknesses?
• Lots of trim trimming/inventory and maintenance
• Need more programming – use the amp. more
• Trail systems – need to be accessible
• Make Belvidere accessible
• Not a lot of inclusive equipment and accessibility
• Can maintain but need more staff
• Need more shade in Dog Park – can always add more shade to playground and splash pads
• More trees, more trees, more trees
• Need more sport courts – courts at CC vs. other parks
• Need more benches, shade structures, and trail maintenance
• What does inclusive mean?
o Can have kids actually play with and not just roll up to
o Everyone can use or interact with
o Something for kids with autism and motor skill
o Want more family games and multi-generational equipment in parks
Q3. In the next 5 years, improve existing, build new, or both?
• Combo – need more than 50% to improve existing
• Valley is underused and could be programmed
• Need money for more staffing if we expand
• Be more financially cognizant of long-term maintenance and staffing
• Be better – not the same – if we “maintain” we are failing. Would like to continually improve as long as we can feasibly staff and.
Q4. Areas with limited access? Where?
• Southview – no parking
• Belvidere – not ADA
• River Oaks – not visible
• John Anderson may need some re-working of amenity placements
• Outdoor pool?? – don’t have the maintenance and they are expensive – don’t make money
Q5. One priority?
• Programming & Staffing – can utilize amp and other things more – day camps and summer camps
• ADA accessible and more inclusive – physical and mental
• More trails and more connections
• Programming – keep cost down – maybe for more adults – signage on trails (distance and connections)
• Ditto. Something interactive and family games – do something while kids play
• Staffing for programming – marketing and facilities of the parks – signage, mailers, showcase parks on social, advertise what we have or just built
• Trails – repaving, expanding and ADA accessibility
Q6. One word or phrase?
• Progressive
• Inclusive
• Effort
• Diverse
• Beautiful
• Fun
• Economically and environmentally sustainable
Q7. Which parks need most improvement?
• Belvidere, Mapleview parking lot, River Oaks parking lot,
• Belvidere needs more benches and shade
Q8. Types of amenities to add or do not have?
• Special needs playgrounds, handi-capable, sensory
• Changing tables
• Accessible equipment in EVERY park
• Connecting all parks together with trails and bike lanes
• Programming at all the parks – Mobile Rec
• Sculptures and art projects – e.g. graffiti at the skate park
• So many wooded areas – possibly a mountain bike trails – Valley or JA
Q9. How did you find out about rec programs and services? How can it be better?
• Social media and flyers
• Quarterly mailer/E-News
• Walgreens information boards
• Banners at parks & screens at the CC
Q10. Rec programs or activities to add?
• Adult sports, softball, 3v3, pickleball, soccer
• Amphitheater parking lot utilization for Farmer’s Market, basketball,
Grandview Parks Master Plan – Focus Group Mtg. #2
June 29, 2022
Participants: 5
• Chris
• Sue Yerkas
• Kirk Decker
• Amanda Fisher
• Jamaal
Q1. One priority?
• Parking lots/infrastructure, one park has no parking, several parks needs more, some need re-doing. Lighting for parking and parks
• Parks and Rec Director – childcare facility for employees through city HR
• Trails development – capitalize on greenway system, drainage as an advantage for trail system
• Keep continuing improvements from last several years, good system, have diverse amenities. Improvement mode
Q2. One word or phrase?
• Best in the Metro
• Opportunities
• Opportunities
• BOOM, opportunities
Q3. Which parks need most improvement?
• John Anderson has capacity for most improvement, not being utilized fully, backstops to be removed, not a big baseball area
• Pickleball courts
• Freedom park, moving train depot and improve Main Street, draw people in
• Entertainment for all ages – bike locks, trails, mountain bike trails, facilities to park and secure bike
• Valley Park – mountain bike trails have been started by residents
• All trails – our trails aren’t on the map/app
• Biking trails
• Interactive maps for children – identify plant species, etc. Junior Park Ranger badges
Q4. Types of amenities to add or do not have?
• Pickleball
• Walking track at John Anderson or Shalimar
• Inclusive playground at Shalimar
• Disc golf at Southview
• Modest soccer program/100 kids – introducing soccer goals at Shalimar
• Soccer at Amphitheater parcel, half and quarter fields
• Deanna Rose Farmstead – education and programming for children
Q5. How did you find out about rec programs and services? How can it be better?
• Facebook and social media, information boards at JA, Valley, and Meadowmere
• Banners and yard signs, fliers, libraries, school systems
• Newsletter
Q6. Rec programs or activities to add?
• Basketball community
• Pickleball
• Running and biking club
• Sand volleyball – Martin City & Lee’s Summit is booming
• Workout areas – adults only
• Family games/board games, board game competitions
• Parks that appeal to city employees too – for employees to go during lunch, nature walking paths
• Visitors to town hall have things they could do in line like musical chairs and recumbent bikes, canopies with chairs,
• More wellness programs
• Skate parks are going to be big since its now an Olympic sport – maybe expand it
Latino and Latina population is big – want soccer
Grandview Parks Master Plan – Focus Group Mtg. #3
June 29, 2022
Participants: 2
• Damon Randolph
• Rodney Schmidt
Q1. Best Aspects or Strengths?
• Strong people – a lot of parks have been updated or are up to date
• Always looking for “what can we do?”
• Quality of parks is good
• Staff has been consistently good – very committed
• The View is a good facility
Q2. Weaknesses?
• Be careful of what we add as it might be too much for staff to keep up on, they keep up but are probably short a person or two
• Maintenance is always a concern, can’t just build, build, build and not think of staff and cost
Q3. In the next 5 years, improve existing, build new, or both?
• Improve or both
• Improve or both
Q4. Areas with limited access? Where?
• No, but some wards don’t have one of every amenity, need consistent amenities in each ward if it is cost effective/makes sense
Q5. One priority?
• Bikes and trails, connect the parks (talks of BikeKC, integrate the plan)
• Programming – have it evolve and be agile, could use things more and hire a programs director for Amphitheater and other large amenities
• Marketing – market well but could be better
• More tie in between community gardens and Farmer’s Market
Q6. One word or phrase?
• Awesome
• Continued momentum
Q7. Which parks need most improvement?
• John Anderson has a ton of potential – lot of lands, no one uses the baseball diamonds, put in more exercise equipment. Could be for Disc golf and fitness equipment
• Southview needs a parking lot
• Mapleview needs trail replacement
• Valley has so much wooded area
Q8. Types of amenities to add or do not have?
• Need more outdoor basketball courts – possibly Mapleview, John Anderson, something in each Ward
• Possibly pickleball
• Disc golf
• Security cameras in every park/park ranger at John Anderson
Q9. How did you find out about rec programs and services? How can it be better?
• Facebook and social media
• Facebook and social media
• Parks and Rec Report/newsletter
Q10. Rec programs or activities to add?
• Robust, flexible, fitness class schedule at CC, continued effort finding instructors for classes that community wants to take
• Keep providing what the community wants in the CC and for classes
• Want more arts as a parks and rec program
• Look at Salina, KS for inspiration for arts in the parks and public realm
• Need to revisit programs/activities that were started/introduced pre-COVID.