


Site works on the Transforming Bunbury Waterfront project, South West region
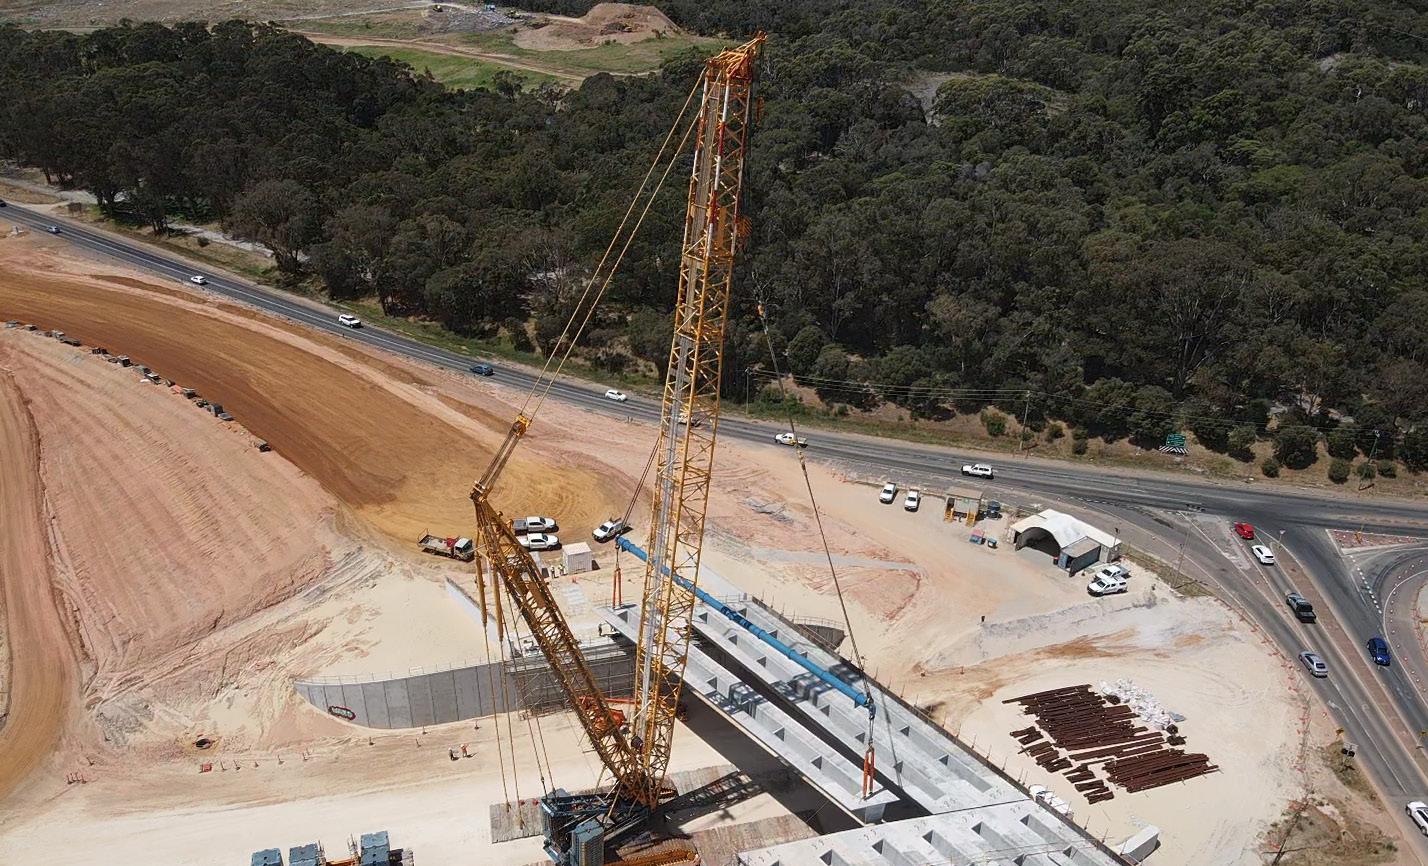
Cover image: The new Fitzroy River Bridge under construction, Kimberley region (photo: Main Roads WA)


Site works on the Transforming Bunbury Waterfront project, South West region

Since 2017, the State Government has worked tirelessly to ensure Local Content is embedded in government procurement. Our Local Content Program is dedicated to ensuring regional businesses have full, fair and reasonable opportunity to supply to state government, and the Local Content Adviser Network (LCAN) takes a lead role in supporting regional business opportunities.
The Department of Primary Industries and Regional Development (DPIRD) delivers the LCAN across the state, through a statewide team and a Local Content Adviser embedded in each Regional Development Commission (RDC), helping to connect local businesses to government supply opportunities, enable regional business to be competitive, and to maximise local business participation.
Over the past 7 years, the LCAN has gathered critical intelligence and harnessed considerable influence over government procurement in the regions. The LCAN also measures the performance of the Western Australian Government in relation to Local Content and Local Content regional economic impact.
The LCAN has prepared this Local Content in the Regions Report for 2022-23 to provide an overview of Local Content outcomes for the financial year. I am pleased to report there has been an uplift
in the government’s Local Content performance across a majority of the gauges throughout the report, such as regional suppliers breaking local supply thresholds, increasing the value of local supply on contracts over $5 million and taking a greater share of supply on complex state-wide contracts.
This substantial lift in local supply is quite an accomplishment for State Government agencies focused on Local Content. It is a testament to the LCAN and its efforts to raise awareness of Local Content practice and the importance of the Western Australian Buy Local Policy to our regions. The results in this report reinforce my belief that if you dedicate resources to Local Content, there are tangible and intrinsic economic benefits for regional economies.
I would like to thank the Director General of DPIRD, the RDC CEOs and the LCAN for their dedication and commitment to Local Content in government procurement.
I hope that you find this report a valuable information source and reliable gauge of the State Government’s Local Content performance in the regions. Our government is committed to continuing to embrace the value of having the LCAN involved in procurement planning for regional projects into the future.
The Hon. Don Punch MLA Minister for Regional Development; Fisheries
The Local Content Adviser Network (LCAN – ‘the Network’) was established in 2018 and works closely alongside the Department of Jobs, Tourism, Science and Innovation (JTSI) and the Department of Finance with the aim of driving opportunities for regional businesses to supply to state government. Since inception the Network has been connecting across government agencies, industry bodies and small-to-medium enterprises so that regional businesses can mature, diversify and develop additional capability.
The Network’s collection of WA state government regional Local Content datasets commenced in 2017 to enable longitudinal analysis of supply trends and constraints, noting that a high proportion of supply contracts are offered on 3 to 5 year or longer contract terms. The Local Content metrics 2017–2023 and regional profiles for each Regional Development Commission (RDC) region show that significant progress has been made across the board with Local Content, with most measures indicating an uptick against longitudinal averages.
A notable indicator of the Network’s growing maturity is that 21% (by value) on government procurements in 2022–2023 were local supply, up from the 6-year average of 18%. With $5.79 billion of contracts awarded in regional WA for 2022-2023, this means $1.2 billion in local supply contracts, being $174 million more than would have been achieved if performance had stayed at the longterm average.
Another indicator demonstrating proactive engagement and forward planning in 2022-24 has been the Network team identifying 216 new potential regional suppliers to government and undertaking more than 3,317 engagements with businesses, peak industry groups and government agencies.
The Network’s engagement on supply opportunities was enhanced through integration of WA’s Strategic Forward Procurement Planning data for statewide and regional procurements for goods and services, which provides visibility to local industries on future potential supply opportunities and has helped to achieve:
1. a considerable increase in local supply on statewide contracts with regional suppliers increasing their share by value to 17%, well above the long-term average of 9%.
2. an increase in local supply on contracts valued between $5 million and $25 million, which demonstrates increased regional business capacity and capability, as well as appetite for growth, a key objective of the Network.
The Network will continue to deliver against its objectives, refine Local Content practice, expand partnerships and relationships with government entities and regional suppliers, and continue to lead Local Content in Western Australia for the benefit of our


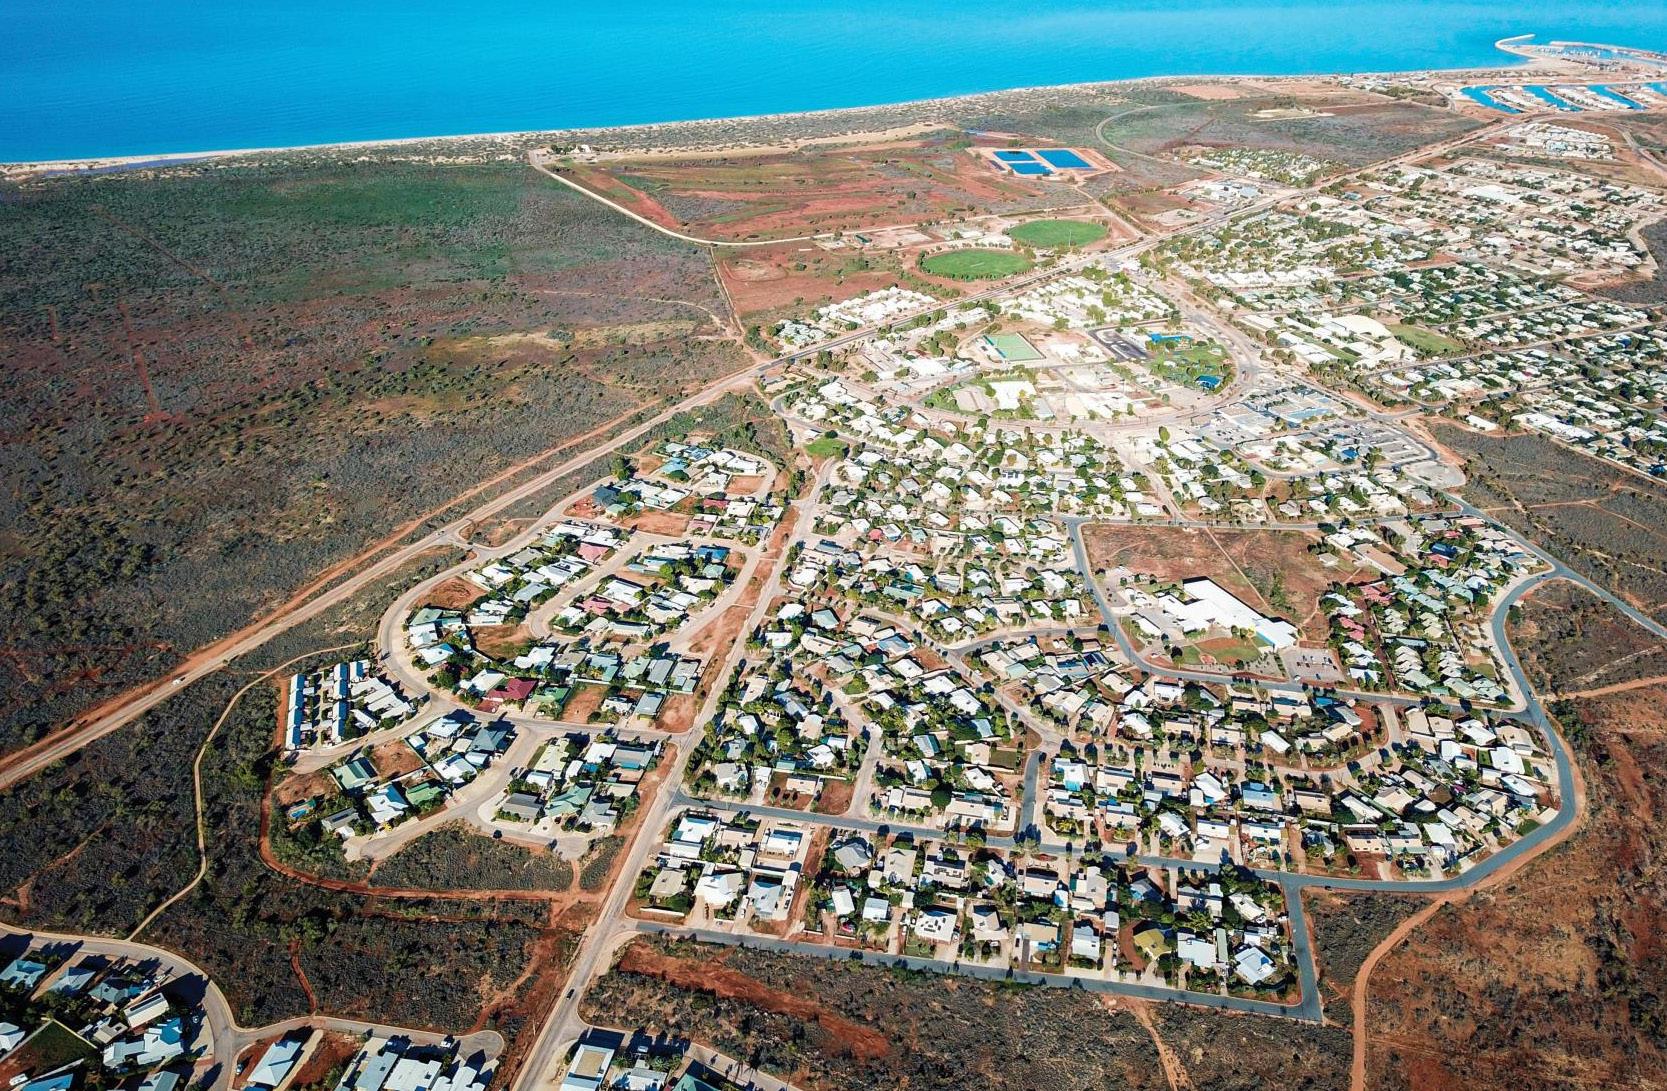
Town of Exmouth aerial view, Gascoyne region (photo: Gascoyne Development Commission)

LCAN was established in 2018, with the impetus behind the formation of the Network being the WA Government’s commitment to building and diversifying regional economies and creating jobs. LCAN seeks to ensure businesses in regional WA receive a fair share of government expenditure on works, goods and services. The network connects across government agencies, industry bodies, and local suppliers in regional WA to increase participation in supply chains, and to assist regional businesses to grow, diversify and develop additional capability.
• Supporting the Buy Local Policy across government agencies
• Facilitating a culture of buying close to home
• Understanding and growing regional business capability and capacity
• Providing feedback on regional business advantages and challenges
• Measuring and demonstrating the value and impact of Local Content in regional economies
• Forging lasting and mutually beneficial relationships with our stakeholders Reform
• Supporting and influencing reforms that maximise opportunities for regional businesses
• A trusted source of Local Content information and gathering a strong Local Content evidence base
In 2019 LCAN began advocating for forward procurement planning and supported the introduction of openly published procurement planning data through the state government’s procurement reform process led by the Department of Finance.
Forward procurement planning is a process arising from the Western Australian Procurement Rules (WAPR). Rule F6 of the WAPR requires state agencies to submit a Strategic Forward Procurement Plan (SFPP) to the Department of Finance each year which among other things must identify:
• planned procurements valued at over $250,000 and above occurring within the next 2 years and sometimes beyond;
• any strategic projects, to enable early consultation with the Department of Jobs, Tourism, Science and Innovation;
• procurements suited to meeting relevant procurementconnected policy commitments such as engagement of registered Aboriginal businesses; apprentices and trainees; Australian Disability Enterprises; regional businesses and small to medium enterprise (SME).
The main benefit of strategic forward procurement planning to Local Content is that it provides visibility to local industries on potential supply opportunities in the future.
The WA Auditor General’s Local Content in Government Procurement (Report 25: December 2017) made a finding that 'data is not reported and collected consistently or regularly enough for reliable analysis … there is no single collection point for local content data'. In response to this finding the LCAN designed and deployed a customised cloud-based Local Content operating and reporting platform, now known as the LCAN Hub (‘The Hub’).
The Hub interfaces the Network’s activities in relation to procurements and regional projects in support of reporting on LCAN’s attribution to Local Content outcomes in regional WA. The Hub also contains Australian Government contract awards data and attaches Australian Government contract award details to WA regional suppliers; possibly being the first-of-a-kind integrated data collection point for shared Australian Government and WA Government Local Content data.

The timeframe for a procurement from planning to contract award is generally determined by the value, risk and complexity of the procurement and can range anywhere from 12 weeks to 3 or more years. In WA, state agencies must develop a procurement plan for goods and services (including community services) procurements valued at $5 million and above. Similar procurement planning documentation requirements apply to works procurement valued at $5 million and above. The stages of the procurement cycle for infrastructure projects drawn by Wells and Hawkins are shown here, with projects encompassing all stages from identification of need through to maintenance of the asset.
Through ongoing work with agencies the LCAN has observed that Local Content outcomes are optimised through early intervention on supply opportunities in the project identification stage.
Early intervention means consideration can be given to 'strategies that adjust to different local capabilities, competitiveness and the risk within or depth of local supplier markets'ii, such as the relaxation of pre-qualification criteria and careful packaging of scopes of work which may, for instance, account for regional trading footprints.
7

Operation and ongoing asset maintenance
Commissioning and handover
Construction and contract management and evaluation
Design and specification
Determine procurement method
Project identification and feasibility study 6 5 4 3 2 1
Appointment of contractor
The stages of the procurement cycle for infrastructure projects
As part of a suite of public sector reform initiatives in 2020, the WA Government began its procurement reform process to harness its significant spending more efficiently and effectively to promote WA’s continued growthiii. At around the same time, the transport industry peak body Roads Australia outlined a procurement reform strategy for Australian infrastructure projects, including 21 recommendations to government and industry to drive improvements in works procurement processesiv.
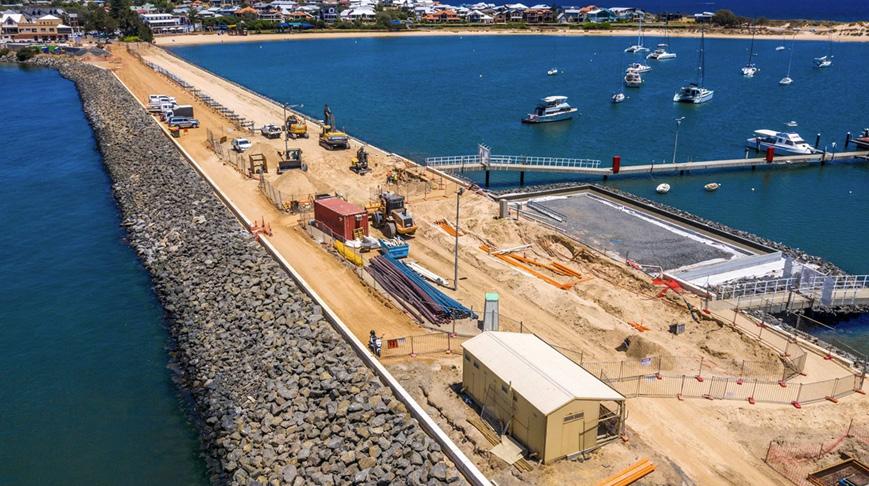
Works at the Transforming Bunbury’s Waterfront project; laying of foundations for a multi-purpose building on the Jetty Road causeway
The need for infrastructure procurement reform was seen as critical by Roads Australia, and in 2019 its members identified that, 'at the same time as a welcome boom in infrastructure investment was occurring, serious and major issues in the way transport projects are delivered needed to be remedied … if Australians are to get best value for money and best project outcomes for the investments being made'.
Alongside these concurrent procurement reform processes different Local Content initiatives were already underway across various Australian jurisdictions. For instance, in Western Australia, DPIRD’s LCAN focus is on all WA Government procurements in the state’s 9 RDC regions, inclusive of regional works, goods and services procurements. Whereas in Queensland, the Queensland Charter of Local Content applies to any Public Private Partnerships for projects and capital asset acquisitions with a Queensland Government capital value contribution of $5 million or greaterv.
In its study into transitioning regional economies, the Australian Government Productivity Commission noted, 'governments have a finite capacity to facilitate local growth, and … it is expensive and generally futile for governments to try to artificially create and maintain an advantage for a regional community where such an advantage does not inherently exist'vi. The Commission also noted that regional programs and projects have suffered from a lack of a regional focus in planning processes and inadequate data to support regional planning. The task therefore confronting policy and practice is to keep these particular challenges front
of mind when devising Local Content strategies for regional infrastructure programs and projects.
Irrespective of differing Local Content approaches, there are knowledge challenges across government in delivering effective Local Content interventions on infrastructure and works projects, mainly:
• The procurement of works and large infrastructure projects is generally regulated and implemented alongside the procurement of goods and services in spite of the processes and supplies involved being very differentvii, and
• Works projects typically cross numerous technical areas in both pre and post-tendering stages, with both elements delivered through specialist professionalsviii.
Further to this, there are 2 critical Local Content challenges specific to regional infrastructure and works programs and projects, being:
• regional business scale, sophistication, and capability is unlike that found in Australian capital cities
• regional SME access to the public procurement market, including the high fixed costs of access, i.e. regulation and prequalification costs, and the ‘bundling’ of contracts, which favours large firmsix .
With the challenges specific to regional infrastructure projects front of mind, the LCAN identified Transforming Bunbury’s Waterfront Stage 3 project as an ideal opportunity to address a deficit in the share of government contracting going to genuinely local South West Aboriginal SMEs.
Transforming Bunbury’s Waterfront Stage 3 works is a multi-agency project valued at $78.1 million led by the South West Development Commission in partnership with DevelopmentWA, the City of Bunbury, the Department of Transport, and the Southern Ports Authority. Project works include the construction of new breakwaters at Casuarina Boat Harbour and Koombana Bay, the establishment of hardstand areas and enabling infrastructure, as well as a site to develop an onshore boat stacking facility, and civil works to improve services, roads, landscaping, parking, and include upgrades to existing boat launching facilities, and new public amenities.
The key barriers to participation by South West local Aboriginal SMEs were identified as prequalifications and contract bundling. Through early intervention by the LCAN
and subsequent agreement with the WA Department of Transport's maritime division's procurement team, an opportunity to quarantine a package of work under Rule C4.21 (1) (b)xi was identified. The scope of works within the package meant prequalifications could be relaxed due to the value and complexity of the supply.
A list of invited South West based Registered Aboriginal Business tenderers was developed after local market sounding. The LCAN further worked to assist invited tenderers through referral to appropriate business support services and procurement processes.
In June 2023, it was announced that Koormal Contracting based in Davenport, Bunbury had been engaged through the project to construct the new ablutions block facilityxii. This was Koormal’s first time supply to the WA Department of Transport and its first supply to the WA Government for works valued over $250,000.
activities and engagements 2022–2023xiii
38 Regional business referrals to business support or funding assistance and information
Major regional projects valued at $9.4 billion pursued by LCAN for local supply opportunities
77
97 Market soundings with regional suppliers about upcoming supply opportunities
216 New potential regional suppliers to Government identified in 2022–2023
319 Meetings across the Network with regional suppliers and agencies about projects and procurements
Total supply opportunities valued at $2.2 billion across regional WA scanned by LCAN
402
Total contacts across the Network with government agencies, buyers, suppliers and stakeholders
3,317

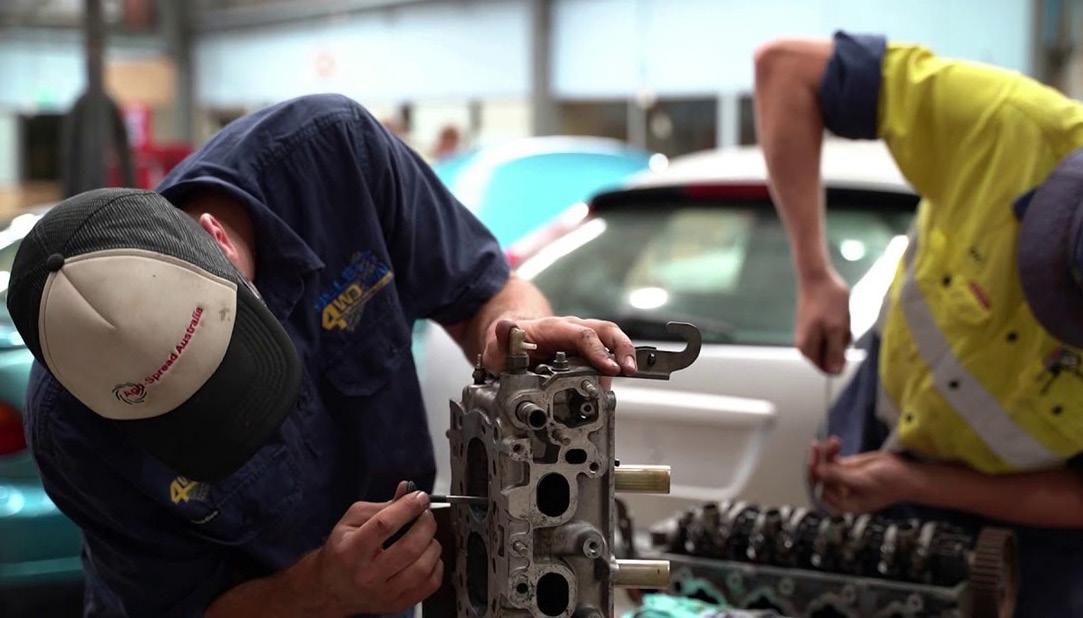
Students training at Central Regional TAFE (photo: CRTAFE WA)

LCAN’s collection of WA Government regional Local Content datasets commenced in 2017 to enable longitudinal analysis of supply trends and constraints. The progress chart below of Local Content on statewide, multi-region and single region contracts combined year-on-year since 1 July 2017 demonstrates a gradual
uplift in the proportion of local supply towards the end of the period.
The longitudinal data presented throughout this report covers the period 1 July 2017 to 30 June 2023.
Local Content on all statewide, multi-region and single-region supply contracts combined
Value of contracts

Local supplier outcomes by contract value ranges on combined Statewide, multi-region and single-region contracts.
Longitudunal local %
Local % in 2022–2023
The most significant uplifts in the value of local supply in 2022–2023 was among contracts valued between $1.5 and $25 million, with regional suppliers awarded $994.53 million in these ranges compared with the previous annual average of $416.66 million across these ranges, more than doubling the local supply value.
is located in all 9
of
and
area
Multi-region supply is located in 2 or more regions but is not statewide
The percentage of local supply on multi-region contracts by value decreased to 5.53% in 2022–2023. The value of local supply in 2022–2023 was $82.6 million compared with the longitudinal annual average of $83.8 million. There was a comparatively higher total value of multi-region contract spending in 2022–2023 of $1.49 billion, including a single $1.1 billion contract not awarded locally.
Value of all supply on multi-region contracts from 1 July 2017 $3.98 billion
Longitudinal local average from 1 July 2017 Local average in 2022–2023
Local supply on multi-region contracts year-on-year
Value of all local supply on multi-region contracts from 1 July 2017 $503 million
Local supply share of number of contracts from 1 July 2017
'Multi-region' data includes all multi-region contracts, including those from the Peel/Perth metro and Mid-West/Gascoyne combined regions.


The Gascoyne region spans 135,074 km2, and includes the Shires of Carnarvon, Exmouth, Shark Bay and Upper Gascoyne. The region is bordered by more than 600 kms of coastline. Aboriginal people have lived in the Gascoyne for tens of thousands of years. The Baiyungu, Malgana, Thadgari, Thalanyji and Yinggarda language groups have a central role in the ongoing care and management of the region’s natural assets. Carnarvon is the region’s largest town and is the major administrative and service hub. Smaller regional towns include Exmouth, Coral Bay, Denham and Gascoyne Junction. The region’s total population is 9,537, with 12% identifying as Aboriginal or Torres Strait Islander.
Gascoyne is strategically placed to support new mineral, resource and renewable industry projects. Exmouth and Carnarvon already play key roles in the resource sector supply chain, supporting offshore oil and gas in the Carnarvon Basin and high-value salt operations at Useless Loop and Lake MacLeod. Rare earths, gypsum, limestone, and other basic raw materials also present significant opportunities as part of the region’s resource base. The Gascoyne has some of the world’s best locations for wind and solar energy generation, with Carnarvon a globally recognised ‘hotspot’ for its potential to produce renewable hydrogen. The Gascoyne is strategically well-placed to deliver on the WA Government’s target to achieve 10% green hydrogen in the Dampier-Bunbury pipeline by 2030.
• Gascoyne suppliers recognised demand shortages in the region and have diversified to create a local supply
• Local suppliers have comprehensive understanding of supply and delivery timeframes to the region
• Local suppliers are acutely aware of buyer’s requirements and supply challenges not specified in scopes of work
• Local suppliers comprehend the tyranny of distance and schedule their works accordingly.
In 2022–2023 Gascoyne suppliers were successful in winning 100% of contracts valued between $250-500 k, up from the longitudinal average of 46%.
$1,759,913
Highest local contract awarded in region since 1 July 2017
Gascoyne suppliers have been most successful in winning contracts in the $500 k to $1.5 m value range and were awarded 79% of contracts in this range, valued at $8.09 m from 1 July 2017.
Unique suppliers in the region
964
businesses in region
Average Local Content
Gascoyne longitudinal local average from 1 July 2017
Gascoyne local average in 2022–2023 28% 57%
Local supplier contracts in 2022–2023 21
Number of all local supplier contracts from 1 July 2017 89
In 2022–2023 the Gascoyne’s annual supply increased to $4,936,325 exceeding the longitudinal annual supply average of $4,154,979 and increasing the local supply share to 57% of all supply.
Highest spending agencies in region
Value of local supplier contracts awarded from 1 July 2017 $24.92 million
Value of local supplier contracts awarded in 2022–2023 $4.94 million
Value of all contracts awarded in region from 1 July 2017 $90.09 million
Average Local Content is the total local supply value over the total value of all contracts awarded in the region in the same period.
Average Aboriginal business content
Value of local Aboriginal business contracts in region from 1 July 2017 $1.77 million
Value of all Aboriginal business contracts in region from 1 July 2017 $4.05 million
Value of all Aboriginal business contracts in region in 2022–2023 $1.59 million
Number all Aboriginal business contracts 2017–2023 21 15 Percentage of all Aboriginal business supply in the Gascoyne sourced from local Aboriginal businesses since 1 July 2017 44%
Average Aboriginal business supply is the value of all Aboriginal business supply over the total value of all contracts awarded in the region in the same period.
The Goldfields-Esperance region is home to 57,779 people. The 2 major regional centres are KalgoorlieBoulder and Esperance, with populations of approximately 30,000 and 15,000 respectively and both servicing the smaller communities in the surrounding LGAs.
With a total land area of 955,276 km2, including spans of the southern rangelands, the demand for road, rail, water, energy and telecommunications is high, which is reflected in the state government’s investment in the region. Kalgoorlie-Boulder and the greater Goldfields areas are dominated by significant mining activity and support service industries. These include precious and critical minerals such as gold, nickel, lithium and other resources.
The Outback Way represents the nation’s largest road project aiming to seal a 2,700 km stretch of road connecting Queensland with WA. In 2022, $678 million of federal and state funding was allocated to finalise the project which will significantly increase community and economic opportunities to the region. The region holds some of the world’s biggest gold reserves and significant lithium, nickel, cobalt and rare earth elements. Emerging industries in downstream processing are providing new opportunities for diversification. Demand is driven by clean energy transformation and net zero objectives, along with regional and remote health services through the establishment of the Curtin University Rural Health Campus.
• Goldfields-Esperance suppliers have in-depth knowledge, experience and working relationships locally
• Local suppliers have the ability to respond quickly with product or services solutions
• Local suppliers support the community through philanthropy because they live where they work
• Local suppliers invest in and develop and support the local workforce.
Goldfields-Esperance suppliers stepped up in the $1.5–5 m contract range and were awarded 16% more of the value in this contract range over the longitudinal average, totalling $11.12 m in contracts in 2022–2023.
Highest local contract awarded in region since 1 July 2017 $32,000,000
Goldfields-Esperance suppliers have been most successful in winning contracts in the $250-500 k value range and were awarded 58% of contracts in this range, totalling $18.97 m from 1 July 2017.
Unique suppliers in the region
4,317 total businesses in region
Average Local Content
Goldfields-Esperance longitudinal local average from 1 July 2017
Goldfields-Esperance local average in 2022–2023 26% 31%
In 2022–2023 Goldfields-Esperance annual supply was $34.13 m, exceeding the longitudinal annual supply average of $29.44 m and increasing the local supply share to 31% of all supply.
Main Roads WA Department of Communities Department of Finance $325.49 m $116.20 m $115.54 m
Value of local supplier contracts awarded in 2022–2023 $34.13 million Local supplier contracts in 2022–2023 21
Number of all local supplier contracts from 1 July 2017 359
Value of local supplier contracts awarded from 1 July 2017 $176.65
Value of all contracts awarded in region from 1 July 2017 $674.35 million
Average Local Content is the total local supply value over the total value of all contracts awarded in the region in the same period.
Average Aboriginal business content
Number all Aboriginal business contracts 2017–2023 21 101
Value of local Aboriginal business contracts in region from 1 July 2017 $74 million
Value of all Aboriginal business contracts in region from 1 July 2017 $99.21 million
Value of all Aboriginal business contracts in region in 2022–2023 $15.18 million
Percentage of all Aboriginal business supply in GoldfieldsEsperance sourced from local Aboriginal businesses since 1 July 2017 75%
Average Aboriginal business supply is the value of all Aboriginal business supply over the total value of all contracts awarded in the region in the same period.
The Great Southern region is made up of 11 local government authorities and covers 39,007 km2 with a population of 64,412. The major trading towns include Albany, Katanning, Mount Barker and Denmark. The key industries in the region are farming and agriculture, health care and social assistance and retail trade.
The region’s major supply chains include the Port of Albany and Albany airport, road and rail networks connecting the region. Geographic features include mountain ranges, forests, farmland and 250 km of coastland which attracts a diverse range of professionals to live and work within the region.
Independent consulting and coaching businesses are adding to our professional and health services sector. They are supporting the development of organisations, individuals and SMEs throughout the region that can provide services to government.
Growth in Aboriginal businesses, mainly in civil works, cleaning, gardening and maintenance suggests future opportunities for training, business development and investment in equipment. Most are in the beginning stages of suppling to the government by subcontracting, starting on small contracts and building positive relationships with buyers. The global decarbonisation transition is driving the development of the renewable energy sector and associated industries within the region.
• Great Southern suppliers have an active and engaged business development centre servicing the whole region
• Local suppliers are invested in building a positive brand reputation which leads to enhanced outcomes for buyers
• Local suppliers deliver development opportunities through traineeships for youth, disadvantaged and remote communities
• Local suppliers are highly accessible, with quicker response times and ability to pivot to meet contractual modifications.
$16,956,507
In 2022–2023 Great Southern suppliers broke the $10–25 m contract barrier and a local supplier was successful in winning the only contract in this range, valued at $16.96 m. 133
Highest local contract awarded in region since 1 July 2017
Great Southern suppliers have been most successful in winning contracts in the $500k-$1.5 m value range and were awarded 63% of contracts in this range, totalling $23.79 m from 1 July 2017.
Unique suppliers in the region
7,159 total businesses in region
Average Aboriginal business content
Average Aboriginal business supply is the value of all Aboriginal business supply over the total value of all contracts awarded in the region in the same period.
The Kimberley is fortunate to have a diverse economic base compared to many other regions, with key industries including mining, agriculture, pastoralism, tourism, arts and creative industries, and the caring and conservation sectors. There is also a continued focus on emerging businesses in regional towns to support the demand of strategic infrastructure projects such as road and bridge building, defence projects, and the mining industry.
A key driver in the region to reduce dependence on transient workers, improve town and community amenity, and unlock the full potential of projects is the opportunity to support the economic growth of Aboriginal business.
The Kimberley region has experienced a recent increase of sophisticated value chains across the region, including cotton production in the East Kimberley and the use of pearl shell as an input to the production of injectable bone implants by Broomebased Marine Biomedical. Pastoral stations are also diversifying their operations to branch into tourism, carbon abatement and caring for country activities to improve and supplement beef production. Other opportunities for growth and diversification include aquaculture; clean energy, carbon, and hydrogen economy projects; the Kimberley arts and creative industries; and the continued growth of regional civil and construction businesses.
• The Kimberley region has a diverse resident workforce with strong potential for increased engagement and productivity
• Local suppliers have knowledge of access requirements relating to weather events, infrastructure support, and cultural considerations
• The attendance of local suppliers in isolated regions support ongoing maintenance of projects and workplace synergies
• Local suppliers have knowledge of regional and specialist suppliers’ availability.
$97,195,756
Kimberley local suppliers have consistently won over 80% of contracts valued between $250–500 k and in 2022–2023 were awarded 85% of the value of contracts in this range.
Highest local contract awarded in region since 1 July 2017
Kimberley suppliers have been successful in winning contracts in the $5–10 m value range and been awarded 66% of contracts in this range, totalling $266.52 m from 1 July 2017.
Unique suppliers in the region
6,375 total businesses in region
Average Local Content
Kimberley longitudinal local average from 1 July 2017
Kimberley local average in 2022–2023 63%
Local supplier contracts in 2022–2023 21
Number of all local supplier contracts from 1 July 2017 895
Value of local supplier contracts awarded from 1 July 2017 $897.54 million
Kimberley data was a standout in 2019 with the highest value contract in the region going to a local Aboriginal business, sending the Local Content average up to 82% in that period.
Highest spending agencies in region
$682.87 m $212.29 m $199.53 m
Main Roads WA Department of Communities Western Australian Country Health Service (WACHS)
Value of local supplier contracts awarded in 2022–2023 $298.77 million
Value of all contracts awarded in region from 1 July 2017 $1.41 billion
Average Local Content is the total local supply value over the total value of all contracts awarded in the region in the same period
Average Aboriginal business content
Number all Aboriginal business contracts 2017–2023 21 447
Value of local Aboriginal business contracts in region from 1 July 2017 $494.47 million
Value of all Aboriginal business contracts in region from 1 July 2017 $565.53 million
Value of all Aboriginal business contracts in region in 2022–2023 $185.44 million
Percentage of all Aboriginal business supply in Kimberley sourced from local Aboriginal businesses since 1 July 2017 87%
Average Aboriginal Business supply is the value of all Aboriginal Business supply over the total value of all contracts awarded in the region in the same period.
The Mid West Region comprises 16 local government areas divided into 3 subregions: Batavia Coast, Murchison and North Midlands. Geraldton hosts over 73% of its population of 57,000 and approximately 9% identify as Aboriginal or Torres Strait Islander. Traditionally, agriculture and fishing dominated, however mining is now the largest industry, with construction, manufacturing, logistics, and tourism also well represented. Alongside conventional gas, renewable energy projects, rare earth and critical mineral mining are further diversifying the economy.
The Mid West region is witnessing the emergence of several new industries with significant potential to fulfill government demand for works, good and services. These include worldclass renewable energy assets which are attracting global scale clean energy projects; internationally significant space projects including the Murchison Radio-astronomy Observatory; the establishment of a vanadium processing facility and rare earth refinery supports various critical industries and technologies such as batteries, EVs and advanced electronics; and unique natural assets, such as Kalbarri National Park and Abrolhos islands, attract global tourism markets.
• Mid West suppliers are in close proximity to key resources for streamlined supply chain management
• Local suppliers provide customised offerings that meet evolving demands of the regional market
• Local suppliers have the entrepreneurial spirit that drives agile responses to market demands and opportunities
• Local suppliers have strong community ties, enabling personalised customer service and sustainable partnerships.
$60,128,516
In 2022–2023 Mid West local suppliers won all contracts in the $250–500 k range valued at $4.64 m, up from the Mid West longitudinal average of 59% in this contract range.
Highest local contract awarded in region since 1 July 2017
Mid West suppliers have been most successful in winning contracts in the $500 k to $1.5 m value range and were awarded 68% of contracts in this range, valued at $24.54 m from 1 July 2017.
Unique suppliers in the region
4,819 total businesses in region
Average Local Content
Mid West longitudinal local average from 1 July 2017 Mid West local average in 2022–2023
In January 2020 the contract for Specialist Clinical Services to WACHS Mid West valued at $60.13 m to was awarded locally, raising all Mid West averages and contract range performance levels in the above $50 m contract range.
Average Local Content is the total local supply value over the total value of all contracts awarded in the region in the same period.
Average Aboriginal business content
Number all Aboriginal business contracts 2017–2023 21 95
Value of local Aboriginal business contracts in region from 1 July 2017 $37.06 million
Value of all Aboriginal business contracts in region from 1 July 2017 $42.88 million
Value of all Aboriginal business contracts in region in 2022–2023 $2.56 million
Percentage of all Aboriginal business supply in the Mid West sourced from local Aboriginal businesses since 1 July 2017 86%
Average Aboriginal business supply is the value of all Aboriginal business supply over the total value of all contracts awarded in the region in the same period.
The Peel region is a progressive, prosperous and dynamic region. Its proximity to Perth and the South West present opportunities to deliver on the state’s plans for urban and peri-urban growth and economic development. The region has a population-driven economy, with a population of 146,486 across 5 local government areas. Peel’s landscape is varied and is made up of urban, agricultural and horticultural land, a forested escarpment and 50 km of coastline. Peel will play a key role in the growth of the Perth metropolitan region presenting opportunities for expanding and deepening business and commerce and creating new markets.
The Peel region’s minerals sector produces alumina, gold, copper and mineral sands. The region’s manufacturing and engineering industries are expanding and include emerging EV manufacturing. There is strong coordination with the Perth and Peel Hydrogen Technology Cluster in investigating the opportunity to develop a hydrogen innovation precinct. The region specialises in hospitality and culinary training and the region’s Food Innovation Precinct WA allows for research and development into intensive food production and agri innovation.
• Peel suppliers are in close proximity to Perth and the South West region, enabling opportunity for expansion across the tourism, residential, commercial and industrial sectors
• The Peel region has well-developed transport systems and access to available commercial/industrial land
• Local suppliers have an existing innovative manufacturing industry
• Local suppliers have access to a diverse range of renewable energy opportunities situated close to major customers and existing infrastructure.
$41,835,384
Peel suppliers lifted their share of value of supply in the $500k–$1.5 m contract range from a longitudinal average of 18% to 75% in 2022–2023.
Highest local contract awarded in region since 1 July 2017
A Peel-based supplier was successful in winning a $41.84 m contract through the Department of Justice in 2017, equating to 61% of the total supply in that year. Peel suppliers were successful in winning 36% of the value of contracts ranged between $250-500 k, equating to $4.46 m.
Unique suppliers in the region
7,473 total businesses in region
Average Local Content
Local supplier contracts in 2022–2023
Peel longitudinal local average from 1 July 2017
Peel local average in 2022–2023
Peel Local Content data is comprised of contracts where supply is located only in the Peel region. A majority of Peel supply is delivered through multi-region contracts combined with the Perth metro. Peel has increased its local supply in 2022-2023 compared against its local supply percentage between 2018-19 and 2021–2022. Number of all local supplier contracts from 1 July 2017
Highest spending agencies in region
Value of local supplier contracts awarded from 1 July 2017
Value of local supplier contracts awarded in 2022–2023
Value of all contracts awarded in region from 1 July 2017 $297.77
Average Local Content is the total local supply value over the total value of all contracts awarded in the region in the same period.
Average Aboriginal business content
Aboriginal business supply longitudinal average from 1 July 2017
Aboriginal business supply average 2022–2023
Aboriginal business supply value year-on-year
21 14
Number all Aboriginal business contracts 2017–2023
Value of local Aboriginal business contracts in region from 1 July 2017 $744.6 thousand
Value of all Aboriginal business contracts in region from 1 July 2017 $1.86 million
Value of all Aboriginal business contracts in region in 2022–2023 $499.3 thousand
Percentage of all Aboriginal business supply in Peel sourced from local Aboriginal businesses since 1 July 2017 40%
Average Aboriginal business supply is the value of all Aboriginal business supply over the total value of all contracts awarded in the region in the same period.
The Pilbara is a vast region, covering 506,770 km2 across 4 local government authorities. A young and diverse population of 58,900 calls the Pilbara home.
The Pilbara has 3 major port trading towns in Karratha, Port Hedland and Onslow, exporting one third of the nation’s exports. The inland towns of Newman, Tom Price and Paraburdoo are linked to major mining operations, with a significant majority of regional businesses providing services directly to the extractive resource industry.
The establishment of direct sea freight in 2020/21 from Singapore reduced import and freight costs and opened new export opportunities for local businesses.
The Pilbara has a thriving SME sector with 5 chambers of commerce and a newly formed Pilbara Aboriginal Business and Industry Association. The state government commitment to supporting green energy, downstream processing and land restoration projects will continue to provide new opportunities for local SMEs, including Aboriginal businesses and Traditional Owner groups. This has led to a positive trend in business partnerships and joint ventures with Aboriginal businesses. Economic growth within the region has also seen the establishment of local manufacturing and technical expertise in support of the resources sector, providing increased employment and contract opportunities for SMEs.
• Local suppliers understand the real costs of doing business in the Pilbara and factors such as environment, isolation and distance
• The Pilbara region has established Aboriginal businesses with direct links to Traditional Owners
• Local suppliers have increased capabilities and technical skills to support local manufacturing
• Agility and adaption to local circumstances.
$41,970,188
In 2022–2023 Pilbara local suppliers won 100% of contracts in the $5–10 m value range, lifting their supply in this category from the longitudinal average of 33%.
Highest local contract awarded in region since 1 July 2017
Pilbara suppliers have been most successful in winning contracts in the $1.5–5 m value range and were awarded 57% of contracts in this range, totalling $72.84 m from 1 July 2017.
Unique suppliers in the region
Number of businesses by annual turnover
10,235 total businesses in region
Local supplier contracts in 2022–2023
Pilbara longitudinal local average from 1 July 2017
Pilbara local average in 2022–2023
Pilbara suppliers increased their share of the value supply by 4% on contracts under $500 k, going from 48% over the longitudinal period to 52% in 2022–2023. In total, Pilbara suppliers have delivered $55.59 m in contracts valued under $500 k from 2017 to 2023. Number of all local supplier contracts from 1 July 2017
Highest spending agencies in region Main Roads WA Department of Finance Department of Communities $628.17 m $326.03 m $88.75 m
Value of local supplier contracts awarded from 1 July 2017
Value of local supplier contracts awarded in 2022–2023 $45.54
Value of all contracts awarded in region from 1 July 2017 $1.23
Average Local Content is the total local supply value over the total value of all contracts awarded in the region in the same period.
Average Aboriginal business content
all Aboriginal business contracts 2017–2023 21 207
Average Aboriginal business supply is the value of all Aboriginal business supply over the total value of all contracts awarded in the region in the same period. Value of local Aboriginal business contracts in region from 1 July 2017 $95.55
Value of all Aboriginal business contracts in region from 1 July 2017 $113.08
Value of all Aboriginal business contracts in region in 2022–2023 $26.13
The region’s major towns include Bunbury, the region's economic hub; Busselton, with its growing tourism sector; Margaret River, renowned for premium wine production and Manjimup, one of the state’s most significant horticultural precincts. Supply chains are reinforced by the Bunbury Port, facilitating trade, and extensive road and rail networks linking to Perth and beyond. Busselton Margaret River Airport links the region to Sydney and Melbourne plus services the FIFO mining sector.
Advanced manufacturing, critical minerals processing and renewable energy are among the South West’s emerging industries. The region’s established foothold in the manufacturing sector serves as the foundation to take advantage of opportunities to develop innovative new products for the mining, minerals processing and renewable energy sectors. With a surge in global demand for electric vehicles and energy storage, the South West's abundance of lithium and other minerals crucial for battery components positions it as a strategic player in this expanding market. The transition of Collie’s economy away from the coal-fired power sector is presenting further diversification opportunities in these sectors.
• The South West region has a comprehensive range of contractor capabilities and suppliers to support a broad range of industry sectors
• Local suppliers are in close proximity to unique resources enabling optimisation of sustainable supply chains
• Local suppliers are committed to the development of local workforce and training support, enhancing skill levels within the region
• Sophistication of processes through integration of innovation and technology advancements.
$37,531,500
In 2022–2023 South West suppliers moved forward in the $5–10 m contract value range and supplied all contracts in this category, valued at $19.05 m.
Highest local contract awarded in region since 1 July 2017
South West suppliers have demonstrated capability and capacity across all contract ranges and consistently delivered high Local Content percentages across all ranges between 2017 and 2023.
Unique suppliers in the region
16,288 total businesses in region
Average Local Content
South West longitudinal local average from 1 July 2017 South West local average in 2022–2023
South West Local Content data includes approximately $420 m in subcontracting works delivered through the Bunbury Outer Ring Road (BORR) project for the reporting period, replacing the BORR head contract award of $1.28 b as a statistical outlier.
Average Local Content is the total local supply value over the total value of all contracts awarded in the region in the same period.
Average Aboriginal business content
Number all Aboriginal business contracts 2017–2023 21 65 Percentage of all Aboriginal business supply in the South West sourced from local Aboriginal businesses since 1 July 2017 53%
Value of all Aboriginal business contracts in region from 1 July 2017 $40.76 million
Value of all Aboriginal business contracts in region in 2022–2023 $20.76 million
Average Aboriginal business supply is the value of all Aboriginal business supply over the total value of all contracts awarded in the region in the same period. Value of local Aboriginal business contracts in region from 1 July 2017 $21.55 million
The Wheatbelt is the third most populous region in the state with a resident population of 72,924, highly dispersed over 42 local government areas covering 154,862 km2. The Wheatbelt is divided into 5 subregions: Avon, Central Coast, Central East, Central Midlands and the Wheatbelt South, each serviced by a sub-regional centre – Northam, Jurien Bay, Merredin, Moora and Narrogin respectively.
The Wheatbelt is experiencing unprecedented investment with a $10 billion pipeline of regional initiatives across agriculture, renewable energy, green minerals, decarbonisation and urban development. The Wheatbelt is a key contributor to WA’s low carbon energy transition with an existing contribution of 1000 megawatts (MW) of renewable energy output and an additional 8000 MW planned over the next decade.
The Wheatbelt’s construction and manufacturing sectors service a range of national and international customers through the manufacturing of modular housing, transport infrastructure, defence material and agricultural and mining equipment. The Wheatbelt's economy is underpinned by a strong SME sector with more than 9,300 SMEs (more per capita than any other region) and 18% growth over the past 5 years.
• Local suppliers have in-depth knowledge, experience and local working relationships with industry sectors
• Local suppliers are spread across the region
• Local suppliers support the local economy and workforce
• Local suppliers develop creative solutions tailored to regional industry and government requirements.
$7,204,067
The largest uplift in Wheatbelt supply was in the $500 k–1.5 m contract value range, lifting to 41% and gaining 10% over the longitudinal average, with contracts in the range in 2022–2023 valued at $10.05 m.
Highest local contract awarded in region since 1 July 2017
Wheatbelt suppliers have been most successful in winning contracts in the $50–250 k value range and have been awarded 34% of contracts in this range, valued at $17.28 m from 1 July 2017.
Unique suppliers in the region
9,590 total businesses in region
Average Local Content
Wheatbelt longitudinal local average from 1 July 2017 Wheatbelt local average in 2022–2023
Local Content in the Wheatbelt has lifted overall, with annual supply in 2022–2023 increasing to $19.17 m and exceeding the longitudinal annual supply average of $10.56 m.
of local supplier contracts awarded in 2022–2023
Average Local Content is the total local supply value over the total value of all contracts awarded in the region in the same period. Highest spending agencies in region
of all contracts awarded in region from 1 July 2017
Average Aboriginal business content
Number all Aboriginal business contracts 2017–2023 21 51
of local Aboriginal business contracts in region from 1 July 2017 $3.89
Value of all Aboriginal business contracts in region from 1 July 2017 $52.93
Value of all Aboriginal business contracts in region in 2022–2023 $45.56
Average Aboriginal business supply is the value of all Aboriginal business supply over the total value of all contracts awarded in the region in the same period.

[i] Wells, J. and Hawkins, J., Proceedings of the Institution of Civil Engineers Management, Procurement and Law 163, Increasing ‘local content’ in infrastructure procurement - Part 1, May 2010 Issue MP2, Figure 1. Stages of the procurement cycle, p. 66.
[ii] Warner, M, Local content in procurement: Creating local jobs and competitive domestic industries in supply chains, Introduction, Taylor & Francis, 2011, see page 8.
[iii] FINAL Explanatory Memorandum Procurement Bill 2020, Parliament of WA, at chrome-extension://efaidnbmnnnibpcajpcglclefind mkaj/https://www.parliament.wa.gov.au/Parliament/Bills.nsf/30A7C990E475645A48258567000C029B/$File/FINAL%2BEM%2B%2BProcurment%2BBill%2B2020.pdf, accessed 25 March 2024, see page 9.
[iv] Procurement Reform Report: Recommendations & Strategies, Roads Australia, September 2020, see page 9.
[v] Queensland Charter for Local Content, Office of State Development and Infrastructure, Queensland Government, at statedevelopment.qld.gov. au/industry/industry-support/qld-charter-for-local-content, last updated 27 February 2024, accessed 26 March 2024, see page 10.
[vi] Transitioning Regional Economies, Productivity Commission Study Report, Australian Government, December 2017, Part 5: Strategies for successful transition and development, see page 10.
[vii] Wells, J. and Hawkins, ibid., see page 10.
[viii] Wells, J. and Hawkins, J., Proceedings of the Institution of Civil Engineers Management, Procurement and Law 163, Increasing ‘local content’ in infrastructure procurement - Part 1, May 2010 Issue MP2, see page 10.
[ix] Wells and Hawkins, ibid, see page 10.
[x] Building for Tomorrow, Transforming Bunbury’s Waterfront, Casuarina Boat Harbour upgrades, image courtesy of buildingfortomorrow.wa.gov. au/projects/transforming-bunburys-waterfront/ see page 9.
[xi] Western Australian Procurement Rules, Procurement Direction 2021/02, Effective date June 2021, WA Department of Finance, Rule C4.2: Exceptions to Procurement Methods: (1) The minimum competitive requirements in Rule C4.1 does not apply when: (a) purchasing from a Common Use Arrangement or a State agency led Standing Offer in accordance with the Buying Rules; (b) purchasing from a Registered Aboriginal Business or Australian Disability Enterprise, see page 11.
[xii] Isabel Vieira, Business News, Local Contractors win on $78m Bunbury project, 28 June 2023, at businessnews.com.au/article/Localcontractors-win-on-78m-Bunbury-project , see page 11.
[xiii] LCAN activity and engagement data presented excludes any data for the BORR dedicated Local Content Adviser, which is reported through the MRWA and BORR Alliance, see page 12.
[xiv] Australian Bureau of Statistics (ABS), Data by Region, Region Summary: Gascoyne, Region Code: 51102, Statistical Area Level 3, at https:// dbr.abs.gov.au/region.html?lyr=sa3&rgn=51102, CABEE(s) 42,43,44,45,46 & 47, Number of businesses by turnover – at 30 June 2022, accessed 12 April 2024, see page 25.
[xv] Australian Bureau of Statistics (ABS), Data by Region, Region Summary: Goldfields, Region Code: 51102, Statistical Area Level 3, at https:// dbr.abs.gov.au/region.html?lyr=sa3&rgn=51103, Note: combined with Data by Region, Region Summary: Esperance, Region Code: 51101, Statistical Area Level 3, at https://dbr.abs.gov.au/region.html?lyr=sa3&rgn=51101, CABEE(s) 42,43,44,45,46 & 47, Number of businesses by turnover – at 30 June 2022, accessed 12 April 2024, see page 29.
[xvi] Australian Bureau of Statistics (ABS), Data by Region, Region Summary: Albany, Region Code: 50901, Statistical Area Level 3, at https://dbr. abs.gov.au/region.html?lyr=sa3&rgn=50901, CABEE(s) 42,43,44,45,46 & 47, Number of businesses by turnover – at 30 June 2022, accessed 12 April 2024, see page 33.
[xvii] Australian Bureau of Statistics (ABS), Data by Region, Region Summary: Kimberley, Region Code: 51001, Statistical Area Level 3, at https:// dbr.abs.gov.au/region.html?lyr=sa3&rgn=51001, CABEE(s) 42,43,44,45,46 & 47, Number of businesses by turnover – at 30 June 2022, accessed 12 April 2024, see page 37.
[xviii] Australian Bureau of Statistics (ABS), Data by Region, Region Summary: Mid West, Region Code: 51104, Statistical Area Level 3, at https:// dbr.abs.gov.au/region.html?lyr=sa3&rgn=51104, CABEE(s) 42,43,44,45,46 & 47, Number of businesses by turnover – at 30 June 2022, accessed 12 April 2024, see page 41.
[xix] Australian Bureau of Statistics (ABS), Data by Region, Region Summary: Mandurah, Region Code: 50201, Statistical Area Level 3, at https:// dbr.abs.gov.au/region.html?lyr=sa3&rgn=50201, Note: combined with Data by Region, Region Summary: Serpentine-Jarrahdale, Region Code: 57700, Local Government Area (LGA), at https://dbr.abs.gov.au/region.html?lyr=lga&rgn=57700 and Data by Region, Region Summary: Waroona, Region Code: 58820, Local Government Area (LGA), at https://dbr.abs.gov.au/region.html?lyr=lga&rgn=58820, CABEE(s) 42,43,44,45,46 & 47, Number of businesses by turnover – at 30 June 2022, accessed 12 April 2024, see page 45.
[xx] Australian Bureau of Statistics (ABS), Data by Region, Region Summary: West Pilbara, Region Code: 51003, Statistical Area Level 3, at https://dbr.abs.gov.au/region.html?lyr=sa3&rgn=51003, Note: combined with Data by Region, Region Summary: East Pilbara, Region Code: 51002, Statistical Area Level 3, at https://dbr.abs.gov.au/region.html?lyr=sa3&rgn=51002, CABEE(s) 42,43,44,45,46 & 47, Number of businesses by turnover – at 30 June 2022, accessed 12 April 2024, see page 49.
[xxi] Australian Bureau of Statistics (ABS), Data by Region, Region Summary: Bunbury, Region Code: 50102, Statistical Area Level 3, at https://dbr. abs.gov.au/region.html?lyr=sa3&rgn=50102, Note: combined with Data by Region, Region Summary: Augusta – Margaret River - Busselton, Region Code: 50101, Statistical Area Level 3, at https://dbr.abs.gov.au/region.html?lyr=sa3&rgn=50101 and Data by Region, Region Summary: Manjimup, Region Code: 50103, Statistical Area Level 3, at https://dbr.abs.gov.au/region.html?lyr=sa3&rgn=50103, and removal of Data by Region, Region Summary: Waroona, Region Code: 58820, Local Government Area (LGA), ibid., CABEE(s) 42,43,44,45,46 & 47, Number of businesses by turnover – at 30 June 2022, all accessed 12 April 2024, see page 53.
[xxii] Australian Bureau of Statistics (ABS), Data by Region, Region Summary: Wheat Belt - North, Region Code: 50902, Statistical Area Level 3, at https://dbr.abs.gov.au/region.html?lyr=sa3&rgn=50902, Note: combined with Data by Region, Region Summary: Wheat Belt - South, Region Code: 50903, Statistical Area Level 3, at https://dbr.abs.gov.au/region.html?lyr=sa3&rgn=50903, CABEE(s) 42,43,44,45,46 & 47, Number of businesses by turnover – at 30 June 2022, accessed 12 April 2024, see page 57.
Peel Business Park Nambeelup
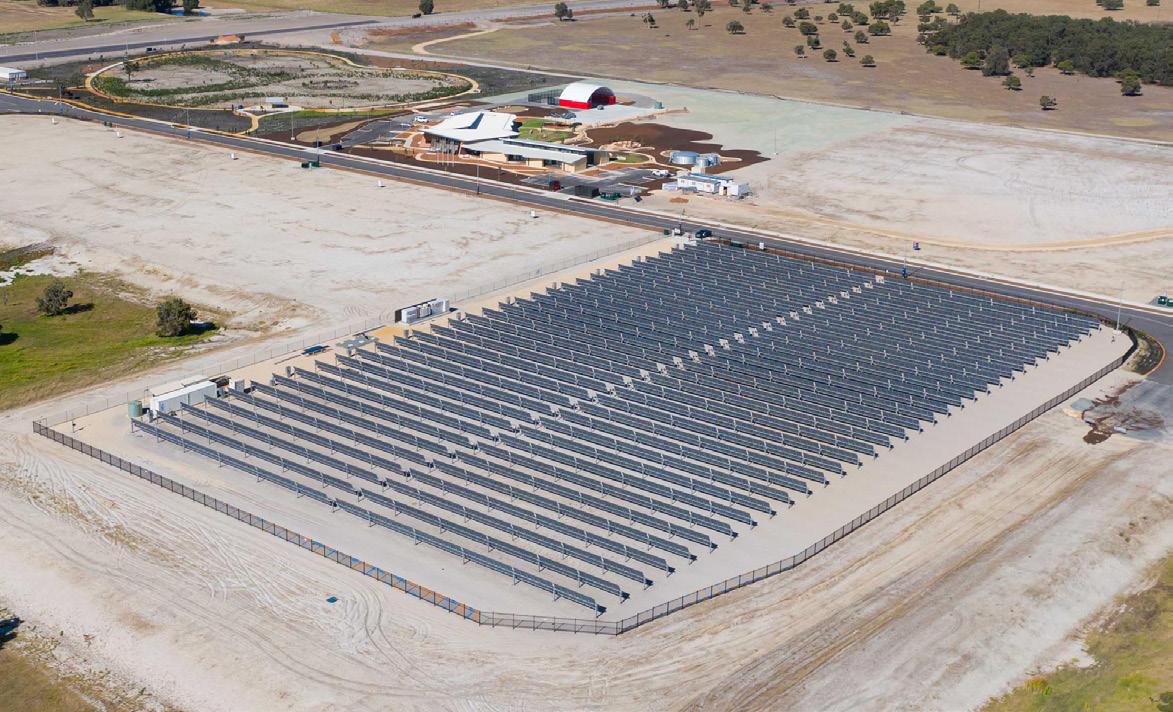
Kaadajan solar installation
aerial view, Peel region (photo: DevelopmentWA)

Point Moore Lighthouse in Geraldton, Mid West region (photo: Tourism Western Australia)
Longitudinal data in this report spans the period 1 July 2017 to 30 June 2023 and collects and compares the same datasets covering multiple Local Content variables on a financial year basis.
An awarded contract where the location of the delivery point of supply is within 2 or more Regional Development Commission (RDC) regions and/or the Perth metropolitan region but is not a statewide contract.
An awarded contract where the location of the delivery point is limited to one of the RDC regions.
An awarded contract where the location of the delivery point of supply is within all 9 RDC regions plus the Perth metropolitan region.
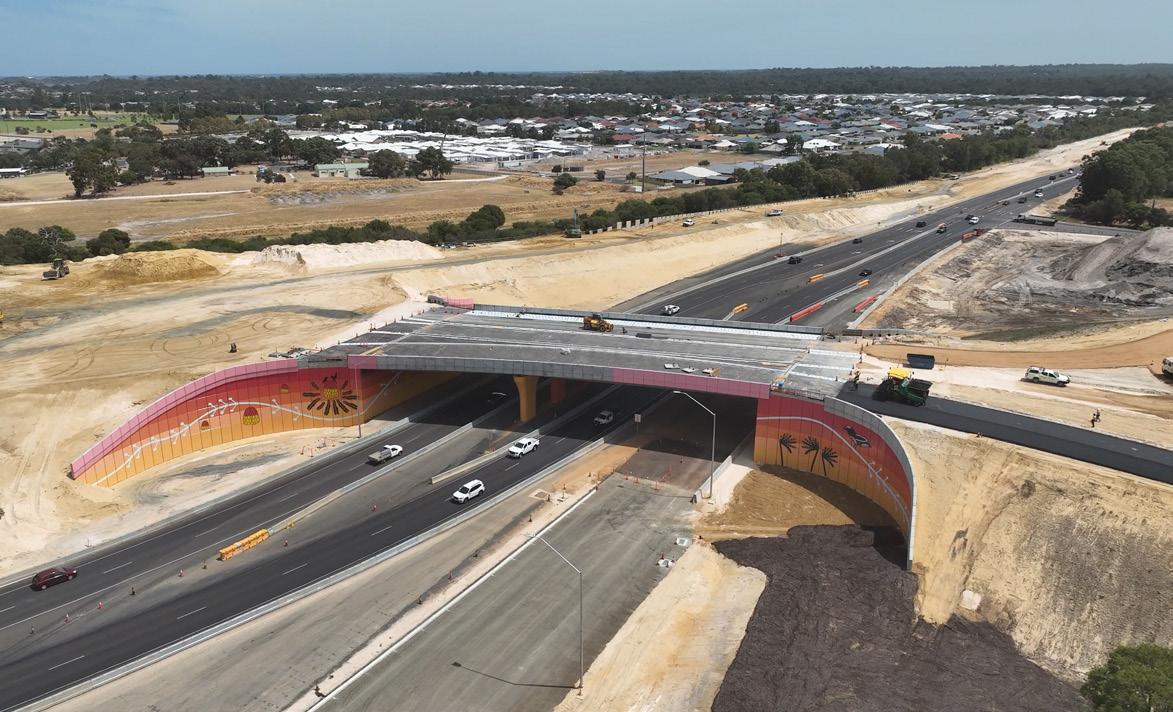
Bunbury Outer Ring Road construction, Raymond Road interchange, South West region (photo: Main Roads WA)
• Tenders WA is the primary source of contract award data for this report and is subject to agencies entering information in a timely and accurate manner
• Individual agencies are responsible for submitting Tenders WA data, and Department of Finance therefore does not guarantee the completeness and accuracy of that data
• Contract award data presented in this report may change if records in Tenders WA are added and/or amended
• Tenders WA data refers to awarded contract information and may not include any contract extension beyond term or subsequent variation information
• Strategic Forward Procurement Planning (SFPP) data is not definitive and is subject to change, as it relates to state agencies’ anticipated procurements at the time of the SFPP submission.
• Local Content metrics presented in this report exclude contract award details from Government Trading Enterprises (GTEs)
• Local Content metrics presented in this report exclude any spending reported through Western Australian Industry Participation Strategy (WAIPS) plans or reports
The Chief Executive Officer of the Department of Primary Industries and Regional Development and the State of Western Australia accept no liability whatsoever by reason of negligence or otherwise arising from the use or release of this information or any part of it.
Copyright © State of Western Australia (Department of Primary Industries and Regional Development) 2024