

Marin County Real Estate May 2023 Report

The specifics for Marin County will be covered in great detail within this report. But looking at the overall Bay Area, buyer demand has continued to rebound from its late 2022 nadir. Though mortgage applications are still well down year over year, many buyers have accepted higher interest rates as the new normal and decided to move forward – and rates have recently been trending downward. A significant minority of buyers are paying all-cash. Open houses are seeing increased traffic, more listings are selling, and selling more quickly with multiple offers. Median sales prices have generally ticked up in 2023, though still down across the Bay Area from the market peak seen last spring. The magnitude of these declines varies widely between counties, and prices in the vast majority remain much higher than before the pandemic.
Even with the increase in demand, sales activity remains far below last spring due to a number of economic and supply constraints. While increasing from mid-winter lows – with some very big sales occurring – luxury home sales have generally seen even larger declines as compared to the peak of the pandemic boom, when sales volumes often hit spectacular new highs.
The number of new listings has also dropped dramatically from historic norms. This is mostly ascribed to the "mortgage lock-in effect," i.e. owners with very low, long-term, fixedrate mortgages are reluctant to sell to then buy at much higher prevailing rates. This decline in new listings has major ramifications for supply and demand dynamics, and increases pressure on prices even in a reduced activity environment.
Some uncertainty clearly continues with inflation, interest rates, stock markets, bank crises, hightech layoffs, and now, as of early May, federal debt-limit negotiations. But, so far, the 2023 housing market has generally been steadily moving in a positive direction.
Report created in good faith with data from sources deemed reliable, but may contain errors and subject to revision. Please see notes at end of report.
Over the past 40 years alone, the San Francisco Bay Area has seen 4 major upcycles or housing booms. In each, there have been enthusiasts who argued that this time the boom times would never end – but each ended, typically after hitting a final peak of what economists call “irrational exuberance.” Upcycles were followed by market corrections or down-cycles, during which many predicted (often gleefully) that the Bay Area was on an endless downward spiral – but recoveries followed. Housing and financial markets have always run in cycles, both economic and psychological, but, so far, since the days of the Gold Rush, despite all its booms and busts, the Bay Area has always rebounded once more.
The Bay Area is one of the world’s great metropolitan areas – as a financial and cultural center; in the spectacular beauty of its setting and surrounding open space; as a hothouse of innovation; in its diversity, openness and opportunity – and despite its current round of challenges, we expect it will continue to be so for a long time to come.
 Photo from European Space Agency, Create Commons License
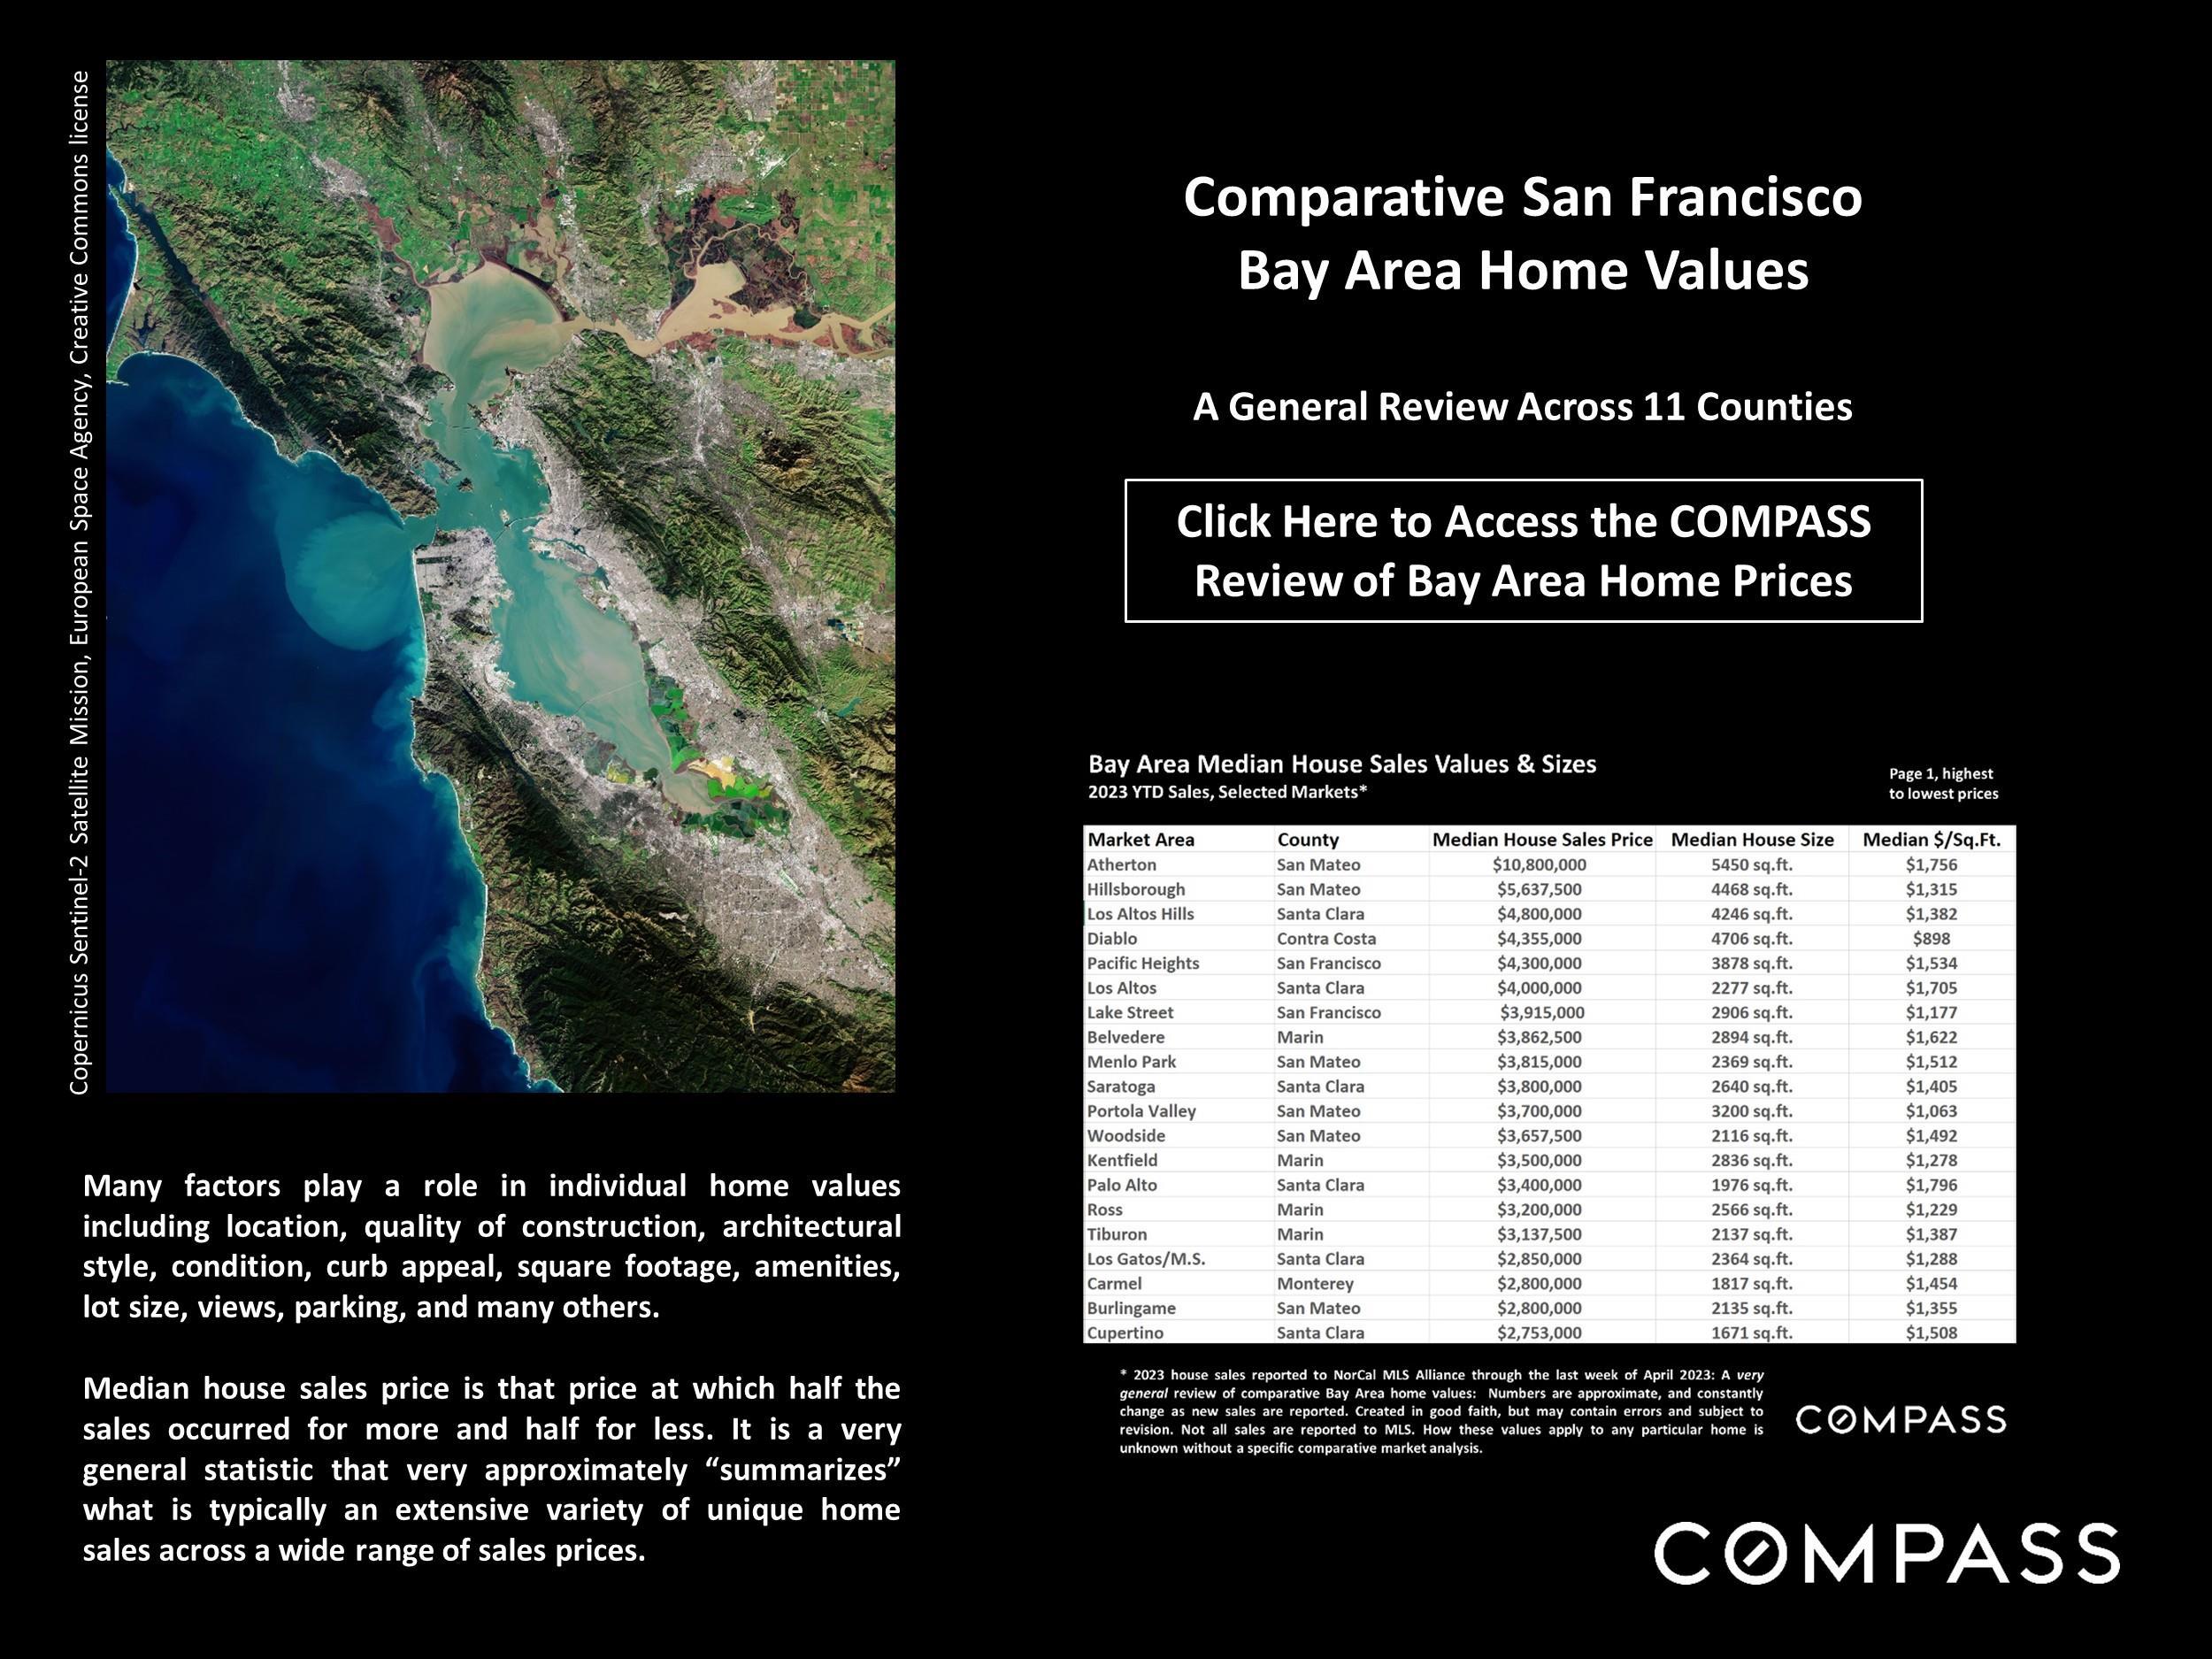
Median sales price is that price at which half the sales occurred for more and half for less. It is a very general statistic, disguising an enormous range of sales prices in the underlying sales. It is often affected by other factors besides changes in fair market value. Monthly and seasonal fluctuations are common, which explain many of the regular ups and downs in this chart. Longer-term trends are much more meaningful than short-term changes.
Year over year, the 3-month rolling, median house sales price in April 2023, $1,675,000, was down about 14%, but has been climbing in recent months.
2007-08


3-month rolling average of monthly median sales prices for “existing” houses, per CA Association of Realtors or NorCal MLS Alliance. 2-period moving trend line. Analysis may contain errors and subject to revision. All numbers approximate, and may change with late-reported sales.
Updated through April 2023
Comparing the 3-month-rolling median house sales price in April 2023 with the same period of 2022, 2020, 2016 and 2013 to calculate the short-term (year-over-year), as well as longerterm appreciation rates.
Median sales prices can be affected by a variety of factors other than changes in fair market value, as can year-over-year appreciation rates. How these rates apply to any particular property is unknown without a specific comparative market analysis.
1-Year Change 2022 to 2023
Since 2022
Since 2020
Since 2016
Since 2013
As a point of comparison, the national median house price is up 69% since 2013.
*3-month rolling sales reported to NorCal MLS Alliance by early May 2023, per Infosparks. Data from sources deemed reliable, but may contain errors and subject to revision. Percentages rounded to nearest full point. All numbers approximate, and may change with late-reported sales.
Sales in 1 month mostly reflect market dynamics in the previous month. Seasonal ebbs and flows are typical.
The percentage of home sales over list price continues to climb since hitting its mid-winter low.
Sales data reported to NORCAL MLS® ALLIANCE, per Infosparks. Reflecting the percentage of sales closing at sales prices over the final list prices. Data from sources deemed reliable, but may contain errors and subject to revision. All numbers are approximate, and may change with late-reported sales.
100% = an average sales price at original list price. 110% = an average sales price 10% over asking price; 94% = 6% below asking price.
This statistic is a lagging indicator of market activity 3-6 weeks earlier. It typically ebbs and flows per seasonal trends, but also affected by specific market dynamics.
Pandemic hits
Sales of houses, condos, townhouses reported to NorCal MLS Alliance, per Infosparks. Data derived from sources deemed reliable, but may contain errors and subject to revision. All numbers approximate, and may change with late-reported sales.
Some of these markets had relatively few sales in the period, which makes median sales prices more prone to anomalous fluctuation.
Median sales price is that price where half the homes sold for more and half for less. It is a very general statistic that typically disguises a wide range of prices in the underlying sales. Many factors play a role in home values, and how these prices apply to any particular home is unknown without a specific comparative market analysis.
This chart applies to house sales. The median condo sales price was $730,000, and the median townhouse price, $829,000.
* 2023 house sales reported to NorCal MLS Alliance through late April 2023. Data derived from sources deemed reliable, but may contain errors and subject to revision. All numbers approximate.
West Marin includes Bolinas, Inverness, Pt. Reyes Station, Tomales, Dillon Beach and Nicasio.
* 2023 house sales reported to NorCal MLS Alliance through late April 2023. Data derived from sources deemed reliable, but may contain errors and subject to revision. Not all sales are reported to MLS, and new sales are reported on a daily basis. These prices may change with late-reported sales. All numbers are approximate.
This chart pertains to house sales only. There were also 114 condo sales and 47 townhouse sales in the county during the period.
Condo and townhouse sales made up approx. 29% of Marin home sales.
*2023 sales reported to NorCal MLS Alliance through late April 2023. Data based upon sources deemed reliable, but may contain errors and subject to revision. All numbers approximate and may change with late reports sales.
Median Dollar per Square Foot – 2023 YTD Sales*
Some of these markets had relatively few sales in the period, which makes median sales values more prone to anomalous fluctuation.
Only
Dollar per Square Foot is calculated on interior living space and doesn’t include garages, attics, basements, rooms built without permit, decks, patios or lot size (though all these can add value). All things being equal, a smaller home will sell for a higher dollar per sq.ft. than a larger one.
The median $/sq.ft. value for Marin condos was $611, and for townhouses, $565.
* 2023 sales reported to MLS through late April 2023. Data derived from sources deemed reliable, but may contain errors and subject to revision. All numbers approximate and may change with late-reported sales.
Some communities see relatively few sales, which can cause their median house sizes (and values) to fluctuate significantly, period to period.
Home sizes vary widely within and between markets.
West Marin includes Bolinas, Inverness, Pt. Reyes Station, Dillon Beach and Nicasio.
* 2023 house sales reported to NorCal MLS Alliance through late April 2023. Data derived from sources deemed reliable, but may contain errors and subject to revision. All numbers approximate and may change with late-reported sales.

The new listing count, though climbing, remains well below historic norms. (April 2020 was affected by the pandemic hitting).
The number of new listings coming on market ebbs and flows by seasonal trends, though it can be affected by specific market dynamics.
June 2019
April columns highlighted for year-over-year comparisons
A snapshot measure of how many active listings can be expected on any given day of the specified month.
Summer-Fall 2020
Summer-Fall 2021
Oct. 2022
The number of active listings on market on a given day is affected by 1) how many new listings come on market, 2) how quickly buyers purchase them, 3) the sustained heat of the market over time, and 4) sellers pulling their homes off the market without selling. The number typically ebbs and flows by season.
Per Realtor.com Research: https://www.realtor.com/research/data/, listings posted on site. Data from sources deemed reliable, but may contain errors and subject to revision. All numbers should be considered approximate.
Pandemic
hits
cools
3-month rolling average monthly data for residential transactions reported to Bareis MLS, per Broker Metrics. Data from sources deemed reliable, but may contain errors and subject to revision. All numbers approximate, and may change with late-reported activity.
This is a snapshot measure of how many pending listings can be expected on any given day of the specified month.
Fall
Spring
Fall
Buyer activity has been increasing rapidly from mid-winter’s low, but remains lower than recent years.
Fall
The # of listings going into contract measures buyer demand, but is also deeply impacted by the supply of listings available to buy.
Per Realtor.com Research: https://www.realtor.com/research/data/, house and condo listings posted on site.
Data from sources deemed reliable, but may contain errors and subject to revision. All numbers are approximate.
April
July
March
Sales in one month mostly reflect acceptedoffer activity in the previous month.
July 2020
Oct. 2019
Sales of houses, condos, townhouses reported to NorCal MLS Alliance, per Infosparks. Data from sources deemed reliable but may contain errors and subject to revision. Last month estimated based on available information and may change with late reported sales. All numbers approximate.
April columns highlighted for year-over-year comparisons
April 2023 sales volume was down 29% from April 2022.
Closed sales mostly reflect accepted-offer activity in the previous month. The luxury market typically ebbs and flows by season: Peaking in spring, hitting its low in mid-winter.
Year over year, April 2023 home sales of $4 million+ were down 62% (from the peak of the pandemic boom).
April-May 2022
April columns highlighted for year-over-year comparisons
February
Home sales reported to Norcal MLS Alliance, per Infosparks. Data from sources deemed reliable but may contain errors and subject to revision. Last month estimated from available data, and may change with late-reported sales. All numbers approximate.
January
A measurement of how quickly the listings which sell go into contract, this statistic typically ebbs and flows per seasonal demand trends.
Jan.
Jan.
Pandemic Year 1
Sales of houses, condos, townhouses reported to NorCal MLS Alliance, per Infosparks, or per Broker Metrics Bareis MLS data. Data derived from sources deemed reliable, but may contain errors and subject to revision. All numbers approximate, and may change with late-reported sales.
The number of price reductions typically ebbs and flows by season, but can also be affected by specific events in the economy and the market. It’s not unusual for price reductions to peak in autumn before the mid-winter holiday slowdown begins in mid-November.
Per Realtor.com Research: https://www.realtor.com/research/data/, listings posted to site. Data from sources deemed reliable, but may contain errors and subject to revision. All numbers approximate.
Statistics are generalities, essentially summaries of widely disparate data generated by dozens, hundreds or thousands of unique, individual sales occurring within different time periods. They are best seen not as precise measurements, but as broad, comparative indicators, with reasonable margins of error. Anomalous fluctuations in statistics are not uncommon, especially in smaller, expensive market segments. Last period data should be considered estimates that may change with late-reported data. Different analytics programs sometimes define statistics – such as “active listings,” “days on market,” and “months supply of inventory” – differently: what is most meaningful are not specific calculations but the trends they illustrate. Most listing and sales data derives from the local or regional multi-listing service (MLS) of the area specified in the analysis, but not all listings or sales are reported to MLS and these won’t be reflected in the data. “Homes” signifies real-property, single-household housing units: houses, condos, co-ops, townhouses, duets and TICs (but not mobile homes), as applicable to each market. City/town names refer specifically to the named cities and towns, unless otherwise delineated. Multi-county metro areas will be specified as such. Data from sources deemed reliable, but may contain errors and subject to revision. All numbers to be considered approximate.
Many aspects of value cannot be adequately reflected in median and average statistics: curb appeal, age, condition, amenities, views, lot size, quality of outdoor space, “bonus” rooms, additional parking, quality of location within the neighborhood, and so on. How any of these statistics apply to any particular home is unknown without a specific comparative market analysis.
Median Sales Price is that price at which half the properties sold for more and half for less. It may be affected by seasonality, “unusual” events, or changes in inventory and buying trends, as well as by changes in fair market value. The median sales price for an area will often conceal an enormous variety of sales prices in the underlying individual sales.
Dollar per Square Foot is based upon the home’s interior living space and does not include garages, unfinished attics and basements, rooms built without permit, patios, decks or yards (though all those can add value to a home). These figures are usually derived from appraisals or tax records, but are sometimes unreliable (especially for older homes) or unreported altogether. The calculation can only be made on those home sales that reported square footage.
Compass is a real estate broker licensed by the State of California, DRE 01527235. Equal Housing Opportunity. This report has been prepared solely for information purposes. The information herein is based on or derived from information generally available to the public and/or from sources believed to be reliable. No representation or warranty can be given with respect to the accuracy or completeness of the information. Compass disclaims any and all liability relating to this report, including without limitation any express or implied representations or warranties for statements contained in, and omissions from, the report. Nothing contained herein is intended to be or should be read as any regulatory, legal, tax, accounting or other advice and Compass does not provide such advice. All opinions are subject to change without notice. Compass makes no representation regarding the accuracy of any statements regarding any references to the laws, statutes or regulations of any state are those of the author(s). Past performance is no guarantee of future results.