

Marin County Real Estate February 2023 Report

December is typically the month that sees the year’s lowest level of deal-making activity – i.e. listings accepting offers (going into contract) – which leads to January usually posting the lowest monthly number of closed sales. (Sales typically close 3 to 6 weeks after going into contract.) In the 11-county, greater Bay Area, accepted-offer activity in December 2022 and closed sales volume in January 2023 generally hit their lowest monthly points in 15 years.
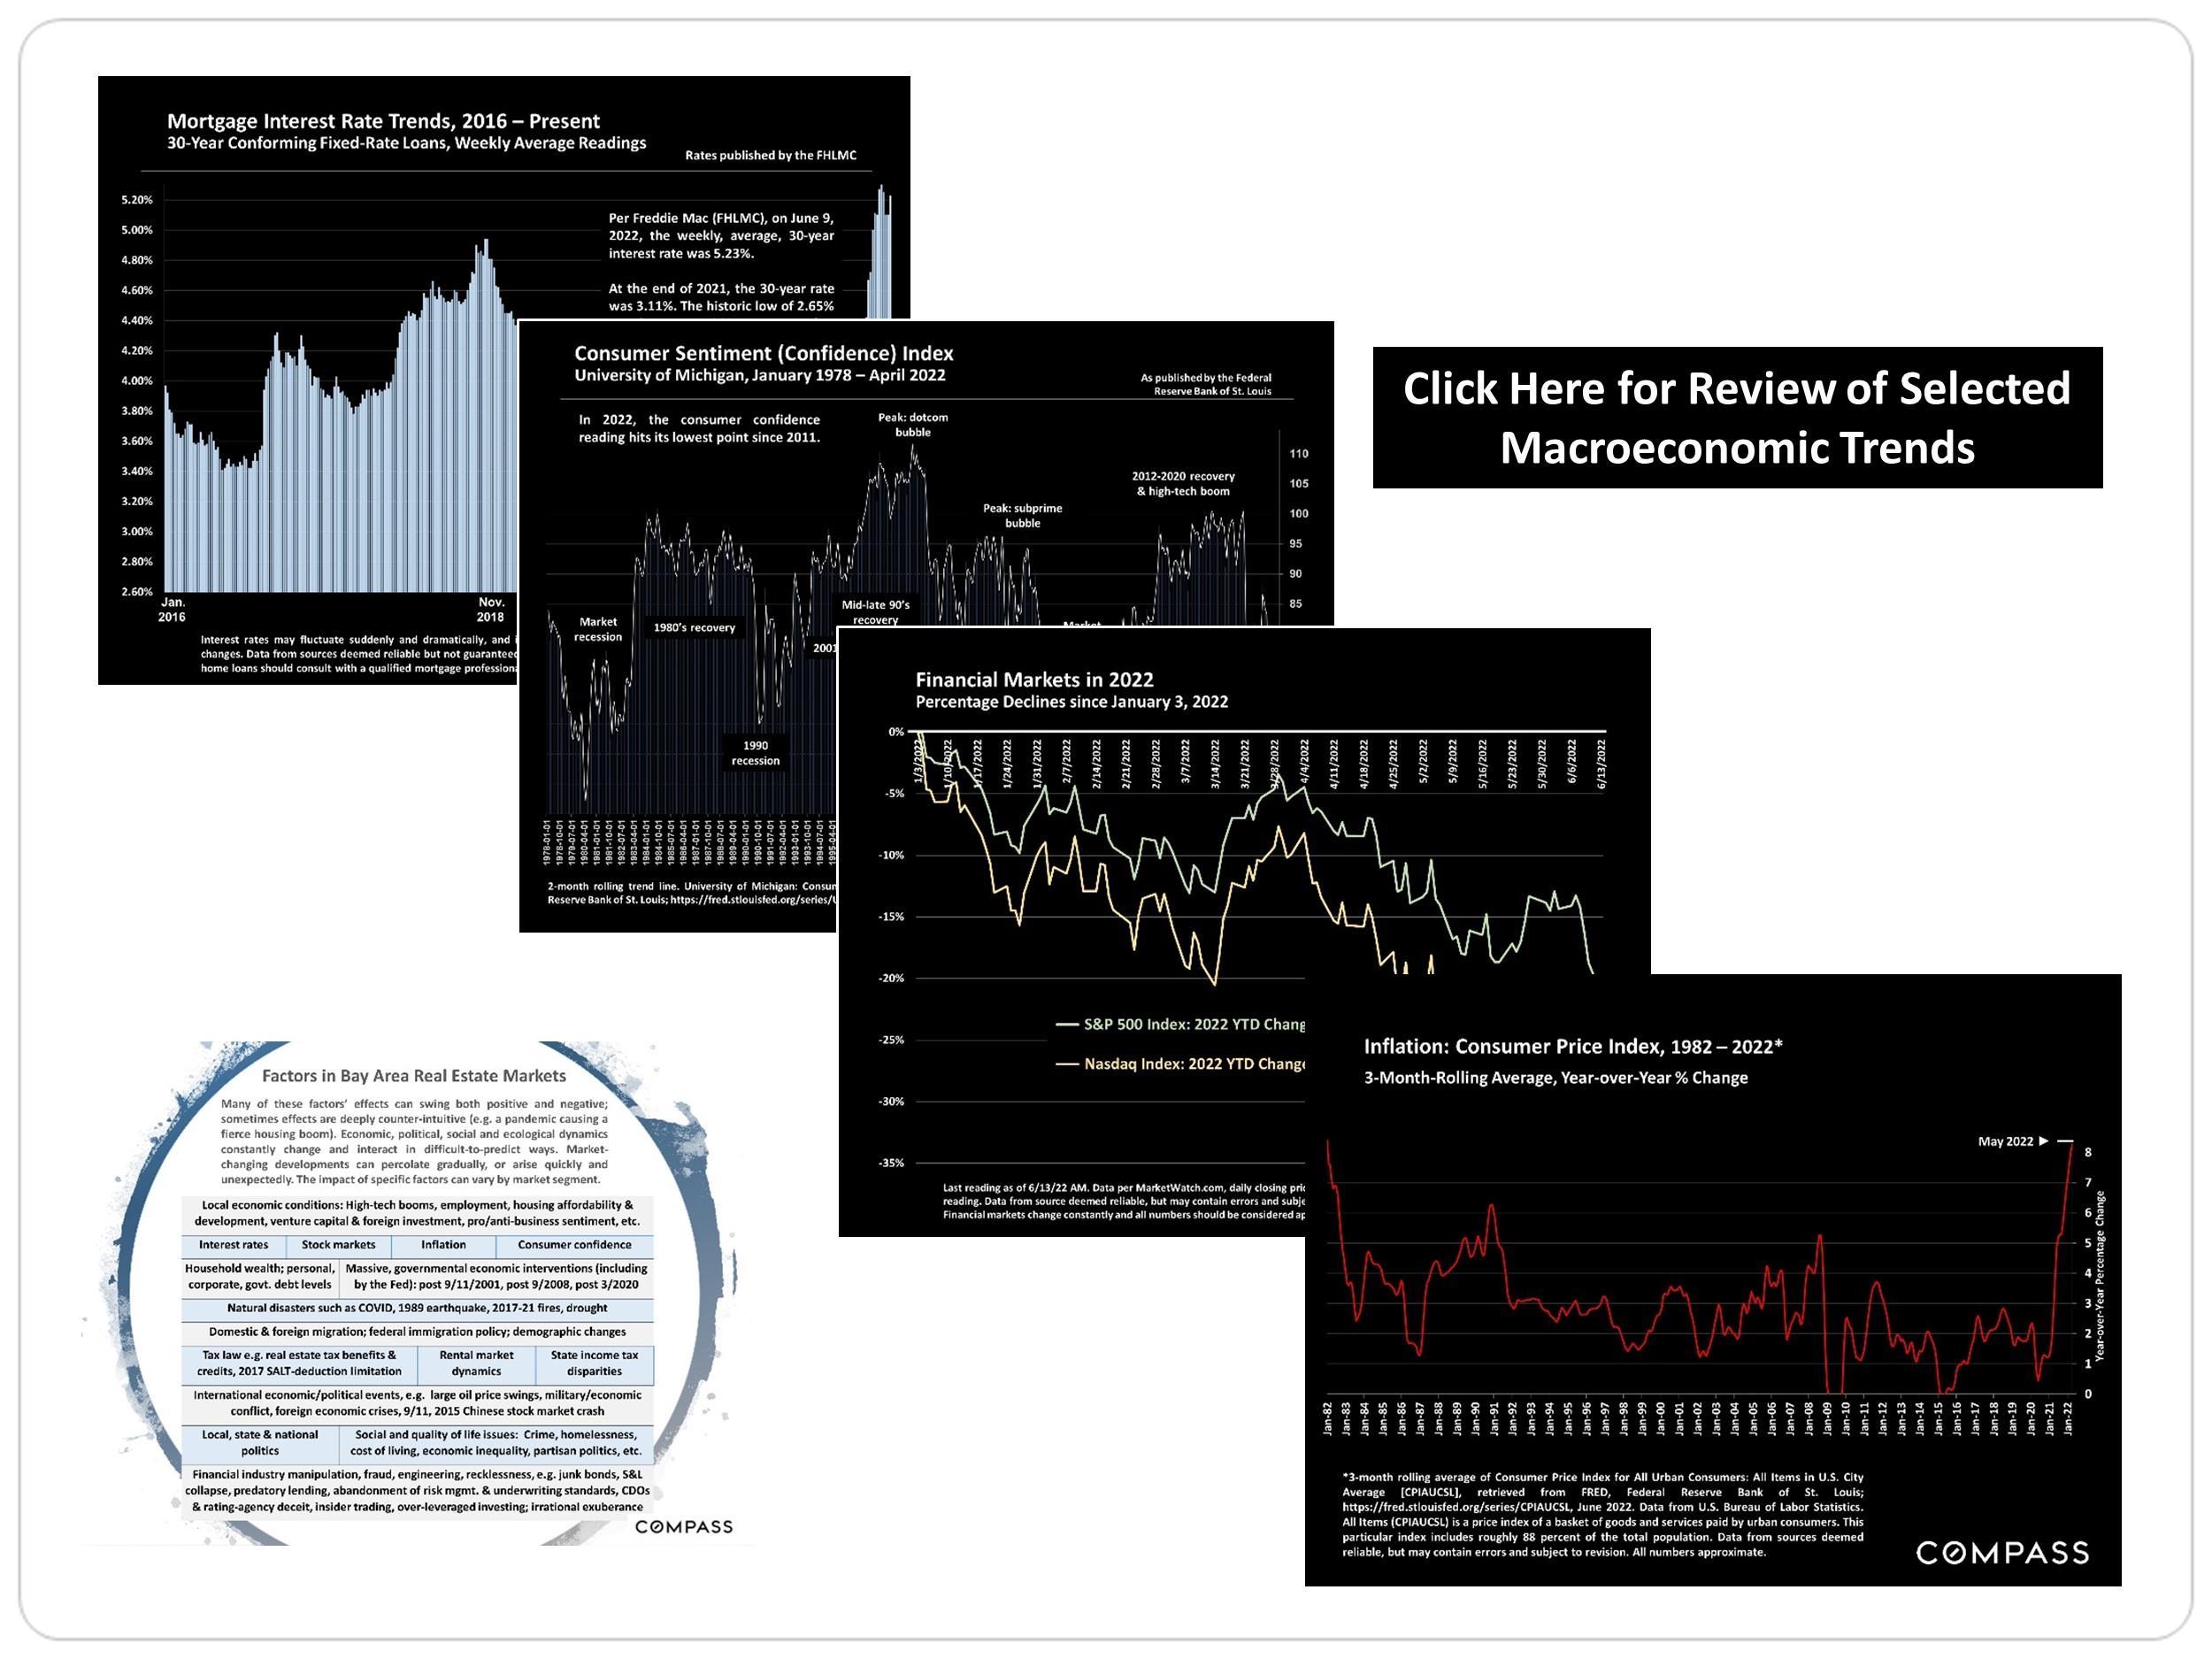
Typically, after the long holiday slowdown, the market just begins to wake up in mid-January before accelerating into spring. That being said, inflation has dropped substantially since June and interest rates since November, home prices are well down from last spring, stock markets are up 8% (S&P) to 15% (Nasdaq) YTD as of 2/3/23 (albeit with continuing volatility), and despite escalating layoffs in high tech, early indications in 2023 point to rebounding buyer demand. Open house traffic has jumped, more buyers are requesting listing disclosure packages, and there have been increasing reports of multiple offers and (often unexpected) overbidding of asking price. Based on this preliminary data (much of it still anecdotal*), it appears that buyer demand severely repressed by economic conditions in the 2nd half of 2022 has begun to bounce back.
A similar rebound began in mid-late summer 2022 for similar reasons – a significant drop in mortgage rates and a large rise in stock markets – which then quickly faded when positive economic developments went into reverse. Market activity then slowed further through the rest of 2022. There are currently considerable hopes for a more lasting economic recovery in 2023.
During the long high-tech and pandemic housing boom – which peaked in April/May 2022 – as each new year began, the classic dynamic was for buyers to jump back into the market much more
quickly than sellers, creating an immediate imbalance between supply and demand. Too few new listings compared to the quantity of motivated buyers sparked often ferocious bidding wars, leading to considerable home price gains virtually every spring. It is too early to conclude, after the general price declines and steep drops in market activity seen in the 2nd half of 2022, that a sustained recovery in market conditions is now underway, and if it is, how quickly it will develop and its impact on prices in 2023. Many economic conditions remain challenging – with critical indicators still much weaker on a year-over-year basis – and forecasts by economists and analysts vary widely. Hopefully, economic conditions will continue to improve, providing the foundation for the recovery in real estate. In the meantime, preliminary indicators are surprisingly positive, and the CEO of Compass recently stated his belief that Q4 2022 saw the bottom of the market.
The “spring market,” which can begin as early as February in the Bay Area, is typically the biggest selling season of the year, especially for luxury homes, and more data regarding new listings coming on market, listings going into contract, sales volumes, speed of sale, overbidding and sales prices will soon become available.*
* Most “hard” data in real estate is based on closed, recorded sales, a lagging indicator which generally reflects deal-making activity in the previous month, when offers were negotiated. January sales, the basis for many analyses in this report, mostly reflect the December 2022 market when new listing activity and buyer demand were typically at their lowest ebb in years. February and March listing and sales data will begin to better reflect early 2023 conditions.
Data from sources deemed reliable, but may contain errors and subject to revision. All numbers approximate, and may change with late-reported activity.
November
Per Freddie Mac (FHLMC), on February 2, 2023, the weekly, average, 30-year interest rate was 6.09%, almost a full point down from November 2022.
June
August

JanuaryFebruary
Demand strengthens
Extremely heated market
Demand strengthens
Preliminary data indicates that similar economic dynamics are initiating the start of another recovery in demand in early 2023.
The July-August decline in interest rates – concurrent with a recovery in stock markets – prompted a (brief) rebound in buyer demand (which faded when rates rose again).
2-month moving trend line. Freddie Mac, 30-Year Fixed Rate Mortgage Average in the United States, retrieved from Federal Reserve Bank of St. Louis; https://fred.stlouisfed.org/series/MORTGAGE30US.
Data from sources deemed reliable but not guaranteed. All numbers approximate.
The market has seen high volatility with several fast, large reversals of direction over the past 13 months.
2023 begins August 2022 recovery
Demand strengthens
Buyer demand cools
Buyer demand cools
Demand strengthens
Last reading, end of day 2/3/23. Data per MarketWatch.com, daily closing prices. Data from source deemed reliable, but may contain errors and subject to revision. Financial market values change constantly and all numbers should be considered approximate.
Median sales price is that price at which half the sales occurred for more and half for less. It is a very general statistic, disguising an enormous range of sales prices in the underlying sales. It is often affected by other factors besides changes in fair market value. Monthly and seasonal fluctuations are common, which explain many of the regular ups and downs in this chart. Longer-term trends are much more meaningful than short-term changes.
Year over year, the 3-month rolling, median house sales price in January 2023, $1,532,000, was up about ½ of 1%.
2007-08

Great recession
3-month rolling average of monthly median sales prices for “existing” houses, per CA Association of Realtors or NorCal MLS Alliance. 2-period moving trend line. Analysis may contain errors and subject to revision. All numbers approximate, and may change with late-reported sales.
Updated through January 2023
Median sales price is that price at which half the sales occurred for more and half for less. It is a very general statistic, often affected by other factors besides changes in fair market value. Monthly and seasonal fluctuations are common – especially in Marin – and longer-term trends are more meaningful than short-term changes.
Year over year, the 3-month rolling, median condo sales price in January 2023, $712,500, was up about 2%.
Great
Updated through January 2023
3-month rolling median condo sales prices reported to NorCal MLS Alliance, per Infosparks. 2period moving trend line. Analysis may contain errors and subject to revision. All numbers approximate, and may change with late-reported sales.
Median sales prices are generalities and many factors besides bedroom count play roles in home values. The size of homes of the same bedroom count can vary widely within and between cities. Many of these communities see relatively low sales volumes, especially within these defined segments, which can make their median sales prices prone to anomalous fluctuation.
* Sales reported to NorCal MLS Alliance in the 6 months through mid-late 01/23. Data from sources deemed reliable, but may contain errors and subject to revision. How these prices apply to any particular home is unknown without a specific comparative market analysis. All numbers approximate, and may change with late-reported sales.
Blank fields signify too few sales for reliable calculations. Some of Marin’s communities – including Bolinas, Inverness, Pt. Reyes, Dillon Beach, Muir Beach, Nicasio – had too few sales for meaningful analysis. Many others included in these charts had very low numbers of sales within a particular segment of sales. This makes their median sales prices more prone to anomalous fluctuations.
How these prices apply to any particular home is unknown without a specific comparative market analysis.
Median sales price is that price at which half the sales occurred for more and half for less. Many factors besides bedroom count affect home values. Median sales prices are generalities, and often fluctuate due to a variety of market factors. The size of homes of the same bedroom count can vary widely within and between cities.
* Sales reported to NorCal MLS Alliance in the 6 months through mid-late 01/23. Data from sources deemed reliable, but may contain errors and subject to revision. All numbers approximate, and may change with late-reported sales.
Median sales price is that price at which half the sales occurred for more and half for less, and it typically disguises a huge variety of prices in the individual underlying sales. It is a very general statistic often affected by factors other than changes in fair market value. Quarterly and seasonal fluctuations are common and it’s not unusual for median prices to peak for the calendar year in Q2.
2-Bedroom Condos 3-Bedroom Houses 4+ Bedroom Houses
Sales reported to NorCal MLS Alliance, per Infosparks. Data from sources deemed reliable, but may contain errors and subject to revision. All numbers are approximate, and may change with late reported sales. Quarterly sales volumes can fluctuate, affecting median sales price calculations.
In the 6 month period, 64% of county house sales were under $2 million; 32% sold from $2 million to $4,999,999; and 4% sold for $5 million+.
Home sales in Novato and San Rafael make up approx. 47% of Marin’s total. Some of Marin’s most expensive markets see very low numbers of sales.
In the 6 month period, there were 27 houses reported sold for $5 million+, including 6 for $10 million+. As of late January 2023, there were 20 active listings priced at $5 million+, and 9 at $10 million+.
Data derived from sources deemed
but may contain errors and subject to revision. All numbers approximate,
The number of new listings typically climbs rapidly through spring, drops in summer, then spikes back up in autumn before plunging in mid-winter.

This is a snapshot measure of how many active listings can be expected on any given day of the specified month.
The number of active listings on a given day is affected by 1) how many new listings come on market, 2) how quickly buyers snap them up, 3) the sustained heat of the market over time, and 4) how many sellers pull their homes off the market without selling. The number typically ebbs and flows by season.
Per Realtor.com Research: https://www.realtor.com/research/data/, house and condo listings posted on site. Data from sources deemed reliable, but may contain errors and subject to revision. All numbers should be considered approximate.
Marin County Market Dynamics & Seasonality Jan.
Pandemic alters typical seasonal trends
Market activity, as defined by listings going into contract, typically accelerates rapidly moving into spring.
Pandemic hits
Deal-making activity in Q4 2022 – the number of offers going into contract – hit its lowest quarterly point since 2009.
House, condo, townhouse listings reported to NorCal MLS Alliance, per Infosparks. Data from sources deemed reliable but may contain errors and subject to revision. All numbers approximate.
Last month number estimated based on available data, and may change with late reported activity.
Dec.
Sales in one month mostly reflect accepted-offer activity in the previous month. Low sales volumes in January reflect the big holiday slowdown in activity in December. January 2023 sales volume was the lowest monthly total in at least 14 years.
House, condo, townhouse sales reported to NorCal MLS Alliance, per Infosparks. Last month estimated and may change with late reported sales. Data from sources deemed reliable, but may contain errors and subject to revision. All numbers approximate.

Generally speaking, sales in one month reflect new listings and offers being accepted in the previous month or two. Higher-price home sales typically ebb and flow dramatically by season.
Sales reported to NorCal MLS Alliance, per Infosparks. Data from sources deemed reliable but may contain errors and subject to revision. All numbers approximate, and may change with latereported sales. Different data sources sometimes reports slightly different numbers.
66% of luxury home sales in the county occurred in the first 5 months of the 12-month period, with a significant decline in sales volume beginning in mid-2022.
Greenbrae & Corte Madera each had 2 sales of $4 million+.
June 2021
January 2021
May 2022

January 2022
Year over year, Bay Area January 2023 $5 million+ home sales were down about 49%.
January 2023
*Per residential sales reported to NorCal MLS Alliance for 10 Bay Area Counties, Napa to Monterey (excluding Solano), per Infosparks. Data from sources deemed reliable, but may contain errors and subject to revision. Last month estimated from data available early the following month. All numbers approximate, and may change with late-reported sales. Not all luxury sales are reported to MLS.
The percentage of listings going under contract (accepting offers) within the month, also known as the absorption rate, measures the level of buyer demand as compared to the supply of available listings: The higher the percentage, the stronger the market. All 3 price segments below hit very high percentages during the first quarter of 2022, then plunged in the face of changing economic conditions. In the second half of 2022, demand weakened most in the highest price segment. (The luxury market typically slows more dramatically during the mid-winter holidays.) Percentages began climbing in January 2023: Market seasonality is usually a major factor in demand. What occurs during the early spring market will be the next major indicator of market direction.
40% of active/coming-soon listings in this segment are priced at $5 million+.
Residential activity reported to local MLS Associations, per Broker Metrics. Data from sources deemed reliable, but may contain errors and subject to revision. All numbers approximate, and may change with late reported activity.
Historically, the current MSI reading – under 2.5 months of inventory – would typically be considered to indicate a low supply of listings for sale, but compared to the severely depressed levels during the pandemic boom, inventory has more than doubled.
3-month rolling average of monthly readings: MSI measures how long it would take to sell the current inventory of active listings at the current rate of sale. The lower the MSI, the stronger the buyer demand as compared to the supply of listings on the market. This statistic also typically fluctuates according to seasonal trends in listing and sales activity.
3-month rolling average monthly data for residential transactions reported to Bareis MLS, per Broker Metrics. Data from sources deemed reliable, but may contain errors and subject to revision. All numbers approximate, and may change with late-reported activity.
Sales in 1 month mostly reflect market dynamics in the previous month.
and flows are typical.
In the latest month, approximately 21% of sales closed over final list price, down from 76% in March.
Sales data reported to NORCAL MLS® ALLIANCE, per Infosparks. Reflecting the percentage of sales closing at sales prices over the final list prices. Data from sources deemed reliable, but may contain errors and subject to revision. All numbers are approximate, and may change with late-reported sales.
100% = an average sales price at original list price. 110% = an average sales price 10% over asking price; 94% = 6% below asking price.
This statistic is a lagging indicator of market activity 3-6 weeks earlier.
Sales of houses, condos, townhouses reported to NorCal MLS Alliance, per Infosparks.
Data derived from sources deemed reliable, but may contain errors and subject to revision. All numbers approximate, and may change with late-reported sales.
A measurement of how quickly the listings which sell go into contract, this statistic typically ebbs and flows per seasonal demand trends.
This statistic is a lagging indicator of market activity 3-6 weeks earlier.
Sales of houses, condos, townhouses reported to NorCal MLS Alliance, per Infosparks, or per Broker Metrics Bareis MLS data. Data derived from sources deemed reliable, but may contain errors and subject to revision. All numbers approximate, and may change with late-reported sales.

When market conditions abruptly cooled due to economic headwinds, many more listings were pulled off the market without selling in the 2nd half of 2022. It’s not unusual for this number to peak in December for the holiday season slowdown: Typically, many of these homes are put back on the market in the new year, often at lower prices.
Very heated pandemic market
House, condo, townhouse activity reported to Bareis MLS, per Broker Metrics. Data from sources deemed reliable but may contain errors and subject to revision. All numbers are approximate.
Reliable January 2023 data not yet available.
The number of price reductions typically ebbs and flows by season, but can also be affected by specific events in the economy and the market.
It’s not unusual that the number peaks in October, as sellers reduce prices before the mid-winter slowdown takes hold.
Per Realtor.com Research: https://www.realtor.com/research/data/, listings posted to site. Data from sources deemed reliable, but may contain errors and subject to revision. All numbers approximate.

Statistics are generalities, essentially summaries of widely disparate data generated by dozens, hundreds or thousands of unique, individual sales occurring within different time periods. They are best seen not as precise measurements, but as broad, comparative indicators, with reasonable margins of error. Anomalous fluctuations in statistics are not uncommon, especially in smaller, expensive market segments. Last period data should be considered estimates that may change with late-reported data. Different analytics programs sometimes define statistics – such as “active listings,” “days on market,” and “months supply of inventory” – differently: what is most meaningful are not specific calculations but the trends they illustrate. Most listing and sales data derives from the local or regional multi-listing service (MLS) of the area specified in the analysis, but not all listings or sales are reported to MLS and these won’t be reflected in the data. “Homes” signifies real-property, single-household housing units: houses, condos, co-ops, townhouses, duets and TICs (but not mobile homes), as applicable to each market. City/town names refer specifically to the named cities and towns, unless otherwise delineated. Multi-county metro areas will be specified as such. Data from sources deemed reliable, but may contain errors and subject to revision. All numbers to be considered approximate.
Many aspects of value cannot be adequately reflected in median and average statistics: curb appeal, age, condition, amenities, views, lot size, quality of outdoor space, “bonus” rooms, additional parking, quality of location within the neighborhood, and so on. How any of these statistics apply to any particular home is unknown without a specific comparative market analysis.
Median Sales Price is that price at which half the properties sold for more and half for less. It may be affected by seasonality, “unusual” events, or changes in inventory and buying trends, as well as by changes in fair market value. The median sales price for an area will often conceal an enormous variety of sales prices in the underlying individual sales.
Dollar per Square Foot is based upon the home’s interior living space and does not include garages, unfinished attics and basements, rooms built without permit, patios, decks or yards (though all those can add value to a home). These figures are usually derived from appraisals or tax records, but are sometimes unreliable (especially for older homes) or unreported altogether. The calculation can only be made on those home sales that reported square footage.
Compass is a real estate broker licensed by the State of California, DRE 01527235. Equal Housing Opportunity. This report has been prepared solely for information purposes. The information herein is based on or derived from information generally available to the public and/or from sources believed to be reliable. No representation or warranty can be given with respect to the accuracy or completeness of the information. Compass disclaims any and all liability relating to this report, including without limitation any express or implied representations or warranties for statements contained in, and omissions from, the report. Nothing contained herein is intended to be or should be read as any regulatory, legal, tax, accounting or other advice and Compass does not provide such advice. All opinions are subject to change without notice. Compass makes no representation regarding the accuracy of any statements regarding any references to the laws, statutes or regulations of any state are those of the author(s). Past performance is no guarantee of future results.