Hawks, Doves, Pigs and Pythons: Analyzing the Economic Outlook
Kevin L. Kliesen
Business Economist and Research Officer


WY

1
Interdependence Center Rocky Mountain Economic Summit
Federal Reserve Bank of St. Louis Global
Jackson Hole,
July 12, 2023
2
The views I will express today are my own and do not necessarily reflect the positions of the Federal Reserve Bank of St. Louis or the Federal Reserve System.
Disclaimer
The Big Picture
The momentum that developed over the last half of 2022 has carried forward into early 2023.
• There is strength in consumption, labor markets, and nonres construction. And housing is turning around! • Financial stresses have returned to normal. • Solid economic momentum and stubbornly high trend inflation suggest policy isn’t very restrictive at present. • But uncertainty about the economy remains high.
•
3
Trend Inflation: Sticky at High Levels
Headline and Core PCE Inflation and an Alternative Measure of Trend PCEPI Inflation, 2012 to the Present 12-month percent changes 8.0 7.0 6.0 Headline PCE Inflation 5.0 Alternative PCE 4.0 Core PCE Inflation 3.0 2.0 1.0 0.0 -1.0 -2.0 2012 2013 2014 2015 2016 2017 2018 2019 2020 2021 2022 2023
4
SOURCES: BEA, FRBs of Cleveland, Dallas, San Francisco, and Haver Analytics Data through May 2023.
Bad Stuff Happens When Inflation is High!
Growth of Labor Productivity, 1948 to 2023
NOTE: Labor productivity is output per hour in the nonfarm business sector; 2023 is partial (2023:Q1).
7 6 5 4 3 2 1 0 -1 -2 -3 1948-73 (2.8%) 1974-95 (1.5%) 1996-2005 (2.8%) 2006-2022 (1.4%)
Percent change, annual data 8 5 1948 1954 1960 1966 1972 1978 1984 1990 1996 2002 2008 2014 2020
SOURCE: Bureau of Labor Statistics and Haver Analytics.
Volcker)
Quoted from William Silber, The Triumph of Persistence, Bloomsbury Press, 2012, p. 53.
6
“We give government the right to print money because we trust elected officials not to abuse that right, not to debase that currency by inflating. . . Failure to maintain those promises undermines trust in America. And trust is everything.” (Paul
Bullard’s Taylor Rules
Policy Rate and Taylor-Type Rules' Recommendations

Percent Policy Rate (Mid-point of target range) 7
Recommended policy based on a generous Taylor-type rule
Recommended policy based on a less-generous Taylor-type rule
Median projection for 2023 from the June SEP
5 4 3 2 1 0 6 8 Jan-19 Jul-19 Jan-20 Jul-20 Jan-21 Jul-21 Jan-22 Jul-22 Jan-23
7
Not Yet Restrictive . . . Maybe!
Holston-Laubach-Williams Estimate of R* and the Real Fed Funds Target Rate
NOTE: The real fed funds rate is the nominal rate less the 4-quarter percent change in the core PCEPI inflation rate.
4 R* (LHW) Real FFTR
Percent 8 6 8 2 0 -2 -4 -6 1982 1985 1988 1991 1994 1997 2000 2003 2006 2009 2012 2015 2018 2021
SOURCE: FRB New York and Haver Analytics
(2023:Q1)
Few Workers . . . More Retirees
Old-Age Dependency Ratios for the US, China, and Europe: 2000 to 2075
USA China Europe Projection
NOTE: The old-age to working-age demographic ratio is defined as the number of individuals aged 65 and over per 100 people of working age defined as those at ages 20 to 64.
SOURCE: OECD, 2023
0 50 40 30 20 10 2075
Percent 70 60 9 2000 2003 2006 2009 2012 2015 2020 2023 2026
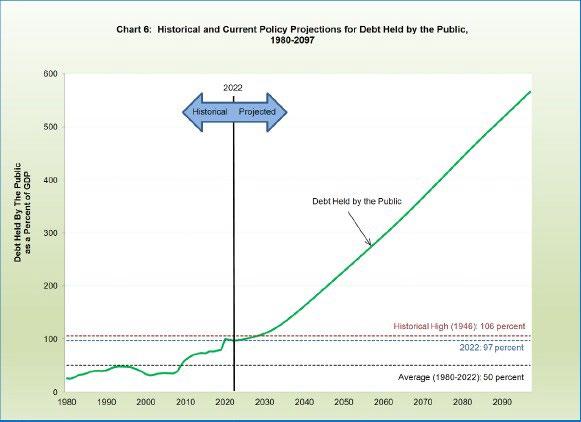
Federal Debt: To Infinity and Beyond!
Federal Debt Held By the Public as a Percent of GDP: Actual and CBO Projections
200 180 160 140 120 100 80 60 40 20 0 1940 1948 1956 1964 1972 1980 1988 1996 2004 2012 2020 2028 2036 2044 2052
10
SOURCE: Congressional Budget Office, June 2023
Shock and Awe!
SOURCE: US Treasury, February 16, 2023.

11
For All Your Economic Data Needs!
Macro Snapshot presents important macroeconomic indicators closely followed by the St. Louis Fed to gauge the current state of the economy and appropriate policy.

https://fred.stlouisfed.org/macro-snapshot

12
QUESTIONS?
13
EXTRA SLIDES
14
“The FOMC has always recognized that in a tightening cycle, if we stop too soon, inflationary pressures will resurge and make it very difficult to contain them again. We therefore always tend to take out the insurance of an additional fed funds increase, fully expecting that it may not be necessary.” (Alan Greenspan)
Quoted from Alan Greenspan, The Age of Turbulence, The Penguin Press, 2007, p. 156.
15
The Policy Path According to the SEP
SOURCES: FOMC (June 2023) and Haver Analytics
5.6 2.4 3.375 5.625 5.125 1 2 3 4 5 2021 2022 2023 2024 2025
Percent 7 Range projected Median projected 6 Actual 16 0 2015 2016 2017 2018 2019 2020
Nominal Federal Funds Rate and the FOMC's Projections for 2023 to 2025
“When the bond market begins to believe that government interest-bearing debt is beyond the ceiling of feasibility, the government's next bond auction “fails” in the sense that the interest rate required by the market on the new bond offering is so high that the government withdraws the offering and turns to money printing as its alternative.” (Charles W. Calomiris)
Quoted from “Fiscal Dominance and the Return of Zero-.
17
Accounting for Growth: Small Changes Matter Over
Time!
Accounting for Growth of Real GDP: 1982 to 2031 (P)
*NOTE: Calculations exclude recession quarters. In line 5, GDP is the average of gross domest product and gross domestic income.
SOURCE: Author's calculations using actual and projected data from the BEA and BLS.
18
Percent changes at annual rates 1982.4 to 1990.2 1991.1 to 2001.1 2001.4 to 2007.4 2009.2 to 2021.4 2021 to 2031 (P) [1] Civilian Population 1.18 1.19 1.26 0.86 0.70 [2] + Employment/Population 1.29 0.39 - 0.06 - 0.04 - 0.20 [3] = Civilian Employment 2.47 1.58 1.19 0.82 0.50 [4] + Labor Productivity 1.86 2.19 1.59 1.50 1.30 [5] = Real GDP* 4.33 3.77 2.79 2.32 1.59
The Python that Ate the Pig!
The law now commands such extraordinary commitments of limited revenues to mandated programs those that by design operate eternally under rules written by yesterday’s legislators and without any vote by newly elected legislatures—that fiscal democracy is at risk.
40 20 0 Mandatory + Interest Projection Federal Mandatory Outlays Plus Net Interest on the Debt as a Share of Federal Revenues: 1962 to 2033 Percent 160 140 120 100 80 60 -20 1962 1967 1972 1977 1982 1987 1992 1997 2002 2007 2012 2017 2022 2027 2032 NOTE: Fiscal years. SOURCE: CBO (May 2023) and Haver Analytics
19
(Steuerle, 2010)


