Portfolio Opportunity Ranker

A global evaluation of the remaining hydrocarbon resources of the planet, provided in an interactive ArcGIS format and customisable to provide users with a bespoke version of the product incorporating their own data inputs.
• Training Manual 1.0 March 2022

Portfolio Opportunity Ranker | See the future
Data integration
Built on a world class dataset:
• Data of > 140,000 exploration wells
• Data from > 29,000 fields

Translated into geology:
• > 400 proven charge areas
• > 500 charge buffer polygons
• All polygons were split based on physiography => > 8000 used in total

Including prospectivity:
• >24,000 prospects & leads were incorporated
And fully customizable:
• Load your own prospects and leads & rerun all analysis
• Change oil price assumptions or economics on the fly
Assess identified prospectivity:
• Utilize S&P prospects and/or load your own, utilize economic cutoffs based on physiography (e.g. water depth) to assess commerciality
Evaluate unidentified prospectivity:
• Use Portfolio Opportunity Ranker’s industry leading Yet-to-Find methodology to evaluate the exploration potential
Browse the results on the fly:
• Screen for the most prospective areas
Spin the world in multiple scenarios:
• Compare geological and commercial volumes on the fly and assess the impact of changes in oil prices via 19 predefined scenarios
Benchmark your Portfolio:
• How does your Portfolio compare
Liberate your data:
Aggregate your scenarios on different levels:
• Aggregate the results on multiple levels, including geographies, basins, blocks or create your own aggregation polygons
• Link your results with BI software (e.g., PowerBI)
Portfolio Opportunity Ranker - The Best of 2 Worlds
S&P Global Vantage Solution
S&P Global - GIS-Pax Portfolio Opportunity Ranker
World’s Best E&P Data
• 60 years in the E&P industry
• Industry-leading, spatially enabled databases with comprehensive coverage of global upstream history, status & activity
Portfolio Opportunity Ranker
Applying risk management beyond the known data points First of its kind

Industry Leading Play Analysis/ Exploration Portfolio software
• 100+ combined years global basin experience & NV track record
• Mindset to co-create the ideal tool for global opportunity screening, ranking & decision-making
The Team: a unique combination of diverse skills bringing a cumulative ~250+ years of E&P specialist knowledge to the challenge… GIS-pax core team (see https://www.gis-pax.com/our-team/ for full GIS-pax technical team)
Ian Longley - 30+ year international exploration geologist Lasmo/Woodside/Shell/Oil Search – initial joint founder of GIS-pax in 2010.
Paul Ventris – 30+ year international exploration geologist BP/Statoil/Woodside/Maersk.
Wayne Hewitt – 25+ yearArcGIS specialist – ESRI and Woodside.
Ben Ralph – 25+ high endArcGIS programmer – ESRI
Jan Mayer – 10+ year international exploration geologist and commercial expert Shell/OMV
Ken Hood – GIS-pax geological adviser - 30+ years experience in Exxon.
Tom Giles – GIS-pax GIS advisor – 40+ years experience with E&P GIS Landscapes – initial joint founder of GIS-pax in 2010
S&P Global core team
Jerry Jarvis – 37 year international exploration geologist Tullow, Sipetrol, Enterprise Oil, Fletcher Challenge Energy, and Sun Oil.
Elizabeth Marshall – 20 year geoscientist with deep technical knowledge of the S&P Global database – currently Exec Director Product Management
Adam Upson – 15 year GIS specialist with a deep knowledge of the IHS Vantage database – currentlyAssoc Director Customer Solutions
The evaluation workflow process was developed by GIS-pax and QC’ed by industry representatives to ensure that there was external QC and input.
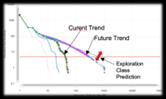
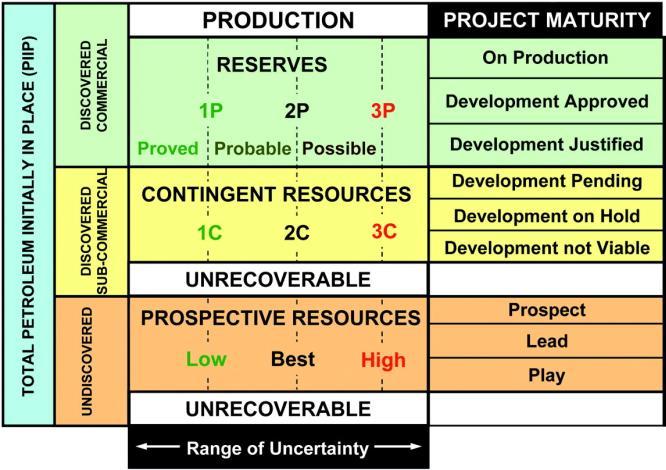
PO Ranker Exploration Potential Methodology

30km and 100km buffers to pipelines/infrastructure
PO Ranker uses 3 basic estimate types to calculate Exploration Potential
1. Exploration Potential in Proven Charge Areas
– Populated by PO Ranker team, but can be edited by project subscribers.
– Defined ChargePhys Polygons, which are then cut by fiscal boundaries and distance to pipeline buffers to create ChargePhys MCFS polys.
– For each MCFS polygon, calculate probabilistic geologic and commercial/economic volumes and values, using MCFS-specific oil and gas field cut-offs with IP and UIP estimates (using the future field engine/methodology).
2. Exploration Potential in Charge Buffer areas
– Populated by PO Ranker Team, but can be edited in project by subscribers.
– 50 km buffer around Proven Charge Polygons, cut by well density, distance to pipeline, and fiscal boundaries to create Buffer MCFS polygons.
• Well density cuts are used to estimate charge probability in risking.
– For each Buffer MCFS polygon, calculate probabilistic geologic and commercial/economic volumes and values, using MCFS-specific oil and gas field cut-offs with IP and UIP estimates (based on analogue data from the adjacent ChargePhys areas).
• We correct calibrated FD estimate for the end of time for the IP and dry wells in the target Buffer MCFS areas.
• We correct for field sizes going from proven areas into buffer areas by using correction factors from sediment thickness map analysis .
3. Estimating Exploration Potential in “Beyond the Buffers” (BtB) areas
– Populated by PO Ranker team in delivered project – only identified prospectivity –analogues best done by subscriber geoscientists.
– We supply global analogues data in the proven charge/phys areas based on S&P and public domain data that can be used to help build analogue feature density and fsd estimates for these BtB evaluations.
• ChargePhys Polygons – Proven charge polygons, subdivided by key geologic and geographic boundaries (eg, onshore/offshore, water depth)
• MCFS Polygons – ChargePhys polygons cut by fiscal boundaries and distance to pipeline buffers
• Buffer MCFS Polygons – 50 km buffer around ChargePhys Polygons, cut by well density, fiscal boundaries, and distance to pipeline buffers
• IP – Identified Prospects – known prospects that have been included as part of the S&P Global database
• UIP – Unidentified Prospects - prospects not yet identified but inferred to exist based on geologic characterization
• FD – Field Density – projected ultimate field density assuming all valid prospects are drilled Useful definitions:
– User has to estimate input oil/gas field cut-offs, OVG counts and splits, well cost and value data to calculate stochastic estimate volumes and value estimates.
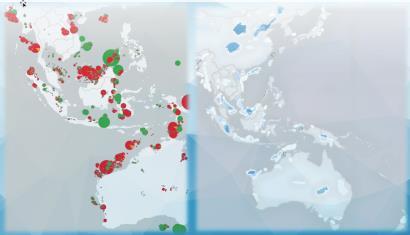
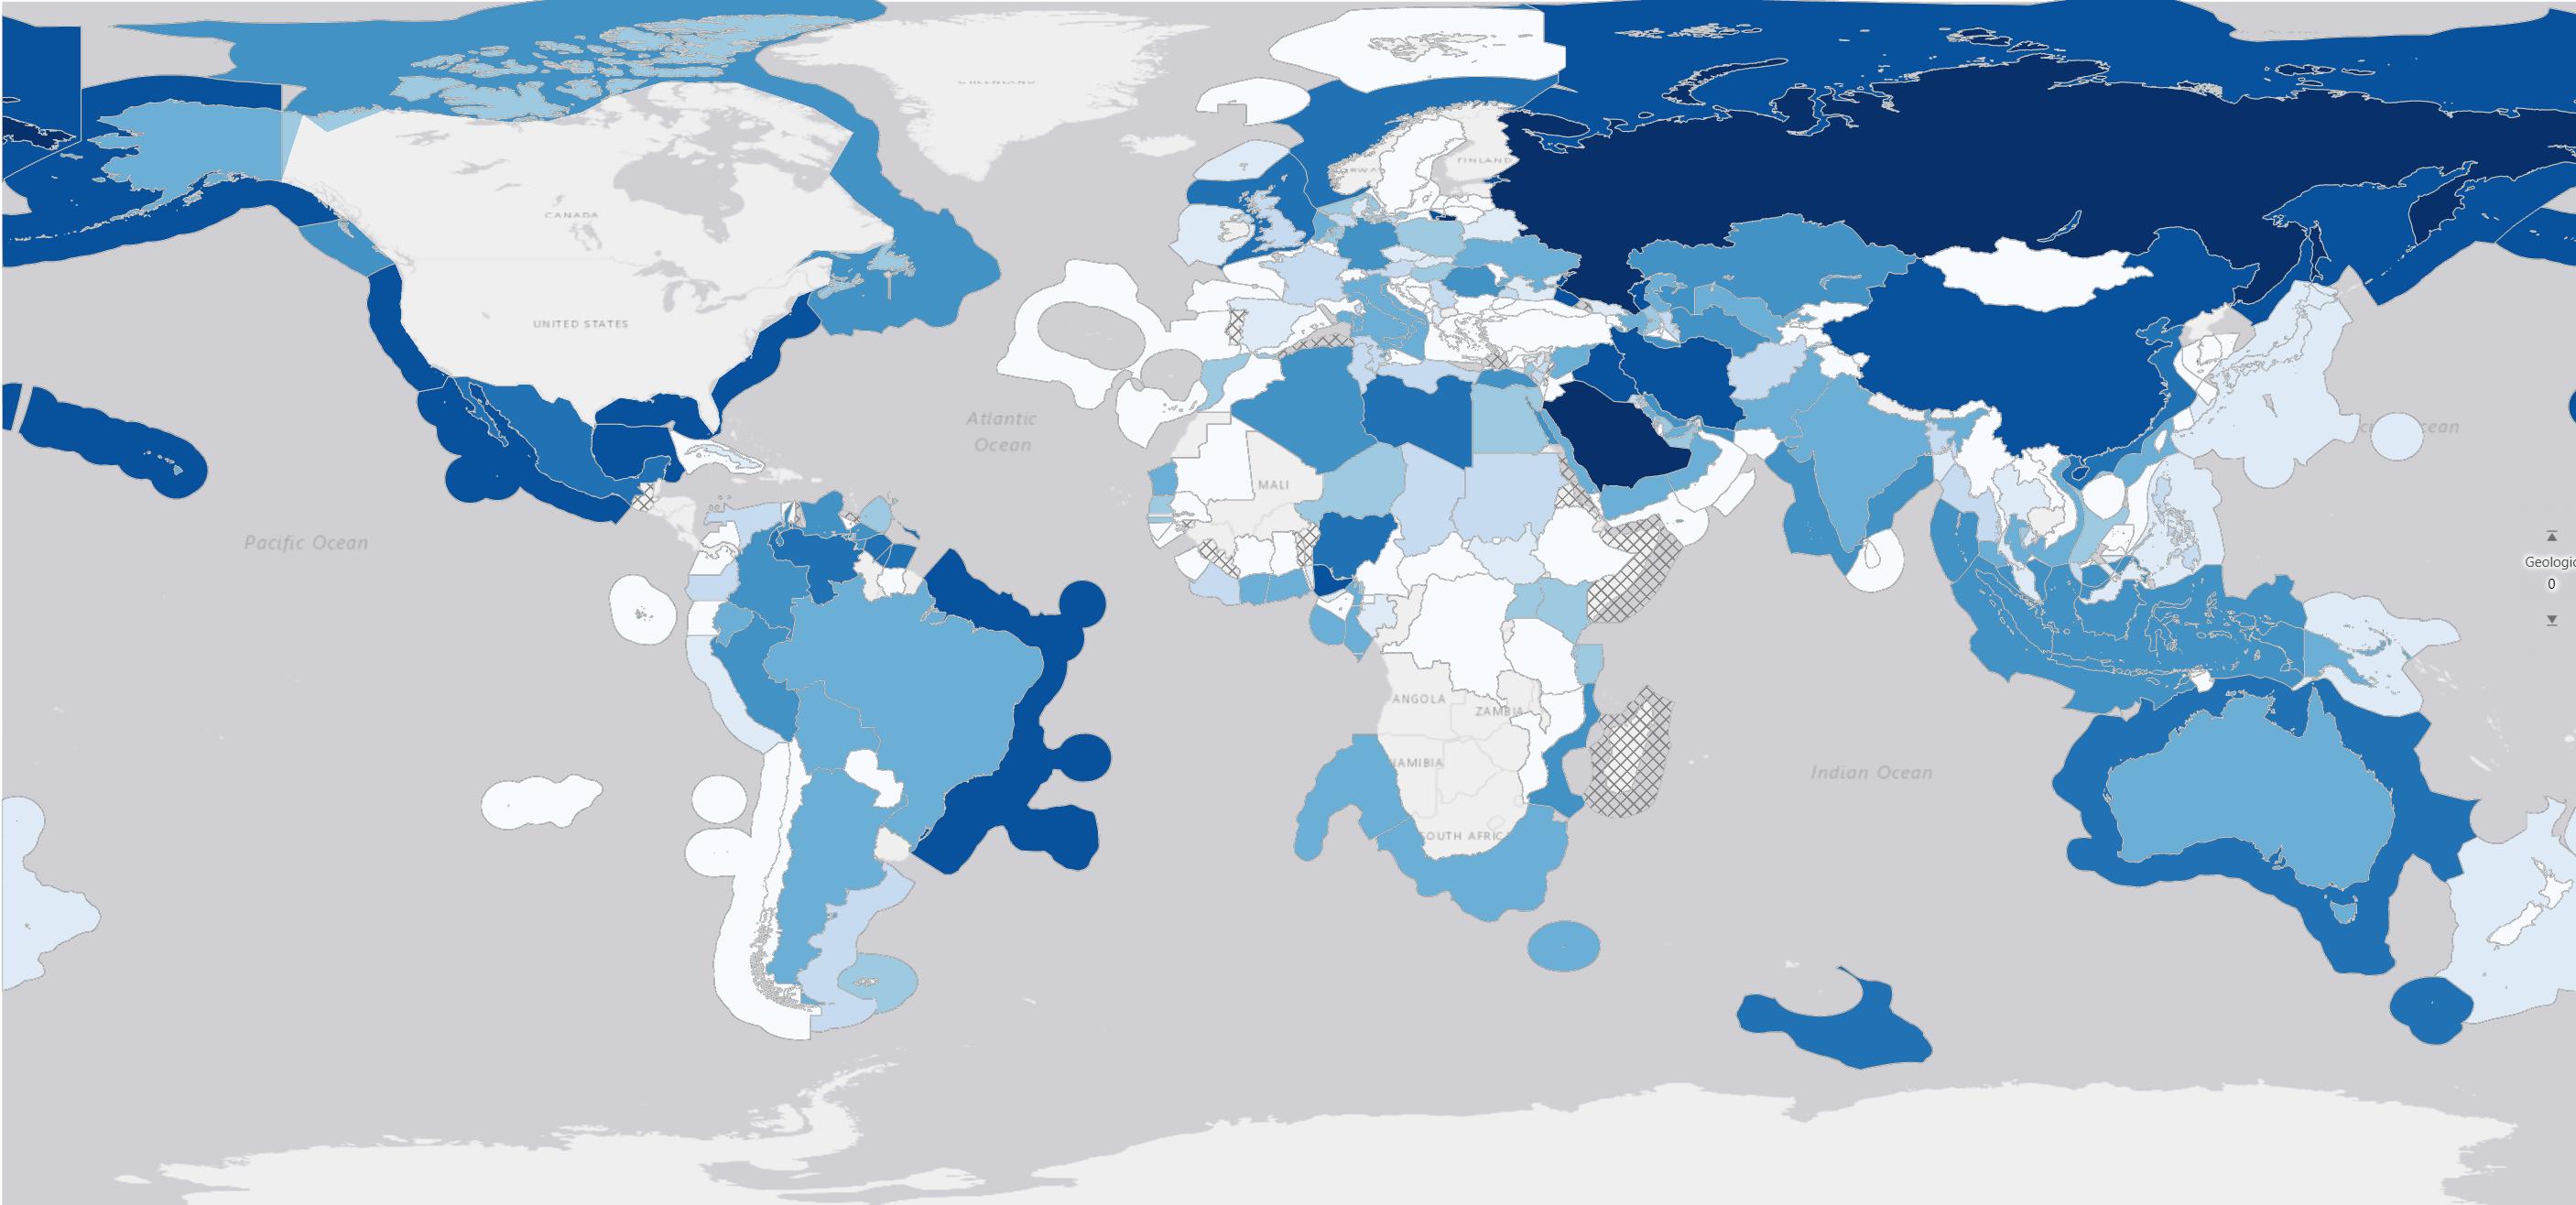
Global Map of Proven Charge Polygons plus Charge MCFS Polys
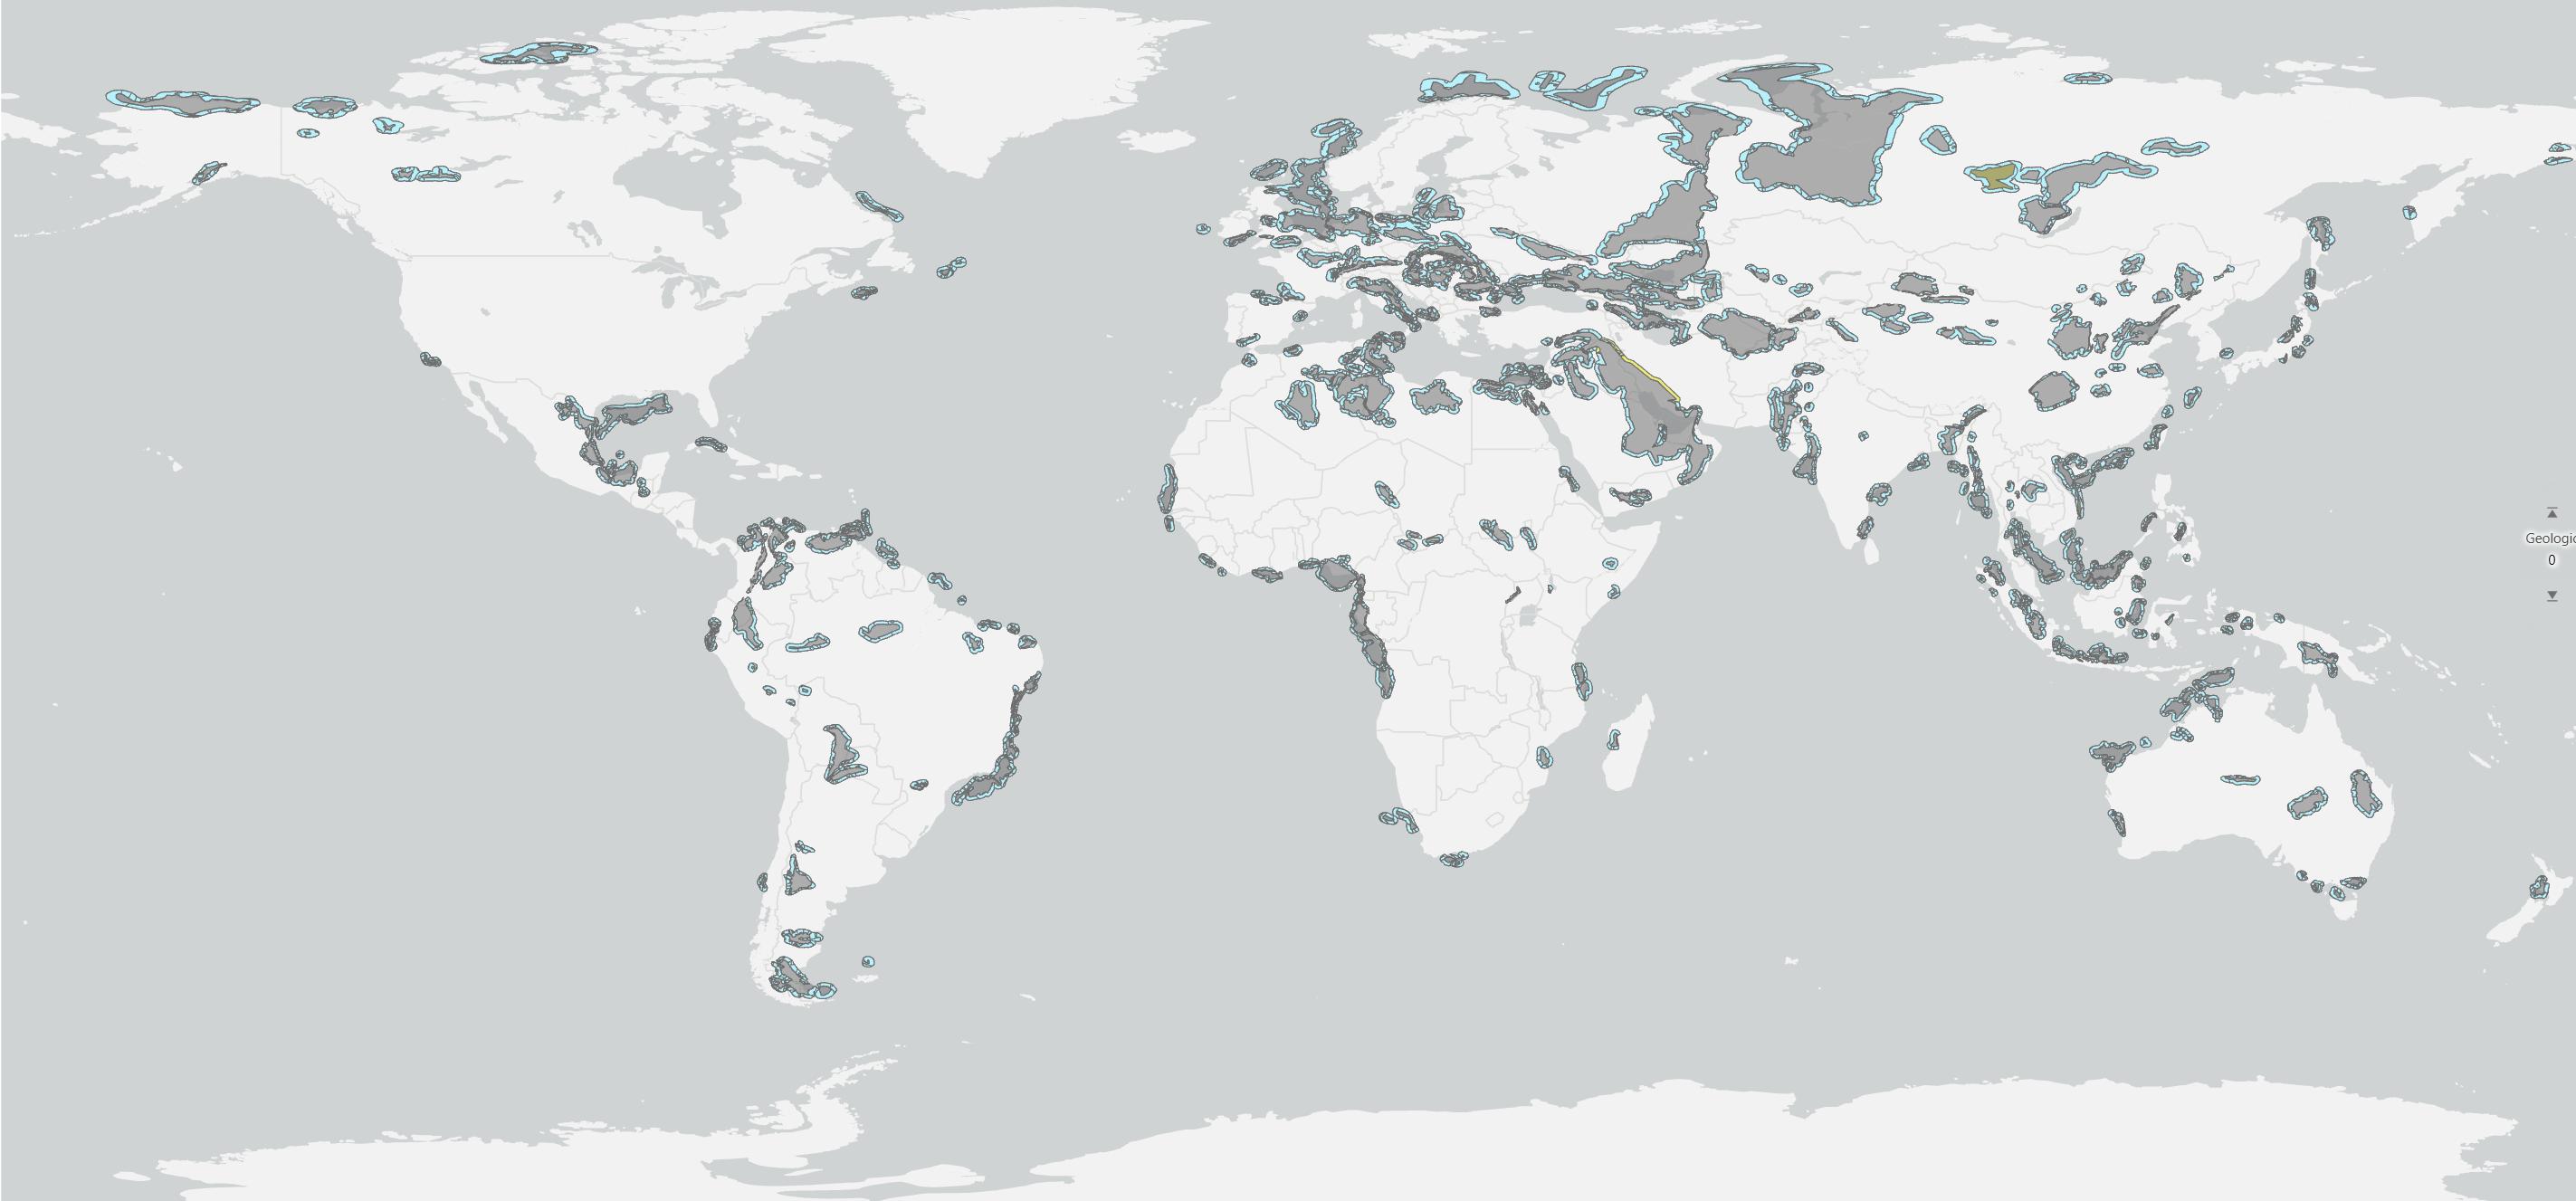
437 Proven Charge Polygons
Divided into 803 ChargePhys Polygons
Further split into 1792 MCFS Polygons
With 519 Charge Buffer Polygons
Divided into 1239 ChargeBufferPhys Polys
Further split into 6490 Buffer MCFS Polys
Total number of Polygons used = 8282
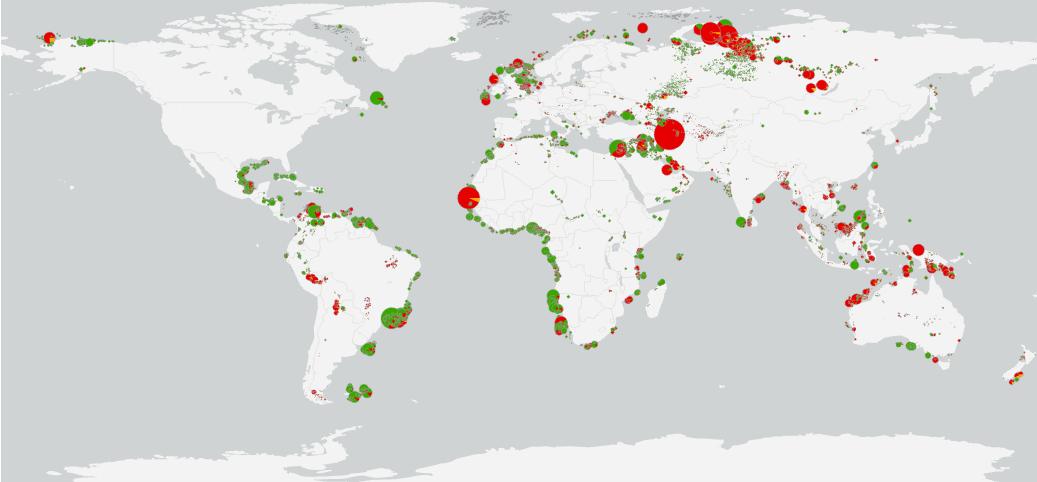
Identified prospectivity:
More than 24,000 prospects and leads from the S&P
Global database have been consistently evaluated for volumes and risks. Users can substitute or include their own prospects into the evaluation.
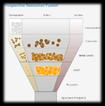
The PO Ranker FSD Top-up approach
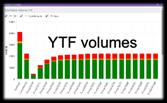
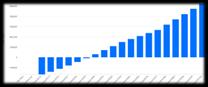
Example of Exploration Potential (YTF) Volumes by Geographies
Estimates available with or without commercial filters and of commercial volumes at 19 different oil price scenarios (US$20-200/bbl)
Portfolio Opportunity
Ranker vs Player | Which one is right for you?

Designed for
Strategic decision makers
• Identify areas/opportunities that best align with strategic objectives (e.g. highest YTF volumes / value, areas most resilient to low oil prices)
• Benchmark your portfolio
• Receive updates twice a year
Key functionality
• Global evaluation of the remaining undiscovered resource of the planet
• Includes over 24,000 prospects and leads with risk and volume evaluations and you can integrate your own
• Pre-populated with S&P Global data for wells, fields and prospects
• The YTF results are presented for geologic volumes (precommercial cutoff), commercial volumes (proportion of YTF above the commercial cutoff’s) and value (US$ MM)
• All inputs for YTF evaluation are user editable
• Results can be aggregated to countries, basins, license blocks or user defined polygons


Designed for
Geologists & Exploration Managers
• Evaluate a basin or multi-basins via a fully integrated flexible workflow
• Integrate data from S&P Global or your own structured database
• Utilize the industry leading play-based evaluation software
Key functionality
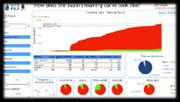
• Provides instant access to all historical statistics (e.g. creaming curves)
• Standardizes and guides your post well evaluations
• Captures well, field and licence block information
• Automatically generates exploration statistics
• Common risk segment mapping
• Full stochastic prospect risk and volumetric evaluation
• Evaluating the impact of success at any prospect on the overall portfolio by derisking further opportunities in your portfolio
• Yet to find evaluation for any polygons constructed by the user