School to Prison Pipeline for Tennessee Males……………….…………………………… Page 33
School Suspensions in Tennessee by Sex…………………………………………………… Page 33
Youth Detentions in Tennessee by Sex……………………………………………………… Page 33
Prison Populations in Tennessee by Sex……………………………………………………. Page 33
Homicide Deaths by Race & Sex in Tennessee…………………………………………….. Page 34
Infant and Child Homicide Deaths in Tennessee………………………………………….. Page 34
Missing Persons in Tennessee by Age, Race, and Sex…………..…………………………. Page 35 Children and Families in Tennessee………………………………………………………………… Page 39 Number and Percent of Single Parent Homes in Tennessee by Race ……………………. Page 39 Number and Percent of Births to Unmarried Families in Tennessee by Race…………… Page 39 Father Share of Parenting Time in Tennessee……………………………………………….. Page 39
Special Acknowledgments
- The Men Collaborative for their support of this project.
- Michael Kullman, Research Assistant for Global Initiative for Boys and Men
- Paige Elliott, Senior Director of Research and Strategy | Tennessee Department of Higher Education
- Tennessee Department of Education Data Management Team | Office of the Chief Program Officer
The Tennessee Report on the Status of Boys and Men was supported by The Men Collaborative. To learn more, go to: https://www.themencollaborative.org/
An introduction from Sean Kullman, coauthor of Boys, A Rescue Plan: Moving Beyond the Politics of Masculinity to Healthy Male Development and President of the Global Initiative for Boys and Men
An analysis of data regarding the outcomes of boys and the outcomes of men in Tennessee has revealed that males continue to experience poorer outcomes in education, physical & mental health, careers, homelessness, and the court systems. This specific report on the Status of Boys and Men in Tennessee will use data as the primary starting point to help us better see where our boys and men stand when it comes to outcomes before identifying solutions that will help our boys, men, families, and communities thrive.
At times, this report will make male and female comparisons—not as a way to underscore Tennessee’s girls and women—but as a way to recognize disparities where they exist and not be afraid to address them as issues where male disparity is greater. For instance, acknowledging that Tennessee males 15-24 years of age account for 75-80% of overdose deaths in their age group does not negate female overdose deaths. It does, however, require us to look at the reasons for these disparities, which are a combination of sexdifferences and cultural practices.
By acknowledging sex-differnces (XX and XY), which I refer to as the first principle, we can begin to recognize that nurturing the nature of boys and understanding the nature of men is an essential component when it comes to getting at the root causes of male outcomes.
Attempts to acknowledge racial disparities, for instance, have failed because that approach does not acknowledge sex-difference. By focusing solely on race while not disaggregating data by both race and sex, those in media, academia, and government easily fall into the Data Conflation Trap (DCT). Data that does not disaggregate by both race and sex will almost always be
misleading and something you will see as you look through the data in this report.
The purpose of this report is to provide the data and solutions policymakers can use to motivate and empower citizens, policymakers, and institutions to create change by:
(1) Becoming a conscientious citizen scientist with friends in your parent groups, schools, and communities.
(2) Becoming conscious of the way media, government, and academia lack asymmetry in its presentation of male and female news, data, and policies.
(3) Exploring data that disaggregates by race and sex when appropriate to see how much the research reveals.
(4) Differentiate sex-differences (male/female) from cultural constructs of masculinity.
There are actions and policies necessary in our homes, schools, communities, public and private institutions, and essential culture conversations that must take place if we hope to see our boys become men who succeed. GIBM hopes this report helps you better understand the needs of our boys, adolescents, and men so that you too can help them grow, learn, thrive, and contribute to our communities.
The Tennessee Report on the Status of Boys and Men was supported by The Men Collaborative.
To learn more, go to: https://www.themencollaborative.org/
Critical Issues Facing Boys and Men in Tennessee Fact Sheet
Education Did you know?
- An analysis of data from over 8.4 million TN test scores in English Language Arts from 2014 to 2024 reveals that boys are behind girls at all grade levels
- An analysis of data from over 8.4 million TN test scores in Math from 2014 to 2024 reveals that boys and girls scores are relatively the same. (While boys are slightly ahead in the earlier grades, that changes by middle school).
- From 2012-2023, TN 4-year public colleges enrolled 130,500 fewer male than female in-state residents.
- From 2012-2023, TN 2-year public colleges enrolled nearly 210,000 fewer male than female in-state residents.
- From 2012-2023, Tennessee enrolled 52,000 fewer males than females in postbaccalaureate programs.
Physical-Mental Health
- From 2018-2023, boys and men accounted for 22,000 suicide, overdose and alcohol deaths, 72% of all deaths of despair.
- From 2018-2023, males accounted for 80% of suicide deaths.
- In 2023, boys and men accounted for 71% of overdose deaths, up from 2018 when males were 63% of overdose deaths.
- Boys of all races are more likely to die of suicide and overdose than their female counterparts and across racial lines.
- White males in Tennessee account for approximately 58% of all deaths of despair but only 37% of the total population 10years-of-age and older.
- Black males in Tennessee account for approximately 11% of all deaths of despair but only 6.7% of the total population 10years-of-age and older.
- From 1999-2023, infant boys and boys 1-4-years of age accounted for 58% of homicide deaths in their age group.
- Black males account for 57% of all homicide deaths, but only represent approximately 6.7% of the total population.
- 60% of missing persons in Tennessee are male.
- Males account for 91% of all work-place fatalities.
- 515,000 children live in a single-parent home and an additional 110,000 children live with neither parent.
- From 2014 to 2024 nearly 500,000 Math and English Language Arts scores were suppressed
- In 2023, there were 161,000 males ages 20-34 not engaged in the labor force
- Males account for the majority of homeless in all demographics.
- 57% of the uninsured are male.
The education data in this report is a comprehensive look at K-12 education as well as two-year, four-year, and post-baccalaureate college outcomes of TN in-state residents. The analysis measures male and female differences by both race/ethnicity and sex and shows that males of all races are behind their female counterparts in K-12 and college education at all levels.
In K-12, Tennessee state test scores as well as data obtained directly from the TN Dept. of Education and TN Dept. of Higher Education was used to complete the analysis.
The data revealed that all boys of all races are behind their female counterparts in English/ Language Arts (ELA) in all grades.
Math scores for boys and girls are relatively similar, with boys showing a slight advantage in early grades but equal to or slightly behind girls in later grades.
Student performance in K-12 is measured in four categories. For this report, proficient and advanced scores were combined to show the number of students who met or exceeded the standard. Standard categories are traditionally:
• Below Basic
• Approaching Expectations
• Met Expectations
• Exceeded Expectations
How Does Tennessee Report on K-12 Data?
Data is suppressed when a student cohort has less than 1% or over 99% of its population’s score fall into one of the four performance measures. In 2016-17, for example, 6,714 fifth-grade black male ELA test scores were suppressed. This means less than 1% of black males or 99% of black males 5th grade scores fell into one of the four performance measures.
Data Suppression Over Time
Data suppression increased from third grade to eighth grade for various cohorts.
From 2014-2024, nearly 500,000 scores have been suppressed and the majority of those suppressions are boys—often black, Hispanic/ Latino, and Native American/Alaska Native cohorts.
In the example below, the number of suppressed data for black males increased over time. While there were no suppressed scores for black males in third grade, there were 37,000 suppressed test scores for black males in eighth grade from 2014-2024. Seventy-five percent of all ELA scores for 8th grade black-males were suppressed from 2014-15 to 2023-24. (Data suppression is a poor practice in K-12 education.)
Number of Suppressed Black-Male ELA Scores by Grade from 2014-2024
Number of Suppressed Scores
State Test Scores in English Language Arts in K-8 Education
An analysis of data from nearly 8.4 million Tennessee test scores in English Language Arts from 2014 to 2024 reveals that boys are behind at all grade levels year after year. Boys are behind in ELA by approximately 10% by eighth grade. These outcomes are likely unrelated to COVID. In 2019, only 23% of eighth grade boys were proficient in ELA, a percentage similar to those in any given year from 2021-2024.
Boys’ and girls’ scores slightly improved from 3rd grade (2021) to 4th grade (2022), but boys were behind girls, a common trend in other grades.
By 5th and 6th grades, the 3rd grade boys from 2021 started to show declines, essentially returning to proficiencies around 30%.
Boys proficiencies in English/ Language Arts in 8th grade are consistently between 18-25%. The outcomes resemble those seen in 2019, preCOVID.
Females Proficient/Advanced Males Proficient/Advanced 4th Grade ELA
High School English
The following proficiency tables are based on 711,503 valid test scores of boys and girls on Tennessee End-of-Course assessments from 2019 to 2024 with an exception for the 2020 COVID year.
• English I (361,648 valid scores)
• English II (349,555 valid scores)
Boys are behind girls in English by double digits. The English/ Language Arts and reading gaps are the largest gaps boys face in the educational system.
In 2023, forty-one percent of girls and thirty percent of boys met or exceeded the End-of-Course proficiency in English I.
In 2024, forty-five percent of boys and fifty-seven percent of girls met or exceeded the proficiency for End-of-Course assessment in English II.
Understanding the English/ Language Arts, and reading deficits remain critical in helping boys thrive in school.
Figure E1. English I Proficiency by Sex and Year
Figure E2. English II Proficiency by Sex and Year
ELA Scores by Race/ Ethnicity & Sex
The following data was received after a request to the Tennessee Department of Education.
Data shows all boys of all races are behind their female counterparts in English/Language Arts and across all grade levels in third through fifth grades.
• Native American/ Alaska Native is represented by NA/AN
• Native Hawaiian/ Pacific Islander is represented by NH/PI
Suppressed 3rd-5th Grade Data from 2014-2024
• 16.7% of black male ELA scores are suppressed.
• 15.1% of Native American/Alaska male ELA scores are suppressed.
• 8.5% of Hispanic/ Latino male ELA scores are suppressed.
• 33,882 male ELA scores and 12,958 female ELA scores were suppressed from 2014-24.
% of 3rd Grade Students
4th Grade Students
ELA Scores by Race/ Ethnicity & Sex
The following data was received after a request to the Tennessee Department of Education.
Data shows all boys of all races are behind their female counterparts in English/Language Arts and across all grade levels in sixth through eighth grades.
• Native American/ Alaska Native is represented by NA/AN
• Native Hawaiian/ Pacific Islander is represented by NH/PI
Suppressed 6th-8th Grade Data from 2014-2024
• 50.1 % of black-male ELA scores are suppressed.
• 24.1% of Native American/Alaska-male ELA scores are suppressed.
• 21.8% of Hispanic/ Latino ELA scores are suppressed.
• 117,142 male ELA scores and 36,612 female ELA scores were suppressed.
% of 6th Grade Students Prof/Adv. in ELA by Race & Sex
% of 7th Grade Students Prof/Adv. in ELA by Race & Sex
ELA Scores by Race/ Ethnicity & Sex
The following data was received after a request to the Tennessee Department of Education.
Data shows all boys of all races are behind their female counterparts in English/Language Arts and across all grade levels in ninth and tenth grades.
• Native American/ Alaska Native is represented by NA/AN
• Native Hawaiian/ Pacific Islander is represented by NH/PI
% of 9th Grade Students Prof/Adv. in ELA by Race & Sex
% of 10th Grade Students Prof/Adv. in ELA by Race & Sex
Important Note: All student data disaggregated by race and sex in English Language Arts (ELA) and Math come from students without a disability. Students with a disability data was too suppressed to consider when it came to disaggregating by race and sex.
State Test Scores in Math in K-8 Education
Analysis of data from nearly 8.4 million TN test scores in math from 2014-2024 reveals girls are slightly ahead of boys in math by eighth grade. Both boys and girls show steady declines in math from third to eighth grades. (Prior to COVID in 2019, girls scored higher than boys in eighth-grade math, 38.2% to 32.3% respectively. NAEP scores slightly differ with 32% of females and 30% of males at/above standard.)
Boys are slightly ahead of girls in 3rd and 4th grade math, but both boys and girls show steady declines by 8th grade where girls hold slightly higher scores.
By 6th grades, math scores are essentially the same. It should be noted, however, that boys and girls maths scores are in decline by 6th grade compared to 4th grade
By 8th grade, girls are slightly ahead of boys. Boys' and girls’ math scores are generally on the decline. The numbers are concerning and resemble those seen in 2019, preCOVID. 3rd
Female Math Proficiency Male Math Proficiency
High School Math
The following proficiency tables are based on 878,726 valid test scores of boys and girls on Tennessee End-ofCourse assessments from 2019 to 2024 with an exception for the 2020 COVID year.
• Algebra I (314,364 valid scores)
• Algebra II (268,066 valid test scores)
• Geometry (296,026 valid test scores)
In 2019 boys were behind girls when it came to meeting/exceeding standards in Algebra I and Algebra II by three percentage-points. After COVID, both boys and girls in subsequent years showed learning losses, but it must be stressed that prior to COVID proficiency levels were under 30% for boys and girls.
In 2019, Geometry proficiencies for boys (33%) was lower than girls (36%), but were relatively similar. Both boys and girls showed COVID learning losses in subsequent years. In 2024, proficiencies for boys (36%) and girls (35%) returned to similar pre-COVID levels.
Fewer than 30% of boys are Proficient in Algebra I and Algebra II and scores are not much better in Geometry.
and Year
Figure A2. Algebra II Proficiency by Sex and Year
Figure G1. Geometry Proficiency by Sex
Figure A1. Algebra I Proficiency by Sex and Year
Math Scores by Race/ Ethnicity & Sex
• All math scores disaggregated by race and sex for grades 3 through 9 are based on scores from students without a disability. (Students with a disability had too much of their data suppressed.)
• Native American/ Alaska Native is represented by NA/ AN
• Native Hawaiian/ Pacific Islander is represented by NH/PI Suppressed 3rd-5th Grade Data Math 2014-2024
• There was no suppressed data in 3rd through 5th grade math.
% of 3rd Grade Students Prof/Adv.
% of 4th Grade Students
% of 5th Grade Students Prof/Adv. in Math by Race & Sex
Math Scores by Race/Ethnicity & Sex
The following data was received after a request to the Tennessee Department of Education.
While males show a slight advantage in the early grades, by middle school boys and girls math scores are nearly the same.
• Native American/ Alaska Native is represented by NA/AN
• Native Hawaiian/ Pacific Islander is represented by NH/PI
Suppressed 6th-8th Grade Data Math 2014-2024
Suppression of data leads to inaccurate measures.
• 20.9% of black-male math scores are suppressed.
• 31,875 male math scores and 20,402 female math scores were suppressed.
Math Scores in 9th and 10th Grade by Race/Ethnicity & Sex
Asian females and Asian males score higher in all grade levels than any other demographic groups. This also holds true in English/Language Arts.
Depending on the racial group, boys’ and girls’ scores in 9th and 10th grade math are relatively the same, less than 1% difference.
Some demographic groups show larger disparities than others. Native American/Alaska Native males score worse than their female counterparts in Algebra I by 6% and Algebra II by 3%.
% of 9th Grade Students
% of 10th Grade Students Prof/Adv. in Math by Race & Sex
Important Note: All student data disaggregated by race and sex in English Language Arts (ELA) and Math come from students without a disability.
Students with a disability data was too suppressed to consider when it came to disaggregating by race and sex.
Figure C2. Percent of the In-State Enrolled Students in Tennessee Two-Year Public Colleges by Sex and Year from 2012-2023
Tennessee has enrolled nearly 210,000 fewer male than female in-state residents into its two-year public colleges from 2012 to 2023.
Additionally, all males of all races are behind their female counterparts in two-year college enrollment. See the table below, which also includes American Indian/Alaska Native (AI/AN).
Table C2. Percent of the In-State Enrolled Students in Tennessee Two-Year Public Colleges by Sex, Race, and Year from 2012-2023
Part Two: Physical & Mental Health
DEATHS OF DESPAIR
Deaths of despair specifically reference losses of life to suicide, overdose, and alcohol. To many of us, suicide, overdose and alcohol are easily seen as separate diseases, but they are equally expressions of the same disease: despair.
Suicide, overdoses, and alcohol related outcomes are the symptoms and mental health is the disease. It is a main reason males are more susceptible, something that does not garner enough attention when it comes to understanding the covert nature of male mental health.
Tennessee’s sons account for 72% of all deaths of despair in the state. Males of all races are more susceptible than their female counterparts and across racial groups. White, Black, Hispanic, and American Indian/Alaska Native males are more likely to die from the diseases of despair than any
female groups per 100,000 population (Deaths 100,000).
Males account for 80% of suicide deaths, 69% of unintentional overdose deaths, and 74% of alcohol deaths across Tennessee.
A full set of graphs are provided on the pages that follow.
Our research was disaggregated by race and sex and—by doing so—revealed that sex more than race is the driving force behind deaths of despair.
Because American Indian-Alaska Native populations were under 100,000, the deaths-of-despair were calculated using the following formula; number of deaths divided by the population and multiplied by 100,000. Some groups were excluded from some tables because there were no recorded deaths or the numbers were suppressed.
“Totals by Sex” includes data that was suppressed by race and sex. This explains the difference when adding demographic groups and comparing it to totals.
Suicide in Tennessee
Boys and men are the primary victims of suicide deaths. The following figures and tables provide the number and rate of suicide deaths by sex and race. In doing so, a clear pattern emerges that shows males are far more likely to die from suicide within racial groups and across racial lines.
Tennessee had 5,800 male suicide deaths from 2018 to 2023 and males accounted for 80% of the total lives lost to suicide, according to the CDC. This data is similar to the data from the Tennessee Department of Health.
“All deaths” listed in Table S1 includes suppressed data as well. This explains the difference when adding by the races listed in the tables and seeing a slight difference in “All Deaths.”
Table S1. Number and Rate of TN Suicide Deaths by Race and Sex
Deaths in TN by Sex 2018-2023
Figure S2. Suicide
Fig. S1: Suicide Deaths
Suicide of 15-34
Year-Olds
Thirty-percent of TN male suicide deaths were between the ages of 15-34 years of age, and there were more males 15-34 years of age who died from suicide than all female age groups combined.
Boys, adolescents, and young men are at a greater risk for suicide for a number of reasons. Boys from singleparent homes are at greater risk.
“All deaths” listed in Table S2 and S3 include suppressed data as well. This explains the difference when adding the number of deaths by race and comparing it to”All Deaths.”
Table S2. Suicide Deaths of 15-24-Year Olds in TN by Race & Sex
There were more males 15-34 years of age who died from suicide than all female age groups combined.
Table S3. Suicide Deaths of 25-34-Year Olds in TN by
Overdose
Deaths in TN
Tennessee had 11,758 male overdose deaths from 2018 to 2023 and males accounted for 69% of the total lives lost to overdose. Black and white males die from overdose at far greater rates than any other male or female cohorts.
The data to the right includes the number of deaths within each racial/ ethnic group by sex as well as the number of deaths per 100,000 population (Deaths 100,000).
Like suicide, males of all races die at greater rates than their female counterparts and often across racial lines.
Male overdose in Tennessee has increased from 63% to 71% of all unintentional overdose deaths from 2018-2023.
A deeper understanding of the covert nature of male mental health is needed to understand contributing factors to deaths of despair.
Table O1. Number and Rate of Overdose Deaths in TN by Race & Sex
Race/Ethnicity
Fig. 03. Percent of Overdose Deaths in TN by Sex
Fig. O2 Overdose Deaths in TN by Sex
Overdose
Deaths in TN
Tennessee had 3,856 male overdose deaths of those 15-34 years of age, and males of all races die at higher rates from overdose than their female counterparts and often across racial lines.
Males 15-24 years-of-age of all races are dying at higher rates than all female groups. Black (106.2), White (98.9), and Hispanic (61.7) males 25-34 years of age experience the highest rate of deaths per 100,000 population.
Moving beyond the politics of masculinity and toward an understanding of male brain-difference is an important step in solving the problem.
Table O2. Overdose Deaths in TN by Race and Sex of 15-24 year olds
Deaths of Despair for Males 15-34 Years of Age
• Males 15-24 Years of Age account for 75% of all deaths of despair (suicide, overdose, and alcohol) in their age group.
• Males 25-34 Years of Age account for 72% of all deaths of despair (suicide, overdose, and alcohol) in their age group.
Alcohol
Deaths in TN
Alcohol related deaths in Tennessee resemble those found nationwide. When disaggregating data by race and sex, data shows that males of all races die from alcohol related causes more than their female counterparts.
Alcohol related deaths have consistently shown that males account for approximately 75% of those deaths. In 2022, there was a slight drop when males accounted for 72% of alcohol related deaths, but that was offset by an increase in suicide deaths and overdose deaths.
When looking at alcohol, suicide, and overdose deaths over time, males have accounted for a greater percentage of deaths of despair from 2018-2023. In 2018, males accounted for 70% of all deaths of despair, that percent has steadily increased to 73.3% by 2023.
Table A1. Alcohol Deaths in TN by Race and Sex from 2018-2023
Race/Ethnicity
Figure A2. Alcohol Induced Deaths over Time by Sex
Figure A1. Alcohol Deaths in TN by Sex within Race from
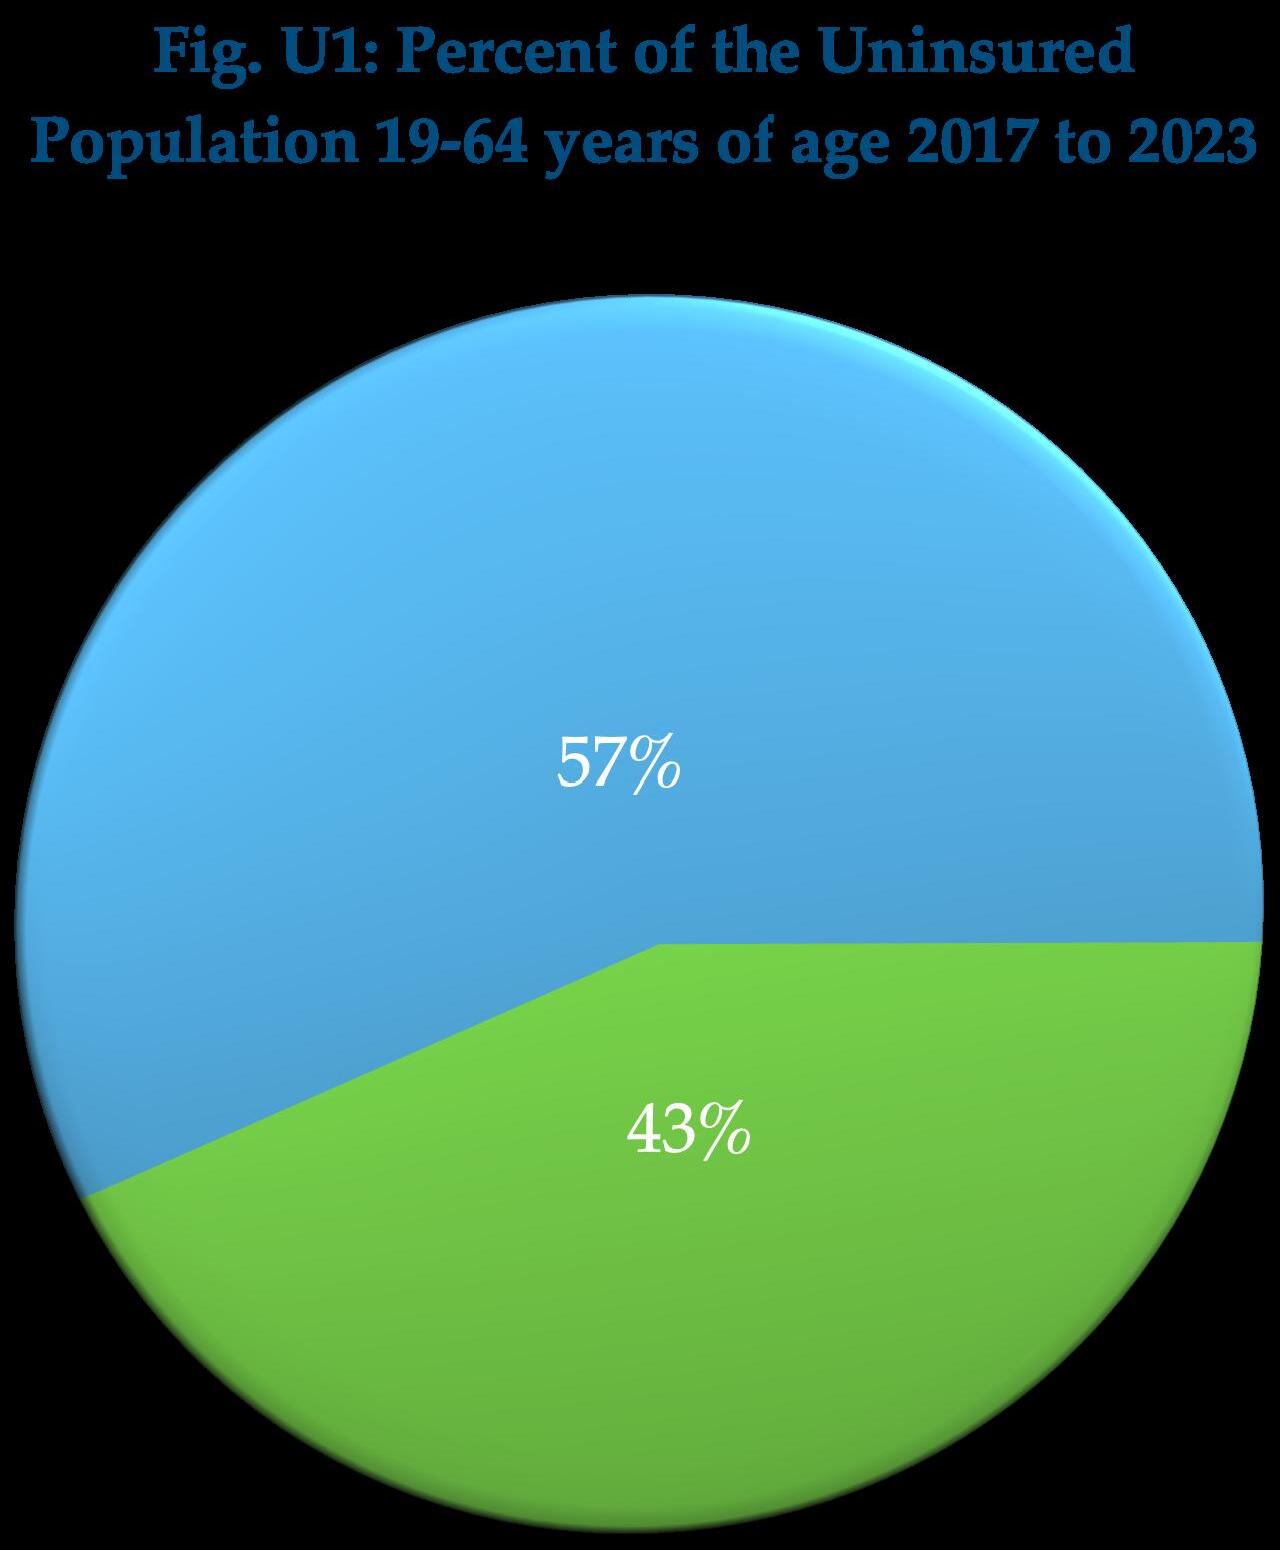
Uninsured in Tennessee
There are over 300,000 uninsured males between the ages of 19-64 in Tennessee each year. They account for 57% of the uninsured population with fewer resources available to them. “The state-federal program for individuals with low-incomes, Medicaid, covered 19% of adult women ages 19 to 64 in 2023, compared to 14% of men” across the nation, according to data from the Kaiser Family Foundation.
In Tennessee, 16.5% and 10% of men receive health insurance through Medicaid and another 2.3% of women and 2.1% of men receive Medicare.
Most women and men are covered by employee sponsored and nongroup insurance programs. Nongroup “includes individuals and families that purchased or are covered as a dependent by nongroup insurance.”
Increasing employment can help decrease the number of uninsured males.
Fig. U2: Number of Uninsured by Sex and Year
Tennessee’s homeless problem impacts men and women and boys and girls.
Males, however, make up the majority of the homeless for a variety of reasons, many related to poor education, unemployment, addiction, and mental health conditions.
In many instances—homeless males turn to the street to self-medicate and become part of an endless cycle of addiction and homelessness. That decision results in thousands of overdose, suicide, and homicide deaths, not only for the homeless, but for others as well who become victims of those who are on the street and in desperate and mentally-ill states.
But it is the male homelessness of our youth, veterans, and the overall homeless population that drive many social ills, often missed because we fail to address the uniqueness of the covert nature of male mental health.
There are approximately 8,280 people who experience homelessness in Tennessee on any given night. It is safe to assume that at least 6,624 are either mentally-ill and/or drug addicted.
HM 1. Percent of Overall Homelessness in Tennessee by Sex
HM 2. Percent of Unaccompanied Youth Homeless in Tennessee by Sex
HM3. Percent of Veteran Homeless in Tennessee by Sex
Figure
Figure
Figure
Part Three: Jobs, Careers, & Financial Health
UNEMPLOYMENT
A look at unemployment in Tennessee does show some mild improvement in the workforce as noticed on the following pages. The unemployment rate, however, is merely one measure of how the labor force is working.
Another factor to consider is the number of males not in the labor force, which is different from the unemployment rate. While the number of men who are not in the labor force has declined for some groups, males 25-29 and 30-34 years-of-age have only moved 1.3% and 0.6% respectively. Which begs the question, why are so many males not in the labor force?
In 2018, the unemployment rate for males 20-24 years of age was 10%, but the total percent of males 20-24 not in the labor force was 22% (48,085 of the of 219,690 male population).
The unemployment rate only takes into consideration the number of people in the labor force and the number of unemployed people. Unemployment numbers do not include those who have stopped looking for work. According to a number of recent articles, it is one of the concerns regarding young men who have stopped working.
Table U1. Percent of Males Not in Labor Force by Age
Number of Men 20-34 Years-of-Age Not in Labor Force in Tennessee by Year
2018: 170,800
2019: 164,260
2020: 170,959 2021: 174,085
2022: 160,777
2023: 160,944
Figure U1. Number of Males Not in Labor Force
Unemployment Rate
The unemployment rate in Tennessee has modestly improved, but those numbers often overlook the number of males who are no longer in the labor force for a number of reasons. Improving the employment rate for males 20-24 would be a step in the right direction if we also keep a closer eye on decreasing the number of males who are part of the cohort “not in the labor force.”
Fatal Occupational Injuries
Males accounted for 91% of Tennessee’s fatal occupational injuries from 2018-2023, and there has been a steady increase in the number and rate of male deaths from 2018 to 2023. Even after accounting for a modest increase in Tennessee’s population from 2018-2023, we estimate there has been at least a 26% increase in the rate of fatal occupational injuries of 20 to 64-year-old males from 2018 to 2023.
Males will take on the high-risk jobs for higher pay.
Table U2. Male Unemployment Rate by Age and Year
Number of Unemployed Males
Year from 2018-2023
Figure F1. Number of Male Work-Place Fatalities by
Figure U2.
Tennessee sees decline in number of male educators
In October of 2019, News Channel-5 Nashville covered a story about the decline in male teachers. The issue is a national one as much as it is a state issue for Tennessee. Males only account for 21% of the teachers in Tennessee and the numbers are unlikely to improve according to data from the Southern Regional Education Board.
Although male teachers can bring a different understanding and dynamic to the classroom and offer a new profession men do not often consider, improving student outcomes also requires an understanding of brain-sex difference and how boys and girls learn differently.
Even as districts may strive to increase the number of men into the education field, there is a more compelling issue to be made for pedagogical approaches in the classroom. There are plenty of female teachers who work well with boys because they understand boys and girls learn differently.
Trades are in high demand in TN. Other professional opportunities are in healthcare.
Figure EM2. Percent of Nurses in Tennessee by Sex
Figure EM3. Percent of Physician Assistants
Part Four: Criminal Justice & Court Systems
School to Prison Pipeline
Males are overwhelmingly represented in school suspensions, juvenile detentions, and prison populations.
Boys who come from fractured families and experience adverse childhood experiences are disproportionately impacted, but they are not the only ones impacted.
When looking at the disciplinary nexus in Tennessee, it is clear that our systems disproportionately impact boys of all ages and men far more. And Tennessee is not unique in this regard. In a study of one school district in California, for instance, I learned that boys in K-3 were as likely or more likely to be suspended than teenage girls in 9-12. My immediate question was: what are boys doing in K-3 to get suspended?
There is a cultural disconnect when it comes to educating our nation’s boys and helping them learn to thrive in life. This cultural disconnect is a reason the school to prison pipeline is partly about the inability to nurture the nature of boys early in life and throughout life.
Male Percent of School Suspensions/Expulsions, Juvenile Detentions, and Prison Population in Tennessee
Percent of TN Students Remanded for Drug Related Offenses by Sex and Year (2018-2023)
Homicide in Tennessee
Although males of all race are killed at greater rates than their female counterparts, homicide deaths overwhelmingly impact black males.
Black males accounted for 57% of all male and female homicide deaths of all races combined, yet black males only represent approximately 6.7% of the population in Tennessee.
When we look at the ages of black males 15-24, 25-34, and 35-44, the numbers of deaths per 100,000 population are 155, 140, and 92 respectively.
Black and Hispanic males die from homicide more than any male and female cohorts by race and sex.
Figure H1. Homicide Deaths by Race and Sex from 2018-2023 Per 100,000 Population
H2. Homicide Deaths of 15-24-Year-Olds by Race and Sex from
Figure H3. Homicide Deaths of 25-34-Year-Olds by Race and Sex from 2018-2023 Per
Population
Did you know?
Infant boys and boys 1-4 years of age in TN accounted for 58% of the homicide deaths in their age group from 1999 to 2023.
Figure
Missing and Unidenti System (NamUS) shows that nearly sixty-percent of the 945 missing persons in Tennessee from June of 2018 to April of 2025 are male.
• 59.4% of missing persons in Tennessee are male.
• 47.6% of missing persons under twenty-years-of-age are male.
• 67% of missing persons twentyone and over are male.
Males of all races are more likely to be missing persons than their female counterparts. (Total number of missing persons by race: Black (268); Hispanic Latino (160); Multi-Race (27); and White (474). American Indian/Alaska Native (2), Asian (5), Other (6), and Uncertain (3) were under 25 combined.
TN Missing Persons by Sex 21-Years of Age and Over
Figure M1. Missing Persons Under 20-Years of Age by Sex
Figure M2. Missing Persons Under 21-60 Years of Age by Sex
Figure M3. Percent of Missing Persons by Race and Sex
Children and Families
515,000 children (boys and girls) in Tennessee live in a single-parent home. An additional 110,000 children live with neither parent. Understanding the number of children in single parent families, the number of children born in unmarried families, and the limited time children spend with their fathers in instances of divorce and separation is important. Children in single parent homes, in the aggregate, struggle more than other children in school, physical & mental health, addiction, homelessness, crime, and with teen pregnancy.
Figure SP 1. Number of Children in Single-Parent Families by Race/Ethnicity in 2023
Figure SP2. Percent of Children in Single-Parent Families by Race/Ethnicity 2023
from 2017 to 2021
Figure B1. Number of Births to Unmarried Families from 2017 to 2021
Figure B2. Percent of Births to Unmarried Families
SOLUTIONS
The First Principle
The data in this report helps us realize that the current practices in place are not helping our boys and our men—and arguably our girls and our women. There are solutions to these challenges if we begin to recognize that braindifferences in males and females are the essential part of the solution but not the only part of the solution.
In contemporary literature that recognizes sexdifferences, you will see the term brain-sex difference, which asserts that male and female differences operate on a male brain spectrum and a female brain spectrum.
Learning, risk-taking, addiction, coping, resiliency, and so many of the operations that form a thriving and resilient person, from childhood and through adulthood, are happening in the grey and white matter of our brains in conjunction with neural, electrical, and chemical variances between boys and girls and men and women. It is easy for us to physically see male and female differences, but it is nearly impossible to see the differences in the brain that manifest in learning, actions, behaviors, and motivations.
Recent studies out of Stanford University are using Artificial Intelligence (AI) in conjunction with brain scan technology to help us see what happens in the brain when males and females perform certain tasks. The new technology accurately predicts whether a male or female is performing a task by monitoring brain activity. This difference, however, has been recognized for decades in various types of brain scans, but the new AI technology is introducing another layer of understanding to the first principle.
The First Principle refers to recognizing sex differences. After all, every cell in the body knows it is either XX or XY. Even as we recognize sex differences, however, we should not ignore cultural components while making sure to avoid blurring the lines that confuse
cultural constructs of gender with the certainty of biological principles.
The first principle should be a part of the following:
• Public Policies
• K-12 and College Education
• Physical & Mental Health Training in schools of counseling, social work, psychology, and medicine.
• Job Training Programs
• Criminal Justice & Court Systems
The First Principle in Public Policy
In March of 2024 during his State of the Union Address, President Joe Biden introduced portions of the 2025 Budget to the nation. Even as deaths of despair among males reached historic proportions and educational outcomes showed boys of all ages and races were behind their female counterparts at all levels of the educational system, boys and men were never mentioned in the budget. Conversely, women and girls were mentioned eighty-one times, gender was mentioned twenty-two times (specifically in regard to women and transgender groups), and LGBTQ and underrepresented groups were mentioned some sixteen times collectively. The word boy and the word man were absent from the $7.2 trillion budget.
Acknowledging this indifference is less about the party in charge, as Republicans have often been unwilling to address the struggles of males openly for fear of a backlash. Even though there does appear to be some recent recognition of male disparity, there has been little done on the policy front to ensure that boys and that men are equally protected in policies at all levels of government. In California, Washington, and some other 40 states, there are publicly funded commissions on the status of women and girls. Regardless of what one thinks about public funds allocated for commissions on the status of woman and girls, the status of boys and men, or the status of LGBTQIA+ groups, it is critical that local, state, and federal policies do not selectively discriminate when determining budgets.
SOLUTIONS CONTINUED
Yearly Hearing on Status of Boys and Men
Policy makers, however, do need verifiable and reliable data because they are the ones elected to manage the public trust. For this reason, a yearly congressional and senate hearing in Tennessee on the status of boys and men before moving on any policy action as it pertains to race, sex, and gender seems warranted. Many lawmakers may not know, for instance, that males account for 80% of the suicide deaths in Tennessee or that all boys of all races are behind their female counterparts in reading across the state. Sexbased differences are at the heart of his issue. A public hearing on boys and on men is needed to inform legislative action.
The First Principle in Education
Recognizing sex-differences in schools of education and teacher training programs is a critical step in changing the landscape of how boys and girls learn. While having more male teachers in school is a noble goal as a career option and having more male role models is good for many children who have no or little interaction with a male teacher or mentor, it is important to recognize that there are female teachers who work well with boys because they know boys and girls need different approaches to thrive.
The Gurian Institute (gurianinstitute.com) has spent more than twenty-five years successfully incorporating boys and girls learn differently models in public and private sector schools and across different socio-economic demographics in states across the country. Their success data can be found on their success page. I would like to disclose that I’ve compiled data for the Gurian Institute and coauthored a book with Michael Gurian, founder of the Gurian Institute.
Key Components to Improving Educational Outcomes
1. Teacher Certification Programs (Every teacher should take a course on Boys and Girls Learn Differently that explores brain-sex
difference and how it functions in and out of the classroom.)
2. Teacher In-Service Days that focus on pedagogical approaches that use a boys and girls learn differently approach.
3. Incorporate student growth percentiles that measure teacher performance against student gains. Are some teachers working better with boys or girls? How can measuring student growth improve teacher/student performance?
4. Avoid data suppression at the state level. Student scores should not be suppressed.
5. Increase the amount of physical activity in schools to allow boys to move more and incorporate this into lesson plans.
The First Principle in Physical & Mental Health
The mental health profession has a shortage of therapists trained in working from a brain-sex difference approach. Therapy has become, according to some reports, a bit more ideological instead of therapeutic. Recognizing brain-sex difference in the treatment process needs to become a core component of counseling, therapy, and treatment.
Key
Components
to Improving Mental Health Outcomes
1. Start two-year training programs at the community college level to increase the number of counselors and social workers trained in brain-sex difference until more counselors and therapists can be trained in four-year colleges and graduate schools.
2. Incorporate brain-sex difference into higher education programs as a part of the certification process to practice counseling, social-work, criminal justice, nursing, psychology, and other professions that involve working with populations in need of physical & mental health considerations. These are just some starting points for handling issues around mental health.
SOLUTIONS CONTINUED
Job Training Programs
Training boys for trades should not become a replacement for a rigorous K-12 education. If anything, modern trades will require more academic skills. Trades are not the place to go for people who do not have academic skills. After all, having the skills to go to college and choosing not to go to college are two different understandings.
Middle schools and high schools should include more trades programs into their curriculums, introducing boys to potential career options in the future. Trades’ classes can also help engage boys in the type of learning activities that are more physical while also incorporating elements of math, reading, and science into the process. Learning, for instance, how to do carpentry, plumbing, and electrical work has important academic components to it while also allowing boys to work with their hands and move around. Community college programs that focus on the trades must be connected with local industries that lead to well-paying careers. For many males who are not going to college and are interested in learning a trade, these training programs are a step forward. (Measuring job-placement from these colleges is a necessary component.)
Criminal Justice and Court Systems
The criminal justice system and court systems cover many different layers of the Tennessee legal system. From family court to criminal court, males are the ones most negatively impacted by the court systems.
In many instances, family court judges are required to make decisions that they believe are in the best interest of the child. More often than not, judges will favor mothers when it comes to the custody of children in instances of separation and divorce, even as data shows that children do best when a mother and father are involved in their lives. Current family court practices are not in the best interest of the child. For instance, data from the U.S. Department of Health &
Human Services showed that child victims of maltreatment in the U.S. happened most frequently in situations where the family arrangement was with mother alone.
U.S. Percentage of Child Victims Maltreated by Mother, Father, and Other Categories
It should be noted that the family court system is a $50 billion dollar industry in the U.S., as noted in the documentary Erasing Family that you can now watch for free.
Judges and members of law-enforcement can benefit from understanding the way sexdifferences impact the interactions lawenforcement and judges have with males.
Our current judicial system can become susceptible to ideological stereotypes when not presented with appropriate data and making decisions that disproportionately impact males. For instance, male reactions with law enforcement are often different than female interactions with law enforcement.
References and Notes
Education
1. “Numbers of Suppressed Black Male ELA Scores by Grade from 2014-2024.” Tennessee Department of Education. Received April 2025. Note: Data was received after an information request to the Tennessee Department of Education asking for student test scores in grades three through eleven disaggregated by race/ethnicity and sex.
2. “State Test Scores in English Language Arts in K-8 Education.” Tennessee Department of Education Data Downloads and Requests. Accessed March 2025. https://www.tn.gov/education/districts/ federal-programs-and-oversight/data/data-downloads.html. Note: The information for graphs on student performance in third through eighth grade English Language Arts (ELA) can be retrieved at the link above and includes student assessment data from 2010 to 2024. Tennessee data on student assessment can be found under “Student Assessment” and under the tab “Assessment Files.”
3. “Figure 1. English I Proficiency by Sex and Year.” Tennessee Department of Education Data Downloads and Requests. Accessed March 2025. https://www.tn.gov/education/districts/federal-programsand-oversight/data/data-downloads.html.
4. “Figure 2. English II Proficiency by Sex and Year.” Tennessee Department of Education Data Downloads and Requests. Accessed March 2025. https://www.tn.gov/education/districts/federalprograms-and-oversight/data/data-downloads.html.
3. “Percent of 3rd Grade Students Proficient/Advanced in ELA by Race/Ethnicity and Sex.” Tennessee Department of Education. Received April 2025. Note: Data was provided by the Tennessee Department of Education after a data request. Student performance disaggregated by race/ ethnicity and sex only includes the results of “students without a disability.” “Students with a disability” scores disaggregated by race/ethnicity and sex were overwhelmingly suppressed.
4. “Percent of 4th Grade Students Proficient/Advanced in ELA by Race/Ethnicity and Sex.” Tennessee Department of Education. Received April 2025. Note: Data was provided by the Tennessee Department of Education after a data request. Student performance disaggregated by race/ ethnicity and sex only includes the results of “students without a disability.” “Students with a disability” scores disaggregated by race/ethnicity and sex were overwhelmingly suppressed.
5. “Percent of 5th Grade Students Proficient/Advanced in ELA by Race/Ethnicity and Sex.”Tennessee Department of Education. Received April 2025. Note: Data was provided by the Tennessee Department of Education after a data request. Student performance disaggregated by race/ ethnicity and sex only includes the results of “students without a disability.” “Students with a disability” scores disaggregated by race/ethnicity and sex were overwhelmingly suppressed.
6. “Percent of 6th Grade Students Proficient/Advanced in ELA by Race/Ethnicity and Sex.” Tennessee Department of Education. Received April 2025. Note: Data was provided by the Tennessee Department of Education after a data request. Student performance disaggregated by race/ ethnicity and sex only includes the results of “students without a disability.” “Students with a disability” scores disaggregated by race/ethnicity and sex were overwhelmingly suppressed.
7. “Percent of 7th Grade Students Proficient/Advanced in ELA by Race/Ethnicity and Sex.” Tennessee Department of Education. Received April 2025. Note: Data was provided by the Tennessee Department of Education after a data request. Student performance disaggregated by race/ ethnicity and sex only includes the results of “students without a disability.” “Students with a disability” scores disaggregated by race/ethnicity and sex were overwhelmingly suppressed.
8. “Percent of 8th Grade Students Proficient/Advanced in ELA by Race/Ethnicity and Sex.” Tennessee Department of Education. Received April 2025. Note: Data was provided by the Tennessee Department of Education after a data request. Student performance disaggregated by race/
ethnicity and sex only includes the results of “students without a disability.” “Students with a disability” scores disaggregated by race/ethnicity and sex were overwhelmingly suppressed.
9. “Percent of 9th Grade Students Proficient/Advanced in ELA by Race/Ethnicity and Sex.” Tennessee Department of Education. Received April 2025. Note: Data was provided by the Tennessee Department of Education after a data request. Student performance disaggregated by race/ ethnicity and sex only includes the results of “students without a disability.” “Students with a disability” scores disaggregated by race/ethnicity and sex were overwhelmingly suppressed.
10. “Percent of 10th Grade Students Proficient/Advanced in ELA by Race/Ethnicity and Sex.” Tennessee Department of Education. Received April 2025. Note: Data was provided by the Tennessee Department of Education after a data request. Student performance disaggregated by race/ ethnicity and sex only includes the results of “students without a disability.” “Students with a disability” scores disaggregated by race/ethnicity and sex were overwhelmingly suppressed
11. “State Test Scores in Math in K-8 Education.” Tennessee Department of Education Data Downloads and Requests. March 2025. https://www.tn.gov/education/districts/federal-programs-andoversight/data/data-downloads.html. Note: The information for graphs on student performance in third through eighth grade Math can be retrieved at the link above and includes student assessment data from 2010 to 2024. Tennessee data on student assessment can be found under “Student Assessment” and under the tab “Assessment Files.”
12. U.S. Department of Education, Institute of Education Sciences, National Center for Education Statistics, National Assessment of Educational Progress (NAEP), 2019, 2022, and 2024 Mathematics Assessments. https://www.nationsreportcard.gov/ndecore/xplore/NDE
13. “Figure A1. Algebra I Proficiency by Sex and Year.” Tennessee Department of Education Data Downloads and Requests. March 2025. https://www.tn.gov/education/districts/federal-programs-andoversight/data/data-downloads.html.
14. “Figure A2. Algebra II Proficiency by Sex and Year.” Tennessee Department of Education Data Downloads and Requests. March 2025. https://www.tn.gov/education/districts/federal-programs-andoversight/data/data-downloads.html.
15. “Figure G2. Geometry Proficiency by Sex and Year.” Tennessee Department of Education Data Downloads and Requests. March 2025. https://www.tn.gov/education/districts/federal-programs-andoversight/data/data-downloads.html.
16. “Percent of 3rd Grade Students Proficient/Advanced in Math by Race/Ethnicity and Sex.” Tennessee Department of Education. Received April 2025. Note: Data was provided by the Tennessee Department of Education after a data request. Student performance disaggregated by race/ ethnicity and sex only includes the results of “students without a disability.” “Students with a disability” scores by race/ethnicity and sex were overwhelmingly suppressed.
17. “Percent of 4th Grade Students Proficient/Advanced in Math by Race/Ethnicity and Sex.” Tennessee Department of Education. Received April 2025. Note: Data was provided by the Tennessee Department of Education after a data request. Student performance disaggregated by race/ ethnicity and sex only includes the results of “students without a disability.” “Students with a disability” scores by race/ethnicity and sex were overwhelmingly suppressed.
18. “Percent of 5th Grade Students Proficient/Advanced in Math by Race/Ethnicity and Sex.” Tennessee Department of Education. Received April 2025. Note: Data was provided by the Tennessee Department of Education after a data request. Student performance disaggregated by race/ ethnicity and sex only includes the results of “students without a disability.” “Students with a disability” scores by race/ethnicity and sex were overwhelmingly suppressed.
19. “Percent of 6th Grade Students Proficient/Advanced in Math by Race/Ethnicity and Sex.” Tennessee Department of Education. Received April 2025. Note: Data was provided by the Tennessee Department of Education after a data request. Student performance disaggregated by race/
ethnicity and sex only includes the results of “students without a disability.” “Students with a disability” scores by race/ethnicity and sex were overwhelmingly suppressed.
20. “Percent of 7th Grade Students Proficient/Advanced in Math by Race/Ethnicity and Sex.” Tennessee Department of Education. Received April 2025. Note: Data was provided by the Tennessee Department of Education after a data request. Student performance disaggregated by race/ ethnicity and sex only includes the results of “students without a disability.” “Students with a disability” scores by race/ethnicity and sex were overwhelmingly suppressed.
21. “Percent of 8th Grade Students Proficient/Advanced in Math by Race/Ethnicity and Sex.” Tennessee Department of Education. Received April 2025. Note: Data was provided by the Tennessee Department of Education after a data request. Student performance disaggregated by race/ ethnicity and sex only includes the results of “students without a disability.” “Students with a disability” scores by race/ethnicity and sex were overwhelmingly suppressed.
22. “Percent of 9th Grade Students Proficient/Advanced in Math by Race/Ethnicity and Sex.” Tennessee Department of Education. Received April 2025. Note: Data was provided by the Tennessee Department of Education after a data request. Student performance disaggregated by race/ ethnicity and sex only includes the results of “students without a disability.” “Students with a disability” scores by race/ethnicity and sex were overwhelmingly suppressed.
23. “Percent of 10th Grade Students Proficient/Advanced in Math by Race/Ethnicity and Sex.” Tennessee Department of Education. Received April 2025. Note: Data was provided by the Tennessee Department of Education after a data request. Student performance disaggregated by race/ ethnicity and sex only includes the results of “students without a disability.” “Students with a disability” scores by race/ethnicity and sex were overwhelmingly suppressed.
24. “Figure C1. Percent of the In-State Enrolled Students in Tennessee Four-Year Public Colleges by Sex and Year from 2012-2023.” Tennessee Department of Higher Education. Received 11 April 2025. Note: Data was provided after an information request to the Tennessee Department of Higher Education by Paige Elliott Senior Director of Research and Strategy.
25. “Table C1. Percent of the In-State Enrolled Students in Tennessee Four-Year Public Colleges by Sex, Race, and Year from 2012-2023.” Tennessee Department of Higher Education. Received 11 April 2025. Note: Data was provided after an information request to the Tennessee Department of Higher Education by Paige Elliott Senior Director of Research and Strategy.
26. “Figure C2. Percent of the In-State Enrolled Students in Tennessee Two-Year Public Colleges by Sex and Year from 2012-2023.” Tennessee Department of Higher Education. Received 11 April 2025. Note: Data was provided after an information request to the Tennessee Department of Higher Education by Paige Elliott Senior Director of Research and Strategy.
27. “Table C2. Percent of the In-State Enrolled Students in Tennessee Two-Year Public Colleges by Sex, Race, and Year from 2012-2023.” Tennessee Department of Higher Education. Received 11 April 2025. Note: Data was provided after an information request to the Tennessee
28. “Figure C3. Percent of the In-State Enrolled Students Pursuing Post-BA Degrees in TN Public Colleges by Sex and Year from 2012-2023.” Tennessee Department of Higher Education. Received 11 April 2025. Note: Data was provided after an information request to the Tennessee Department of Higher Education by Paige Elliott Senior Director of Research and Strategy.
29. “Table C3. Percent of the In-State Enrolled Students Pursuing Post-BA Degrees in Tennessee Public Colleges by Sex, Race, and Year from 2012-2023.” Tennessee Department of Higher Education. Received 11 April 2025. Note: Data was provided after an information request to the Tennessee
Physical and Mental Health
1. “Table D1. Tennessee Deaths of Despair by Race and Sex from 2018-2023.” Centers for Disease Control and Prevention Wonder Database. Accessed March 2025. https://wonder.cdc.gov/ mcd.html. Note: Data is a compilation of suicide, overdose, and alcohol deaths from 2018-2023 from data retrieved from the Centers for Disease Control and Prevention. Links may be removed over time.
2. “Table S1. Number and Rate of TN Suicide Deaths by Race and Sex.” Centers for Disease Control and Prevention, National Center for Health Statistics. National Vital Statistics System, Provisional Mortality on CDC WONDER Online Database. Data are from the final Multiple Cause of Death Files, 2018-2023, and from provisional data for years 2024 and later, as compiled from data provided by the 57 vital statistics jurisdictions through the Vital Statistics Cooperative Program. Accessed at http://wonder.cdc.gov/mcd-icd10-provisional.html on May 2, 2025 2:36:23 PM. http://wonder.cdc.gov/controller/saved/D176/D428F254. Note: Data above includes not Hispanic/Latino.
3. “Table S1. Suicide deaths by race and sex in Tennessee from 2018-2023.” Centers for Disease Control and Prevention, National Center for Health Statistics. National Vital Statistics System, Provisional Mortality on CDC WONDER Online Database. Data are from the final Multiple Cause of Death Files, 2018-2023, and from provisional data for years 2024 and later, as compiled from data provided by the 57 vital statistics jurisdictions through the Vital Statistics Cooperative Program. Accessed at http://wonder.cdc.gov/mcd-icd10-provisional.html on May 2, 2025 2:37:35 PM. http://wonder.cdc.gov/controller/saved/D176/D428F255. Note: Data includes Hispanic/Latino only.
4. “Figure S1. Suicide Deaths in TN by Sex within Race from 2018-2023.” Centers for Disease Control and Prevention Wonder Database. Note: Data was compiled through a data analysis from the links above.
5. “Figure S2. Suicide Deaths in TN by Sex 2018-2023.” Centers for Disease Control and Prevention, National Center for Health Statistics. National Vital Statistics System, Provisional Mortality on CDC WONDER Online Database. Data are from the final Multiple Cause of Death Files, 2018-2023, and from provisional data for years 2024 and later, as compiled from data provided by the 57 vital statistics jurisdictions through the Vital Statistics Cooperative Program. Accessed at http://wonder.cdc.gov/mcd-icd10-provisional.html on May 3, 2025 1:02:38 PM http://wonder.cdc.gov/controller/saved/D176/D434F945.
6. “Table S2. Suicide Deaths of 15-24-Year Olds in TN by Race & Sex.” Centers for Disease Control and Prevention, National Center for Health Statistics. National Vital Statistics System, Provisional Mortality on CDC WONDER Online Database. Data are from the final Multiple Cause of Death Files, 2018-2023, and from provisional data for years 2024 and later, as compiled from data provided by the 57 vital statistics jurisdictions through the Vital Statistics Cooperative Program. Accessed at http://wonder.cdc.gov/mcd-icd10-provisional.html on May 2, 2025 2:39:17 PM http://wonder.cdc.gov/controller/saved/D176/D428F256. Accessed April 2025. Note: Data includes not Hispanic/Latino (above) as well as Hispanic/Latino listed below.
7. Table S2. Suicide Deaths of 15-24-Year Olds in TN by Race & Sex.” Centers for Disease Control and Prevention, National Center for Health Statistics. National Vital Statistics System, Provisional Mortality on CDC WONDER Online Database. Accessed: 10 March 2025. http:// wonder.cdc.gov/controller/saved/D176/D428F257. Note: Link to Hispanic/Latino origin.
8. “Table S3. Suicide Deaths of 25-34-Year Olds in TN by Race & Sex.” Centers for Disease Control and Prevention, National Center for Health Statistics. National Vital Statistics System, Provisional Mortality on CDC WONDER Online Database. Data are from the final Multiple Cause of Death Files, 2018-2023, and from provisional data for years 2024 and later, as compiled from data provided by the 57 vital statistics jurisdictions through the Vital Statistics Cooperative Program. Accessed at http://wonder.cdc.gov/mcd-icd10-provisional.html on May 2, 2025
2:39:17 PM http://wonder.cdc.gov/controller/saved/D176/D428F256. Note: Data includes not Hispanic/Latino (above) as well as Hispanic/Latino listed below.
9. “Table S3. Suicide Deaths of 25-34-Year Olds in TN by Race & Sex.” Centers for Disease Control and Prevention, National Center for Health Statistics. National Vital Statistics System, Provisional Mortality on CDC WONDER Online Database. http://wonder.cdc.gov/controller/saved/ D176/D428F257. Note: Link to Hispanic/Latino origin.
10. “Suicide Prevention in Tennessee: 2023 Annual Report.” Division of Family Health and Wellness, Tennessee Department of Health. July 2023. Accessed: 5 March 2025. https://www.tn.gov/ content/dam/tn/health/program-areas/vipp/Suicide-Prevention-Annual-Report-2023.pdf
11. “Table O1. Number and Rate of Overdose Deaths in TN by Race & Sex.” Centers for Disease Control and Prevention, National Center for Health Statistics. National Vital Statistics System, Provisional Mortality on CDC WONDER Online Database. Data are from the final Multiple Cause of Death Files, 2018-2023, and from provisional data for years 2024 and later, as compiled from data provided by the 57 vital statistics jurisdictions through the Vital Statistics Cooperative Program. Accessed at http://wonder.cdc.gov/mcd-icd10-provisional.html on May 2, 2025 5:10:35 PM. http://wonder.cdc.gov/controller/saved/D176/D428F258. Note: Data includes not Hispanic/Latino (above) as well as Hispanic/Latino listed below.
12. “Table O1. Number and Rate of Overdose Deaths in TN by Race & Sex.” Centers for Disease Control and Prevention, National Center for Health Statistics. National Vital Statistics System, Provisional Mortality on CDC WONDER Online Database. Accessed: 10 March 2025. http:// wonder.cdc.gov/controller/saved/D176/D428F259. Note: Link to Hispanic/Latino origin.
13. “Figure 02. Overdose Deaths in TN by Sex within Race from 2018-2023.” Note: Data was compiled through a data analysis from the links above.
14. “Fig. 03. Percent of Overdose Deaths in TN by Sex 2018-2023. “Centers for Disease Control and Prevention, National Center for Health Statistics. National Vital Statistics System, Provisional Mortality on CDC WONDER Online Database. Data are from the final Multiple Cause of Death Files, 2018-2023, and from provisional data for years 2024 and later, as compiled from data provided by the 57 vital statistics jurisdictions through the Vital Statistics Cooperative Program. Accessed at http://wonder.cdc.gov/mcd-icd10-provisional.html on May 3, 2025 12:52:16 PM http://wonder.cdc.gov/controller/saved/D176/D434F944
15. “Table 02. Overdose Deaths in TN by Race and Sex of 15-24 year olds 2018-2023.” Centers for Disease Control and Prevention, National Center for Health Statistics. National Vital Statistics System, Provisional Mortality on CDC WONDER Online Database. Data are from the final Multiple Cause of Death Files, 2018-2023, and from provisional data for years 2024 and later, as compiled from data provided by the 57 vital statistics jurisdictions through the Vital Statistics Cooperative Program. Accessed at http://wonder.cdc.gov/mcd-icd10-provisional.html on May 2, 2025 5:30:15 PM. http://wonder.cdc.gov/controller/saved/D176/D428F261
16. “Table 02. Overdose Deaths in TN by Race and Sex of 15-24 year olds 2018-2023.” Centers for Disease Control and Prevention, National Center for Health Statistics. National Vital Statistics System, Provisional Mortality on CDC WONDER Online Database. http://wonder.cdc.gov/ controller/saved/D176/D428F262. Note: Link to Hispanic/Latino origin.
17. “Table O3. Overdose Deaths in TN by Race and Sex of 25-34 year olds.” Centers for Disease Control and Prevention, National Center for Health Statistics. National Vital Statistics System, Provisional Mortality on CDC WONDER Online Database. Data are from the final Multiple Cause of Death Files, 2018-2023, and from provisional data for years 2024 and later, as compiled from data provided by the 57 vital statistics jurisdictions through the Vital Statistics Cooperative Program. Accessed at http://wonder.cdc.gov/mcd-icd10-provisional.html on May 2, 2025 5:30:15 PM. http://wonder.cdc.gov/controller/saved/D176/D428F261
18. “Table O3. Overdose Deaths in TN by Race and Sex of 25-34 year olds.” Centers for Disease Control and Prevention, National Center for Health Statistics. National Vital Statistics System, Provisional Mortality on CDC WONDER Online Database. http://wonder.cdc.gov/ controller/saved/D176/D428F262. Note: Link to Hispanic/Latino origin.
19. “Table A1. Alcohol Deaths in TN by Race and Sex from 2018-2023.” Centers for Disease Control and Prevention, National Center for Health Statistics. National Vital Statistics System, Provisional Mortality on CDC WONDER Online Database. Data are from the final Multiple Cause of Death Files, 2018-2023, and from provisional data for years 2024 and later, as compiled from data provided by the 57 vital statistics jurisdictions through the Vital Statistics Cooperative Program. Accessed at http://wonder.cdc.gov/mcd-icd10-provisional.html on May 2, 2025 5:36:13 PM. http://wonder.cdc.gov/controller/saved/D176/D428F264
20. “Table A1. Alcohol Deaths in TN by Race and Sex from 2018-2023.” Centers for Disease Control and Prevention, National Center for Health Statistics. National Vital Statistics System, Provisional Mortality on CDC WONDER Online Database. http://wonder.cdc.gov/controller/saved/ D176/D428F265. Note: Link to Hispanic/Latino origin.
21. “Figure A1. Alcohol Deaths in TN by Sex within Race from 2018-2023.” Centers for Disease Control and Prevention, National Center for Health Statistics. National Vital Statistics System, Provisional Mortality on CDC WONDER Online Database. http://wonder.cdc.gov/ controller/saved/D176/D428F266.
22. “Figure A1. Alcohol Deaths in TN by Sex within Race from 2018-2023.” Centers for Disease Control and Prevention, National Center for Health Statistics. National Vital Statistics System, Provisional Mortality on CDC WONDER Online Database. http://wonder.cdc.gov/ controller/saved/D176/D428F267. Note: Link to Hispanic/Latino origin.
23. “Figure A2. Alcohol Induced Deaths over Time by Sex.” Centers for Disease Control and Prevention, National Center for Health Statistics. National Vital Statistics System, Provisional Mortality on CDC WONDER Online Database. Data are from the final Multiple Cause of Death Files, 2018-2023, and from provisional data for years 2024 and later, as compiled from data provided by the 57 vital statistics jurisdictions through the Vital Statistics Cooperative Program. Accessed at http://wonder.cdc.gov/mcd-icd10-provisional.html on May 3, 2025 12:21:24 PM http://wonder.cdc.gov/controller/saved/D176/D434F943
24. “Figure U1 Percent of Uninsured Population 19-64 Years-of-Age from 2017-2023.” Kaiser Family Foundation. Accessed April 2025. https://www.kff.org/other/state-indicator/healthinsurance-coverage-of-men-19-64/?
dataView=0¤tTimeframe=0&selectedRows=%7B%22states%22:%7B%22tennessee%22: %7B%7D%7D%7D&sortModel=%7B%22colId%22:%22Location%22,%22sort%22:%22asc%22% 7D. Note: Yearly data on men was compiled by using the “Time Frame” refine results.
25. “Figure U1 Percent of Uninsured Population 19-64 Years-of-Age from 2017-2023.” Kaiser Family Foundation. Accessed April 2025. https://www.kff.org/other/state-indicator/healthinsurance-coverage-of-women-19-64/?
dataView=1¤tTimeframe=0&selectedRows=%7B%22states%22:%7B%22tennessee%22: %7B%7D%7D%7D&sortModel=%7B%22colId%22:%22Location%22,%22sort%22:%22asc%22% 7D. Note: Yearly data on women was compiled by using the “Time Frame” refine results.
26. “Figure U2 Number of Uninsured by Sex and Year 2017-2023.” Kaiser Family Foundation. Accessed April 2025. https://www.kff.org/other/state-indicator/health-insurance-coverage-ofmen-19-64/?
dataView=1¤tTimeframe=0&selectedRows=%7B%22states%22:%7B%22tennessee%22: %7B%7D%7D%7D&sortModel=%7B%22colId%22:%22Location%22,%22sort%22:%22asc%22% 7D. Note: Yearly data on men was compiled by using the “Time Frame” refine results.
27. “Figure U2. Percent of Uninsured Population 19-64 Years-of-Age from 2017-2023.” Kaiser Family Foundation. Accessed April 2025. https://www.kff.org/other/state-indicator/healthinsurance-coverage-of-women-19-64/?
dataView=0¤tTimeframe=0&selectedRows=%7B%22states%22:%7B%22tennessee%22: %7B%7D%7D%7D&sortModel=%7B%22colId%22:%22Location%22,%22sort%22:%22asc%22% 7D. Note: Yearly data on women was compiled by using the “Time Frame” refine results.
28. “Figure HM1: Percent of Overall Homelessness in Tennessee by Sex from 2016-2024.” 2024 US Department of Housing and Urban Development. https://www.hudexchange.info/resource/ 3031/pit-and-hic-data-since-2007/. Note: Data was compiled by looking at yearly data results.
29. “Figure HM2: Percent of Unaccompanied Youth Homeless in Tennessee by Sex.” 2024 US Department of Housing and Urban Development. https://www.hudexchange.info/resource/3031/pitand-hic-data-since-2007/. Note: Data was compiled by looking at yearly data results.
30. “Figure HM3: Percent of Veteran Homeless in Tennessee by Sex.” 2024 US Department of Housing and Urban Development. https://www.hudexchange.info/resource/3031/pit-and-hic-datasince-2007/. Note: Data was compiled by looking at yearly data results.
Jobs, Careers, and Financial Health
1. “Table U1. Percent of Males Not In Labor Force by Age 2018-2023.” U.S. Census Bureau, U.S. Department of Commerce. "Sex by Age by Employment Status for the Population 16 Years and Over." American Community Survey, ACS 1-Year Estimates Detailed Tables, Table B23001, 2023. Accessed April 23, 2025. Note: Percent was compiled using the yearly sources below. The last four numbers of the URL indicate a specific year of data.
2. “Table U1. Percent of Males Not In Labor Force by Age 2018-2023.” U.S. Census Bureau, U.S. Department of Commerce. "Sex by Age by Employment Status for the Population 16 Years and Over." American Community Survey, ACS 1-Year Estimates Detailed Tables, Table B23001, 0118. Accessed April 23, 2025. https://data.census.gov/table?
3. “Table U1. Percent of Males Not In Labor Force by Age 2018-2023.” U.S. Census Bureau, U.S. Department of Commerce. "Sex by Age by Employment Status for the Population 16 Years and Over." American Community Survey, ACS 1-Year Estimates Detailed Tables, Table B23001, 2019. Accessed April 23, 2025.https://data.census.gov/table?
4. “Table U1. Percent of Males Not In Labor Force by Age 2018-2023.” U.S. Census Bureau, U.S. Department of Commerce. "Sex by Age by Employment Status for the Population 16 Years and Over." American Community Survey, ACS 1-Year Estimates Detailed Tables, Table B23001, 2020. Accessed April 23, 2025.https://data.census.gov/table?
5. “Table U1. Percent of Males Not In Labor Force by Age 2018-2023.” U.S. Census Bureau, U.S. Department of Commerce. "Sex by Age by Employment Status for the Population 16 Years and Over." American Community Survey, ACS 1-Year Estimates Detailed Tables, Table B23001, 2021. Accessed April 23, 2025. https://data.census.gov/table?
6. “Table U1. Percent of Males Not In Labor Force by Age 2018-2023.” U.S. Census Bureau, U.S. Department of Commerce. "Sex by Age by Employment Status for the Population 16 Years and Over." American Community Survey, ACS 1-Year Estimates Detailed Tables, Table B23001, 2022. Accessed April 23, 2025.https://data.census.gov/table?
7. “Table U1. Percent of Males Not In Labor Force by Age 2018-2023.” U.S. Census Bureau, U.S. Department of Commerce. "Sex by Age by Employment Status for the Population 16 Years and Over." American Community Survey, ACS 1-Year Estimates Detailed Tables, Table B23001, 2023. Accessed April 23, 2025.https://data.census.gov/table?
8. “Figure U1. Numbers of Males Not in Labor Force by Age and Year.” Note: Data compiled using the yearly data sources above from the U.S. Census Bureau American Community Survey years 2018-2023.
9. Auerbach, Klara. “Eight Charts Show Men Are Falling Behind, From Classrooms to Careers.” Bloomberg News. 11 April 2025.
10. “Table U2. Male Unemployment Rate by Age and Year.” Note: Data compiled using the yearly data sources above from the U.S. Census Bureau American Community Survey, years 2018-2023.
11. “Figure F1. Number of Male Work Place Fatalities by Year from 2018-2023.” Injuries, Illnesses, and Fatalities: Fatal occupational injuries in Tennessee. Bureau of Labor Statistics 2018 to 2023. Accessed March 2025. Note: Data was compiled using the yearly workplace fatality data from the Bureau of Labor Statistics below.
—Fatal occupational injuries by selected characteristics, by major event or exposure, Tennessee, 2018. Bureau of Labor Statistics. Accessed March 2025. https://www.bls.gov/iif/state-data/ fatal-occupational-injuries-in-tennessee-2018.htm
—Fatal occupational injuries by selected characteristics, by major event or exposure, Tennessee, 2019. Bureau of Labor Statistics. Accessed March 2025. https://www.bls.gov/iif/state-data/ fatal-occupational-injuries-in-tennessee-2019.htm
—Fatal occupational injuries by selected characteristics, by major event or exposure, Tennessee, 2020. Bureau of Labor Statistics.. Accessed March 2025. https://www.bls.gov/iif/state-data/ fatal-occupational-injuries-in-tennessee-2020.htm
—Fatal occupational injuries by selected characteristics, by major event or exposure, Tennessee, 2021. Bureau of Labor Statistics.. Accessed March 2025. https://www.bls.gov/iif/state-data/ fatal-occupational-injuries-in-tennessee-2021.htm
—Fatal occupational injuries by selected characteristics, by major event or exposure, Tennessee, 2022. Bureau of Labor Statistics. https://www.bls.gov/iif/state-data/fatal-occupational-injuriesin-tennessee-2022.htm
—Fatal occupational injuries by selected characteristics, by major event or exposure, Tennessee, 2023. Bureau of Labor Statistics. https://www.bls.gov/iif/state-data/fatal-occupational-injuriesin-tennessee-2023.htm
12. “Figure EM1. Percent of K-12 Educators in TN by Sex and Year.” Southern Regional Board of Education. Accessed 10 March 2025. https://www.sreb.org/post/teacher-demographicdata#:~:text=During%20the%202022%2D23%20school,diversity%20of%20the%20student%20p opulation.
13. Horan, Kyle. “Tennessee sees decline in male teachers.” News Channel 5: Nashville. Updated 6:39 PM, Oct 10, 2019. Accessed March 2025. https://www.newschannel5.com/news/tennesseesees-decline-in-number-male-educators
14. “Figure EM2. Nurse Practitioners in Tennessee by Sex.” Kaiser Family Foundation. Special data request for information on active state licensed nurse practitioners from Redi-Data, Inc. January 2025. https://www.kff.org/other/state-indicator/total-number-of-nursepractitioners-by-gender/?
15. “Figure EM3. Percent of Physician Assistant in Tennessee by Sex.” Kaiser Family Foundation. Special data request for information on professionally active state licensed physicians assistants from Redi-Data, Inc, January 2025. https://www.kff.org/other/state-indicator/total-physicianassistants/?
1. “Tennessee Suspension and Expulsion Counts for 2022-23.” Tennessee Department of Education. Accessed April 23, 2025. https://www.tn.gov/education/searchresults.html#q=suspension&tab=department&numberOfResults=50
2. “Youth in Detention Survey.” Tennessee Commission on Children and Youth. https://www.tn.gov/ content/dam/tn/tccy/documents/data-snapshots/2023_Youth_in_Detention_Survey.pdf
3. “Prison Population.” Tennessee Department of Corrections. Accessed April 2025. https:// www.tn.gov/correction/statistics/annual-reports.html
4. “Percent of Students Remanded for Drug Related Offenses by Sex and Year 2018-2023.” Tennessee Department of Education. Accessed April 2025. Note: Information needs to be retrieved from individual excel files in the database. https://www.tn.gov/education/searchresults.html#q=suspension&tab=department&numberOfResults=50
5. “Figure H1. Homicide Deaths by Race and Sex from 2018-2023 Per 100,000 Population.” Centers for Disease Control and Prevention, National Center for Health Statistics. National Vital Statistics System, Provisional Mortality on CDC WONDER Online Database. Accessed: 10 March 2025. Note: Data includes not Hispanic/Latino (above) as well as Hispanic/Latino listed below. http://wonder.cdc.gov/controller/saved/D176/D428F250
6. “Figure H1. Homicide Deaths by Race and Sex from 2018-2023 Per 100,000 Population.” Centers for Disease Control and Prevention, National Center for Health Statistics. National Vital Statistics System, Provisional Mortality on CDC WONDER Online Database. Accessed: 10 March 2025. Note: Data includes not Hispanic/Latino. http://wonder.cdc.gov/controller/saved/D176/ D428F251
7. “Figure H2. Homicide Deaths by Race and Sex of 15-24 Year-Olds from 2018-2023 Per 100,000 Population.” Centers for Disease Control and Prevention, National Center for Health Statistics. National Vital Statistics System, Provisional Mortality on CDC WONDER Online Database. Accessed: 10 March 2025. Note: Data includes not Hispanic/Latino (above) as well as Hispanic/Latino listed below. http://wonder.cdc.gov/controller/saved/D176/D428F252
8. “Figure H2. Homicide Deaths by Race and Sex of 15-24 Year-Olds from 2018-2023 Per 100,000 Population.” Centers for Disease Control and Prevention, National Center for Health Statistics. National Vital Statistics System, Provisional Mortality on CDC WONDER Online Database. Accessed: 10 March 2025. Note: Data includes not Hispanic/Latino. http:// wonder.cdc.gov/controller/saved/D176/D428F253
9. “Figure H2. Homicide Deaths by Race and Sex of 25-34 Year-Olds from 2018-2023 Per 100,000 Population.” Centers for Disease Control and Prevention, National Center for Health Statistics. National Vital Statistics System, Provisional Mortality on CDC WONDER Online Database. Accessed: 10 March 2025. Note: Data includes not Hispanic/Latino (above) as well as Hispanic/Latino listed below. http://wonder.cdc.gov/controller/saved/D176/D428F252
10. “Figure H2. Homicide Deaths by Race and Sex of 25-34 Year-Olds from 2018-2023 Per 100,000 Population” Centers for Disease Control and Prevention, National Center for Health Statistics. National Vital Statistics System, Provisional Mortality on CDC WONDER Online Database. Accessed: 10 March 2025. Note: Data includes not Hispanic/Latino. http://wonder.cdc.gov/ controller/saved/D176/D428F253
11. “Homicide Deaths of Infant and 1-4-Year-Olds from 1999 to 2017.” Centers for Disease Control and Prevention, National Center for Health Statistics. National Vital Statistics System, Mortality 1999-2020 on CDC WONDER Online Database, released in 2021. Data are from the Multiple Cause of Death Files, 1999-2020, as compiled from data provided by the 57 vital statistics jurisdictions through the Vital Statistics Cooperative Program. Accessed at http:// wonder.cdc.gov/mcd-icd10.html on May 4, 2025 4:17:28 PM. http://wonder.cdc.gov/ controller/saved/D77/D435F001.
12. “Homicide Deaths of Infant and 1-4-Year-Olds from 2018 to 2023.” Centers for Disease Control and Prevention, National Center for Health Statistics. National Vital Statistics System, Provisional Mortality on CDC WONDER Online Database. Data are from the final Multiple Cause of Death Files, 2018-2023, and from provisional data for years 2024 and later, as compiled from data provided by the 57 vital statistics jurisdictions through the Vital Statistics Cooperative Program. Accessed at http://wonder.cdc.gov/mcd-icd10-provisional.html on May 4, 2025 4:23:21 PM. http://wonder.cdc.gov/controller/saved/D176/D435F002.
13. Missing Persons. National Missing and Unidentified Persons System (NamUs). US Department of Justice: Office of Justice Programs. Accessed 30 April 2025. Note: Accessing data requires registering with NamUS and downloading and compiling data from a CSV file. https:// namus.nij.ojp.gov/
—“Figure M1. Missing Persons 20-Years-of-Age and Under.”
— “Figure M2. Missing Persons 21 to 60 Years-of-Age.”
—“Figure M3.” Missing Persons by Race and Sex.”
—“Percent of Missing Person 21 and Over.”
Children & Families
1. “Percent of Babies Born to Unmarried Mothers by State.” Centers for Disease Control and Prevention. Accessed March 2025. https://www.cdc.gov/nchs/pressroom/sosmap/unmarried/ unmarried.htm
2. “Figure SP 1. Number of Children in Single-Parent Families by Race/Ethnicity in 2023.” Annie E. Casey Foundation. Accessed March 2025. https://datacenter.aecf.org/data/customreports/ 44,6420/107.
3. “Figure SP 2. Percent of Children in Single-Parent Families by Race/Ethnicity in 2023. Accessed March 2025. https://datacenter.aecf.org/data/customreports/44,6420/107
4. “Figure B1. Number of Births to Unmarried Families from 2017 to 2021.” Annie E. Casey Foundation. https://datacenter.aecf.org/data/customreports/44/9212
5. “Figure B2. Percent of Births to Unmarried Families from 2017 to 2021.” Annie E. Casey Foundation. https://datacenter.aecf.org/data/customreports/44/9212
6. Freeman, Rosalyn. “New Tennessee bill could shift custody battles toward equal parenting time.” Fox 13. 27 March 2025. Accessed March 20, 2025. https://www.fox13memphis.com/news/new-
7. “How much custody time does Dad get in your state?” Custody Exchange. Accessed March 2025. https://www.custodyxchange.com/topics/research/dads-custody-time-by-state.php
8. “2025 Shared Parenting Report Card.” National Parents Organization. Accessed March 2025. https:// static1.squarespace.com/static/5e28a95cdc8bed16729b93de/t/ 6808d74075666d0d8957f974/1745409858378/NPO+Report+Card+2025.pdf. Note: There is also an interactive map to look at NPO’s assessment of all states, https://public.tableau.com/ app/profile/nationalparentsorg/viz/2025SharedParentingReportCardMap/2025Map.
Solutions
1. Kullman, Sean and Gurian, Michael. Boys, A Rescue Plan: Moving Beyond the Politics of Masculinity to Healthy Male Development. Gurian Institute Press. 2025. Note: Boys, A Rescue Plan includes solutions to the problems mentioned in this report.
2. Srikanth Ryali, Yuan Zhang, Carlo de los Angeles, Kaustubh Supekar, and Vinod Menon. “Deep learning models reveal replicable, generalizable, and behaviorally relevant sex differences in human functional brain organization.” Proceedings of the National Academy of Sciences. 20 February 2024. Accessed March 2024. https://www.pnas.org/doi/10.1073/ pnas.2310012121#acknowledgments.
3. Davis, Lisa. “How Therapists Became Social Justice Warriors.” Free Press. 17 May 2023. Accessed April 2025. https://www.thefp.com/p/how-therapists-became-social-justice-warriors.
4. “U.S. Percentage of Child Victims Maltreated by Mother, Father, and Other Categories.” U.S. Department of Health & Human Services, Administration for Children and Families, Administration on Children, Youth and Families, Children’s Bureau. (2020). Child Maltreatment 2018. https://acf.hhs.gov/sites/default/files/documents/cb/cm2018.pdf
5. Gentile, Ginger. Erasing Family Documentary. April 2020. https://erasingfamily.org. Note: “In North America, over 25 million parents are being erased from their children’s lives after divorce and separation. The Erasing Family documentary follows young adults fighting to reunite with their broken families. Learn how children benefit from shared parenting and family court reform.”