4 minute read
INSIGHTs & INTUITION Q.
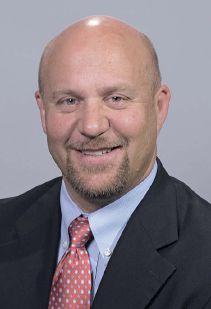
Pete Wasberg Director, Human Resources and Safety Otter Tail Power Company Fergus Falls, Minn.

Our primary efforts include frequent one-to-one, manager-toemployee conversations – whether face-to-face or via video or email – along with monthly in-person safety and informational meetings for each remote work group.
We also publish a twice-weekly company newsletter (which includes videos), broadcast quarterly livestreams from our president and hold annual employee townhalls.
And every member of our executive team is partnered with a remote work group that they visit at least twice a year. With all the changes taking place in our industry, we strive for consistency in communications.
Staying true to our value of enthusiasm, we at Blue Cross Blue Shield of North Dakota focus on continually building a supportive remote culture from the ground up.

We’ve invested in video technology to allow face-to-face connections during meetings, we have open chat rooms, and when possible, we offer remote workers the same opportunities to participate in events as onsite employees.
Last but not least, we periodically send surprise care packages to remote employees with things such as T-shirts, giveaways and gift cards. Our remote employees also have organically built a supportive network to help each other navigate their unique employee experience.
Kelsey Roth Director of Human Resources Operations
Blue Cross Blue Shield of North Dakota Fargo, N.D.

With more than 150 team members spread among three offices and working remotely in 23 states, Stoneridge Software understands the importance of building culture over distance.
One of the most important things to consider with remote team members is choosing and using the right communication tools. We use many modes of communication including email, instant messaging, Microsoft Teams and video calls – all which expedite the relationshipand trust-building process.
We also insist on weekly department meetings where all are expected to participate by sharing their “personal” and “professional” best for the week. This intersection of what’s important to each person both at work and home reinforces a culture of friendship and fun in addition to competence and professionalism.
Scearcy Chief People Officer Stoneridge Software Barnesville, Minn.
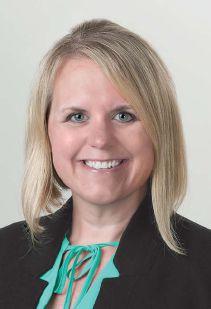
Tracy Zierke Manager, Human Resources Noridian Healthcare Solutions Fargo, N.D.


Noridian is headquartered in Fargo, but we have 650 remote workers spread across 44 states. That is 42 percent of our workforce!
Keeping remote workers engaged is challenging. Our onboarding program lays the groundwork for engaging remote staff, connecting them with the information, tools and resources they need. But keeping them engaged really comes down to taking the extra effort.
• Be intentional. Carve time out to share personal interests and build relationships; keep consistent team touchpoints with meaningful and effective agendas; send a quick Skype message just to say “Hi” and check on how things are going.
• Be available. Set “free” time on your calendar, respond to Skype messages and promptly return phone calls. Don’t create a culture where the only time remote employees hear from you is when you deliver bad news or an increase in workload.
• Recognize their value. Send them hand-written notes, include them in employee focus groups, and seek their input during meetings.
• Foster a sense of purpose. Physical distance can create an “us versus them” feeling, so we work hard to promote inclusion through our words and actions. We emphasize that we all work toward our goal of delivering solutions that put people first. We are each part of the solution.
MID-AMERICAN ECONOMY REPORT
Leading Economic Indicators, last 20 months (50.0 = Growth Neutral)
FARGO’S GDP GROWING MORE SLOWLY, STEADILY THAN STATE’S
Index = 100 in 2001
200 150
U.S. FARGO
The May Creighton University Mid-America Business Conditions Index “fell to a still solid reading signaling positive, but slowing, growth for the region over the next three to six months.
“The Business Conditions Index, which ranges between 0 and 100, declined to 54.3 from April’s 55.9. This is the second straight decline in the overall index, but the 30th straight month the index has remained above growth neutral 50.0.
Source: Creighton University
“The regional economy continues to expand at a positive pace,” said Ernie Goss, PhD, director of Creighton University’s Economic Forecasting Group.
“However, tariffs and flooding across several states pulled the overall index below growth neutral for four states: Iowa, Nebraska, North Dakota and Oklahoma.”
Percentage Of Jobs At High Risk Of Automation By Metro And Nonmetro Areas
100
50 2001 2017 2016 2015 2014 2013 2012 2011 2010 2009 2008 2007 2006 2005 2004 2003 2002
Source of graphic: Federal Reserve Bank of Minneapolis
Source of data: Bureau of Economic Analysis
AVERAGE STUDENT LOAN DEBT BY STATE, CLASS OF 2017
Source of graphic: Federal Reserve Bank of Minneapolis

Source of data: Brookings Institution and the Bureau of Labor Statistics
“In the Ninth District, 26 percent of the existing jobs are at ‘high risk’ of automation over the next several decades, a percentage point higher than the national average. ...
“The highest concentrations are in rural areas of the district, with nonmetropolitan counties in western Wisconsin and far western North Dakota leading the way. About a third of the jobs in those counties are at high risk. Especially numerous are truck drivers and restaurant workers.”
FREDDIE MAC AVERAGE 30-YEAR FIXED MORTGAGE RATES
April 1971 to June 2019
15
9th District = 26.2% 5
= 25.2% 10
Source of graph: Mortgage News Daily
UTAH Avg. Debt per Borrower: $18,425 % change from Class of ‘16: -2.05 % 39% NEVADA Avg. Debt per Borrower: $22,026 % change from Class of ‘16: -8.73 % 49% WYOMING Avg. Debt per Borrower: $22,524 % change from Class of ‘16: -11.25 % 47% MINNESOTA Avg. Debt per Borrower: $31,231 % change from Class of ‘16: -0.35 % 68% DELEWARE Avg. Debt per Borrower: $34,144 % change from Class of ‘16: 1.47 % 62% PENSYLVANIA Avg. Debt per Borrower: $36,193 % change from Class of ‘16: 2.87% 67% ALABAMA Avg. Debt per Borrower: $31,861 % change from Class of ‘16: 1.93 % 50% 53% NEW MEXICO Avg. Debt per Borrower: $21,805 % change from Class of ‘16: 2.3 % 50% CALIFORNIA Avg. Debt per Borrower: $22,383 % change from Class of ‘16: -0.47 % 66% NORTH DAKOTA Avg. Debt per Borrower: $26,080 % change from Class of ‘16: 1.03 % 73% SOUTH DAKOTA Avg. Debt per Borrower: $31,332 % change from Class of ‘16: -0.59 % 74% NEW HAMPSHIRE Avg. Debt per Borrower: $33,462 % change from Class of ‘16: -4.78 % 64% RHODE ISLAND Avg. Debt per Borrower: $35,371 % change from Class of ‘16: 15.78 % Proportion of grads w/ debt
Source: LendEDU.com


