Issue No 65 August 2015
Flood modelling flood depth information, but the insurance industry are very keen on having a simple and consistent measure of flood risk for one building relative to another. To tackle this market Ambiental developed a scoring system which utilises an algorithm to formulate a summary risk score out of a hundred. The resultant FloodScore is driven by the flood hazard and a calculation of an average annualised loss prediction.
Analysing flood risk across Great Britain Through the FloodScore project Ambiental created a detailed database of flood risk for every property in Great Britain. This data can provide some interesting insights into the pattern of flood risk and highlight how it varies regionally (Fig 7). Overall it shows that 20% of properties had some level of flood risk and that 2.6 million properties have a high risk. These results are broadly consistent with figures published by the EA for England and Wales. Combined FloodScore is the aggregated risk posed by all three flood types: fluvial; pluvial; and tidal. The
Figure 7: A regional view of combined flood risk within Great Britain – showing mean property level risk scores out of 100 (©Ambiental 2015).
joining the geography jigsaw
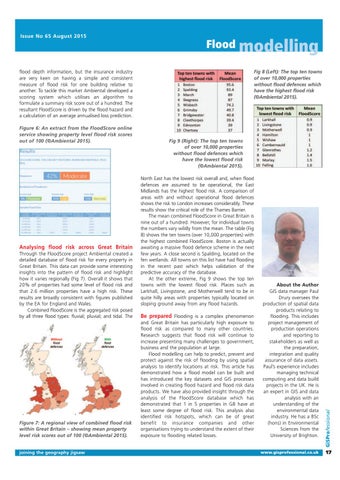
Fig 9 (Right): The top ten towns of over 10,000 properties without flood defences which have the lowest flood risk (©Ambiental 2015). North East has the lowest risk overall and, when flood defences are assumed to be operational, the East Midlands has the highest flood risk. A comparison of areas with and without operational flood defences shows the risk to London increases considerably. These results show the critical role of the Thames Barrier. The mean combined FloodScore in Great Britain is nine out of a hundred. However, for individual towns the numbers vary wildly from the mean. The table (Fig 8) shows the ten towns (over 10,000 properties) with the highest combined FloodScore. Boston is actually awaiting a massive flood defence scheme in the next few years. A close second is Spalding, located on the fen wetlands. All towns on this list have had flooding in the recent past which helps validation of the predictive accuracy of the database. At the other extreme, Fig 9 shows the top ten towns with the lowest flood risk. Places such as Larkhall, Livingstone, and Motherwell tend to be in quite hilly areas with properties typically located on sloping ground away from any flood hazards.
Be prepared Flooding is a complex phenomenon and Great Britain has particularly high exposure to flood risk as compared to many other countries. Research suggests that flood risk will continue to increase presenting many challenges to government, business and the population at large. Flood modelling can help to predict, prevent and protect against the risk of flooding by using spatial analysis to identify locations at risk. This article has demonstrated how a flood model can be built and has introduced the key datasets and GIS processes involved in creating flood hazard and flood risk data products. We have also provided insight through the analysis of the FloodScore database which has demonstrated that 1 in 5 properties in GB have at least some degree of flood risk. This analysis also identified risk hotspots, which can be of great benefit to insurance companies and other organisations trying to understand the extent of their exposure to flooding related losses.
About the Author GIS data manager Paul Drury oversees the production of spatial data products relating to flooding. This includes project management of production operations and reporting to stakeholders as well as the preparation, integration and quality assurance of data assets. Paul’s experience includes managing technical computing and data build projects in the UK. He is an expert in GIS and data analysis with an understanding of the environmental data industry. He has a BSc (hons) in Environmental Sciences from the University of Brighton.
www.gisprofessional.co.uk
GiSProfessional
Figure 6: An extract from the FloodScore online service showing property level flood risk scores out of 100 (©Ambiental 2015).
Fig 8 (Left): The top ten towns of over 10,000 properties without flood defences which have the highest flood risk (©Ambiental 2015).
17