with


Empowering the geospatial community www.gim-international.com Issue 4+5 2023 Volume 37
Gender-sensitive design of land administration systems A conversation
FIG President Diane Dumashie Exploring the full potential of mobile laser scanning
Uncovering the challenges of urban digital twins Identifying and ranking the barriers
Director Strategy & Business Development
Durk Haarsma
Financial director Meine van der Bijl
Technical director Huibert-Jan Lekkerkerk
Contributing Editors Dr Rohan Bennett, Frédérique Coumans
Head of Content Wim van Wegen
Copy-editor Lynn Radford, Englishproof.nl
Marketing Advisor Myrthe van der Schuit
Circulation Manager Adrian Holland
Design ZeeDesign, Witmarsum, www.zeedesign.nl
GIM International, one of the worldwide leading magazines in the geospatial industry, is published eight times per year by Geomares. The magazine and related website and newsletter provide topical overviews and reports on the latest news, trends and developments in geomatics all around the world. GIM International is orientated towards a professional and managerial readership, those leading decision making, and has a worldwide circulation.
Subscriptions
GIM International is available eight times per year on a subscription basis. Geospatial professionals can subscribe at any time via https://www.gim-international.com/subscribe/ print. Subscriptions will be automatically renewed upon expiry, unless Geomares receives written notification of cancellation at least 60 days before expiry date.
Advertisements
Information about advertising and deadlines are available in the Media Planner. For more information please contact our marketing advisor: myrthe.van.der.schuit@geomares.nl.
Editorial Contributions
All material submitted to Geomares and relating to GIM International will be treated as unconditionally assigned for publication under copyright subject to the editor’s unrestricted right to edit and offer editorial comment. Geomares assumes no responsibility for unsolicited material or for the accuracy of information thus received. Geomares assumes, in addition, no obligation to return material if not explicitly requested. Contributions must be sent for the attention of the head of content: wim.van.wegen@geomares.nl.
The changing game of geospatial data analysis and management

In this interview, Trimble’s Scott Crozier and Boris Skopljak talk about the company’s latest developments in mobile and aerial mapping, the integration of sensors to enhance precision and streamline workflows, and the increasing level of autonomy in mining applications.
Spatial planning in the city of Zagreb
The city of Zagreb has been developing a semantic 3D city model since 2008. The city spatial planning sector was recognized as the main project user and developer. With improvements now taking the city model towards a digital twin, the positive impact is expected to become even greater.
Uncovering the challenges of urban digital twins
In this article, the authors identify the challenges of operating digital twins in the urban context through a bifurcated and multi-dimensional approach: a systematic literature review and an expert survey, organizing them across technical and non-technical dimensions.
Gender-sensitive design of land administration systems

The design of land administration systems needs to meet gender-sensitive requirements in order to better understand and strengthen the documentation and recordation of women’s land rights. So as a blueprint for building a land administration system, is the LADM gendersensitive?
Geomares
P.O. Box 112, 8530 AC Lemmer, The Netherlands

T: +31 (0) 514-56 18 54
F: +31 (0) 514-56 38 98 gim-international@geomares.nl www.gim-international.com
No material may be reproduced in whole or in part without written permission of Geomares.


Copyright © 2023, Geomares, The Netherlands
All rights reserved. ISSN 1566-9076
Maximizing mobile laser scanning for infrastructure monitoring


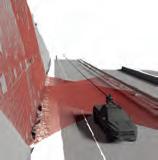
This article focuses on the geometric quality of mobile laser scanning and proposes a method to enhance it to a level where it can be effectively employed for civil infrastructure monitoring. This research is motivated not by mere curiosity, but by an urgent necessity.

5 Editorial 6 Headlines 48 Organizations
Transforming the collection of highprecision geodetic monitoring data
Basetime aims to revolutionize monitoring by combining the expertise of a leading IoT developer and a geodetic services provider. The company name is a combination of ‘baseline’ plus ‘time’: the two ingredients needed to obtain accurate GNSS measurements at the necessary timestamps
Interview with Diane Dumashie, FIG President

Less than six months into her term of office, GIM International spoke to Diane Dumashie, president of FIG (2023-2026), to hear about her experiences so far. Here, she shares her perspectives on a key milestone – the FIG Working Week 2023 in Orlando, USA – and discusses her future intentions as FIG president.

Digitizing Israel’s road network with high-end geospatial technology
Israel’s national roads company is digitizing its entire network through a large-scale project. Kav Medida has won the contract to map the network’s northern half. This article explores the geospatial data capture and utilization methods employed, along with innovative solutions to boost productivity and reduce operational costs.
Cover story
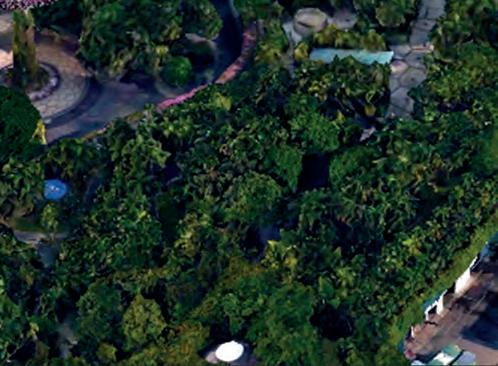
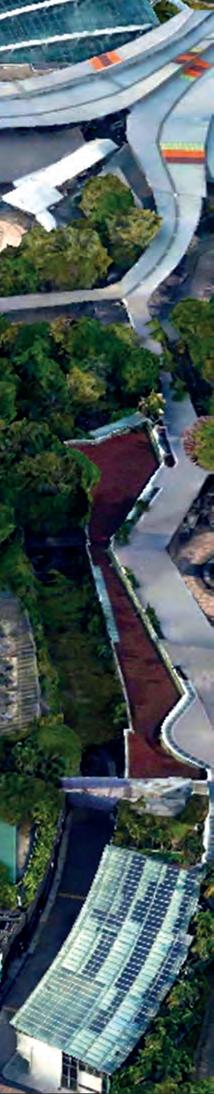
The state-of-the-art of urban digital twins is mainly driven by technology concerning data and techniques. As the popularity of urban digital twins continues to grow, it is always good to look at successful and inspiring examples, such as the national digital twin of Singapore. The image on the front cover shows part of a 3D reality mesh of the famous Gardens by the Bay. (Image courtesy: Singapore Land Authority)

3 Contents Issue 4+5 2023
10 32 14 36 18 38 26 45 www.gim-international.com design of land administration systems FIG President Diane Dumashie Exploring the full potential of mobile laser scanning Uncovering the challenges of urban digital twins Identifying and ranking the barriers To subscribe to GIM International go to www.gim-international.com/subscribe


Inspire the younger generation!
In today’s rapidly evolving world, the fields of mapping, surveying and geospatial technology play a pivotal role in shaping our understanding of the Earth’s physical and social landscape. However, as we have regularly highlighted in GIM International in recent years, attracting young talent to these disciplines can be a challenge. While it is important to keep drawing attention to this challenge, it is more fulfilling to report on initiatives that could help to turn the tide. As covered in more detail in the ‘Headlines’ section of this issue of GIM International, two inspiring examples have emerged recently.
The first is a German campaign called ‘Weltvermesserer’ aimed at getting the younger generation excited about mapping and surveying. The interactive social media campaign introduces geospatial technology to school pupils and students. By demonstrating the real-world applications of mapping and surveying in various industries, such as urban planning and environmental management, the campaign hopes to motivate youngsters to pursue a career in this field.

Meanwhile, in Singapore, a collaborative initiative has been launched to harness the potential of artificial intelligence (AI) in geospatial solutions. The alliance of academia, industry experts and government agencies is organizing a geospatial-oriented AI challenge which encourages participants to develop innovative AI algorithms and models that can enhance mapping and surveying processes. The initiative seeks to improve the efficiency and accuracy of geospatial data collection, analysis and interpretation by leveraging AI’s capabilities, such as image recognition and data analysis.
As both of these examples show, when it comes to encouraging young people to enter the geospatial industry, it’s all about inspiration! By actively engaging students in interactive activities and hands-on experiences, the German campaign creates an environment that sparks curiosity and highlights the relevance of our profession. Meanwhile, the initiative in Singapore demonstrates the power of collaboration, with the added benefit of providing a platform for talented individuals to showcase their expertise and innovation in the realm of AI.
Above all, both initiatives recognize the importance of attracting young people to geospatial disciplines. Because ultimately, sparking the younger generation’s enthusiasm for mapping, surveying and geospatial technology is crucial for driving future advancements and ensuring sustainable development and progress in our interconnected world.
In my view, we have a clear message to get across: Capturing, processing, modifying, analysing and utilizing geospatial data is diverse, dynamic, challenging and – most importantly – indispensable in our rapidly changing society. And thanks to the wide range of applications for geospatial data, our industry offers talented professionals a very varied and rewarding career with an abundance of prospects. I hope that the two examples mentioned above will trigger other similar initiatives in countries across the globe, paving the way for a brighter future by inspiring many more young individuals to join us!


 Wim van Wegen, head of content wim.van.wegen@geomares.nl
Issue 4+5 2023 5 Editorial
Focusing on True Performance
• Extended Reflectorless range: About 1000m


• Quicker measurement time: Less than 1 second


• Longer operation time: About 50 hours with dual/hot-swap batteries

Positioning System G2U


• Powerful GNSS engine compatible with all GNSS systems: GPS, GLONASS, Galileo, Beidou and QZSS.


• Integrated battery for easy power charge via USB cable.


• Compact, light-weighted and robust housing.
• Intergated tilt compensation function. •


Station V-100N Series V-101N I V-102N I V-102NL (V-101N,
V-102NL TI Asahi Co., Ltd. International Sales Department 4-3-4 Ueno Iwatsuki-Ku, Saitama-Shi Saitama, 339-0073 Japan www.pentaxsurveying.com/en/ Tel.: +81-48-793-0118 E-mail: International@tiasahi.com
Total
V-102N)
The
and
to
New New
design
specifications of the products are subject
change without notice.
NavVis broadens scope with VLX 3 mapping solution

The NavVis VLX 3 has been unveiled as a groundbreaking advancement in reality capture technology. This is the latest addition to the NavVis VLX product family by the specialist in reality capture and digital factory solutions. Equipped with two high-end, 32-layer Lidars specifically designed and calibrated for the surveying industry, the NavVis VLX 3 delivers highly detailed and precise point clouds with minimal noise and drift, even at long range. Its enhanced SLAM robustness makes it a fitting solution for a wide range of projects, including outdoor endeavours such as topographic and road surveys, as well as complex indoor environments. While introducing the NavVis VLX 3, NavVis remains committed to providing reliable and accurate solutions to its customers worldwide, enabling them to scan, process and leverage vast amounts of data from various sites in less time. This dedication to advancing the technology allows customers to confidently undertake scanning projects with increased efficiency.
Harnessing geospatial AI for forest conservation

The European Parliament has taken a significant step forward in the fight against deforestation by adopting a groundbreaking law to prevent the import of products associated with deforestation. However, effective implementation and enforcement of this law will necessitate the use of advanced technologies. Geospatial artificial intelligence (AI), represented by companies like Picterra, holds immense potential in this regard. Leveraging geospatial AI empowers authorities, organizations and businesses to revolutionize their monitoring, enforcement and mitigation strategies, thus safeguarding forests and fostering a sustainable future. Geospatial AI excels at detecting changes in land use and forest cover swiftly and accurately through the analysis of satellite and drone imagery. This technology enables real-time monitoring of deforestation and degradation activities in remote areas, facilitating prompt identification and response to violations of the new EU law. By comparing historical and current imagery data, geospatial AI can assess deforestation risks effectively. Authorities can identify areas with significant deforestation or forest degradation, enabling prioritized inspections and enhanced enforcement of the law.
German campaign aims to get youngsters excited about mapping and surveying
The German Association for Geodesy (DVW) has launched a campaign to build young people’s awareness of the exciting career opportunities in the geospatial industry. The world of geoinformation is diverse, dynamic, challenging and – most importantly – indispensable in our rapidly changing world. While surveyors and other geospatial professionals are obviously aware of this fact, the realm of mapping and surveying remains abstract and unfamiliar to the average person. The German campaign is aimed at addressing this to bring about a radical transformation and attract much-needed young talent. The initiative, undertaken by InteressenGemeinschaft Geodäsie (IGG) – the geospatial interest group formed by DVW together with German Association of Publicly Appointed Surveyors (BDVI) and the Association of German Surveyors (Deutscher Vermessungsingenieure/ VDV) – takes the shape of a social media campaign on Facebook and Instagram, titled ‘Weltvermesserer’. Translated literally as ‘world surveyor’, the name is a play on the German word for idealist: Weltverbesserer (literally, ‘world improver’). The primary objective of this admirable campaign – which will hopefully serve as an example for other countries to follow – is to ignite young people’s interest in the field of geodesy.


7 Headlines Issue 4+5 2023
The objective of the Weltvermesserer campaign is to entice young talent towards embarking on a career in the geospatial industry.
Picterra is at the forefront of efforts to combat deforestation, powered by its cloudnative and machine learning platform. (Image courtesy: Picterra)
NavVis VLX 3 unlocks a vast array of opportunities for reality capture.
RIEGL VMR


ROBOTIC RAIL LASER SCANNING SYSTEM


• automated stop & go solution for high precision 3D measurements
• fast and easy setup, transportable in a standard car
• >6 h continuous operation with only one battery
• track gauge adjustable from 1,000 mm to 1,435 mm

• RTK GNSS possible via internal or external receiver


• external control points can be integrated into the workflow
• internal data storage


Singaporean alliance organizes geospatial-oriented AI challenge
In collaboration with AI Singapore, the Singapore Land Authority (SLA) has launched an innovative challenge centered on visual localization, aimed at addressing how AI can accurately extract camera pose data from 2D images. This is an essential concept in computer vision that refers to the exact position and orientation of a camera in 3D space relative to reference coordinate systems. AI Singapore is a partnership between economic agencies and academia. The search for new solutions that combine artificial intelligence (AI) and geospatial technology fits in with Singapore’s role as a leader in technology and innovation. AI technologies have revolutionized 3D mapping, benefiting smart city applications and improving quality of life. However, acquiring 3D data is expensive, hindering frequent or large-scale updates. To overcome this, researchers and technologists are investigating the use of AI to extract 3D information from readily available 2D images. Through advancements in visual odometry, the organizers of the AI challenge aim to expand 3D learning, making it affordable and sustainable for diverse real-world applications. Participants of the challenge are tasked with developing AI models capable of accurately extracting camera pose data from a provided set of 2D monocular images. The results must be submitted in a prescribed plain text format. This exciting competition offers a platform for talented individuals and teams to showcase their expertise and innovation in the realm of AI.

Issue 4+5 2023 Headlines
Gardens by the Bay, Singapore.
Austria | USA | Japan | China | RIEGL WORLDWIDE | Australia | Canada | United Kingdom NEW
EXTREMELY COMPACT AND ROBUST ROBOTIC SOLUTION FOR RAILROAD MAPPING APPLICATIONS
Watch the video! www.riegl.com
Trimble introduces new 3D laser scanning system

Trimble has recently announced the Trimble X9 3D laser scanning system, a versatile reality capture solution for surveying, construction and engineering professionals. The X9 is built on Trimble’s proven laser scanning technologies and is engineered to enhance performance in various environments. It incorporates innovations such as Trimble X-Drive technology for automatic instrument calibration, survey-grade self-levelling, and a laser pointer for georeferencing. The new Trimble X9 expands on the industry-proven Trimble X7, offering longer range, higher accuracy, shorter scan times and exceptional sensitivity. These improvements lead to better scan results and increased productivity. Advanced processing and a high-performance laser enhance the sensitivity of all scans, positioning the X9 at the forefront of capturing difficult dark or reflective surfaces. Additionally, a new centre unit design enhances signal transmission, resulting in better scan quality. With its more efficient reality capture capabilities, the X9 widens the range of potential applications for customers in surveying, building construction, oil and gas, rail, forensics, monitoring, tunnelling, mining and other fields. The newly developed laser scanning system is designed to offer substantial time savings while providing extremely accurate and reliable data. This capability enables confident decision-making, both in the field and in the office, by allowing in-field registration within Trimble Perspective and Trimble FieldLink. This innovative feature minimizes the requirement for target deployment, streamlining the workflow.
Field buys AI drone-tech firm PrecisionHawk
Field has announced its acquisition of PrecisionHawk, a US-based artificial intelligence (AI) and drone technology company for infrastructure management. With a premium client list of Fortune 500 companies,
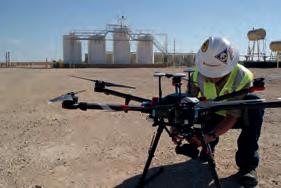
PrecisionHawk supports Field’s international growth strategy, particularly in terms of expansion in the USA. “We’re on a mission to build and maintain a better tomorrow with smarter and more sustainable insights from geospatial data. We’re thrilled to merge our products and technology to offer world-class infrastructure management solutions to customers across the US, Europe and beyond,” says Cato Vevatne, CEO of Field. The two companies’ proprietary software and inspection technologies using artificial intelligence and machine learning offer an exciting new inspection and analytics solution to the US infrastructure and energy sectors. Field is a renowned provider of digital reality services in Europe, specializing in utilizing a combination of software, sensors and autonomous technologies to improve efficiency and reliability in the infrastructure, construction, environment and public sectors. Its innovative approach puts data to work in practical ways, streamlining operations and enhancing performance. Meanwhile, PrecisionHawk is a leading industry player with a comprehensive offering that spans from high-quality data collection to advanced AI algorithms which provide actionable intelligence. As a result, the company is well-equipped to deliver end-to-end solutions that support a variety of needs and use cases.
Leica Geosystems unveils autonomous mobile mapping solution

Leica Geosystems, part of Hexagon, has introduced the Leica Pegasus TRK100 as the latest addition to its portfolio of mobile mapping solutions. Specifically designed for GIS professionals, the new mobile mapping system is a powerful, user-friendly geospatial solution built for large-scale infrastructure measurement and digital twin creation. The Pegasus TRK portfolio is known for its simplicity, lightweight yet robust design, and integration with intelligent, autonomous systems. The Pegasus TRK100 is lighter and smaller, weighing just 14kg, which makes it easy for just one person to mount on any vehicle. The new mobile mapping system features the same modular hardware approach that allows users to add more cameras to expand the range of use cases. The Pegasus TRK100 is designed to excel in GIS mapping and asset management applications, providing essential location intelligence for georeferenced visual data. Tailored for GIS professionals, it
empowers them to transform their business operations. The system puts control into their hands for quick and autonomous data collection and asset information capture.


9 Headlines Issue 4+5 2023
Trimble)
PrecisionHawk is known for its top-tier services, including data collection, advanced AI algorithms and actionable intelligence.
The Leica Pegasus TRK100 is engineered to accelerate the evolution of autonomy and artificial intelligence in mobile mapping.
How is the role of surveyors evolving in the age of AI?
The changing game of geospatial data analysis and management
Technological advancements are opening up numerous professional opportunities that extend beyond the traditional surveying role. In this interview, Scott Crozier, Vice President of Survey & Mapping at Trimble Geospatial, and Boris Skopljak, Vice President of Survey & Mapping Product and Strategy at Trimble, talk about the company’s latest developments in mobile and aerial mapping, the integration of sensors to enhance precision and streamline workflows, and the increasing level of autonomy in mining applications. They also discuss the evolving role of surveyors and the transformative impact of artificial intelligence (AI) and machine learning on geospatial data collection and analysis.
Compared with your own experiences at the beginning of your surveying and engineering careers, how has the role of the surveyor changed?
Scott Crozier: I first started in the survey space over 24 years ago, largely working in civil construction. Our primary job was to stake out sites to guide earthmoving machines. That role has changed considerably. Surveyors today are managing data, assuring data integrity and providing the constructible models to machines digitally. For many roles on the construction site such as the machine operator, foreman, supervisor and grade checker, it’s a huge transition from field work to managing data from multiple resources. The other noticeable change I see is that rather than going out recording only the points that are needed for a specific task, we are now capturing an entire scene, which enables us to get different points of interest anytime later without having to go back to the field.
Boris Skopljak: I started surveying in high school over 20 years ago, and at that time it was all about geometry and following the rules and abiding by best practices to achieve millimetre accuracy. The fundamentals haven’t changed, and remain what we pride ourselves on as geospatial professionals. Of course, technology has made our job less manual and has allowed surveyors to rely on robust equipment with better QA/QC tools. Today, surveyors must be data managers, able to look holistically at the flow of geospatial information so they can respond to increasing demands from clients. That shift has been amplified by the move from capturing points to capturing reality. In other words, we are collecting and managing more information than ever, using a more diverse toolset. We’re not
focused on singular point geometry, but on the entire context of the site. That evolution in technology has allowed access for those outside of the pure surveying profession. Professionals who understand engineering and the fundamental surveying principles can be quite successful in providing the necessary geospatial context and information in various industries, such as construction, utilities, mining, telecommunications, gaming, anywhere where geospatial positioning is needed, enabling them to make themselves indispensable.
How do you see AI and machine learning tools changing the way we collect, analyse and use geospatial data in the future?
Crozier: The increasing availability of AI is driving the increased use of reality capture. Without AI technology, capturing entire sites would be far less valuable; it’s just too much data for humans to really use effectively.
AI provides surveyors a reason to do a full reality capture and gives them the tools to extract information as needed. It’s a big part of how the surveyor’s job is shifting from fieldwork to the office.
10 Issue 4+5 2023
Interview with Scott Crozier and Boris Skopljak, Trimble / By Wim van Wegen, GIM International
Skopljak: AI has shifted the balance of field versus office time –and, in many ways, the skillset of the surveyor. It’s forcing us to start thinking less about points, lines and polygons, and more about objects and their spatial context. Consider mobile mapping or 3D laser scanning. A survey team can collect kilometres’ worth of topographic data to engineering specifications and then extract the necessary detail as needed for a specific project later in the comfort of the office. With the help of AI, this can significantly reduce deliverable creation time compared to traditional topo. Additionally, I believe that AI and machine learning will improve existing quality assurance capabilities by taking some of the logic of the topology and object relationships into consideration, eliminating outliers in the data and streamlining deliverable creation.
Which new advancements can we expect from Trimble in the field of mobile and aerial mapping in the coming years?
Skopljak: It’s all about modularity: the ability to use best-in-class components that address a certain challenge or application. I believe sensors will go from today’s more familiar, tightly coupled solutions to more of a plug-and-play scenario, where sensors can be swapped out as needed. The UAV (uncrewed aerial vehicle or ‘drone’, Ed.) market is a great example that demonstrates the ability to swap out GNSS, Lidar or camera sensors as needed and adapt the post-processing software to suit. There’s a lot of elasticity in terms of where that data can go. That flexibility allows the surveyor to use the best sensor for the given task, provide them confidence and speed in the data collection, and place the focus where it should be, which is on data extraction and data management.
Crozier: We have spent many years focusing on improving a singular technology, like improving the accuracy of optical measurement or improving the accuracy of GNSS measurements – and the surveyor will always require accurate point measurement. The difference is that with sensor integration in the future, we’ll be able to augment that position to improve workflows and to capture an entire scene. The integration of the IMU was the first step, allowing surveyors to capture a point more accurately and safely without having to level the rod. The next step is to integrate other sensors, such as imaging, Lidar, and more, not only to further improve on the amount of information we can capture at one time, but also to use these sensors to improve the precision of the GNSS or optical measurements.
What do you regard as some of the most intriguing examples of new opportunities emerging due to the increasing level of autonomy in many applications?
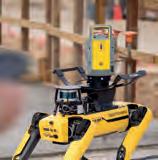
Crozier: Autonomy is a layer of Trimble’s platform that we leverage for construction, mining and surveying applications. Autonomy already exists in many forms today in surveying, and whether through drone or a terrain robot like Spot, these types of autonomous solutions will continue to evolve for dangerous, repetitive or labourintensive applications. The acceleration of AI capabilities is going to facilitate the development of autonomous survey machines that collect remote measurements. There will be places where remote monitoring won’t work, and the surveyor will have the tools to augment with autonomous surveying or mapping solutions. Simultaneous localization and mapping (SLAM) technologies will be increasingly leveraged in our solutions, not only enabling autonomy, but also improving field work productivity.
Skopljak: Building on the sensor fusion and modularity, we all know that redundancy is king in the autonomous space, driving some of the sensor miniaturization, edge computing and AI. Mining is an industry where we are already seeing a massive adoption of autonomous processes – everything from autonomous machines to drones and mobile mapping systems that collect information on a schedule to total stations, GNSS, radar and Lidar that continuously monitor the site, such as for slope stability. I would expect the machines themselves to become collection platforms going forward, leveraging built-in sensors for guidance and reality capture. We have some great examples today of robotics usage in the dangerous-access areas, such as nuclear plants, within chemical facilities in manufacturing, as well as in tunnelling after drilling and blasting where it may not be safe to send humans.
As digitization increasingly takes shape in the architecture, engineering & construction (AEC) sector, what are the key challenges in the industry, and how can geospatial technology help to overcome them?
Skopljak: Construction projects can be very complex. Every project is unique with a number of stakeholders operating in individual silos, with the potential for disruption from a variety of external sources, such as supply chain interruptions, skilled-labour shortages and low profit margins. The average construction project margins are in the

11 Interview Issue 4+5 2023
worlds: our ability to control the fidelity and information from the field and seamlessly link to the work process and analytics to automate the deliverables and to advance projects to the next stage. We are uniquely positioned to leverage a set of solutions across geospatial and construction sectors to drive this additional productivity through digitization. Crozier: Today, we see the same data collected multiple times, by multiple groups, for a variety of purposes. Everyone wants their own information, whether it’s the owner, the architects, the engineers, the contractors or the trade partners. There is a lot of duplication in data collection and in the detailed engineering elements, because we don’t share datasets or there’s no trust in the geospatial datasets that exist. There are opportunities for us to create a centralized repository of validated data that gets shared amongst everyone – so geospatial technology and the resulting data can
Crozier: In terms of timing, there is indeed a strong need for more surveyors because existing surveyors are retiring faster than the education system is producing young talent. This is creating an opportunity for a younger generation to bring their digital-native expertise to the industry. So my advice would be to join this great community. This is an exciting and rapidly changing profession! But the entire surveying profession ecosystem – businesses, educational institutions, government organizations and trade associations – needs to collaborate for a stronger pipeline. We need to raise awareness about surveying as a future career through education programmes in schools and promote inclusion for women and minority groups who are underrepresented in the field. Trimble is doing its bit by establishing Trimble Technology Labs at select academic institutions and training centres around the
world. These labs provide students access to the latest Trimble technology solutions used in modern engineering and surveying practices.
Skopljak: The geospatial profession is a great career choice for tech-minded individuals who want to work on projects that are making a difference in their communities. Even for those already in the industry, there is always more to learn as we are a rapidly evolving field. I am inspired by our customers who are always looking to improve their skills and embrace new technology. They see that technological advances are changing how projects are imagined and built, and they want to learn and adapt.
How should the geospatial industry play a role in enhancing sustainability, and which relevant technological developments does Trimble have in the pipeline?
Crozier: Many of the issues that impact sustainability have a geographic context, and this presents an opportunity for the geospatial industry to use its capabilities to foster collaboration and consensus. Some areas with the greatest potential impact are addressing inefficiencies, rework and waste throughout the lifecycle. This begins with design and continues through operations and maintenance.

Skopljak: There are many examples of geospatial technology making construction smarter, cheaper and greener. By streamlining workflows and information exchange, we are boosting productivity and making more efficient use of natural resources. We can also contribute to a better performance and lifecycle for civil infrastructure and other projects by being able to connect a community of participants who can organically interact and share information necessary to make decisions across a job site or job sites in real or near-real time. This reduces rework, unnecessary travel and wasted time going to and from job sites, enabling collaboration irrespective of location. We will continue driving productivity through product innovation. It is equally important that we innovate in business processes, continuing to evolve our supply chains and manufacturing to reuse components and reduce waste.
Another societal challenge is insecure land tenure and the lack of access to formal land registration systems leading to conflicts, especially in developing
12 Issue 4+5 2023
countries. How is Trimble helping to address this issue?
Crozier: A key element here is the ability to map and capture geospatial data accurately. We have a good example of this on a project that we’re working on with our team in India. We are using the Trimble Catalyst with the Trimble DA2 receiver, a subscription-based GNSS solution that provides professional-grade positioning as an on-demand service. This system is being used to capture all of the plots of land in a particular area and store them in a singular registration system.
Skopljak: Perhaps the most important responsibility associated with survey licensure is the legal determination of land boundaries for ownership and land use. The fair and transparent delineation of property and resource ownership is essential for conflict reduction and equitable resource management for inclusive societal development around the world. We need to make geospatial technology more readily available – and Trimble Catalyst is a great example
because it makes access to technology and data collection easier. Then, it’s paired with software that integrates directly into land registry systems and ties that field data to a parcel. We have a skilled emerging markets team in Trimble, and they are

About Scott Crozier and Boris Skopljak
engaging with developing countries that are striving to digitize their land. We can work with these agencies to deliver an effective, affordable and accurate land registry system.
Scott Crozier is vice president of Trimble’s Survey and Mapping organization, which provides solutions that facilitate high-quality, productive workflows and information exchange for surveyors, engineering and GIS service companies, governments, utilities and transportation authorities. Since joining Trimble in 2012, Crozier has held various roles of increasing responsibility with the company. He brings 20 years of experience in construction technology and is recognized globally as a thought leader in the industry. He has a bachelor’s degree in Mechanical Engineering from the University of Canterbury in Christchurch, New Zealand.
Boris Skopljak is vice president, responsible for Surveying & Mapping Strategy and Product Marketing at Trimble. He joined Trimble in 2011 and has held various product management and business area leadership roles since then. Having grown up in the surveying industry, Skopljak brings practical survey experience from the USA and Croatia. He holds a DiplEng in Geodesy from the University of Zagreb, Croatia, and an MSc in Geodetic Science from the Ohio State University, USA.
13 Interview Issue 4+5 2023
3D modelling to facilitate urban development and develop a digital twin
Spatial planning in the city of Zagreb
By Darko Šiško, Vlado Cetl and Vojkan Gavrilović, Croatia
The city of Zagreb has been developing a semantic 3D city model since 2008. The city spatial planning sector was recognized as the main project user and developer, while more users were detected in the areas of emergency management, environmental protection, energetics, heritage protection, etc. In spatial planning, the 3D city model has been applied in master and detailed planning, architectural competitions and interpolations in the protected heart of the city. With improvements now taking the city model towards a digital twin, the positive impact on urban planning and management is expected to become even greater.
Spatial planning was one of the first sectors to use semantic 3D models in day-to-day work. In the case of the city of Zagreb, the need for better urban planning and development was the main driver for the production of a 3D city model and web GIS applications. The initiative for a new spatial ‘framework’ of spatial planning emerged in the mid-2000s, after the large-scale master planning of the Zagreb urban area had been finalized and the focus shifted onto detailed urban planning and city projects. In detailed planning, especially planning of already-built areas, knowledge of 3D data on existing buildings became a crucial tool for efficient city planning and protection.
Development of a 3D model of Zagreb
Work to develop the model started in 2008 with the photogrammetric mapping of approximately 240km² of urban territory at Level of Detail (LOD) 2. The aim of the entire project was to produce a digital terrain model (DTM), a 3D model of buildings and a true orthophoto map. The initial model was made for the entire urban area of the city of Zagreb, but with a fragmented project approach for the subsequent updating of data. This was partly due to a lack of appropriate funding, and also to allow the use of all new 3D data from various city projects. Updates were made using Lidar and aerial photogrammetry data from 2012,
and UAV photogrammetry data from 2016, 2019 and 2020.
ZG3D web app
In 2016, a web app called ZG3D was produced and presented for browsing, viewing and using 3D data. Provided by geo-IT company GDi Ltd Zagreb and based on Esri technology, ZG3D integrates 3D data on existing buildings with 3D and 2D data layers from the fields of urbanism, architecture, topography, geotechnics, public green spaces, heritage protection, urban renewal and statistics. The aim of the project is to develop a 3D city model for use in the municipal administration, education, science, economy, civil society and other applications. The application allows users to view layers and basemaps, customize the display of data, select objects, take 3D and 2D measurements, analyse visibility, create cross-sections, display shadows and search addresses (Figure 1). The latest version of the ZG3D application was released in December 2021. The custom JavaScript web application was built with ArcGIS API for JavaScript 4.x. It supports core location-based functionality such as basemap layers, geocoding and elevation services. ArcGIS data hosting services are used to access data in the cloud such as feature and image tile services.

Use of the 3D model in city planning
Zagreb city planners successfully adopted digital spatial technologies in 2D form during
14 Issue 4+5 2023
Figure 1: ZG3D web application.
the 1990s and 2000s, both in producing spatial plans and presenting them to the wider public. The next step in city planning in the information age is 3D urban planning. A precondition for 3D planning is the existence of a 3D city model, appropriate planning tools and qualified planning staff. The application of the 3D city model in spatial planning by the city of Zagreb so far can be summarized as:
• 3D overlay in master land use planning

• 3D building zoning in detailed land use planning
• 3D modelling of new buildings during architectural competitions
• 3D modelling of building interpolations in the protected heart of the city.
Master and detailed urban planning
In master land use planning, overlay with a 3D city model is one of the basic ways of visualizing the world ‘virtually’ for urban planning and development. This overlay allows planners to check proposed building regulations with the existing local situation and align them better with existing building heights and volumes, for instance. The combination of a land use map and DTM can also be useful in urban planning for hilly and mountainous areas, enabling terrain limitations and landslides to be considered (Figure 2).
When it comes to detailed urban planning, the 3D city model becomes an indispensable tool for evaluating existing buildings and for designing and presenting building regulations to the general public. 3D building outlines can be presented to the local population and the city administration as volumes showing the possible future dimensions of buildings in a 3D environment (Figure 3).
Architectural competitions and interpolations
Architects were one of the first users of 3D data, especially to show the impact of planned buildings on the surroundings. In the past, such visualizations were made by approximating the heights and shapes of buildings, without an accurate spatial reference. 3D models of cities have now given architects those missing features, along with the ability to integrate the intended designs with all other spatial data. After the introduction of ZG3D, Zagreb architects began to use it for analytical and visualization purposes in architectural competitions and for the design of building interpolations in the city centre (Figure 4). This approach enables the creation of better and more accurate spatial solutions and generally more informed decision-making in urban planning.
Although many improvements have been made in the last decade, there are still a number of challenges in applying 3D city models in
Darko Šiško is the assistant head of the City Office for Economy, Environmental Sustainability and Strategic Planning of the city of Zagreb, responsible for the strategic information and research sector. He holds a master’s degree in Geodesy and Geoinformatics, and a PhD in Urban Planning. He has more than 20 years of experience in spatial information management, spatial planning, land development, strategic planning and smart city development.
Vlado Cetl has been a full professor in the Department of Geodesy and Geomatics of the University North in Varaždin, Croatia, since 2021. Before joining University North, he worked for the European Commission at the Joint Research Centre in Ispra, Italy, and as an associate professor at the Faculty of Geodesy of the University of Zagreb, Croatia. His main professional interests are spatial information management, spatial data infrastructures, cadastre, land management, geoinformatics, GIS and risk management.


Vojkan Gavrilović is the head of the business sector for local and regional self-government at GDi Ltd Zagreb. In the past 20-plus years at GDi, he has achieved exceptional results and gained extensive experience in large projects related to digitized and centralized management of cities such as Zagreb, Split and Dubrovnik, as well as risk and emergency management.
the day-to-day work of planners and architects. Some of the issues that need to be addressed in the future are the standardization of urban planning and architectural data, education and training of planning and architecture experts, and finding a sustainable model for updating the data.
Towards a digital twin of Zagreb
As a digital representation of an urban area, a 3D city model provides a fundamental building block for digital twins. Adopting a smart city approach, with 3D city models as the basis, provides huge economic benefits to cities, especially in city planning and urban design. The city of Zagreb intends to upgrade its existing 3D city model and the ZG3D

15 Feature Issue 4+5 2023
About the authors
Figure 2: Overlay of a land use map, DTM, 3D model and landslide data (Pantovčak, Zagreb).
Push the boundaries of 3D laser scanning.


You make the impossible possible—going where others don’t want to go and achieving what others can’t. You lead the way in capturing and documenting the world around us with unparalleled accuracy and detail.
Push the boundaries of 3D laser scanning with powerful in-field automated registration, on-the-fly measurements, and annotations. Trimble® 3D laser scanning systems enable you to visualise and verify your projects before leaving the site, so you can capture complex real-world data with the confidence of getting it right the first time.
Find

out more at:
geospatial.trimble.com/3D-laser-scanning-solutions
© 2023, Trimble Inc. All rights reserved. GEO-225-en-UK (05/23)
application into a digital twin of the city. At the moment, there are two main issues: 1) upgrading and updating 3D building data, and 2) integrating live information about urban processes and activities within the 3D model of the city. The current plan includes to improve and update the 3D model using data from the official Lidar survey conducted for the entire territory of the Republic of Croatia in 2022.


After the model has been updated, the city is considering a new process for further updates, linked to the process of usage permits for new buildings. As far as live data sources are concerned, numerous smart city projects are underway, including in transport, waste management and environmental monitoring. The future digital twin of Zagreb will serve as the basic infrastructure for further development of the smart city strategy.
Conclusions
As the basic building blocks for digital twins and smart cities, 3D city models provide huge economic benefits to towns and cities, especially in town planning and urban design. Using interactive 3D platforms, architects and planners can better understand new building designs in context, assess their impact and restrictions, anticipate urban developments and communicate findings to stakeholders in a very intuitive way.
The city of Zagreb started developing a 3D city model back in 2008. The model has been

Further reading
improved and updated over the years in accordance with new technologies. The model is now used in the city for many different purposes. It is also available openly for citizens through the ZG3D web app. Although it is already very useful for various purposes, in order to become a real digital twin the model must be upgraded to a higher level of detail and must be updated on a more regular basis. Only then can it support a smart city strategy.
Implementing 3D city model into the day-to-day work of planners and architects is a slow process, but can be achieved with the necessary collaboration, investment and capacity building. The results in Zagreb so far show that the use of a 3D city model in spatial planning can help to achieve better solutions in master planning, detailed urban planning and the development of architectural projects. As the model is further improved and integrated with real-life data, the positive impact on city planning and management is expected to become even greater.
17 Feature Issue 4+5 2023
https://zagreb.gdi.net/zg3d/
ZG3D,
Figure 3: 3D building outlines and volumes interpreted from a detailed urban plan (Trnje, Zagreb).
Figure 4: Spatial analysis and final architectural design (Lang square, Zagreb).
Identifying and ranking the barriers to operating digital twins in cities
Uncovering the challenges of urban digital twins
By Binyu Lei, Patrick Janssen, Jantien Stoter and Filip Biljecki
Urban digital twins, as representations of physical assets in the cities, enable twoway interaction with real-world counterparts, facilitating analytical operations and simulations in the virtual urban environment. Despite their growing popularity, many challenges to operating digital twins remain, hindering their design and implementation, but they are rarely discussed. Here, the authors identify the challenges of operating digital twins in the urban context through a bifurcated and multi-dimensional approach: a systematic literature review and an expert survey, organizing them across technical and non-technical dimensions.
The concept of digital twins originates from the world of manufacturing. It indicates the process of mirroring or ‘twinning’ with bidirectional information flows between two entities, enabling specific operations, e.g. testing, optimizing and simulating. One of the most popular definitions is from the aerospace industry, which describes the digital twin as ‘an integrated multi-scale simulation of the physical entity to mirror the life of its corresponding twin’. With the growing popularity of digital twins in the urban context, recent studies have attempted to reach a consensus on the interpretation of digital twins for cities. Some research suggests that urban digital twins
should enable dynamic analysis beyond 3D visualization, for example, reflecting spatial-temporal changes and simulating dynamic urban scenarios. Therefore, because definitions vary, for the purpose of this article it has been determined that urban digital twins should: 1) be based on detailed semantic 3D city models, 2) provide near real-time data, 3) enable a variety of operations, e.g. analysing, simulating and predicting various scenarios before they are implemented in reality, and 4) address social and economic functions in the built environment, e.g. enabling participatory process, involving humans as sensors to learn about the local context.
The lifecycle of digital twins
The lifecycle of digital twins is classified as different phases of their life in manufacturing, namely a design-operation-service process. The virtual model receives product information to simulate and validate scenarios and then sends feedback to the physical entity to optimize design, e.g. reporting errors or customizing details. The information exchange between physical and virtual entities forms a connection loop. Moving to the city-scale and urban context, the lifecycle of digital twins is more diverse and complicated. This complexity is due to the integration of heterogeneous information and the coevolution with the physical environment, which should be considered from the beginning to the end of the process.
Another critical aspect of urban digital twins is their need to be reactive to near realtime changes. This requires extensive input datasets, feedback and a high-frequency information flow throughout the lifecycle. Inspired by the lifecycle of 3D city models, which are integral to urban digital twins, the process is defined as six phases (see Figure 1) in the urban context: 1) Collecting (heterogeneous multi-scale and multi-temporal data), 2) Processing (data conversion and integration), 3) Generating (physical assets and information flow), 4) Managing (quality and status), 5) Simulating (urban scenarios), and 6) Updating (dynamic changes).

18 Issue 4+5 2023
Figure 1: The lifecycle of digital twins in the urban and geospatial domain.
A shift to the socio-technical perspective
The current discussion on digital twins is mostly driven by technology, highlighting how technical functionality benefits their development on the city scale. Nevertheless, an articulate representation of digital twins through a socio-technical lens has been noticed in recent discourses. It provides insights into the transition from data universalism, raising awareness of the social dimension. For example, it is argued that digital twins should encourage participation, thus making them understandable to the public rather than keeping them esoteric. As such, some attempts have been made in the current research landscape. First, applied technology in digital twins is a means instead of an end. Building digital twins aids the solving of urban issues and the planning of livable and sustainable cities. However, a purely technology-driven approach may blur the initial notion. Moreover, technical optimism ignores essential components of digital twins in practice. For instance, collaboration plays a critical role in developing digital twins. It is the foundation for generating common knowledge among different stakeholders, as well as for enabling data sharing and setting standards. Therefore, the authors combine social and legal perspectives to complement the technical dimension and offer a more complete understanding of digital twins.
Robust research method
The research method is a unique and robust dual one: a systematic review and an expert survey. A survey complemented the review based on the Delphi method: a rigorous and scientific approach used across many disciplines, distributed among a panel of domain experts. The Delphi survey was designed with an iterative process of three rounds and online questionnaires. Participants were asked to list and rank challenges for their organizations with regard to urban digital twins. A total of 52 international experts took part in this
Delphi survey. Then, the review identified documented challenges from the literature following a systematic approach, which was carried out in Scopus – a large literature database – resulting in a corpus of 34 articles being taken forward for analysis.
The panellists were from 23 countries, with most working in Europe. 26 experts are from industry (14) and government (12), whereas the other 23 experts work in universities or research institutes. Moreover, 44.2% of the respondents have worked for more than 20 years in domains underpinning digital twins. Such attributes of participants present a well-qualified and diverse set, providing reliable results.
Technical challenges
The literature review and the Delphi survey resulted in the identification of 14 technical challenges. Data-related issues are the most identified, and these have been combined into a single challenge category of ‘Data’. This refers explicitly to availability, access, accuracy, timeliness and details. For example, concerning data availability, one participant deemed the lack of availability of highquality 3D data as a challenge, followed by another response to the issue of availability of detailed data.
In terms of integration, the challenge is not limited to data sources but also includes system integration. It covers cases such as the difficulty to integrate heterogeneous systems to build digital twins, which hinders the operation in practice. The results also reveal that integrating many systems increases the complexity of implementation, with the system complexity rising exponentially rather than in a linear fashion, as well as the complexity of converting heterogeneous data formats. In addition, practitioners and researchers also pay attention to software (e.g. licences),

19 Feature Issue 4+5 2023
Figure 2: Ranking of the challenges by severity (left: technical challenges, right: non-technical challenges).
standardization (e.g. inconsistent adoption), update (e.g. managing different versions, detecting urban changes), technical competency and hardware. Two of the experts regard visualization as a challenge with respect to smooth rendering, platform requirements and user-friendliness.
Non-technical challenges
In terms of the social and legal aspects, eight non-technical challenges can be identified as hindering the operation of urban digital twins. Many discussions suggest that a lack of understanding can be a particular challenge from a social perspective, specified as ‘Awareness’ and ‘Definition’. For example, one panellist from the Delphi survey cited the lack of common understanding of a digital twin, despite a rising demand for widely using this term or concept in the industry. Deep discussions are required with clients and partners to synchronize the understanding of what a digital twin is before actually starting to work on a project.
Regarding specific disciplines, such as urban planning, there seems to be little awareness or interest among students and researchers regarding why urban planners need to use digital twins. Apart from the issue of understanding, the practical value of digital twins is also widely discussed in the current landscape. The discourse mainly concerns purposes, expectations, financing and business models, e.g. lack of know-how among end-users, and unclear benefits of using digital twins. Other non-technical
challenges identified from the review and the survey include collaboration, ownership, sensitivity and trustworthiness.
Measuring the severity of challenges
Figure 2, as two stacked bar charts, illustrates the degree of severity of each challenge. From the technical aspect, most participants regard semantic interoperability as the most severe challenge in practice, with 44.8% of panellists ranking it as a major obstacle and 37.9% rating it as the most severe. Interoperability between datasets is highlighted as the second severe challenge, indicating a consensus that interoperability around data information negatively impacts the state-of-the-art of digital twins. Another notable finding is that some technical challenges are rated as only moderately severe, such as interoperability (by 58.6% of experts) and version management (by 55.2% of experts). Nine issues can be identified as non-severe challenges, e.g. no participants regard data maintenance as a severe challenge. Meanwhile, the most insignificant challenges out of the 39 technical issues are infrastructure and computing devices, both in the hardware category.
In terms of the challenges from social and legal perspectives, most issues are regarded as being of major severity. Challenges related to the practical value receive more attention than others. Business model and financing are identified as the most severe barriers, with seven participants awarding them the highest degree of
severity. According to 79.3% of the experts, the lack of a clear purpose of digital twins is a more significant problem requiring more clarification. Meanwhile, some issues are viewed as having minor severity. For example, 13.8% of participants regard the severity of regulations as insignificant, while 41.4% consider it a moderate challenge. Furthermore, more than 59% of the survey participants believe the fuzzy definition of digital twins is a moderate barrier.
Mapping the challenges within the lifecycle framework
The relevance of these challenges based on the six stages of the lifecycle of digital twins is illustrated in Figure 3. When collecting data, data creation and complexity are the main technical challenges impacting the overall quality. Most of the social and legal challenges in this first phase are linked to ownership and collaboration, along with data sensitivity, raising social compliance and security issues when collecting humanrelated data. When it comes to processing data, the data availability, standardization and integration are most commonly considered to hinder the operation of digital twins. The perceived severity of system architecture also indicates a need to design a high-level outline for structuring data in this second phase of the lifecycle. The third phase of generating urban digital twins faces several challenges, with interoperability ranking highly (including datasets, semantics, scales and tools). On the topic of semantic interoperability, each domain has a siloed

20 Issue 4+5 2023
Figure 3: Mapping the challenges based on the lifecycle of urban digital twins.
way of working, demonstrating huge gaps in terms of technology and standards.
The fourth phase – managing digital twins – is more heavily impacted by social challenges such as collaboration, participation and trustworthiness, e.g. a lack of data sharing among authorities. In Phase 5, solutions are required to tackle interoperability in order to tap into the critical benefit of digital twins, i.e. the ability to simulate. Most of the non-technical challenges relate to practical values, such as demands and business models. For example, current use cases are often generic, but the expectation is high to serve a one-size-fits-all solution.
The sixth and final phase is updating. This is not only the phase in which to detect changes and make updates, but also the point at which to complete – and restart – the lifecycle of urban digital twins. Therefore, the technical challenges mainly concern version management and reconstruction. Public engagement is also highlighted, e.g. reflecting on feedback on the digital models.
Conclusion
While the decision-making benefits of urban digital twins have been well acknowledged, the challenges when developing them are not often subject to comprehensive public discussion. By identifying and analysing the challenges from two perspectives, the authors found that the state-of-the-art of urban digital twins is mainly driven by technology concerning data and techniques. The rating of the severity of the challenges in the survey additionally suggests how each challenge hinders the operation of digital twins in practice. The ranking reflects that different issues have different levels of impact and relevance (technical vs social). Interestingly, challenges from the non-technical perspective received considerable attention in the survey responses. For example, the business model was highlighted as one of the most severe non-technical challenges, indicating a demand for best practices and use cases to support better adoption of digital twins.
Combining perspectives from academia and industry may comprehensively contribute to overcoming such challenges and leading to an increase in the adoption of digital twins. Moving forward, the authors plan to conduct future research aimed at tackling specific issues identified in this study, leading to potential
About the authors
Binyu Lei is a PhD researcher in the Urban Analytics Lab at the National University of Singapore. Her research focuses on conceptualization, semantics and adoption of 3D city models and digital twins, as well as publicly available data.

Patrick Janssen is head of research at White Lioness Technologies. Previously, he was an associate professor in the Department of Architecture at the National University of Singapore and director of the Design Automation Lab.

Jantien Stoter is a full professor of 3D Geoinformation at Delft University of Technology. She did her PhD on 3D cadastre (2004) and received personal grants from both the Dutch Science Foundation and the European Research Council. She also works as innovations researcher at Kadaster.

Filip Biljecki is an assistant professor at the National University of Singapore and the principal investigator of the NUS Urban Analytics Lab. He holds MSc and PhD degrees in 3D GIS from the Delft University of Technology in the Netherlands.

solutions that will support and facilitate the operation of digital twins in the urban and geospatial domain.
Further reading
Lei, B., Janssen, P., Stoter, J., & Biljecki, F. (2023). Challenges of urban digital twins: A systematic review and a Delphi expert survey. Automation in Construction, 147, 104716.
Nochta, T., Wan, L., Schooling, J. M., & Parlikad, A. K. (2021). A sociotechnical perspective on urban analytics: The case of city-scale digital twins. Journal of Urban Technology, 28(1-2), 263-287.
Ketzler, B., Naserentin, V., Latino, F., Zangelidis, C., Thuvander, L., & Logg, A. (2020). Digital twins for cities: A state of the art review. Built Environment, 46(4), 547-573.
Acknowledgements
This research is part of the Multi-scale Digital Twins for the Urban Environment: From Heartbeats to Cities project, which is supported by the Singapore Ministry of Education Academic Research Fund Tier 1.

21 Feature Issue 4+5 2023
Figure 4: The popularity of urban digital twins continues to grow. The Singapore Land Authority is convinced that 3D mapping and 3D city modelling will be the foundation for city-scale digital twins. The image shows a 3D reality mesh of Gardens by the Bay, Singapore.


EvoLogics Sonobot 5 demonstrates efficiency and effectiveness for underwater mapping
Single-beam and multibeam sonar bathymetry of the Plessower Lake ‘cairn’

The EvoLogics Multibeam, a new multibeam echosounder option for the Sonobot 5 platform, was released at Ocean Business in Southampton, UK, in April this year. In May, EvoLogics conducted its final trials at one of the company’s regular testing sites at Plessower Lake in Brandenburg, Germany. The company is now taking the Sonobot 5 on a summer demonstration tour for partners and clients so that they can see its efficiency and effectiveness for underwater mapping for themselves.
EvoLogics, a German provider of underwater communication, positioning and robotic systems, is known in the industry for its Sonobot 5 uncrewed surface vehicle (USV). Following extensive testing, it has now released the EvoLogics Multibeam, a new multibeam echosounder option for the Sonobot 5 platform, to improve the efficiency and effectiveness of mapping underwater topography. The multibeam sonar for the EvoLogics Sonobot is based on a Norbit OEM solution, an entry-class multibeam sonar with a professional approach.
The Plessower Lake ‘cairn’
Single-beam bathymetry of the Plessower Lake ‘cairn’
Over time, EvoLogics has conducted several bathymetric surveys of Plessower Lake’s mound using the Sonobot equipped with a single-beam echosounder, its most popular configuration. A single-beam echosounder is a valuable tool for various underwater mapping tasks. It emits a narrow high-frequency sound pulse that reflects back when it encounters objects or the lake’s bottom, allowing for depth calculation. Systematically scanning the water creates a bathymetric profile that maps the underwater topography.
Single-beam sonar systems are well-suited for uncrewed surface vehicles due to their simpler design and smaller physical footprint. They use a single transducer, unlike more complex multibeam systems, which require multiple transducers and advanced signal processing. This simplicity allows for seamless integration into compact USVs, optimizing the use of limited resources. The Sonobot 5, equipped with a single-beam echosounder, weighs around 25kg and has dimensions of approximately L 1.29 x W 0.96 x H 0.8m (including antennas), making it easy to handle by a single person. Cost-effectiveness is another factor, as reduced complexity and a lower number of components in single-beam sonar contribute to a more budgetfriendly investment for a surveying solution.
Plessower Lake in Brandenburg is a sizable glacial lake known for its good water quality. With an area of approximately 3.22km2, an average depth of 4.5m and a maximum depth of 16m, EvoLogics has been using it as an attractive testing ground for the Sonobot vehicle since 2016. During the Sonobot trials, an interesting discovery was made. Bathymetric data revealed a cairnlike mound formation on the lake floor, measuring about 40m in diameter and 4-5m in height. Initially thought to be an ancient burial mound, it was later determined to be a geological remnant from the last glacial period. This unique feature has made the Plessower Lake an ideal location for testing and demonstrating bathymetric equipment. EvoLogics’ Sonobot vehicles have been regularly returning to the lake to explore and map underwater structures ever since. Figure 1: Example of a survey plan EvoLogics performed at Plessower Lake in 2017.
Sponsored article 23 Issue 4+5 2023
During a typical single-beam bathymetry mission with the Sonobot 5, a survey grid is laid out in the mission planning software and loaded into the vehicle. At the site, the Sonobot 5 is launched to perform the automated measurements while travelling along the grid. A live preview of the echosounder data is available at the operator’s shore station during the mission. The full dataset is stored onboard the vehicle to be post-processed and evaluated after the mission.

To obtain the bathymetric profile at the mound site, the vehicle’s path is set for two so-called ‘rows manoeuvres’ (Figure 1). These are a series of parallel paths covering the designated area. The second manoeuvre with a tighter grid above the underwater mound is necessary to obtain more details of the underwater feature. In 2017, EvoLogics performed bathymetry at the mound site using the Sonobot’s standard 200Hz single-beam echosounder and the ‘cairn’ was clearly visible (Figure 3).
Multibeam vs single-beam
Although the single-beam echosounder technology has its benefits and is well-suited for many applications, modern surveys often require compliance with the IHO’s S-44 standards that define specific accuracy requirements for sonar surveys conducted in hydrographic
operations. With the recent release of the EvoLogics Multibeam for the Sonobot 5, the company now addresses the industry’s need for more accurate and efficient bathymetry than is achievable with a single-beam echosounder.


The major advantage of multibeam sonar over single-beam echosounders is that it covers a wider seafloor area. By releasing multiple sound waves simultaneously, it maps large underwater areas quickly, reducing survey time. Another strength of multibeam sonar is its ability to produce high-resolution imagery and detailed 3D representations of underwater features. Furthermore, multibeam sonar provides accurate depth measurements by using advanced algorithms and processing techniques. It compensates for seabed complexities and minimizes the impact of factors like slope, refraction and interference.
Taking these advantages of the multibeam sonar technology and the customers’ requests into account, earlier this year EvoLogics expanded the hardware options of the Sonobot 5 platform with the new release of the EvoLogics Multibeam. EvoLogics Multibeam is based on the Norbit OEM solution and is an entry-class multibeam sonar with 256 beams at 1.45°x1°, a range of over 200m and a ping

24 Issue 4+5 2023
Figure 5: Detachable sonar head. Figure 4: Sonobot 5 with the EvoLogics Multibeam sonar.
Figure 3: Single-beam bathymetry results from the underwater mound survey in 2017.
Figure 2: Preview of single-beam echosounder data during the underwater mound survey mission in 2017.
rate of 50Hz, as well as high-grade dual GNSS and INS positioning and motion control which is standard for all Norbit echosounders.
The EvoLogics engineers aimed for seamless integration of the multibeam sonar with the Sonobot 5 platform. The compact Norbit sonar interface unit (SIU) is fully embedded in the submergible pod of the Sonobot vehicle. The sonar head connects to the pod with a single cable that provides power and the data link. Meanwhile, the sonar head is fully detachable from the pod with a simple slideand-lock mechanism for easy transportation and storage. When the EvoLogics Multibeam is connected to the Sonobot 5, the entire USV weighs under 30kg and measures L 1.29 x W 0.96 x H 1.04m (with antennas). This makes it the smallest and easiest-to-handle autonomous vehicle equipped with a professional multibeam sonar.
Multibeam bathymetry of the Plessower Lake ‘cairn’
In May 2023, EvoLogics engineers conducted final testing of the Sonobot 5 including the new multibeam sonar at the Plessower Lake site. They took advantage of the known ‘cairn’ or mound feature and existing single-beam bathymetry data to perform a multibeam survey at the same site.
The survey plan EvoLogics chose for the multibeam swath survey at Plessower Lake in May is a crosshatch pattern: a series of parallel lines that are then intersected by another set of parallel lines. The crosshatch pattern allowed the engineers to collect a comprehensive dataset, ensuring there are no gaps in the area coverage.
During a survey, the full sonar dataset is stored onboard the vehicle, with a live preview displayed to the operator at the land station during the mission. The EvoLogics Multibeam is compatible with Norbit data collection tools (DCTs) and NORdredge, Norbit’s web-based utilities for real-time monitoring of multibeam sonar operations. It is also compatible with all third-party software packages currently supported by the Norbit WBMS sonar family.
NORdredge was used for the live multibeam data preview at Plessower Lake. The collected data was subsequently forwarded to EvoLogics’ surveying partners for further post-processing and


analysis. However, even without post-processing of the full set of data points, the multibeam sonar data preview was more detailed than the single-beam bathymetry of the area.
In conclusion, the single-beam echosounder and multibeam sonar surveys conducted at Plessower Lake with the Sonobot USV revealed the advantages and limitations of both techniques. The single-beam echosounder is easier to use, and the simplicity of the data collected simplifies post-processing and interpretation. Conversely, the multibeam sonar system is superior for projects requiring highly accurate and detailed mapping. Therefore, the right choice of echosounder technology depends on the specific survey requirements and the budget.
With the release of the EvoLogics Multibeam, the team are happy to now be able to cater to a wider range of surveying needs and equip survey providers with the flexibility to choose the most suitable technology for their specific projects. The Sonobot 5 with the new multibeam sonar is going on a demonstration tour, as the company gears up for serial production.
Sponsored article 25 Issue 4+5 2023
Figure 8: NORdregde data preview during the multibeam sonar survey of the underwater mound in May 2023.
Figure 7: NORdregde data preview during the multibeam sonar survey of the underwater mound in May 2023.
Figure 6: Multibeam sonar survey plan of the underwater mound in May 2023.
Supporting gender equality with LADM requirements, modelling and assessment
Gender-sensitive design of land administration systems
By Eva-Maria Unger, Christiaan Lemmen and Rohan Bennett
The design of land administration systems needs to meet gender-sensitive requirements in order to better understand and strengthen the documentation and recordation of women’s land rights. So as a blueprint for building a land administration system, is the Land Administration Domain Model (LADM) gender-sensitive? And what exactly are gender-sensitive requirements? This article assesses the gender sensitivity of LADM from a technical perspective.
In order to better understand and strengthen the documentation and recordation of women’s land rights, the authors have firstly defined the concepts of people-to-land relationships – with a special focus on women’s access to land – and how they relate to the LADM. Secondly, the authors have performed assessment and modelling to understand whether the LADM can be considered gender-sensitive and, if not, what further developments might be needed.

People-to-land relationships
The LADM aims to be able to represent all people-to-land relationships using data modelling techniques. Against global norms, people-to-land relationships may or may not be considered equitable in terms of the recognition and inclusion of women, depending on the context. Either way, the authors’ view is that data models, databases, forms and processes must be able to model existing arrangements, which can then be used to improve and support women’s access to land, including its documentation. For simplicity, the authors here only refer to ‘sexes’ – defined as male/female/other –rather than more complex classifications. In general, the concepts of data modelling are seen to be neutral to social politics and so any number of classifications can be modelled using various data types.
Women’s land rights
Global organizations recognize the need for land administration (LA) systems to better

26 Issue 4+5
2023
support women’s access to land. International laws and frameworks –including the Universal Declaration of Human Rights (UDHR) and the UN 2030 Agenda for Sustainable Development with its Sustainable Development Goals (SDGs), together with the UN-GGIM Framework for Effective Land Administration (FELA) and FAO’s Voluntary Guidelines on the Responsible Governance of Tenure of Land, Fisheries and Forests (VGGTs) – provide clear global policy cornerstones for the protection of women’s land rights. Land administration systems are the basis for recording the complex range of rights, restrictions and responsibilities (RRR) of those people-to-land relationships. Land administration
About the authors
Eva-Maria Unger works with Kadaster International as a senior land administration advisor. She holds an MSc in Geodesy and Geoinformation from Vienna University of Technology, Austria, and a PhD in Land Administration from the University of Twente, the Netherlands. She is the director of the International Office for Cadaster and Land Records (OICRF), which is a permanent institution of FIG and is hosted by Kadaster. She is involved in research and teaching at KU Leuven and the University of Twente.
Christiaan Lemmen is a professor emeritus of land information modelling at the Faculty of GeoInformation Science and Earth Observation of the University of Twente in the Netherlands. He is co-editor of the ISO 19152 Land Administration Domain Model and co-chair of the development team of this international standard. He is also co-chair of the Open Geospatial Consortium’s Land Administration Domain Working Group.

Rohan Bennett is chair of FIG Commission 7 (2023-26). He has degrees in Geomatic Engineering and Information Systems, and a PhD in Land Administration from the University of Melbourne, Australia. He has held academic and professional consulting roles with the University of Melbourne, University of Twente, Swinburne University of Technology and Kadaster Netherlands. He is widely published in the areas of land administration, cadastre and land management.

systems can support the implementation of the contemporary societal demands towards land. In this regard they reflect the historical development of people-to-land relationships within a jurisdiction. The importance of the systems is recognized by prioritizing the development of LA systems in post-conflict and national development programmes in various countries.


Response from the profession
FIG Publication 24 focused on the issue of women’s access to land in 2001. Since then, the importance of it has become intrinsic in land

27 Feature Issue 4+5 2023
Figure 1: UML diagram showing equal rights associated to three spatial units. Both parties hold a share; the woman has a share equal to half and the male also has a share equal to half.
Figure 2: UML diagram showing unequal rights associated to three females and one male. The male has a share equal to half, but only one female has a share equal to half.
administration interventions. Guidelines such as the FELA and the VGGTs, together with the fit-for purpose land administration (FFPLA) approach recognize that to achieve equal rights to land for women and men, documentation about land ownership and land use disaggregated by sex is needed at the party level (with ‘party’ referring here to the person who owns or uses the land).
LADM
Beyond international guidelines and agreements, the focus of the global community has also been on collaboratively designing technical methodologies and tools to support the actual recordation of women’s land rights. UN-Habitat’s Global Land Tool Network (GLTN) and tools provide perhaps the most notable example of such ongoing initiatives. These initiatives seek to assist the conversion of the guidelines into practices that can support women’s access to land. These include, for example standardized data models, processes and databases.
The LADM, also known as ISO 19152, is a global baseline standard for articulating the data requirements of any land information system seeking to record the land rights of all people-to-land relationships. The Social Tenure Domain Model (STDM) – a tool from GLTN – is a specialization of the LADM and is included in the LADM Annex.
Assessing gender-sensitive requirements
In terms of the gender sensitivity of LADM, the authors have formulated a set of requirements that it must meet and should be tested against. These requirements are based on existing policy guidelines (including those mentioned above) and are presented in the left-hand column of Table 1. The middle column of the table indicates whether the current Edition I of the LADM can be considered gender-sensitive. The right-hand column shows the authors’ assessment and action points. The action points can be used by the development team for the ongoing
development of Edition II of the LADM within ISO’s Technical Commission 211.
Modelling
After the requirements had been compiled, they were further unpacked in the context of the LADM by exploring whether the Unified Modeling Language (UML), using the LADM classes, could model example cases of people-to-land relationships from a gender perspective, and how the LADM would currently model those people-toland relationships. It should be noted that data modelling is useful for simplistic visualization but cannot address all the challenges associated with women’s access to land. Data models are introduced here to illustrate current settings, but those data models necessarily only provide a simple representation of people-to-land realities (see Figures 1 and 2).
In Figure 2, there are unequal rights associated to one basic administrative unit
Requirements and recommendationsYes/no/partiallyLADM assessment and action points
Overall guiding principle: continuum of land rights
1. LADM shall include all names and civil status of legitimate parties with legitimate claims
2. LADM shall enable land use rights recording Yes
This would require an extension of the code lists LA_RightType. This is possible, but technical management of the code lists is needed. This could be organized by FIG, for example.
This would require a LA_SexesType attribute, with a related code list based on ISO 5218 and an LA_CivilStatusType attribute. LA_CivilStatusType is proposed to be a new attribute in the LADM: it represents the civil status type of the party (natural person only). It is proposed to be included as an attribute in the LA_Party class in Edition II of the LADM.
This is possible in the current edition of the LADM
3. LADM shall enable joint titling Yes This is possible in the current edition of the LADM
4. LADM shall make provision to record overlapping and secondary rights Yes
5. LADM shall make provision to identify issues during family transitions Partially
6. LADM shall make provision to record the customary rights of women No
This is possible in the current edition of the LADM
Could be modelled as a process or transaction in the LADM. There may be a need for an attribute LA_InheritanceType in the second edition of the LADM. It represents the type of inheritance between parties. It is proposed to be included as an attribute in the LA_Party class in Edition II of the LADM.
This would require an LA_SexesType attribute. Indigenous people and local communities can be included in the code list LA_PartyType2 or in LA_GroupPartyType3 – see also Annex J of the LADMISO/TC211 (2012a). Further, LA_PartyRoleType4 could be used to describe the social status in the community, e.g. role in decision-making, management and control. A decision-making role could provide opportunities for women’s land rights to be explicitly recognized.
7. The LADM shall support sex-disaggregated data No
This would require an LA_SexesType attribute. Further, the disaggregation of the urban and rural context can be modelled via LA_SpatialUnitGroup5 with a label to specify the context. An alternative way for this specification may be via the LA_Level6, especially if there are differences between urban and rural land administration systems from a content perspective. This may specifically be of importance when monitoring women’s land rights in rural areas.
8.
- Not applicable for the LADM itself.
28 Issue 4+5 2023
Table 1: Gender-sensitive requirements and assessment of the LADM.
Partially
No
The LADM implementation shall support women’s participation in the recordation process
consisting of three spatial units. This example could represent a polygamous relationship/ marriage between, for example, three females and one male. Important is that this example could describe a situation where polygamous marriage is not allowed de jure, but does exist de facto. Hence only the first wife, who is legally recognized, can have land rights according to the law. This would mean that the man holds a share equal to half, the legally recognized wife (here labelled as ‘1st wife’) has a share equal to half, and the other wives (here labelled as ‘2nd wife’ and ‘3rd wife’) do not have a share. Even though the other wives have no share in the right by law, the inclusion of their names could have some impact in the future. This modelling/recordation could be seen as a representation of the as-is situation and can serve as a basis for later transactions, e.g. inheritance.
Concluding remarks
The LADM is broadly recognized as the potential foundation for the development of future land administration systems and for the design of interoperability between existing systems
Further reading
- Enemark, S., McLaren, R., Lemmen, C., 2016, Fit-for-Purpose Land Administration –Guiding Principles for Country Implementation; GLTN; UN-Habitat: Nairobi, Kenya, 2016. https://unhabitat.org/books/fit-for-purpose-land-administration-guidingprinciples-for-country-implementation/
- FIG, 2001, Women’s access to Land. FIG Guidelines. Principles for Equitable Gender Inclusion in Land Administration: Background Report and Guidelines. FIG Publication No. 24. International Federation of Surveyors (FIG) http://www.fig.net/ resources/publications/figpub/pub24/figpub24.asp
- ISO/TC211, 2012a, Geographic information – Land Administration Domain Model (LADM). First Edition 2012-12-01 https://www.iso.org/standard/51206.html
- Unger, E-M, Lemmen, C.H.J. and Bennett, R.M. (2023) Women’s access to land and the Land Administration Domain Model (LADM): Requirements, modelling and assessment. Land Use Policy, Volume 126, March 2023, 106538 https://doi. org/10.1016/j.landusepol.2023.106538
- UN-GGIM, 2020, Framework for Effective Land Administration: A Reference for Developing, Reforming, Renewing, Strengthening, Modernizing, and Monitoring Land Administration, UN-GGIM https://ggim.un.org/meetings/GGIMcommittee/10th-Session/documents/E-C.20–2020-29-Add_2-Framework-forEffective-Land-Administration.pdf
in one country or across boundaries. As an ISO standard, the LADM has gained international recognition. It is important that standards such as the LADM recognize the challenge of ensuring women’s access to land and the recognition and recordation of women’s land rights, by paying attention to this issue both within the standard itself and in its development process. The authors’ work has shown that the first edition of the LADM already fulfils some of the eight identified core gender-sensitive requirements. However, future editions can do more through the introduction of specific attributes. Furthermore, a technical standard is only as good as the awareness that surrounds it. Therefore, international organizations – as well as civil society organizations – are needed to communicate both the importance of gender equity in land administration and the fact that the LADM (and hence LADM-based land administration systems) can fundamentally support women’s access to land.

The photos were captured in the charming community of Chizavane, located in the picturesque province of Gaza, Mozambique, during a FFPLA pilot programme. (Image courtesy: Marisa Balas)

29 Issue 4+5 2023
Colourized point clouds from photogrammetry
Adding value as an alternative deliverable
By Eric Andelin, Senior Workflow Specialist, SimActive Inc.
Since the explosion of Lidar over the past two decades, the use of point clouds in aerial mapping applications has become common these days. However, Lidar is not without its challenges. This article explores how colourized point clouds from photogrammetry can offer a value-adding alternative.
The three main challenges associated with the use of Lidar in aerial mapping have always been the cost of the sensors, the learning curve required to produce accurate datasets, and what to do with all those points when it comes to providing a deliverable. Airborne Lidar systems and the positioning systems they mate to are mostly still very expensive. This is due to manufacturers increasing pulse rates and range to meet user demand for denser datasets, while trying to reduce the overall size and weight. In the race to stay competitive, this often leaves buyers feeling that they are the guinea pigs for these ever more complicated systems.
The fact that Lidar requires highly accurate positioning systems adds to the complexity of hiring people with the skills to process these datasets consistently at high levels of accuracy. Needless to say, the learning curve is steep, and those that are good at processing Lidar are sought after and come at a premium. There is, however, another option: photogrammetry.

Evolution of photogrammetry
Photogrammetry, the ability to make maps from overlapping imagery, has been around almost since the invention of aircraft. For a long time, it required large machines known as stereo plotters to give technicians the ability to see a scene in stereo. This allowed them to draw information representing the ground and features at a given scale. As computing power increased in the 1980s, photogrammetry went digital. Not long after, in the early 2000s, the principles of photogrammetry made it possible to forgo the stereo viewing equipment and extract an XYZ coordinate for every pixel in the image where overlap occurs. This breakthrough allowed for the generation of highly accurate point clouds without the expense of a Lidar system. However, a photogrammetrically derived point cloud has one
added potential benefit: colour values at no additional cost.
In either case, the primary deliverable in mapping projects has remained digital elevation models (DEMs), as point clouds were just too large in file size for the average user to exploit given the lack of computing power available. With advances in computing technology including more powerful CPUs and GPUs, this is changing. In addition, many popular software packages can consume point cloud data for further processing or visualization.

Advantages of colourized point clouds
So what benefit comes from a colourized point cloud? This is easily answered by looking at an example of each. Without the added step of classification or colourization, it takes some effort to identify features hidden deep in a Lidar point cloud. In contrast, the average person can quickly
30 Issue 4+5 2023
Original point cloud.
Colourized point cloud.
identify features from a photogrammetrically derived colourized point cloud.
A point cloud created from Lidar can indeed be colourized. However, this just adds to the overall cost, with the requirement for a camera in operation when the Lidar is being acquired compromising the acquisition window or a second flight over the same area. Either method results in a longer overall acquisition time and more processing.


There are software packages that create point clouds as a derivative of the aerial triangulation process. They then generate DEMs from a decimated number of points within that point cloud. This tends to create very poor-quality DEMs in general and eliminates many of the points originally created. This also makes validation difficult for the end-users as the DEM creation is a further step removed from the aerial triangulation process.
Challenges associated with colourization
A common way of generating colourized point clouds from photogrammetry is to create a DEM, then export a point cloud from that DEM where each pixel is represented as a point. Then, using an orthomosaic, the corresponding colour value is projected straight down on each point. This works well –but only in a nadir view, because a point cloud created from a DEM in this manner does not take into consideration vertical or oblique points. As a result, vertical and oblique voids are inherent in the dataset. Where there are no points, there is no colour.
While most software tools implement this simple approach to colourization, an optimal solution is to create better associations between pixels and points. Then, however, many pixels for the same point may have slightly different colour values. That means algorithms need to calculate and merge this information. Another issue that arises is similar to the one of colour balancing in a mosaic, but here the mosaic is 3D. Advanced algorithms are thus required to do this to ensure consistency across the point cloud. Currently available photogrammetry products do not support such advanced functionalities.
Recent technology advancements
SimActive has recently introduced version 10 of its Correlator3D photogrammetry suite

to allow such a colourization of point clouds. During the point cloud creation process, all pixels coming from different overlapping images (vertical and/or obliques) are first used to derive a precise 3D coordinate. Then, using advanced algorithms, Correlator3D analyses the different colour values from the associated images and calculates a final colour value. This leads to a highly realisticlooking point cloud, displaying consistent colours from all viewing angles.
The advantages of such a technology are multiple. It allows for the production of a point cloud that is similar to Lidar. Only a single data collection activity is necessary, leading to cost savings and richer deliverables. Having only one dataset to process is also quicker, easier and faster. Moreover, it guarantees that there will be no registration challenges and issues, as would be the case with merging Lidar with imagery.
The future of point clouds
As point clouds become a more common mapping deliverable, mapping professionals need to consider the end-user’s level of comfort with them. A classified point cloud certainly has value, allowing the quick identification of ground versus vegetation and so forth, but a colourized point cloud takes it to another level. For example, a classified point cloud will let the user know about the presence and location of a road sign. A colourized point cloud will add the information about what the sign says. This not only makes human interpretation easier, but also helps to advance along the path towards more machine learning and artificial intelligence (AI). Identifying realworld features through machine learning and mining valuable information from datasets via AI is already happening. Just think how much more value a point cloud with colour could bring than one without!

Sponsored article 31 Issue 4+5 2023
Colourized point cloud generated by Correlator3D version 10.
Road sign visible.
Point cloud of a road.
Identifiable as a speed-limit road sign thanks to colourization.
About the author
Eric Andelin, CP, GISP, is a senior workflow specialist at SimActive Inc. He brings 40 years of experience to the mapping profession, with his geospatial background including survey, aerial photography, photogrammetry, GIS and laser scanning. Eric is consistently seeking new technologies to further the profession.
Scanning vast areas and pinpointing areas of concern
Unlocking the full potential of mobile laser scanning for infrastructure monitoring
By Slaven Kalenjuk and Werner Lienhart, Austria
Exploring the complete potential of mobile laser scanning raises the question of whether the obtained results are sufficiently accurate for deformation monitoring. This article focuses on the geometric quality of mobile laser scanning and proposes a method to enhance it to a level where it can be effectively employed for civil infrastructure monitoring. This research is motivated not by mere curiosity, but by an urgent necessity.
Civil infrastructure is a cornerstone of modern society, enabling transportation of goods and people across long distances. However, maintaining the safety and integrity of tunnels, bridges, noise barriers and retaining walls is a challenging task, particularly as infrastructure operators face increasing demands from growing traffic volumes and the vagaries of extreme weather. Failing to spot signs of deterioration can lead to severe consequences, such as soaring repair costs and even catastrophic structural failures.
Sadly, such a tragedy struck the Brenner Highway, a key north-south artery for both freight and passenger traffic across the European Alps. In 2012, a retaining wall

adjacent to a toll station crumbled, sending tons of concrete cascading onto the highway (Figure 1). In a split second, a truck was buried and its driver tragically lost his life. This harrowing incident sparked a shift in Austria’s awareness regarding the hazard potential of geotechnical structures. There was an urgent need for more precise, efficient methods to detect defects in the tens of thousands of structures lining the country’s roads and railways.

Visual inspections and deformation monitoring
Guaranteeing the safety and reliability of infrastructure is paramount, and the assessment of its structural condition plays a crucial role in achieving this goal. Timely and well-informed decisions can be
the difference between smooth transport of people and goods, or utter disaster. In many parts of the world, strict regulations apply to infrastructure maintenance, and cutting-edge technology is being deployed to gain deeper insights into the structural performance. While novel sensors and data analytics capabilities can help with building inspections and safety assessments, they cannot replace visual inspections as the ultimate basis for condition assessment.
Nonetheless, it is crucial to recognize the value of objective data. Various geotechnical or structural deficiencies may not be visible to the naked eye. The Eurocode 7 (EN 1997-1, 2004) spotlights the multiple failure modes that can lead to settlements, lateral displacements and tilting. That is where deformation monitoring becomes an indispensable tool, providing a standard means to observe behaviour and assess the current state of structural health. However, traditional techniques for deformation monitoring have their limitations. Measuring thousands of objects with total stations or installing tens of thousands of sensor nodes is impractical and can be incredibly timeconsuming and resource-intensive.
Is mobile laser scanning the game changer?
Mobile laser scanning (MLS) has emerged as a cutting-edge technology for reality capture.
32 Issue 4+5 2023
Figure 1: The support structure on the day of the tragic collapse. (Image courtesy: Gabl and Pilch, 2015)
Unlike static scanning, it allows for the acquisition of 3D point clouds of the surroundings while in motion, whether on foot, by air or by vehicle. The secret behind its success lies in direct georeferencing, which allows for the acquisition of 3D point clouds in the desired coordinate frame without the need for setting up and measuring ground control points. This is achieved by integrating sensor data from a variety of sources, such as GNSS, inertial measurement units, odometers, cameras and scanners. The quality of these individual components and the algorithms used to fuse the data play a critical role in the quality of the resulting point clouds.
For monitoring civil infrastructure along roads and railways, vehiclebased mobile Lidar systems are the ideal choice. They enable fast data collection while seamlessly integrating into the free-flowing traffic. Additionally, size and weight are less of a concern compared to systems based on uncrewed aerial vehicles (UAVs or ‘drones’), for instance.

In 2016, a team of interdisciplinary researchers from the Graz University of Technology in Austria began investigating the potential of a vehicle-based MLS system to identify potentially defective retaining walls. The aim was to collect data quickly and process it intelligently. The infrastructure would be scanned while driving by at high speed (Figure 2), and a reliable map of significant structural deformations would be extracted. Moreover, the research tackled the challenges faced when deploying the technology under practical boundary conditions. For example, infrastructure operators required a method that would work with commercially available systems.


About the authors
Slaven Kalenjuk holds a degree in Geomatics Engineering and is a former researcher at Graz University of Technology. As manager of an interdisciplinary research project, he handled the development and implementation of mobile laser scanning for the monitoring of retaining structures in Austria. Nowadays, he works for the surveying company AVD Vermessung ZT.


Werner Lienhart is a full professor and head of the Institute of Engineering Geodesy and Measurement Systems at Graz University of Technology, Austria. Prior to this position, he was product manager innovation at Leica Geosystems, Switzerland. He is also president of the Austrian Geodetic Commission (OeGK) and president of the International Society for Structural Health Monitoring of Intelligent Infrastructure (ISHMII).
Data formats and interfaces were specified to guarantee data quality between different service providers and for years to come. Additionally, having well-defined guidelines would encourage more service providers to participate in tenders.
Evaluation of MLS accuracy
A successful collaboration with industry partners proved instrumental in creating a comprehensive database of MLS data. The project, consisting of eight measurement campaigns, involved the use of MLS systems from four different vendors to scan 24 support structures. The resulting dataset included hundreds of point clouds, each containing millions of points.
33 Feature Issue 4+5 2023
Figure 2: Monitoring civil infrastructure requires efficiency and reliability, both in data collection and in processing.
Figure 3: The MLS systems have been tested and deployed in cooperation with leading industry partners.
Analysis of this vast dataset highlighted some notable insights into the geometric accuracy of MLS systems. One significant finding was that the quality of the final data depends not only on the system used, but also on how it is operated. Factors such as the scanner’s orientation, measurement rate and calibration procedure – whether conducted on-site or in the factory – can have a significant impact on the accuracy of the data.
Moreover, the type of scenery being scanned can also affect the results. For example, the challenges posed by scanning alpine valleys, which have retainingwalls, bridges and tunnels, can be especially difficult. Consider the example of scanning an 18m-high retaining structure that stabilizes a slope next to an interstate road and a highway (as depicted in Figure 4). GNSS multipath and IMU drifts can cause cloud-to-cloud deviations of up to 10cm between two datasets acquired in short succession. It is worth noting that these deviations cannot be minimized by rigid-body transformation. The lack of software capable of dealing with such ‘MLS distortions’ may be the reason it has not yet proven itself as a reliable method for deformation monitoring.
Quality improvement in post-processing
However, there is a remedy. Systematic errors can be considered situation- or time-dependent. In other words, these errors are constant for a particular time frame. Most MLS software packages enable the export of point clouds with nanosecond-precise time information (e.g. in LAS/LAZ format). This information can divide the cloud into sections scanned within a concise period, which can then be aligned in terms of a rigid-body transformation. The potential for improvement is significant, as demonstrated in Figure 5. By postprocessing MLS point clouds, one can eliminate systematic errors of several centimetres and align them with millimetre precision.
Putting the pieces together
MLS-based deformation monitoring has been missing a critical piece of the puzzle, which this method now provides. It is applicable at two key stages:

1) Establishing a uniform coordinate system and deriving deformations
2) Deriving empirical precision. It is worth noting that the object from which the deformations are to be determined is excluded from the calculations in Stage 1, just like in traditional monitoring measurements with total stations. Semantic interpretation of point clouds can aid in separating the structure (object) from other elements such as the road surface and guardrails (reference). Two epochs are registered over these reference objects and the retaining structures are compared (Figure 6, left).
The precision from Stage 2 helps to differentiate between significant deformations and measurement noise. This leads to the creation of a binary map indicating areas of statistically significant differences, as seen in Figure 6 (middle). When compared to the results of total station surveys using 19 prisms (black dots in Figure 6, left), the
Gabl & Pilch: Stützmauern Alt und Neu – Instandsetzung, Ertüchtigung und Neubau von nichtgeankerten Stützkonstruktionen. Verlässlichkeit auf allen Wegen, Kahlenberg, 18.06.2015.
Kalenjuk, S., Lienhart, W., & Rebhan, M. (2021). Processing of mobile laser scanning data for large-scale deformation monitoring of anchored retaining structures along highways. Comput Aided Civ Inf. 2021: 1-17: https://doi.org/10.1111/ mice.12656

Kalenjuk, S., & Lienhart, W. (2022). A Method for Efficient Quality Control and Enhancement of Mobile Laser Scanning Data. Remote Sensing, 14(4), [857]. https://doi.org/10.3390/ rs14040857
Kalenjuk, S., & Lienhart, W. (2023). Drive-by infrastructure monitoring: a workflow for rigorous deformation analysis of mobile laser scanning data. Structural Health Monitoring. Online-First: doi:10.1177/14759217231168997
EN 1997-1. (2004). Eurocode 7: Geotechnical design - Part 1: General rules. (Technical report, Authority: The European Union Per Regulation 305/2011, Directive 98/34/EC, Directive 2004/18/EC). Brussels.
34 Issue 4+5 2023
Further reading
Figure 4: Mobile laser scanning has time-dependent systematic errors that can amount to several centimetres. (Image courtesy: Kalenjuk & Lienhart, 2022)
Figure 5: Post-processing MLS point clouds can improve precision tremendously. (Image courtesy: Kalenjuk & Lienhart, 2022)
results coincided within a range of +/-5mm (Figure 6, right).


The idea behind this concept, known as ‘rigorous deformation analysis’, is almost half a century old and was initially developed for tachymetric surveys. However, this study shows its transferability to mobile Lidar scanning data, which is intriguing.


Is it good enough?


As researchers and manufacturers strive to unlock the full potential of MLS, the question remains: Are the results accurate enough
for deformation monitoring? The answer, as numerous studies have highlighted, depends on several factors. In optimal conditions with smooth object surfaces, a precision of +/-5mm can be achieved, even at high speeds of 80km/h. However, when dealing with rough objects or dense vegetation, the precision drops to an estimated +/-1cm, which is a more realistic assessment.
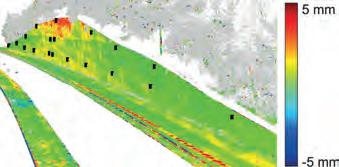


Despite these limitations, the overall quality of MLS data is deemed sufficient for the intended application, offering a promising tool for identifying critical infrastructure in need of attention. While static surveys will remain essential in critical scenarios, MLS has the potential to efficiently scan vast areas and pinpoint areas of concern, making it a valuable addition to the monitoring toolbox of infrastructure operators. As the world becomes more reliant on technology to optimize operations, it will be exciting to see how MLS continues to advance and play a role in maintaining and improving infrastructure.

35 Feature Issue 4+5 2023
Figure 6: MLS-based deformation monitoring yields a full field deformation map (left), which can be tested for significance (middle). The coincidence with total station surveys is better than +/-5mm. (Image courtesy: Kalenjuk & Lienhart, 2023)
Transforming the collection of high-precision geodetic monitoring data
A cost-effective, laboursaving and carbon-neutral solution
The Locator One solution for autonomous GNSS-based precision monitoring has been sold and leased to numerous construction and infrastructure companies, both in the Netherlands and internationally. It was jointly developed by a company specialized in the collection and analysis of surveying data and images, and a provider of Internet of Things (IoT) solutions for sensing and data communication. Bundling their individual specialties and market knowledge resulted in the creation of Basetime, an innovative start-up, in 2021.
Small movements in objects or terrain may seem harmless, but in the case of too much movement (also known as ‘deformation’ for assets and ‘settlement’ for ground), the function of an object may be compromised. In the worst case – such as bridges that can no longer be closed, or landslides – it could even lead to catastrophes. That is why the demand for accurate data about object and terrain movements is increasing. For higher safety and to be able to understand deformation and settlement, very accurate movement data is needed. Basetime took on the task to revolutionize the collection of high-precision geodetic data, resulting in the development of a high-quality and reliable autonomous 3D monitoring station called the Locator One.
3D subcentimetre monitoring precision
The Locator One is the first device developed by Basetime. It is intended for autonomous GNSS-based precision measuring. The device was developed for construction companies, surveyors, maritime corporations, geotechnical and structure engineers, and asset managers with complex motion monitoring tasks. It can be mounted to an asset, or a settlement rod in case of ground monitoring, to achieve 3D subcentimetre monitoring precision.
The Locator One includes GNSS, accelerometer, thermometer and radar sensors to monitor every 2D or 3D movement of an asset or terrain with precision to within 5mm in height (Z) and 3mm horizontally (XY). Poor or incomplete data is automatically filtered out by the algorithm, typically resulting in 95% data reliability. Moreover, all movements and positions

36 Issue 4+5 2023
can be delivered in 3D absolute coordinates, in any local coordinate system.
Endless applications
Originally, the Locator One was only used for settlement monitoring by mounting it on to a settlement rod. Large construction and dredging companies were among the first to use the solution for monitoring newly constructed sites, roads, dikes, dredging grounds, earthwork stockpiles and construction sites. But the device can also be mounted to an asset, such as a building or a bridge, and the possibilities are endless. Surveyors and asset managers now also use the Locator One for monitoring buildings and instable land masses, such as mountains and soil erosion. Other examples of applications include the monitoring of retaining walls, water levels, landslides and open mines. In fact, the device is even versatile enough to be used in case of earthquakes.
Data at your fingertips
The measurements take place at predefined timestamps, ranging from once a day to once an hour – or even more frequently if necessary. The devices send their observations and metadata to the Basetime cloud through an IoT network. After several geodetic adjustments and calculations, the data is delivered. The results are displayed on the Basetime dashboard or in another preferred environment through an API. This makes it possible for geospatial professionals to analyse all the information from behind their desk or on a mobile device in line with client’s preferred working method.


A sustainable and cost-effective solution
The Locator One functions without batteries and is carbon neutral during use. Since this approach means that very few surveyors are needed to conduct ground settlement measurements, the solution increases construction-site safety. It also maximizes the availability and cost-effectiveness of surveyors by allowing them to be deployed for more high-value activities.
In addition to the above-mentioned sustainability, automation and labour-
saving benefits, the Locator One provides very reliable data. The combination of precise measurements at a predefined time increases the foundation for making reliable predictions of settlement behaviour. As a result, the geospatial engineer gains a clear view of the stabilization period much sooner and the embankments can be placed more precisely and therefore often earlier, thus saving valuable construction time. Multiple Basetime projects have demonstrated that this accelerates projects for earlier delivery, which significantly contributes to the project result and also directly to emissions savings. Last but not least, the Locator One is very easy to install and use and very affordable, whether purchased or rented.
Changing the game of monitoring
As a joint venture of a leading IoT developing company and an expert geodetic services provider, Basetime aims to change the game of monitoring by creating the best of both worlds. The company name is a combination of ‘baseline’ plus ‘time’: the two ingredients needed to obtain accurate GNSS measurements at the necessary timestamps. The Dutch-based start-up offers a full-stack

solution including device, database, dashboard and ongoing support and services.
Expanding the dealer network
The first dealer to sign up with Basetime was Boels in the Netherlands – one of Europe’s biggest rental companies for machines and tools – with a special focus on the lease and rent of the Locator One devices. Since then, the company has also appointed dealers in Germany and Belgium, and is in advanced discussions with numerous professional partners globally. Having recently attracted substantial funding, Basetime is now rapidly expanding its global dealer network as the next step on its path to realizing its ambitions. “Accelerated product and services development as well as more focus on international expansion through dealers and partners will allow us to address and serve our customers much better and reach new markets globally,” states CEO Martijn Arkesteijn. “We are still looking for companies to join our dealer network. With a strong network of local dealers, we aim to put all the necessary high-precision geodetic monitoring data within reach for all professionals worldwide,” he concludes.
Start-Up
37
Issue 4+5 2023
New FIG president reflects on early milestones and looks ahead to the future
Partnerships and people
Less than six months into her term of office, GIM International spoke to Diane Dumashie, president of FIG (2023-2026), to hear about her experiences so far. Here, she shares her perspectives on a key milestone – the FIG Working Week 2023 in Orlando, USA – and discusses her future intentions as FIG president. She discusses FIG’s plans to build partnerships and joint outputs, the importance of benefiting people and planet, and attracting young talent.
How do you feel when you look back on the first five months of your term as FIG president?
I’m so pleased to have had the opportunity to engage with so many members already. I promised during my campaign that my leadership would include being visible to FIG members and our external stakeholders. This is important as the face of FIG, but it also involves actively listening to enable me to be in the best position to steer and make decisions that affect our organization on a number of levels. I’ve recently returned from the FIG Working Week in Orlando. Those ten days were definitely a pinnacle milestone of my first six months. I’ve regularly been reaching out to presidents of our associations and chairs of our commissions and networks, as well as academics, individuals and strategic partners since October 2022, but it was marvellous to meet the FIG community in person in Orlando. To see us all come together with such energy was inspiring. I’ve said many times that it is key to ensure communication, connectivity and collaboration with FIG members and partners. Above all, my message was positively taken on board about underpinning sustainability on all fronts: sustainable people in our profession and sustainable development in our actions – including climate action – will only be achieved by also ensuring sustainable partnerships.
You’ve previously said that the role of FIG is to maintain an influential voice at all levels to continue its beneficial societal impact, and to lead and advocate to raise awareness for its members. How do you intend to contribute to that as president?
A great deal has changed recently, not least the COVID-19 pandemic which I regard as a generationally pivotal episode affecting global society. So what I intend to do in my presidential term is make sure that the FIG membership understands what FIG stands for and how its members are actively collaborating and working together across
the world. As the leader of FIG Council and Commission Officers (ACCO), my role is to advocate the good standing of our members as we collectively aim to promote and use professional best practices and standards. As stated in the FIG vision and strategy, ‘Surveyors serving society for the benefit of people, planet and to work in partnership’, we need to be relevant and promote the usefulness of the profession for the public good. As recognized experts in the scope of land administration, land management, geospatial information management and connected surveying and mapping activities, we have a responsibility to respond to this global agenda and to contribute to improving the living conditions in our societies. Over the next four years, I will be supporting FIG – in conjunction with partners – to tackle the global challenges in the land, marine, natural and built environments.
Are there any areas in which you would like to improve FIG’s representation?
Having such a multi-stakeholder approach does come with challenges, not least because there are so many issues that deserve attention. FIG remains open and actively works to be aware, at the very least. But as a federation of volunteers, we need to make careful choices. At the same time, it is important for me to strive to be as inclusive
38 Issue 4+5 2023
Interview with Diane Dumashie, president of FIG / By Durk Haarsma, GIM International
as possible, both around the world and also across generations. In terms of international inclusiveness, one important outcome of the Working Week in Orlando has been the potential to form an Americas Regional Capacity Development Network. This was the direct result of active deliberations led by FIG and a collaborative spirit with FIG member countries in the region, including the Latin American Regional Association, collectively known as APPAT. The network will be modelled on existing FIG networks in the Africa and Asia-Pacific regions. As an example of generational inclusiveness, one of FIG’s strategic objectives is to get better at promoting and encouraging the younger generation into our profession. Last year, I was introduced to a network called the Youth Initiative for Land in Africa (Yilaa), which is making remarkable efforts in land governance and civic society outreach. I am so impressed that I have linked them to FIG’s upcoming Diversity and Inclusion task-force to effectively collaborate and leverage our mutually respective objectives.
What is your relationship with other fora such as the World Bank and UN-GGIM?
We have many global and regional partners. In the context of all of them, sustainability is about making sure that both internal and external partnerships are working effectively and cultivating stronger engagement for the good of all. Both the World Bank and UN-GGIM are specifically about that too. We very much value our collaboration with both of them and I am keen to ensure that this continues. FIG has been active within UN-GGIM for a long time both on a general basis and also at a workgroup expert level. Much work has been done, but I feel we could be better at being more visible. After all, wherever you look, there is evidence that collecting and interpreting geospatial data is building the world around us. Interestingly, in Orlando we discussed the responsibility this brings if we wish to serve both ‘people’ and ‘planet’. In my view, geospatial information is so obviously a fundamental to our work, as it impacts land management, land administration, agriculture, biodiversity and climate. Similarly, our relationship with the World Bank goes back a very long way but I
to the UN’s 2030 Agenda for Sustainable Development, which is currently very much driven by a need to act now to address the climate issues, and we have an ongoing task-force for the agenda.
plan to actively step up our relationship. Going forward, the Council Work Plan is to build partnerships and joint outputs through FIG commissions and networks.

How are your goals for the 2023-2026 term aligned with the Sustainable Development Goals?
The key to a sustainable profession is that we deliver services in a sustainable manner. As a recognized UN NGO, FIG is closely aligned
FIG’s Work Plan 2023-2026 is a work plan for people and the planet. It can be seen on a series of levels. The first overarching vision is to ‘serve society’. The second level is the action-orientated theme of ‘tackling the global challenges’. Combining these provides us with a focus on people and planet in the nexus of land and natural resources. These two levels underscore that our profession operates at the global level and practises at the local level. We are a bridge able to articulate between the policymakers and society. Under this is the level that ensures we navigate this agenda, i.e. the sustainability aims which each form the core of our plan. The five key dimensions at the heart of the 2030 Agenda – people, planet, partnership, peace and prosperity – provide a foundation for our own approach. They inspire us to think creatively and critically rethink the way we approach the development challenges of today. So you can see that sustainability acts like a glue to bind together all of our aims and objectives; it is a golden thread of a sustainable approach throughout. We contribute to sustainable development and respond
39 Interview Issue 4+5 2023
Wherever you look, there is evidence that collecting and interpreting geospatial data is building the world
to the climate agenda by reaching out under four broad aims, with objectives that can influence to build the capacity and develop standards, thereby ensuring the professional sustainability of FIG members’ work and contributions. The first three aims draw on the three P’s: people, planet and partnership. The fourth is an inward-focusing aim looking at our own profession and internal governance. Crucially, FIG will execute these aims through its structure of the Council and the ten professional commissions, as well as networks and the Permanent Institutions. However, to operationalize and leverage the ethos of our aims, we will be guided by the work of Council-appointed task forces that provide the overarching pillars to unpack our relevance and societal benefit in all four of our broad aims.
What do you perceive to be the most threatening development for the sector, and how can it be tackled?
During my presentation in Orlando, I quoted JF Kennedy who said “Beware of the danger, but recognize the opportunity”. For me, this sums up the important nuance between ‘threats’ and ‘challenges’. Professionals need to be forward-looking and proactive in order to remain relevant, including to society. That’s why FIG’s action-orientated approach has a theme of ‘Tackling the global challenges’. But in terms of the most threatening risks, I would start by understanding the global megatrends affecting societies. I particularly like the list by Professor Gratton, who states a subtle combination of five forces: the needs of a low carbon economy, rapid advances in technology, increasing globalization, profound changes in longevity
and demography, and important societal changes. In terms of the sphere of influence of our profession, and therefore FIG, one key role in tackling these is bridging the gap between high-level strategy and policy on the one hand, and the actions on the ground that contribute to sustainable development on the other. If, as a profession, we think and act with agility, we are well-placed to clearly
Orlando, for example, FIG and the USA LOC invited a country-national plenary speaker to share knowledge relating to ‘the new frontiers of space and the surveyor’. And a third action is the ongoing partnership FIG has with UNOOSA (United Nations Office for Outer Space Affairs, Ed.), thanks largely to the ongoing efforts of Commission 5.
In an interview in GIM International in 2022, you acknowledged the need to attract and develop people with the right talent and skills to fulfil the ambassadorial, collaborative and engaging leadership roles of the future. What will you do to achieve that?
The Work Plan includes a number of actions that focus on our own people: our members. We must all continue to develop and grow to ensure that we – both as individuals and as a federation of members – remain relevant and capable of delivering on our strategy, at the same time as making sure no one is left behind. To achieve that, we will continue to support the work of the ten technical commissions, who are at the very heart of
articulate how to deliver meaningful actions around the world. Professions across the work spectrum face the internal threat of not evolving and consequently of not being of benefit to society. To continue to provide leadership in society, we must be ready to innovate, to adapt and to lead the response to change. To remain impactful over the coming decades, all of our members’ work will be shaped by the major global forces affecting societies. Firstly, in this context, one key objective in the FIG Council Work Plan is to set up a task force on the role of FIG in international trends and future geospatial information ecosystems, ensuring it looks at the relevance of FIG members and their professional practice. Secondly, we are striving to match thought leadership with professional practice. At the Working Week in
FIG activities, and promote professional development by providing a global forum for discussion and exchange, both at our annual conferences and through the working groups and seminars of our commissions.
What about attracting young people to the profession?
I believe it is very important to raise the visibility of young people in the surveying profession. The FIG Council will facilitate the voice of young surveyors across all of FIG’s structures. As a start, I invited a young surveyor to be on the Council as a permanent representative, in addition to nominating a young surveyor to co-chair a Climate Compass Task Force that was established at the 46th General Assembly in parallel with the Working Week in Orlando.

40 Issue 4+5 2023
I wholeheartedly believe that FIG delivers thought leadership as well as tackling the challenges facing society
In today’s deglobalizing world full of tensions, how do you see the future of FIG as a global, learned society?

I wholeheartedly believe that FIG delivers thought leadership as well as tackling the challenges facing society. Our leadership in new knowledge-making is global, and our professional practice is local. However, the work of all of our members will be shaped by the major global forces affecting societies. These include climate action, rapid urbanization, environmental and resource stewardship, the technology revolution and profound changes in longevity and demography. To continue to provide leadership in society and remain impactful over the coming decades, we must be ready to innovate, to adapt and to lead the response to change.
Which specific skills will be crucial for that?
As president of FIG, my aim is to lead our family of professionals in the land, marine, built and natural environments to collectively help our profession to step up and ensure we remain relevant and resolute. This means we will all need to demonstrate clarity and collaboration, which calls for a listening-and-action approach. Besides that, we will need purpose and reliability, visibility and courage. Above all, it comes down to working together to deliver. This will require the better and greater application of soft skills, not only including leadership and organizational management, bu t also empathy so that we excel at being ‘stakeholder-smart’.
Dr Diane A. Dumashie, FRICS, CEDR, has been president of the International Federation of Surveyors (FIG) since the start of 2023, having held several senior officer positions in FIG over the past 20 years. These included FIG vice president, FIG Commission chair, FIG Task Force chair, and founder and chair of the FIG Africa Regional Capacity Development Network. Dumashie holds a doctorate in Land Policy Planning & Integrated Coastal Area Management, and a BSc in Land & Property Management. She is a Fellow of the Royal Institution of Chartered Surveyors and an accredited member of the Centre for Effective Dispute Resolution (CEDR). She is also Trustee Board member of the Lionheart Benevolent charity serving chartered surveyors.
41 Interview Issue 4+5 2023
About Diane Dumashie
Ordnance Survey partners with OxTS
Creating a scalable and reliable mobile mapping and point cloud data collection system
Ordnance Survey, the national mapping agency for Great Britain, was in need of a faster and more cost-effective way to collect georeferenced point cloud data, because the existing method was not sustainable in the long term. The Ordnance Survey team turned to Datron Technology and OxTS to help them develop a convenient, low-cost, ‘off-the-shelf’ mobile mapping system.
Ordnance Survey wanted to build a mobile mapping system that would allow the creation of accurate, georeferenced point cloud data that could be used for feature identification and extraction. The system needed to be cost effective and have the ability to scale nationally.
Who is Ordnance Survey?
Ordnance Survey (OS) creates, stores and distributes detailed location information for Great Britain. The organization records and maintains 500 million geospatial features in the National Geographic Database of the nation, making over 20,000 updates every day. It has been mapping the nation since 1791 and has continued to evolve to meet its needs. Innovation is at the heart of everything Ordnance Survey does, and the OS experts are at the cutting edge of collecting, maintaining and distributing geospatial data.
What was the overall aim of the project?
Ordnance Survey is an experienced user of mobile mapping technology and has used expensive, high-grade technology to create accurate, georeferenced point cloud maps in the past. Whilst this method works, using high-grade, expensive systems for a long-term data collection programme is neither manageable nor sustainable. The OS team required a lower-cost setup that was simple to use and
could scale easily. The new system needed to support the reliable creation of accurate georeferenced point clouds that could be used for feature identification and classification.
The challenges
The first challenge Ordnance Survey faced was to build a system that would offer the ability to create an accurate digital representation of the surrounding environment: a 3D point cloud. The features within that point cloud would be subsequently labelled and segmented where necessary. To create the point cloud, Ordnance Survey would have to build a mobile mapping system that could be mounted on a vehicle. It would need to include a number of components such as a Lidar sensor, cameras and an inertial navigation system (INS). Although OS already had the Lidar sensor, an accurate INS was required to provide the position, navigation and timing information needed to create the point cloud.
Another challenge Ordnance Survey needed to overcome was software integration. Previously, the team had been using the Autoware/ROS technology stack alongside a Velodyne VLP-16 Lidar sensor to allow them to simultaneously collect Lidar and GPS-RTK data. However, they quickly realized that they wouldn’t be able to time-synchronize and merge the two sets of data without investing significant amounts of time into software development. This meant that they had to rely on existing ground control points to georeference the point cloud data. Unfortunately, though, that method is unsuitable for building a long-term mobile mapping strategy because it is susceptible to GPS/RTK dropouts.
To overcome these challenges, Ordnance Survey needed a costeffective mobile mapping system that allowed the concurrent collection of accurate location, navigation and Lidar data. The chosen solution also needed to provide OS with a way to quickly and simply combine the two sets of data to create time-synchronized, accurate 3D point clouds.
The solution
The mobile mapping system that Ordnance Survey developed included the following hardware components:
• 1x Velodyne VLP-16 Lidar sensor
• 8x cameras with 360-degree coverage (with redundancy for future sensor fusion)
• 1x OxTS xNAV650 inertial navigation system
• The system was mounted on a Streetdrone Twizy, which is a selfdriving-capable vehicle.

42 Issue 4+5 2023
An Ordnance Survey mobile mapping vehicle.
Ordnance Survey was already aware of OxTS through the Autoware and Streetdrone communities. However, it was only when the business requirement emerged that the team looked more closely at OxTS to understand what could be achieved. They also engaged with the local, UK-based channel partner, Datron Technology, to learn more about the OxTS hardware and software portfolio. Datron has been an OxTS partner for many years, and helps OxTS customers make technical and commercial decisions prior to purchase. It also handles first-line post-sales support.
Through its own research, and also by working closely with Datron, Ordnance Survey decided that it could best achieve its goals with a combination of the OxTS xNAV650 INS working in conjunction with OxTS Georeferencer, the company’s Lidar georeferencing software. There were a number of reasons for this decision. Firstly, through the tight coupling of cutting-edge MEMS IMU sensors and surveygrade GNSS receivers, the xNAV650 would give Ordnance Survey the ability to capture highly accurate position, navigation (heading, pitch and roll) and timing measurements necessary for the creation of precise 3D point clouds. Additionally, the hardware is cost effective, plus its small size and low weight make it simple to mount. OxTS Georeferencer also played an important role in the decision. The software has built-in software integrations with many Lidar sensors, including the Velodyne VLP-16 which is already in use at Ordnance Survey.
Products used
xNAV650: A high-grade miniature INS from OxTS. It uses survey-grade dual-frequency GNSS receivers and custom MEMS IMU for centimetre-level position accuracy, precise orientation and true heading. It logs the
OxTS: The global leaders in inertial and GNSS since 1998
At OxTS, we’re passionate about inertial navigation and how we can help our customers with our accurate and reliable georeferencing solutions for land, air and marine applications. With over two decades of experience in combining the best of high-precision GNSS receivers and world-class inertial navigation expertise, OxTS products have become the industry standard for automotive testing and are widely used in other industries. Our products provide position, roll, pitch, heading and other measurements of vehicles on land, sea and in the air. Our highly accurate RT3000 series is used by almost all car manufacturers in the world for vehicle dynamics testing, validating advanced driver assistance systems (ADAS) sensors or developing self-driving cars. Our range of combined, compact GNSS/INS systems are used for sensor position and orientation on mobile mapping vehicles or for direct georeferencing of data from airborne surveying. Find out more at www.oxts.com
navigation data on internal storage for downloading and viewing post-mission. For many applications, such as corridor mapping and precision agriculture, the xNAV650 provides one of the best price/performance ratios on the market.
OxTS Georeferencer: OXTS’s proprietary Lidar data georeferencing software. It takes the position and navigation measurements from an INS and combines them with the raw data from a wide range of Lidar sensors through a simple ‘drag & drop’ method. An additional boresight calibration tool allows OxTS Georeferencer users to take advantage of a simple Lidar and INS sensor calibration method to eliminate blurring and doublevision from point clouds.
“The collection is very quick. Once the unit is on, the initialization and warm-up time are minimal and we’re collecting data quickly. We boresight every so often, but our setup is quite static. For mobile mapping, this is an extremely costeffective way of gathering data.”
James Clarke, Research Software Engineer, Ordnance Survey
The pre-built integrations with the Velodyne VLP-16 mean that the OS team do not have to spend any time writing code to georeference the Velodyne VLP-16 data. Instead, this work has already been done by OxTS. Therefore, they simply have to collect the Lidar data alongside the navigation data from the xNAV650. Then, using the simple ‘drag & drop‘ method within OxTS Georeferencer, they are able to georeference the Lidar data in a matter of seconds.
The company has also used another feature available within OxTS Georeferencer, the boresight calibration tool, effectively. The coordinate frames of the Lidar sensor and INS must be calibrated precisely. Otherwise, the resulting point cloud can be susceptible to blurring and double vision. However, precise calibration can be very difficult to achieve by eye. Having access to the boresight calibration tool means that the OS team simply need to survey two static ‘targets’ from various angles and distances. Then, at the touch of a button, OxTS Georeferencer is able to calculate the angles to a tenth of a degree. As Ordnance


Sponsored article 43 Issue 4+5 2023
The goal: a georeferenced 3D point cloud.
Survey’s set-up is quite static, the boresight calibration only has to be conducted every so often.
Prior to purchase, Ordnance Survey was supported by Datron, who helped the organization to choose the right configuration and aided integration with the existing Lidar sensor.
Results
Although the organization is still early in the data collection and processing phase, the results gained up to now have been very promising. So far, Ordnance Survey has been able to collect and process data from a local town, and compare it to both a groundtruthed aerial point cloud, and a Lidar point cloud collected with a


high-end mobile mapping system. Despite the vast difference in price between the two systems, the results have been equally impressive. Arguably, however, the most pleasing aspect of the project so far is how the xNAV650 device and OxTS Georeferencer have impacted Ordnance Survey’s workflow and improved efficiency.
As standard, the xNAV650 includes NAVsuite, a software toolbox that allows users of OxTS INS devices to configure, monitor, analyse and post-process their INS data. Ordnance Survey has found both NAVsuite and OxTS Georeferencer to be simple and straightforward to use, allowing the team to get up and running quickly.
“The biggest change has been the convenience of the off-theshelf nature of the collection, and the processing. This has saved many development hours. The software has also been very intuitive to use.”
 James Clarke, Research Software Engineer, Ordnance Survey
Although Ordnance Survey is still early in the adoption phase, the team have been very pleased with both the clarity of the point cloud and also the impact on cost and efficiency. By using a combination of the OxTS xNAV650 INS and OxTS Georeferencer alongside their Velodyne VLP-16 Lidar sensor and Streetdrone Twizy vehicle, they have reduced their mobile mapping costs and improved efficiency while at the same time maintaining the quality of their final product.

44 Issue 4+5 2023
GIMInternational isatrusted sourceof independent informationfor thegeomatics industry.Stayupto-datewiththe latestglobal insightson technologyand managementby subscribingto ournewsletter.
Ordnance Survey’s initial point cloud results.
Advancing towards autonomous vehicles
Digitizing Israel’s road network with high-end geospatial technology
By Ori Cohen, Kav Medida Group, Israel
Israel’s national roads company is embarking on a large-scale, multi-year project to digitize its entire network. Surveying company Kav Medida has been awarded the contract to map the northern half of the network using advanced GIS software, UAVs and 360° mobile mapping cameras. The resulting digitized maps will significantly improve the accuracy and efficiency of road maintenance and monitoring in Israel, providing detailed measurements related to lighting pole arm lengths, sign heights, traffic sign azimuth, ditch type and cross-section depths. This article provides a closer look at how geospatial data is being captured and utilized, and how the company has implemented innovative solutions to enhance productivity while simultaneously reducing operational costs.


Like many modern countries, Israel is continuously improving its transportation infrastructure. Netivei Israel, the national roads company of Israel, is currently modernizing the maps of its intricate network of roads. Netivei Israel manages 90% of Israel’s roadways from the planning and building stages through to maintenance. Due to the dynamic nature of the 8,500km road network and Israel’s
burgeoning population creating an everincreasing demand for new, well-managed roads, Netivei Israel decided to embark on an ambitious multi-year GIS-based project to digitize its entire road infrastructure. Kav Medida, a prominent survey company in Israel, has been awarded a contract to map the northern half of Israel’s roadways in this largest project of its kind. It is utilizing Esri’s
ArcGIS Pro to create digitized maps with precise accuracy, and mainly using opensource QGIS with self-developed customized tools. Through the use of orthophoto, aerial imaging, ground-based 360° mobile mapping and – in rarer cases – on-site field observations, precise measurements and detailed data about roadway features produce high-resolution digitized maps.
45 Feature Issue 4+5 2023
Kav Medida’s mapping vehicle. network.
Using an advanced GIS-based methodology, the current GIS system will be upgraded to drastically improve the accuracy and efficiency of road maintenance and monitoring in Israel. The level of map detail is unprecedented in Israel. For example, there are detailed measurements relating to lighting pole arm lengths, heights of signs above roadways, azimuth of traffic signs, ditch type and depths at various cross-sections, to name but a few examples. These detailed maps will undoubtedly pave the way for the future of autonomous vehicles on Israel’s roads.
GIS road mapping
Starting in 2021, Netivei Israel initiated a massive undertaking to map all of its roads using advanced geographic information system (GIS) methodologies. This is a significant development that has the potential to revolutionize how roads are monitored and maintained, as it will be fully integrated into Netivei Israel’s existing GIS system. This undertaking is expected to have a profound impact on the efficiency and safety of Israel’s transportation network.
The project involves delivering 200km of mapped roads per month while ensuring strict quality assurance (QA) standards and several supervisory controls. Each batch of deliverables will include a geographic database (Esri GDB) comprising 37 feature layers such as lighting poles, paint strips, bus stops, traffic signs and more. Additionally, two sets of maps (orthophoto and non-orthophoto) in PDF format will be provided, with each section of roadway divided by index based on pre-defined cartographic parameters. Each batch will have indexes mapped based on three categories of scale, namely 1:250 (intersection), 1:500 (interchange), and 1:1,250 (freeway). Finally, panoramic (360°) images will be delivered through a link to a web application.
The project presents various obstacles for the land surveyors, such as adapting to a GIS environment instead of the more familiar DWG/DGN CAD software, meeting demanding production requirements, mapping areas with limited visibility, and operating in GPS-restricted or security zones. Despite these challenges, the team must prioritize maintaining project accuracy within established parameters to ensure its overall success. Kav Medida’s methodology was developed to bring consistent and reliable long-term results. This methodology consists of three areas: data collection, digitization & classification, and data distribution.
Geospatial data handling
For data collection, two main mapping devices are employed: uncrewed aerial vehicles (UAVs or ‘drones’) and 360° mobile mapping photogrammetric cameras. When used together, these advanced technologies have an overlap of 80%, enabling mapping of 95% of the total features without requiring on-site field assessments. This approach results in cost savings, more precise measurements and faster output.


To ensure consistent geographic positioning with both devices, the same ground control points (GCPs) are established as benchmarks for georeferencing, with one GCP set for every 500 metres. Once all the data is captured and processed, the mapping work can start in the office. Ten GIS operators begin the task of sectionalizing the data into chunks, while the GIS manager oversees the assignments for each team member. Each operator works within their own area of expertise, e.g. data arrangement, digitization, classification, QA, etc.
Although the project is well managed, there are limitations to the workflow in the form of parallel work limitations. Mapping with proprietary GIS software is restricted when multiple users are utilizing the same geodatabase simultaneously. To solve this, QGIS was used to build a server environment to control all the work conducted by the operators. More specifically, the solution consists of a server that can monitor and build the GDB on the fly, while automatically producing many more insights. These insights include: which layer was mapped by which operator, where the weak link is in the QA process, which layer consumes more time per operator, GDB list errors, and more.
46 Issue 4+5 2023
The measured height of lighting pole using the mobile mapping system. features.
QGIS has proved to be more cost-effective since it is an open-source application with no licence fees and no limit to the project team’s size. In fact, this unique server method enabled the GIS team to work from home during the COVID-19 lockdowns, which also allowed specialized talent to be hired from overseas. On top of all this, Orbit (3D mobile mapping software) built a QGIS plugin so that all the aerial imagery can be streamlined to the working environment.
The key role of UAV-based mapping

One of the aims of the project is to minimize post-production labour. In order to achieve this, advanced equipment like the reliable DJI Phantom 4 RTK is used for a more comfortable photogrammetric process. Flight routes are set to a nadir (vertical) configuration with a forward and side overlap of 80% between images. The UAV’s flight paths are arranged to follow terrain so that it stays within the nominal range of Israel’s entire SRTM topographic elevation database. Advanced UAV data processing is comprised of aerotriangulation of the image block, to then create true orthophotos to a resolution of 1.5cm/pixel. The need for creating true orthophotos rather than standard orthophotos is mainly due to digitization requirements which require that tall objects like bus stations are digitized with absolute 2D accuracy.
When producing 200km worth of high-resolution true orthophoto images per month, one of the challenges is the need for highperformance computer processing. For this purpose, a network clustering of advanced personal computers was installed at Kav Medida’s headquarters in Herzliya and has been running 24/7 since the project’s inception. The processing is mostly automated via Python scripting for orthomosaic and product exportation phases. There are additional sub-products like digital surface models (DSMs), and a variety of external orientation files that can be used for stereo mapping systems for additional extraction and 3D meshing.
Data distribution
Once all the GIS digitization is completed, the data is then delivered to the client and the external QA team. Given the extensive breadth of the project, the data comprises tens of terabytes from both UAV and mobile mapping cameras, GIS databases, orthophoto and DSM files, and ground control points. By using a published mobile mapping interface, all users can access any portion of any road from both a mobile and an aerial angle of view. Moreover, the end-user can utilize the built-in photogrammetric tools to measure, test and check all files via an internet browser. The final step is creating the PDF cartographic map, of which 60% is done automatically by using ArcGIS Pro.
Ori Cohen is the chief technology officer at Kav Medida Group, a leading national service provider of various mapping products. He is an executive technology leader and commercial pilot with years of expertise in leveraging cost-effective, cutting-edge solutions in the areas of photogrammetry, UAV operations, 3D reconstruction, mobile mapping, BIM and GIS. He specializes in analysing and building technological methodologies for large, complex projects using diverse data acquisition and analysis techniques.

The future of road transportation
In addition to serving Netivei Israel’s own purposes, the more precise and complete maps can be utilized by autonomous vehicle companies to help drive autonomous vehicle technologies. These prebuilt maps will serve as their baseline. In conjunction with active Lidar, radar, sensors, cameras, GPS and machine learning as supporting technologies, they will aid autonomous vehicles in navigating and continuously improving their traffic performance over time. Autonomous vehicle companies will integrate on-the-fly data into their autonomous vehicles’ geodatabase using online push updates.
Looking to the future, timely and accurate data will be increasingly critical to many facets of Israel’s infrastructure, especially with the advent of smart cities. One such critical facet to the Internet of Things is the implementation of autonomous vehicles on the road, where real-time data will be necessary and paramount, both with vehicle and road data. Detailed maps are one component of this. Vehicles will be able to communicate data to each other in real time, and process that data by utilizing machine learning with the use of advancements in artificial intelligence (AI).
Conclusions
Israel is paving the way for advanced mapping methodologies by leveraging cutting-edge technology. With the ever-increasing accuracy of road mapping, maintenance can be carried out more efficiently and with greater precision. Technological advancements in mapping and surveying have been greatly accelerated by Israel’s expertise in storing and processing surveying and mapping data using digital information systems. Israel’s leadership in AI and machine learning has also facilitated the swift transition from traditional technologies to modern, advanced solutions, meeting the rising demands of the industry. This will result in more accurate maps, which in turn will aid the proliferation of autonomous vehicles, as road features can be input with greater detail and accuracy. The future of mapping poses new challenges, but it is also very exciting!
47 Feature Issue 4+5 2023
About the author and mapping vehicle.
Two new FIG publications
The FIG publications are divided into four categories: Policy Statements, Guides, Reports, and Regulations. This helps readers to identify the profile and purpose of the various publications. Two new FIG reports have been published recently.
Publication 78: Geospatial Data in the 2020s – Transformative Power and Pathways to Sustainability

This FIG publication is the result of a very fruitful cooperation between FIG Commissions 3 (Spatial Information Management) and 8 (Spatial Planning and Development), together with the FIG Young Surveyor VCSP Volunteer Community Surveyor Program (VCSP) in recent years. The main editor of the publication is Hartmut Müller (chair of FIG Commission 3, 2019-2022) together with Claire Buxton, Marije Louwsma and Markus Schaffert. The current megatrends, such as climate change and resource scarcity, rapid advances in technology like artificial intelligence and machine learning, changes in global demographics – in particular the ongoing growth of the world’s population and the rapid ageing of populations in many countries – and global migration to megacities, are all causing disruptions and will pose major challenges in the coming years. Traditionally, land surveyors used to be viewed as ‘measurers’. In recent years, the surveyor has evolved to a professional who measures, models and manages all kinds of location-related data. Surveyors use
open standards, incorporate volunteered information and ensure interoperability of systems to deliver knowledge derived from geospatial data of different scales and origin in the form of user-adapted geospatial information. This FIG report sheds light on several areas where geospatial data can be particularly useful in supporting the path to sustainability in the 2020s. These include for spatial land use planning and health monitoring, with data collection through voluntary geographic information, with attention to diversity and inclusion, and by providing information on property, including property values.
FIG Publication 79: Land Consolidation –The Fundamentals to Guide Practice


Land consolidation is a specialized land policy instrument, which has already been on the agenda within the FIG community for a long time. Papers about land consolidation are submitted for the FIG Working Week or Congress every year. FIG Commission 8 on Spatial Planning and Development, chaired by Marije Louwsma (2019-2022), decided to bundle the available international experiences, insights and knowledge into a FIG publication. The authors are Marije Louwsma, Walter de Vries and Morten Hartvigsen.
In view of climate change, sustainable land use and development is more urgent than ever. Land consolidation is a land policy instrument that can consider
spatial developments in a coherent and comprehensive approach, integrating various sectoral policy domains. Water management, soil quality, environmental values, protected nature reserves, agricultural developments, infrastructure, cultural heritage and rural development can all be considered – or at least their spatial component – in land consolidation projects. This FIG publication aims to provide an overview of relevant topics for land consolidation practice, including different forms of land consolidation, public participation, valuation, developing the land consolidation plan, GIS tools and monitoring and evaluation of projects and programmes. It seeks to find a level of detail that provides insights for responsible agencies and professionals involved in land consolidation. Hopefully, this publication by Commission 8 will inspire and support government agencies, decision-makers and professionals to implement land consolidation projects and programmes in a sustainable, inclusive and participatory way. The expertise of the surveyor can guide the application to enhance an inclusive, just and fair reallocation process in various tenure systems and land administration traditions. As such, it complements existing publications about land consolidation such as the FAO’s recent legal guide on land consolidation.
More information
Full list of FIG publications: https://www.fig. net/resources/publications/figpub/index.asp


Issue 4+5 2023 48
UN Centre of Excellence in Geodesy opens in Germany Supporting the development of a permanent, globally coordinated geodetic infrastructure

In an important milestone for global cooperation in geodesy, the United Nations Global Geodetic Centre of Excellence (UN-GGCE) was officially opened at the UN Campus in Bonn, Germany, on 29 March. The most important task of the UN-GGCE is to support the development of a permanent, worldwide governmentally coordinated geodetic infrastructure. This infrastructure includes, for example, observation stations around the world and data and analysis centres.
The UN-GGCE is of central importance for Earth observation and navigation applications, as well as for socio-politically relevant topics such as stable living conditions, climate change, land use or even safe autonomous driving. “With the help of the UN-GGCE, we will be able to record and monitor changes in sea level or the movement of the Earth’s crust more quickly and accurately in the future,” stated Juliane Seifert, State Secretary of the
German Federal Ministry of the Interior and Community. “With the UN-GGCE, the German government supports the implementation of the United Nations 2030 Agenda for Sustainable Development and thus creates an elementary building block for improving Earth observation and positioning.”

Benefits for the whole world
To mark the occasion of the official opening, Peter Thomson, UN Special Envoy for the Ocean, commented: “All the best, and congratulations to you and colleagues on delivering the UN-GGCE Centre of Excellence. From Svalbard to the Australian Outback, and from melting ice caps to rising sea levels, the whole world stands to benefit from constant improvement of – and investment in – our geodetic infrastructures.”
“Many geodetic tasks, such as the permanent observation and calculation of satellite orbits as a basis for navigation applications, can only be tackled jointly,” remarked Prof Dr Paul
Becker, president of the German Federal Agency for Cartography and Geodesy. “The UN-GGCE will help countries – especially developing countries – improve national contributions and promote the open exchange of data and observation results.”
50 years of UN membership
Meanwhile, representing the German Federal Foreign Office, Ambassador Dr Rainer Lassig welcomed the opening of the UN-GGCE as the 26th United Nations facility on the UN Campus in the Federal City of Bonn. According to him, this proves that Germany continues to be an attractive partner and appealing location for international organizations in 2023, when the country is celebrating 50 years of membership of the United Nations.
The UN-GGCE is part of the Department for Economic and Social Affairs (DESA) of the United Nations, based in New York, USA. The concrete work plan at the UN Campus in Bonn initially covers three years.
Issue 5 2023 49
Ceremonial opening of UN Global Geodetic Centre of Excellence in Bonn. (Image courtesy/soure: Bundesamt für Kartographie und Geodäsie/Twitter)
Relationship between metadata, data repositories and the Bemeda search tool. One outcome of the ‘Publishing dataset guideline: gaps and trends in research data management in the ISPRS community’ project now underway at TU Darmstadt is a guideline which is compliant with the FAIR principles for data sharing.

To use images for measurement purposes, it is necessary to establish whether they overlap. This is the goal of the ‘BeBaOI: Benchmark and Baseline Methods for determining Overlapping Images’ scientific initiative being managed by Wuhan University and the Technical University of Munich.
ISPRS 2023 Scientific Initiative Awards
Seven international projects boosted by ISPRS funds
Every two years, ISPRS awards up to 10,000 Swiss francs each to one-year projects or ‘scientific initiatives’. According to ISPRS regulations, these funds “… further improve ISPRS’s international status in the fields of photogrammetry, remote sensing and spatial information sciences, and benefit all ISPRS members. [They] strengthen the Society’s scientific activities undertaken by the Technical Commissions.”

Many projects result in comparative assessments and the creation of benchmark datasets, which are becoming increasingly critical as deep learning supersedes handcrafted algorithms.
2023 winners
This year, the following seven projects were chosen to receive awards. All principal investigators (PIs) are accomplished professors or senior research scientists, and one is also a physician:
• Benchmarking of absolute and relative positioning solutions under GNSS-denied
environments for mobile geomatics, Yunsheng Wang (Finland) and Liang Chen (China)
• Publishing dataset guidelines: gaps and trends in research data management in the ISPRS community, Dorota Iwaszczuk (Germany)
• BeBaOI: Benchmark and Baseline Methods for determining Overlapping Images, Xin Wang (China) and Yu Feng (Germany)
• NAUTILUS (uNder And throUgh waTer datasets for geospatIaL stUdieS), Erica Nocerino (Italy)
• Benchmarking of publicly available software solutions for close-range point cloud processing of forest ecosystems, Carlos Cabo (Spain) and Xinlian Liang (China)
• Geospatial data base for exposomics, Kamel Boulos (Portugal)
• Integrating indoorGML with outdoors: Automatic routing graph generation for indoor-outdoor transitional space for seamless navigation, Zhiyong Wang (China)

Education and Capacity Building Initiatives (ECBIs)
In the even years, ISPRS makes similar awards for ECBIs. These are projects that “… include initiatives to strengthen the Society’s educational activities undertaken by the Technical Commissions and/or related structures and organizations, as well as new publicity and management issues.” The call for ECBI2024 proposals will be posted by ISPRS in autumn 2023. The winners will be announced around the end of the year so that the projects can kick off at the beginning of 2024. In addition to SIs and ECBIs, which are awarded biennially, ISPRS’s philanthropic arm – The ISPRS Foundation – provides travel grants. These enable selected students and early-career researchers to present their work at ISPRS and ISPRS-sponsored events, such as the Geospatial Week in Cairo in September 2023.
More info
Summaries of the projects: https://www. isprs.org/society/si/default.aspx
Issue 4+5 2023 50
SMART SUBSEA SOLUTIONS


Delivering data in most adverse conditions: underwater acoustic modems with advanced communication technology and networking


Accurate USBL and LBL positioning of underwater assets
Modem emulator and other cost-saving developer tools
Autonomous surface vehicle for bathymetry, monitoring, search & rescue, and AUV support
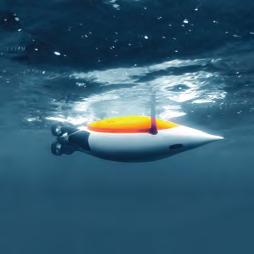
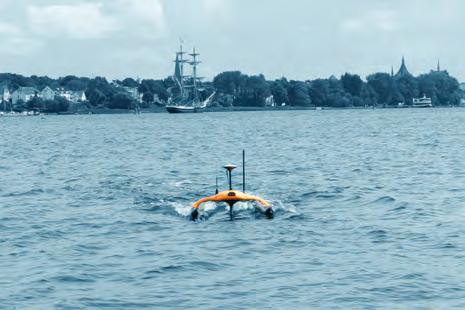


sales@evologics.com sales-us@evologics.com

EvoLogics.de New MULTIBEAM SONAR for the Sonobot 5 vehicle available now!
SCAN PROCESS MODEL OFFER WIN MORE


Drawing on the established power of software and the cloud,NavVishelps Laser ScanningProfessionals scan, process and modelmore data, from more sites, for more clients –in less time.


navvis.com/lsp

DISCOVER NAVVIS VLX 3
