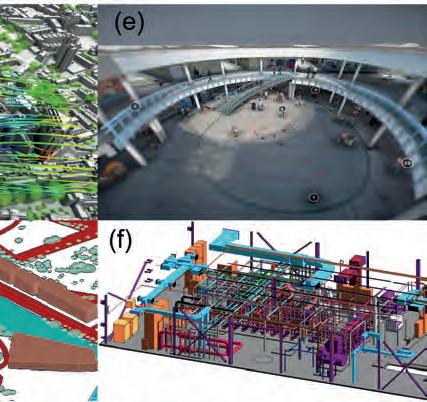
Issue 2 2023
Volume 37
AI-powered climate resilience
The future of coastal analysis, stormwater mapping and green infrastructure planning

Towards the new normal in surveying and engineering
Can AI solve the puzzle of georeferencing title deeds?
National Land Survey of Finland innovates with AI technology

Empowering the geospatial community www.gim-international.com


Director Strategy & Business Development
Durk Haarsma

Financial director Meine van der Bijl
Technical director Huibert-Jan Lekkerkerk
Contributing Editors Dr Rohan Bennett, Frédérique Coumans
Head of Content Wim van Wegen
Copy-editor Lynn Radford, Englishproof.nl
Marketing Advisor Myrthe van der Schuit
Business Development Manager

Jurjen Visser
Circulation Manager Adrian Holland

Design ZeeDesign, Witmarsum, www.zeedesign.nl
GIM International, one of the worldwide leading magazines in the geospatial industry, is published eight times per year by Geomares. The magazine and related website and newsletter provide topical overviews and reports on the latest news, trends and developments in geomatics all around the world. GIM International is orientated towards a professional and managerial readership, those leading decision making, and has a worldwide circulation.
Subscriptions
GIM International is available eight times per year on a subscription basis. Geospatial professionals can subscribe at any time via https://www.gim-international.com/subscribe/ print. Subscriptions will be automatically renewed upon expiry, unless Geomares receives written notification of cancellation at least 60 days before expiry date.
Advertisements
Information about advertising and deadlines are available in the Media Planner. For more information please contact our marketing advisor: myrthe.van.der.schuit@geomares.nl.
Editorial Contributions
All material submitted to Geomares and relating to GIM International will be treated as unconditionally assigned for publication under copyright subject to the editor’s unrestricted right to edit and offer editorial comment. Geomares assumes no responsibility for unsolicited material or for the accuracy of information thus received. Geomares assumes, in addition, no obligation to return material if not explicitly requested. Contributions must be sent for the attention of the head of content: wim.van.wegen@geomares.nl.
Use of AI to detect rooftop solar potential
Many roofs still lack photovoltaic systems, leaving them unable to contribute to this transition. Newly developed artificial intelligence (AI) models allow this untapped potential to be quantified on a large scale by processing remote sensing imagery of vast territories with high-level precision.

Can digital twin techniques serve city needs?
It is not enough to simply measure and model cities only once. This article explores whether digital twin techniques can meet city planning needs and help them face their wide-ranging challenges – from sustainability to education, digitalization, infrastructure and healthcare.
Towards the new normal in surveying and engineering

Russell Bollig and John Welter from Hexagon Geosystems recently sat down with GIM International to discuss the impact of AI on the geospatial industry. The conversation focused on hot topics such as the role of AI in speeding up data analysis and decision-making for 3D laser scanning and aerial mapping.
AI-powered climate resilience
The use of AI in monitoring climate conditions is bringing about a revolution, especially in the field of geospatial data collection. With the help of AI-powered digitization, it has become easier to accurately represent real-world changes, enabling communities to better understand critical climate issues.
Geomares
P.O. Box 112, 8530 AC Lemmer, The Netherlands
T: +31 (0) 514-56 18 54

F: +31 (0) 514-56 38 98 gim-international@geomares.nl www.gim-international.com
No material may be reproduced in whole or in part without written permission of Geomares.


Copyright © 2023, Geomares, The Netherlands
All rights reserved. ISSN 1566-9076
Can AI solve the puzzle of georeferencing title deeds?

The discovery of an old atlas with hand-sketched maps of Liberia’s capital, Monrovia, could become the basis for a unique digital cadastre. Since Liberia is a country that largely lacks spatial information, whether as hard-copy maps, cadastral data or otherwise, the finding of the atlas is remarkable.

5 Editorial 6 Headlines 48 Organizations
How the National Land Survey of Finland is exploring AI technology Finland is a good example of how AI is entering national mapping agencies. They set up a national topographic map updating project. By the end of the project, building detection achieved an accuracy of 97.9%, and 96% of building and road changes were correctly identified.

Geomatics education broadens its scope
Are the numbers of students in geomatics and land administration-related studies diminishing worldwide?

Perhaps. Do the majority of graduates want a job in the IT sector rather than as surveying engineers?
Maybe. Despite ‘measuring’ being key in our sector, it seems we have fewer facts available about professional education than you might expect.
Unlocking possibilities and imagining a better future

For anyone aiming to reposition their business outlook or career in surveying and mapping or geospatial information technology, the Trimble Dimensions+ User Conference would be a good place to start. Recently, “the Trimble community gathered to unlock possibilities and imagine a better future.”

Cover story
Artificial intelligence (AI) is a common thread running through our industry nowadays. The applications seem endless, but where do the real benefits lie? This edition of GIM International provides you with an overview of the possibilities offered by AI combined with geospatial data. It is definitely safe to say that AI will continue to play a major role in our upcoming editions!
(Photo: Shutterstock)
Issue 2 2023 3 Contents
8 25 12 28 16 32 21 39 Can AI solve the puzzle of georeferencing title deeds? National Land Survey of Finland innovates with AI technology normal in surveying and engineering www.gim-international.com AI-powered climate resilience The future of coastal analysis, stormwater mapping and green infrastructure planning To subscribe to GIM International go to www.gim-international.com/subscribe
Focusing on True Performance
Total Station V-100N Series

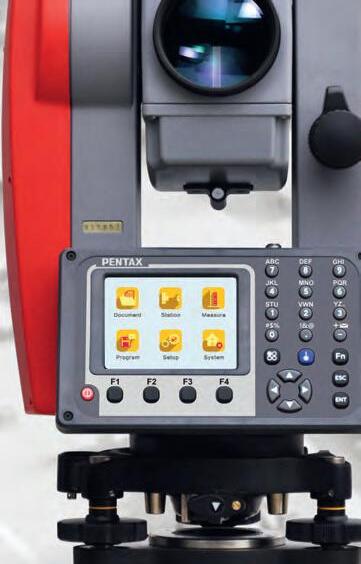
• Extended Reflectorless range: About 1000m


• Quicker measurement time: Less than 1 second

• Longer operation time: About 50 hours with dual/hot-swap batteries

Positioning System G2U


• Powerful GNSS engine compatible with all GNSS systems: GPS, GLONASS, Galileo, Beidou and QZSS.


• Integrated battery for easy power charge via USB cable.


• Compact, light-weighted and robust housing.
• Intergated tilt compensation function.


• The design and specifications of the products are subject to change without notice.


V-101N I V-102N I V-102NL (V-101N,
TI Asahi Co., Ltd. International Sales Department 4-3-4 Ueno Iwatsuki-Ku, Saitama-Shi Saitama, 339-0073 Japan www.pentaxsurveying.com/en/ Tel.: +81-48-793-0118 E-mail: International@tiasahi.com
V-102N)
New New
Some human thoughts on artificial intelligence


Artificial intelligence (AI) has attracted significant attention in our profession in recent years. And it’s easy to understand why the role of AI in the geospatial industry is discussed so frequently at conferences, trade shows and in publications like GIM International; it has the potential to transform the way we gather, process and analyse spatial data. In fact, it has already become a vital element in many mapping solutions. But I can‘t help but ponder the deeper philosophical questions that arise in this context.

Let’s start with the basics: What is ‘intelligence’? It is a complex concept, but it can be broadly defined as the capacity to learn, understand, solve problems and adapt to new situations. In humans, intelligence includes abilities such as language comprehension, memory, spatial reasoning and decision-making. It would be very arrogant to think that humans have a monopoly on intelligence, of course! Indeed, many species of animals, birds, fish and insects are often more intelligent than we give them credit for. Swarm intelligence is a well-known natural phenomenon, for instance. In another example, some crows have learned to place nuts in front of the tyres of stationary cars at traffic lights, so that they are cracked open for them as the cars move off. And creatures such as raccoons are known for having a good memory and strong problem-solving abilities, as demonstrated in various scientific experiments.
So how does AI differ from natural intelligence? AI actually aims to imitate human intelligence, gathering and processing information, identifying patterns and learning from experience to improve its own performance over time. The idea behind AI technology is to enable machines to


‘think’ like humans so that they can function independently and perform tasks that would normally require human cognitive abilities. There seems little harm in this, providing that all this intelligence is used for good things and contributes to progress in positive ways. However, as we have seen in humans, while intelligence is a remarkable gift, it does not necessarily equate to good moral character. As conscious beings, we have the power to use our intelligence to engage in negative behaviours such as bullying and aggression, and to harm the planet. Meanwhile, animals –despite sometimes having advanced levels of intelligence – are often guided by instinct, meaning they have less conscious control over their actions.This leads me to wonder how much control AI-driven solutions have over their own behaviour. What if, at some point in the future, AI evolves into artificial consciousness (AC), so that machines possess self-awareness and sentience? While there’s currently no clear view of when AC could become a reality, it’s important to consider the implications. Could AI surpass human intelligence? Could machines become sentient beings? And if so, could we – as humans – lose control?
The future of AI holds many unknowns. But refocusing on our own profession for now, it is clear that AI is not just a hype, but rather a transformative force that is fundamentally altering the nature of geospatial work in numerous ways – such as by enabling automatic object recognition in point clouds and facilitating advanced data analysis. The convergence of AI, big data and computing power has created the right circumstances for a technological revolution in the geospatial industry. I will leave it to the philosophers to debate on the broader impact of AI on society and the future of the world. In the meantime, I will take a moment to appreciate the intelligent behaviour of the birds in my garden.
Wim van Wegen, head of content wim.van.wegen@geomares.nl
Issue 2 2023 5 Editorial
Bluesky Geospatial debuts MetroVista programme for 3D mapping in the USA

Bluesky Geospatial has announced the launch of its MetroVista 3D aerial mapping programme in the USA. The service employs a hybrid imaging-Lidar airborne sensor to capture highly detailed 3D data, including 360-degree views of buildings and street-level features, in urban areas for use in creating digital twins, visualizations and simulations. Bluesky’s sister company Bluesky International, based in Leicestershire, UK, developed and introduced the MetroVista programme in the UK in 2018 and has since mapped more than 20 cities across England and Scotland in 3D. Boston is the first metropolitan area completed by Bluesky Geospatial in the USA. For data collection, Bluesky flies the airborne Leica CityMapper-2 hybrid sensor which captures simultaneous oblique and nadir imagery along with Lidar elevation measurements. Bluesky processes the data to create georeferenced 3D mesh models with 5cm resolution and 10cm accuracy. The 3D models are delivered in a variety of formats for direct ingest into GIS and CAD environments.
Open Data Challenge hackathon supports implementation of geodata in Central Asia


During the Open Data Challenge hackathon held in Tashkent, the capital of Uzbekistan, more than 200 students, divided into 50 teams, spent three days using geodata to tackle the country’s most relevant issues. The event was organized from 27-29 January 2023 by Uzbekistan IT-Park, Akfa University, the Organization for Security and Co-operation in Europe, the State Anticorruption Agency and the Statistics Agency, with the mentorship support of commercial and state enterprises. The key topic of the annual event is open data and its implementation, and the hackathon was once again aimed at stimulating the development of open data applications. Open geospatial data approaches are becoming increasingly important on the path to digitalization and smart management worldwide, and Central Asia is no exception. The region extends from the Caspian Sea in the west to the border of western China in the east, comprising the countries of Kazakhstan, Kyrgyz Republic, Tajikistan, Turkmenistan and Uzbekistan. Historically, Central Asia serves as a bridge between Europe and the Far East, and is known for the legendary Silk Road. The area is now highly dependent on the agricultural sector. However, its inland position means that the region is cut off from the maritime world trade routes. Moreover, the geographical conditions and features such as rivers, mountains and deserts mean that the Central Asian countries are extremely susceptible to the influences of climate change.
Synspective and Insight Terra join forces for mine tailings monitoring
Synspective, a Tokyo-based provider of SAR satellite data and solutions, has partnered with Insight Terra, a London-based start-up specializing in cloud-based environmental and infrastructure risk management, to offer a new space-based monitoring solution for the mining indus The solution combines satellite and Earth observation data with ground sensors to monitor mine tailings facilities. The partnership combines Insight Terra’s cloud-based IoT platform with Synspective’s advanced SAR data analytics, enabling the use of real-time ground truth and Earth observation data for proactive monitoring and alert generation.
Tailings Insight, Insight Terra’s flagship product for mining, is being used by several global mining companies for tailings dam monitoring. Synspective operates high-resolution, high-frequency SAR satellites called StriX, providing top-quality datasets and solution services.

Issue 2 2023 6
StriX satellites use synthetic aperture radar (SAR) to observe and analyse the Earth’s surface down to sub-metre resolutions. (Image courtesy: Synspective)
The winner of the hackathon – the Dzeench team – created a cutting-edge AI-powered mobile app that integrates local cadastral data with real-time satellite imagery.
Boston 3D image from Bluesky Geospatial MetroVista programme. (Image courtesy: Bluesky Geospatial)
Lidar innovation improves robotic vehicle safety for Mars landings
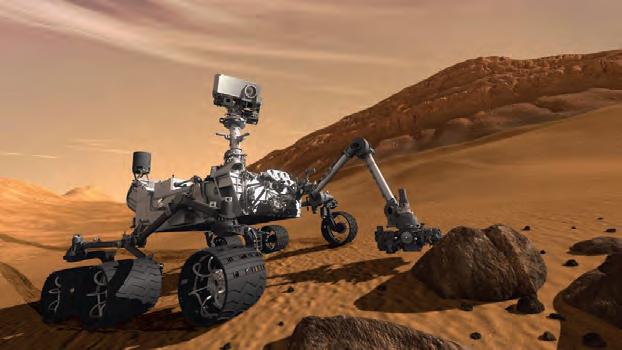
A new Lidar technique could help robotic vehicles avoid hazards when landing during future space missions to Mars or the Moon. The method uses flash Lidar to record full 3D images with a single laser pulse. This prevents the motion blur that is present with traditional Lidar approaches, according to a recent study. The findings were revealed in a presentation entitled ‘Development of a 3D Flash Lidar for Terrain Sensing and Safe Landing on Planetary Bodies’ by principal investigator Farzin Amzajerdian PhD from NASA Langley Research Center. He was speaking at the Optica Laser Congress, held in Tacoma, USA, in December 2022. “Lidar technology plays a critical role in future missions to the Moon, Mars and other solar system bodies, since they require precision safe landing at specific locations where valuable resources may be found or may lead to important scientific discoveries,” said Amzajerdian. Flash Lidar is useful for several purposes throughout the process of landing robotic vehicles. As a vehicle descends to a surface, flash Lidar can be used to generate 3D terrain maps from an altitude of several kilometres to reduce position error. Once it is about a kilometre above the landing site, high-resolution 3D flash Lidar images can be used to identify hazardous terrain features and select the safest landing location. During the final approach, flash Lidar can help to track terrain features and guide the vehicle to the selected landing location.
Galileo high-accuracy service begins delivery
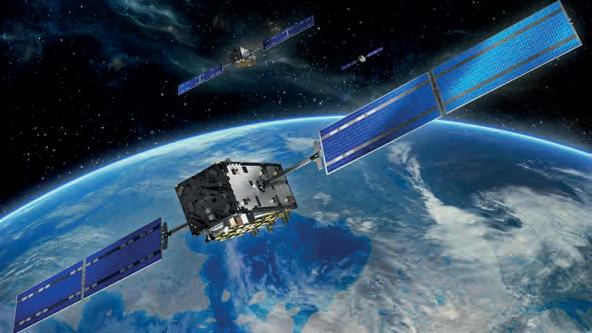
Galileo has begun the delivery of its High Accuracy Service (HAS), as officially announced by Thierry Breton, European Commissioner for the Internal Market. He described HAS as “feeding a prosperous market for innovative applications – from farming to drone navigation and autonomous driving.” Galileo is the European Union’s global navigation satellite system (GNSS). Galileo is now the first GNSS providing free-of-charge, highaccuracy precise point positioning (PPP) corrections worldwide both through the Galileo signal in space (E6-B) and via the internet. The precise corrections provided by the Galileo HAS will allow users to improve the accuracy associated with the orbit, clocks and biases provided through the Galileo Open Service broadcast navigation messages and the GPS Standard Positioning Service navigation data. These corrections enable the computation of a high-accuracy positioning solution in real time when processed by an appropriate algorithm in the users’ receivers tracking the Galileo E6-B signal. The typical accuracy below a few decimetres (<25cm horizontal) in nominal conditions of use is a revolution where Europe provides this as an integrated service for free, thus allowing the massive development of applications worldwide.
Advanced digital mapping solution for Czech railway infrastructure

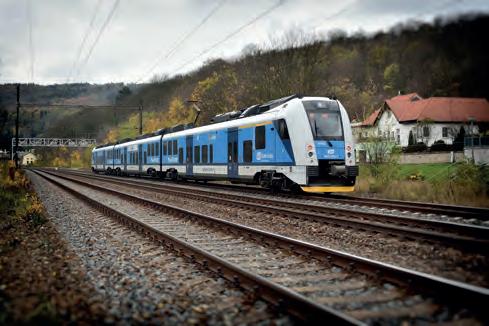

Hexagon’s Safety, Infrastructure & Geospatial division together with Ness Czech will provide the Czech Railway Administration with a Digital Technical Railway Map (DTRM). This railway-specific GIS solution will give the state organization access to information about its transport and technical infrastructure, allowing for more efficient preparation of investments and repair work. The DTRM is based on the Technical Map Information System (ISTEM), developed by both Hexagon and Ness Czech to enhance the management of the railway infrastructure. The Czech Railway Administration, as a railway operator, needs precise information about the railway network and surrounding area. By acquiring accurate and detailed geodetic measurements and digitizing asset and infrastructure information, the Railway Administration can meet its own needs and those of the state, which is developing the Digital Technical Map of the Czech Republic, a national map which should be operational in 2024.

Issue 2 2023 7 Headlines
Curiosity is the largest and most capable rover ever sent to Mars. It landed on Mars on 5 August 2012. (Image courtesy: NASA)
A regional train in the Czech Republic.
Galileo has begun the delivery of its High Accuracy Service (HAS). (Image courtesy: ESA)
Vexcel upgrades UltraMap software with advanced water handling features


Vexcel Imaging has released a new version of its all-in-one photogrammetric software suite UltraMap, with sophisticated and best-inclass water handling features, enhanced Ortho module performance and a redesigned ortho reprocessing workflow. UltraMap v6.0 introduces True Pixel Processing (TPP), a proprietary raw data processing approach in the Essentials module and supports professional data production for the recently launched UltraCam Eagle 4.1. The new highly automated features for water handling are enhancing the quality of nearly every product throughout the workflow. This includes tools like the new Water Mask & Geometry Editor to efficiently quality-control and edit water masks as well as the updated Seamline & Blending Mask Editor for intuitive generation of homogenous water surfaces in orthomosaics. With UltraMap version 6.0, customers obtain highly accurate, more robust and automatically generated DSM and DTM results plus seamless orthomosaics over land and water for any project size. In addition, performance for most efficient large-scale data production has been optimized by introducing more effective file management, leading to faster loading times, viewing speeds, saving and export of products in the Ortho Viewer.
Lidar survey unveils Taranaki region’s 3D landscape
A new, high-tech aerial laser survey project has been completed in the New Zealand region of Taranaki, producing an exact 3D map of the region’s land surface. The survey, conducted by Toitu Te Whenua Land Information New Zealand (LINZ) in partnership with the Taranaki Regional Council, will provide valuable data for a variety of uses. The data is set to be used to generate highdefinition 3D maps and models that will be used for applications including environmental management and planning, natural hazard management, and infrastructure and service planning. Additionally, the data will be used to track changes to the coastline and river channels. Bjorn Johns, LINZ technical leader, Imagery and Elevation, explained that the dataset was two years in the making. “It’s exciting that we now have accurate elevation information, right down to the property scale, for the entire Taranaki region. The new digital elevation data provides certainty to councils and landowners and ensures their terrain modelling is as accurate as possible.”
Digital twin of Kaunas stretches from campus to Old Town
Kaunas, Lithuania’s second-largest city, is leveraging a digital twin model to help with city planning. This 3D model uses data from the city infrastructure, such as traffic and weather, to assess how changes in the city will affect its citizens. It is also being used to generate simulations of what the city could look like under various scenarios. The digital twin model is set to provide a deeper understanding of the city and helping Kaunas prepare for the future. As laid out in Lithuania’s long-term renovation strategy, approved in 2021, all roughly 660,000 structures must be updated to improve energy performance by 2050. This plan is in line with the European Union’s 2018 directive to address the energy performance of aging buildings and infrastructure, including the decarbonization of the national building stock. With this use case in mind, the Centre for Smart Cities and Infrastructure at Kaunas University of Technology (KTU) has created the Kaunas City digital twin, a digitization of the built environment on the university campus. The digital twin also stretches beyond the campus, offering 3D visualization of the Old Town district in Kaunas.
Issue 2 2023 8
High-resolution 3D mapping data is now available for the entire Taranaki region. (Image courtesy: LINZ)
Headlines
UltraMap version 6.0 introduces new and sophisticated water handling features, enhanced Ortho module performance and a redesigned ortho reprocessing workflow. (Image courtesy: Vexcel Imaging)
How deep learning enables large-scale analysis
Use of AI to detect rooftop solar potential
 By Jakob Voigt and Johann Heller, Deeeper.technology, Germany
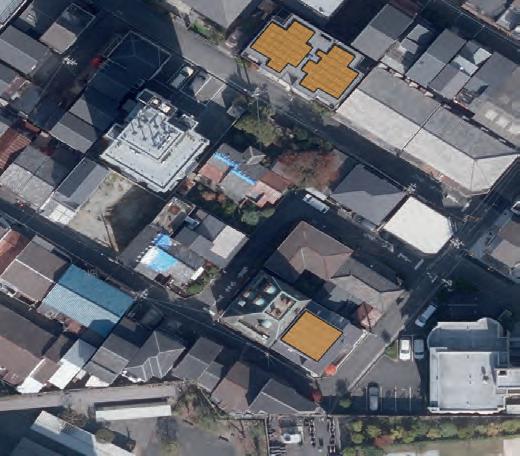
Solar energy is among the most important drivers of the energy transition away from fossil fuels. Nevertheless, many roofs still lack photovoltaic systems, leaving them unable to contribute to this transition. Newly developed artificial intelligence (AI) models allow this untapped potential to be quantified on a large scale by processing remote sensing imagery of vast territories with highlevel precision.
Global climate change and, in some areas, the lack of a cheap and reliable energy supply are contributing to the expansion of photovoltaics, both regionally and worldwide. In addition to ground-mounted and agrisolar systems, rooftop systems are considered
a promising factor in the generation of solar energy. Besides being subject to less complex planning processes and legal frameworks, they are also affordable, reliable and make use of existing rooftop infrastructure.
Installation of a photovoltaic system is usually preceded by an estimate of the solar potential. In terms of rooftop systems, this analysis is mainly performed individually for each building.
Issue 2 2023 9 Feature
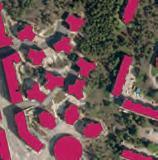
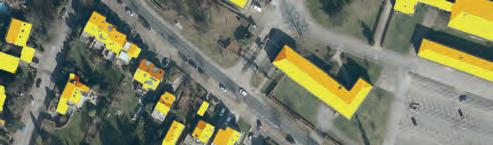
Figure 1: Multiple buildings extracted from orthoimagery as a binary raster. This intermediate result shows vectorized polygons with the detected buildings crosshatched in blue.
This requires the measurement of various parameters such as roof pitch, orientation and any roof superstructures, either manually or as part of a Lidar project. For large target areas, the estimation work quickly becomes infeasible, either due to the huge manual effort involved or the high costs associated with high-resolution Lidar measurements. By applying AI to digital orthoimagery, the German geointelligence
company Deeeper.technology has developed a method to overcome these bottlenecks and determine the net solar potential for vast regions and even entire countries.

Multiple models for a single dataset
By using proprietary AI methods in combination with open-source machine learning libraries, the method applies multiple neural networks in sequence,

each of which makes its own contribution to the process. At the beginning, a building detection network evaluates orthoimagery with a resolution of 20cm and extracts the buildings as a binary raster (Figure 1). However, in order to determine not only the pure building area but also the actual usable area, two further steps must be taken: 1) the roof surface of the building must be broken down into its individual convex surfaces in order to consider each roof surface individually, and 2) areas that cannot be used due to obstructions need to be excluded from the calculation. In order to accomplish this, two further neural networks are applied, one handling the decomposition into linear surfaces and the other extracting roof superstructures as well as other non-usable roof areas from the orthophotos.
After the building detection network, the linear decomposition network and the superstructure detection network have been applied, knowledge is gathered about the total roof area and the non-usable surface. In order to obtain the net useful area of the roofs, in the next step only the difference between these quantities needs to be calculated. Thus, the intermediate result after applying the three abovementioned networks is a layer containing the net useful area for each building in the target area.
Not just a matter of ‘where’
At this point in the process, knowledge about the location of the buildings as well as the net usable area has been generated. However, it is not yet clear how useful these roof areas will be in reality. To calculate the actual solar potential, it is necessary to include additional information about elevation. This is estimated by another deep learning model in a process called monocular depth estimation. By processing digital orthophotos together with a digital surface model as the input data, this model learns to estimate the height and 3D shape of each building. As a next step, the elevation estimating network is applied to the target area. This generates crucial information about the height and slope of individual roof surfaces (Figure 2) as well as about potential shading by other objects such as neighbouring buildings or trees. If this data is then combined with the information about the roof orientation towards the sun, the solar potential can be determined fairly
Issue 2 2023 10
Figure 2: Output of the elevation estimating network showing the digital elevation model obtained, with a scale from very high (red) to very low (blue).
Figure 3: The same buildings analysed for their solar potential, with an efficiency scale from yellow (high potential) to brown (low potential). This shows that most of the really useful areas are oriented to the south. As expected, areas that are more inclined to the north have poorer yields.
accurately based on the angle of inclination and azimuth of the roof surfaces.
In detail, this is achieved by calculating for each roof surface the percentage yield deviation from the optimum orientation (south) and ideal tilt angle (0 degrees). Then, based on the size of the percentage deviation, the degree of shading and the nominal power of a standard solar module, the potential net useful power of each roof surface is determined (Figure 3). Therefore, the final result shows not only the theoretically usable area, but also the effective output for each roof surface.
Benefits and limitations
The great advantage of this method is that it can be applied to an area of any size. Furthermore, the input data is readily available at large scales, which might not be the case for high-resolution Lidar measurements. This allows larger areas such as provinces and even entire countries to be computed in very little time (Figure 4).
Depending on the computing capacity and the technology used, the solution can analyse several square kilometres per minute. This creates a considerable spatial as well as temporal advantage compared to traditional methods such as manual annotations and calculations, and a cost several orders of magnitude cheaper than a Lidar project. On the other hand, of course, this method is not completely error-free. Due to the dependence on no less than four neural networks, it cannot be ruled out that objects will not be recognized correctly. This applies to individual buildings as well as single roof surfaces, superstructures and shading. However, since
About the authors
Jakob Voigt is an IT business engineer and business development manager at the German geointelligence company Deeeper. technology. As a market analyst, he focuses on existing and new applications of AI in the field of remote sensing. He holds a bachelor of arts, bachelor of science and master of science from the University of Rostock.
Dr Johann Heller holds a PhD in Accelerator Physics and is one of the founders and CTO of the German geointelligence company Deeeper.technology. As a deep learning expert, he is responsible for developing the technology behind the AI company. He graduated from the University of Rostock in Accelerator Physics and holds a BSc and MSc in Electrical and Electronics Engineering.

the error rate is comparable to that of a human GIS annotator, the percentage of errors can be regarded as negligible, especially considering the scale and the advantages mentioned above.
This method offers benefits for a wide variety of organizations, ranging from companies in the energy industry to public administrative bodies. At a time when there is often little to no inventory data available on solar potential, the main advantage is that this method generates key metrics that provide a quick situational overview of the buildings in a particular area as the basis for decision-making. Moreover, the intersection with commercial register data also allows energy suppliers to address building owners more specifically. In addition to that, there are opportunities for more targeted grid-expansion planning to further drive the expansion of renewable energies.
Conclusion
Large-scale geospatial analysis is often associated with considerable effort and high costs. AI can help limit both the effort and the cost involved. Especially in applications that are of strong urgency due to their political or societal necessity, intelligent algorithms can be a decisive accelerator. In the case of the expansion of solar energy systems, deep learning algorithms show that the rooftop solar potential in entire countries can be analysed in just a few days. The geointelligence method presented above is not impeccable. However, as a complement to existing processes, it offers a way in which the geospatial industry can make greater use of the acceleration opportunities provided by AI, machine learning and automation to play its part in helping to meet climate-related and energy-related policy goals.
Issue 2 2023 11 Feature
Figure 4: The computed solar potential for each building in the German district of Aachen, a district with an area of around 550km².
European cities face sustainability challenges and more
Can digital twin techniques serve city needs?
By Ville Lehtola and Markku Markkula, Finland
While digital twin techniques have been applied successfully in manufacturing and construction, cities are so complex that they require more measuring and modelling effort. Moreover, since they are evolving all the time, it is not enough to simply measure and model cities only once. This article explores whether digital twin techniques can meet city planning needs and help them face their wide-ranging challenges – from sustainability to education, digitalization, infrastructure and healthcare.
Humans have planned their actions since time immemorial, and with good reason: planning saves time, money and effort. In today’s digital era, paper maps have been replaced by 3D digital models. The need for digital twin (DT) techniques originates from this continuous quest for better and more precise planning of actions and resource allocation. DT techniques have been applied successfully in manufacturing and construction, but this is no guarantee for success in city planning. Cities are so big and complex that it takes significant effort to measure and model them. Therefore, typically, only a part of the city (e.g. a building) is measured and modelled at a time. Moreover, any single act of measuring and modelling a city is not enough, since cities are never complete but keep on evolving. Hence, for cities, the question is: can the DT techniques answer to their needs? So what do cities need? To understand this question, it is first necessary to elaborate
what a city entails. Typically, the city council formulates the needs of a city into a vision and a strategy, in a language that can be understood by the civil society. This article is written from a European perspective. Both authors have been acting councillors in Europe’s most sustainable city: Espoo, a part of the Helsinki metropolitan area in Finland. Additionally, one of the authors has been the president of the European Committee of the Regions, i.e. the assembly of regions and cities involved in official EU decision-making.
City needs
All cities share some needs and objectives. Common needs have been identified, e.g. in the 2030 Agenda for Sustainable Development, which has been adopted by all United Nations Member States since 2015. State governments have committed, which is good. But commitment must also exist at the city level, where the practical measures are developed and implemented, and impact
is made. This is underlined by the European Commission’s call for ‘multi-level governance’: EU Member State/city collaboration.
All cities share the need for funds for yearly budgeting and investment plans. City councils are also kept busy by new emerging needs, such as new challenges in education, investments needed for digitalization and infrastructure, and increasing costs for better healthcare.
City as a service (CaaS)
In Espoo, for instance, the vision established by the city council is to run the city as a service (CaaS). What does this mean? The asa-service concept originated as an information communication technologies (ICT) business model for offering information technology and software. It means acknowledging that a city cannot answer to every need of its citizens based on the work done by city officials. Instead, services are provided by the entire city community, not just the official city organization. Companies and other communities will be part of the innovative urban ecosystem and service provision. Hence, the city wants to be a facilitator and a platform in enabling the civil society to find solutions for the existing challenges.
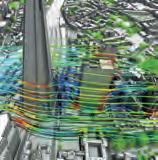
Data for digital twins is captured with different sensor systems. In addition to the surveying and mapping systems shown here, data can also be acquired from static IoT sensors. (Image courtesy:
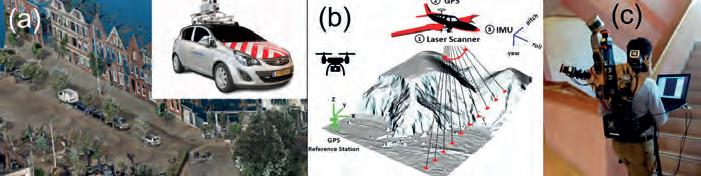
(a) Lehtola, V. V., Koeva, M., Elberink, S. O., Raposo, P., Virtanen, J. P., Vahdatikhaki, F., & Borsci, S. and Cyclomedia, (b) Tomljenovic et al, (c) Karam et al)
The CaaS model builds on transparency, opening processes and data, and a high level of digitalization, including running processes in cloud. Open interfaces yielding data enable the emergence of new businesses that can target specific needs of the civil
Issue 2 2023 12
Dr Ville Lehtola is an assistant professor in mobile mapping at the University of Twente, and formerly a senior scientist at the Finnish Geospatial Research Institute (FGI). His research interests include laser scanning and sensor fusion, scan-toBIM methods toward digital twins, and robot perception, cognition and navigation problems. He holds a doctorate in computational statistical physics from Aalto University. As a city councillor for Espoo (2009-2016), he was involved in supervision of Helsinki West Metro construction and sustainability planning.

Markku Markkula is the president of the Helsinki-Uusimaa Region (chair of the board), a former Member of the Finnish Parliament (1995-2003), former president of the European Committee of the Regions (CoR) and currently vicepresident of CoR. He has an MSc in Production Management from the Helsinki University of Technology and has been a member of the Espoo City Council since 1980 in various influential roles including chair of the Committee for Urban Planning.

society. Moreover, this transparency supports democracy, while digitalization offers efficiency and inclusivity. Because it does not require things to be run through the city office, the CaaS model is scalable, thus facilitating city growth. It means deploying ICT as a vehicle for catalyzing smart city innovation. The city offers a digital platform on which actors of civil society, such as businesses, universities, NGOs and citizens, can develop solutions to improve wellbeing. City DTs should also be available through this platform.
Better city planning
The value of property owned by a city is typically huge, but it is tied up in infrastructure and buildings. DT technologies can play a key role in asset and facility management by reaping more returns on these investments. Currently, the techniques are used for road asset inventorying purposes and some smart traffic applications during rush hours, for example. Next-level questions include an overall better planning of the city. For instance, in the past, city districts were
planned for singular functions: one area for working, one area for sleeping, one area for education activities. An example of this could be found in Espoo, where the campus of Aalto University, the ‘garden city’ of Tapiola and the high-tech industrial zone of Keilaniemi were all disconnected and separated by highways. The city council has worked persistently for decades to find solutions to integrate these city districts and to procure the needed investment funding for projects such as tunnelling the highways. Integration activities have also included extending the metro line from downtown Helsinki to Espoo in the west and building a light rail system. This means providing public transport infrastructure to connect city districts by rail.
Against this backdrop, many DT-related questions arise, such as how to increase the utilization rates and what is the best way to further improve the multi-functional city districts? Should a city library be inside a mall? What about a public health centre? Even though multi-functional city districts offer more possibilities and a better
Issue 2 2023 13 Feature
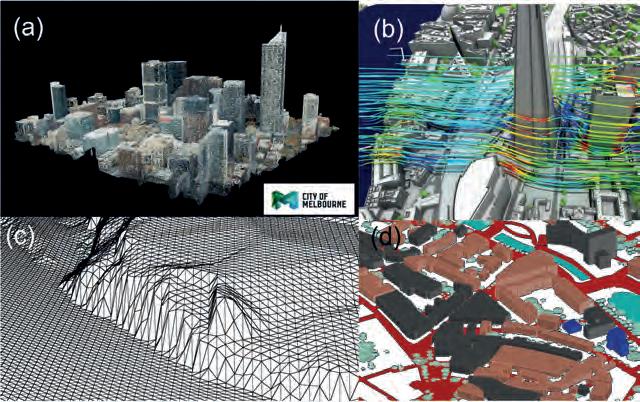
Many faces of city digital twins, mostly used by experts and ICT-oriented people. (Image courtesy: (a) City of Melbourne, CC4.0 (b) AccuCities (c) City of Helsinki Lidar data, CC4.0 (d) Lehtola, V. V., Koeva, M., Elberink, S. O., Raposo, P., Virtanen, J. P., Vahdatikhaki, F., & Borsci, S. (e) Jaalama et al, (f) Bimcolab)
About the authors
quality of life for the citizens, they also make further improvements harder, because the systematic complexity is increased. This is where DTs can come in useful. Therefore, the need for advanced DT techniques will continue to increase, as city councils demand and seek more usability value for the city infrastructure and buildings.
Digitalization
Digitalization has been a beneficial process of change for cities. In Espoo, it has had great impact on processes in the central administration and within the city departments. Also, it has shown remarkable results for breakthrough and potential for supporting the Sustainable Development Goals (SDGs). Because digitalization is beneficial, the EU is also pushing digital transformation forward with its programmes. However, what has not changed is the paradigm of digitalization being seen as an ICT item and being owned by ICT people. The ICT processes often reside in silos. Cities have their ICT departments and ICT tools, wherein the information exists and benefits the work of individual experts. Crucially, what is lacking is the integration of this information into common tools for all planning and development. ICT has not yet been used to its fullest extent: to enable the joint planning between different functions. City DTs can be expected to take this role, in which the ICT acts as a tool for enabling multi-level governance – not only in the traditional state/city sense, but in the sense that also the bureaucratic levels inside cities could become more effective.
The most critical step to take is to make city DTs useful for people who are neither digital natives nor IT-oriented. City
planning, for instance, must be inclusive for all stakeholders. The past, the present and the future must be presented in an understandable form. The vision for a citizen’s home neighbourhood must be comprehensible to them. It should be a continuous story of what was and what will be, with the concrete next steps. This requires a human factor perspective in the design of the interaction with the DT and suitable understanding of the interface through which the digital information in the DT can be viewed. Only then can the DT systems effectively support decision-making in a city.
Manageable ecosystems
This human-centric planning, rather than ICTcentric planning, will be the ultimate success story of city DTs. Human-centric planning allows for ecosystem management, jointly with the stakeholders. And that is what a smart city district is: an ecosystem of a manageable size. In Espoo, there are two pioneering areas for this kind of development – the abovementioned Otaniemi-Tapiola-Keilaniemi area and Kera – both of which are several square kilometres in size.
Kera was initially a single-function city district – a logistical area of warehouses and other industries with a loosely built hightech industrial zone (including for example Nokia’s research centre with its 5G test area). A planned development process is intended to transform the area into a vivid multi-functional city district and a Europewide pioneer of successful implementation of the circular economy and associated digitalization. Specific objectives include optimal resourcing of maintenance, e.g.
waste recycling, and snow ploughing in wintertime, and optimal allocation of facilities for different city and third-party functions. The platform for this ecosystem is CaaS. Any process for change should be describable within this platform. Changes requiring people from different organizations and branches of administration to participate become tangible if the process for change awakens people that they can and want to participate and influence the process. DT techniques should fulfil their part here.
Evolving technologies
City DTs have two origins. On the one hand, building information modelling (BIM) techniques developed for individual buildings can be expanded to describe whole cities. On the other hand, geoinformation systems (GIS) have evolved from 2D maps towards 3D modelling of not only landscapes, but also cities. Taking the best from both worlds – in respect to standards, methods and data – arguably leads to the best way of creating city DTs. Needless to say, while BIM and GIS offer only 3D models, a digital twin does more than that.
Digital twins share a common identity under the DT umbrella. However, the current DTs for different city applications can be technically very different, both method-wise and datawise (images, point clouds, polygonal models, etc.). This is because the individual techniques are aimed at specific technical or planning objectives. Turning individual planning activities into joint planning efforts would ideally require gathering all information together and then sharing it between the parties. To use computer science terminology, a back-end city DT could act as the container of all information,

Issue 2 2023 14
Table 1: Data types obtainable from raw data for 3D modelling of cities. These data types form the foundation of city DTs. Reproduced and adjusted from Lehtola, V. V., Koeva, M., Elberink, S. O., Raposo, P., Virtanen, J. P., Vahdatikhaki, F., & Borsci, S.
AI algorithms can classify different objects from data, shown here in colours. (Image courtesy: Yang et al)
while any single front-end interface, whether visualized for use by humans or designed for use by robots, would offer a limited but meaningful representation of the DT for a specific application. The back-end DT (or any specific DT) could be updated autonomously from sensor data using artificial intelligence techniques, and the front ends could offer large benefits to the entire city ecosystem.

Automated updates
Updating DTs is important because decisions should always be made with the very latest information. If the updating of technical models is done by humans, the financial cost is high. Moreover, there is no catalyst for joint planning, whereas joint planning using DTs immediately becomes attractive if the updating is done automatically by a computer. The key innovations for automated updates come from the field of artificial intelligence (AI). Data captured by Internet of Things (IoT) sensors, field survey sensors or other platforms and applications can be transformed into information that is meaningful for the DT and for the applications it serves. This is a game changer. While AI research has gone through multiple hype cycles over the past 50 years, today it is as if a missing piece of the puzzle has fallen into place. In principle, the AI methods can be applied to labelled objects from point clouds and images, and these labelled objects can then be matched against the respective elements in BIM and GIS models. In practice, however, a lot of research is still needed.
Human factors and joint planning
Cities are complex systems, which need to be planned jointly with various stakeholders. Therefore, it is essential to include a human-factor perspective to identify the potential advantages and the future use of DT systems to support city decision-making. When it comes to joint planning, the benefits of interacting with DTs can be ensured only by safe and usable systems that enable agents to visualize and share information appropriately. The current cave-at of the BIM and GIS tools is that they are utilized and developed as IT tools for IT-oriented people. These tools are
Further reading
Lehtola, V. V., Koeva, M., Elberink, S. O., Raposo, P., Virtanen, J. P., Vahdatikhaki, F., & Borsci, S. (2022). Digital twin of a city: Review of technology serving city needs.
International Journal of Applied Earth Observation and Geoinformation, Volume 114, 102915, https://doi.org/10.1016/j.jag.2022.102915
City of Espoo’s Digital Agenda, https://www.espoo.fi/en/city-espoo/innovativeespoo/digital-agenda
Matos, F., Vairinhos, V., Salavisa, I., Edvinsson, L., & Massaro, M. (2020). Knowledge, People, and Digital Transformation. Springer
Tomljenovic et al, Remote Sens. 7 (4) (2015) pp. 3826-3862, drone: Flaticon.com
Karam et al, ISPRS Journal of Photogrammetry and Remote Sensing 181 (2021): 413-426
Jaalama et al, Landscape and Urban Planning 207 (2021): 103996
Yang et al., Remote Sensing 12.5 (2020)
xD Visuals Oy: xD Twin solution, www.xd-twin.io/
not suitable for broader use, but new tools are needed for joint planning.
Conclusion
It is time for action in the cities of Europe. The relevant body for cities, the EU’s Committee of Regions, wants the quality and amount of data provided by the public sector to be improved to speed up the transformation to the digital economy. It is right to want more digitalization because digitalization is beneficial. But the focus in DTs must change from ICT-centric to humancentric, to keep the objectives up to date.
The needs of a city change over time, as illustrated by the relatively recent introduction of the SDGs or the EU’s digital programmes. The changes can be a subtle shift in the focal point rather than a full turnaround. City needs are complex, reflecting the demography of the specific city and the individual needs of its citizens. Current DT techniques are focused on the physical side of a city and are therefore unable to forecast changes in needs. That is why DT techniques should be developed further to also include human factors. In particular, the psychological aspects of a neighbourhood and of a city are very important in many regards. The effects of these are clearly visible in real-estate pricing, for example, but the data does not explain the reason behind the pricing. Ideally, DT techniques would offer ways to also encapsulate this tacit information and offer predictions for how it would change in the case of different planning scenarios.
Issue 2 2023 15 Feature
Visualizing digital twins for non-experts is equally important. (Image courtesy: 3D BAG by tudelft3d [left] and xD Visuals Oy [right])
Insights from Hexagon Geosystems into AI and machine learning applications in the geospatial industry
Towards the new normal in surveying and engineering
By Wim van Wegen, head of content, GIM International


Russell Bollig and John Welter from Hexagon Geosystems recently sat down with GIM International to discuss the impact of artificial intelligence (AI) on the geospatial industry. The conversation focused on hot topics such as the role of AI in speeding up data analysis and decision-making for 3D laser scanning and aerial mapping, and also shed light on the rapid advancements in scanning and modelling services. Further, Bollig and Welter noted how improvements in computer vision have revolutionized imagery analysis and extraction. The insights emphasize the growing importance of AI and machine learning in geospatial applications, and their potential to revolutionize operational approaches in the construction and infrastructure sectors.
Artificial intelligence seems poised to drive unprecedented developments in many areas of life and business. To what extent has Hexagon Geosystems already incorporated AI/machine learning into its product offering, and which other opportunities do you see to capitalize
Russell Bollig (RB): The geospatial industry is comprised of many disciplines such as 3D laser scanning and uncrewed aerial vehicle (UAV or ‘drone’) mapping, which can collect very large datasets. Analysing, aligning and rendering these datasets are all optimal places where we can utilize AI technology to both speed up processing and decrease costs. The speed and accuracy of the data analysis also allows our customers to make better, faster and more informed decisions every day.
John Welter (JW): If we think about aerial mapping and the large areas and volumes of data collected, AI is an obvious solution. For example, we currently use AI extensively for Lidar point cloud classification, mesh creation and orthophoto mosaic seamline generation. AI is an enabler that makes generation of certain products possible, in addition to accelerating the workflow and improving the overall quality of other products.
You acquired Multivista in 2016. What role has Multivista played in driving innovation in the construction industry since then?
RB: As a provider of cloud-based construction documentation software, as well as construction imagery services using a variety of sensor technologies, Multivista has substantial synergy with many Hexagon entities. This has led to significant collaborative efforts that have driven a lot of innovation. Connecting technologies to build better client workflows and reduce the costs of solutions have been a real driving force. Specifically focusing on building information modelling (BIM) adoption, we partnered with Leica Geosystems, part of Hexagon. Through
Issue 2 2023 16
John Welter
this relationship, Multivista built Multivista BIM Program, a scanning solution enabling us to offer scanning and modelling services to our clients. Just last year alone, we scanned and modelled over 21 million square feet (approximately two million square metres) of construction space. Scanning and modelling are still quite new to many of our clients, so education is critical as well. In the area of AI and machine learning, we have started to incorporate computer vision AI models into many areas of what we do. These models
and consistent information being delivered from the field. The consistency and quality of the data are critical for this technology to be successful, which is why we help our clients by capturing progress photographs and performing the analysis of those images as a service. I have seen these insights transform how project teams plan, execute and pivot, which is really exciting. JW: Anything that makes it easier to consume geospatial information, or to interact with it, helps grow the demand. A great example is virtual tourism driving the need for updated and accurate digital twins for popular tourist destinations. This helps the traditional users, such as municipal governments, better justify the investment in these datasets. Our Blue Economy effort in the Bahamas is a project that wouldn’t be possible without AI to unlock the seagrass information used to support its protection.
In the context of business, does AI play a role in driving the demand for data?


can analyse an image to extract information from it. Geospatial Content Solutions (GCS) is another amazing Hexagon business with 15-plus years of artificial intelligence experience with whom we have partnered to develop and implement these AI solutions. Our first adventure was using AI to identify quality control issues within firestopping: specific designs and materials used to slow and stop fires within a building. When correctly installed, firestopping can save lives but it is an aspect of construction that is always hard to manage. Within the firestopping analysis solution we released in late 2021, we capture above-ceiling images, analyse them within 24 hours and provide our clients with a task list of all the deficiencies found. We have already captured and analysed millions of square kilometres in a little over a year.
JW: We see AI and machine learning usage rapidly becoming the new normal in BIM, architecture, engineering & construction (AEC) and other geospatial applications, so you can expect us to release more AI tools this year.


Which new frontiers are being opened by attention-grabbing inventions such as cameras on helmets and robot dogs? Are there any other ‘hidden gems’ related to AI that have the potential to make a difference to operational approaches in the construction and infrastructure industry?
RB: AI-powered solutions are a fantastic way to help fill the gaps in today’s labour shortages. AI solutions can also help us save time while performing our regular responsibilities, either in the field or in the office. Computer vision, a form of AI that can analyse regular 2D or 360-degree images to provide insights, is very well suited to help drive operational efficiencies within construction. Today, we can analyse images to find if specific materials have been installed and then perform a quality control review on those materials. Very soon we will be able to report back on construction progress. Weekly and monthly construction schedule updates and field coordination and logistics will benefit directly from more accurate
JW: Sure, AI has enabled entirely new business models to fund projects previously not possible. I referenced the Bahamas project where R-evolution, Hexagon’s sustainability business venture, has teamed with the non-profit organization called Beneath the Waves to map one of the world’s biggest natural carbon sinks. As the Bahamian government plans to issue ‘blue carbon credits’ for preservation of its seagrass meadows, R-evolution and Beneath the Waves have deployed Hexagon’s airborne bathymetric Lidar sensor, the Leica Chiroptera 5, to map seagrasses. AI drives the financial model that funds the project


Issue 2 2023 17 Interview
‘AI drives financial models that fund previously impossible projects’
Russell Bollig
by enabling us to detect and delineate the seagrass beds. The traditional users of this bathymetric data are benefiting greatly from better data being available than conventional budgets would allow.
RB: Similar projects can be performed elsewhere, involving different natural CO2 storage ecosystems, but they will require the collection of geospatial and other data of sufficient quality to be analysed with AI.
How can AI contribute to the reduction of the construction industry’s sizable carbon footprint in line with sustainability goals?
RB: There are many ways the industry can incorporate more sustainability practices on-site. Quality control and reducing rework are two solutions being implemented today. For example, AI computer vision can be used to analyse images and detect potential problems early in the building process. This improves quality and reduces rework by remediating issues before they become exceedingly expensive to fix. And as I mentioned earlier, AI can also help to calculate construction progress. More accurate and
timely progress updates can greatly benefit field coordination during a project, which in turn reduces waste and shrinks the build timeline.
JW: Fed by digital twin and traffic information, AI is extremely effective at determining when and how to move large objects and where to stage materials, which is especially beneficial during complex construction projects in dense urban areas. Our MetroHD product, the premium City-Scale Digital Twin, is a great example of a foundation for such AI applications.
Besides construction, what is Hexagon’s view on how AI-based geospatial solutions can benefit society as a whole in terms of the challenges we are facing, such as climate change?

JW: There are countless other applications that can be unlocked and realized with AI. If we think about geospatial data, the primary usage has typically been to drive a GIS – but this also means so much value sits unlocked. AI can harvest all this critical information so we can see trends before they become critical issues – such as forestry areas decreasing in size, drainage
issues contaminating critical water supplies, and vegetation encroaching on powerline infrastructure. All these information streams can move from manual processes to nearreal-time automation, in essence giving us a modern-day ‘canary in the coalmine’ advance warning for many important environmental topics.
RB: Combating a challenge like climate change requires the acquisition and processing of massive amounts of data. But “You can’t manage what you don’t measure”, as we like to say within Hexagon’s Geosystems division, and this is especially true for climate change. AI has already played a key role in speeding up the processing of data and in modelling that data, and will continue to do so. In fact, most of the key weather models already use AI to combine multiple large datasets and formulate their results or predictions.
How do you anticipate that the implementation of AI technologies can make a difference for data processing?
RB: Implementing AI is essentially implementing automation, which gains efficiencies by reducing costs and staff hours.
Issue 2 2023 18
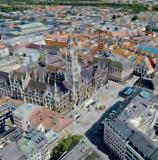
3D mesh of the city of Munich, Germany, derived by combining aerial imagery and Lidar point cloud captured with Leica CityMapper-2.
In construction, the best examples of this are the uses of AI to process 3D laser scanner data to detect deviations and data alignment problems when comparing as-built scans to planning documents. In the geospatial profession, of course, we already see AI analysing tens of thousands of images per day to create aerial maps, extract features and ensure quality standards. These are often examples of AI adding logic to the image processing to answer queries that may be too costly or time-consuming for a human to perform.
JW: The human brain uses multiple senses to better interpret the world around us, so it should be no surprise that AI results get better by having multiple data streams to inference. Our hybrid sensors are a perfect example of combining different data streams –imagery and Lidar – to get better results from AI. Our future aerial sensors will be focused on this. Lidar adds an entirely new dimension to the AI input data.
Which advancements in geospatial data and machine learning are still necessary for AI technology to reach its full potential?
JW: The entire ecosystem needs to continue to mature. We see the open-source frameworks, such as PyTorch, continuing to move forward rapidly, while the cloud providers offering these services in an easy-to-use ‘platform as
a service’ will help to remove the IT hurdles. We also see companies like Nvidia working to introduce better hardware that allows even faster AI development and generation of results. Specific to geospatial data, we need standards that support further expansion of the use of AI. Currently, many standards are optimized for machine-to-human use cases, such as the traditional GIS for streaming data, but machine-to-machine standards have not been defined and rolled out. That will be the next big thing to help grow geospatial AI and optimize the overall ecosystem.
RB: The construction industry can be called
a late adopter as it is using AI mainly for descriptive analytics – identifying what has happened by analysing images or a dataset that has previously been captured or created. However, the use of AI in construction is now starting to answer more intelligent questions that can help to make more informed and proactive decisions. This starts with diagnostic analytics, then moves to predictive analytics, and finally to prescriptive analytics. This opens up the ability to identify why something happened, how to avoid or ensure something happens in the future, and laying out a prescriptive path to achieve those goals. AI in construction needs time to mature and gain further adoption. I know the Hexagon family is – and will continue – working hard to develop and provide these solutions.
The use of AI is in itself a learning process; it can’t be implemented overnight. What advice would you give to businesses who are looking to utilize AI to improve their operations?
JW: The process of growing up is about acquiring parcels of knowledge that all compound, with each lesson being the
foundation for the next. You should approach AI in a similar way. Start now. Start small. Set reasonable goals. And measure the results as you progress.
RB: I couldn’t have said it better!
Biographies
John Welter is president of geospatial content solutions at Hexagon’s Geosystems division. With three decades of extensive and demonstrated experience in the information technology and services industry, Welter is an expert on topics including geospatial services, airborne mapping technology, big data concepts and IT strategy.
Russell Bollig is senior director of solutions at visual documentation technology company Multivista (part of Hexagon). In this role, he leads the company’s AI development and image analysis efforts and manages strategic partnerships and integrations.
Issue 2 2023 19 Interview
‘We need standards to help grow geospatial AI’
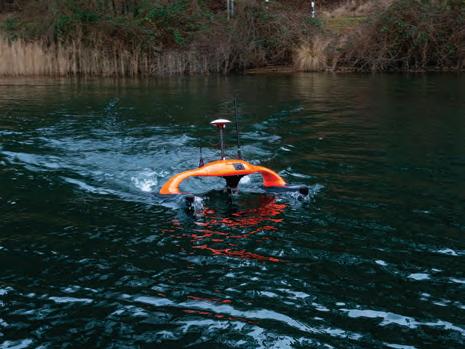
Airborne survey results from the Blue Economy project in the Bahamas. Thanks to deep-learning AI classification algorithms, the seabed was classified by type, species of vegetation and density of vegetation coverage.
SPL100 point cloud for a forestry resource inventory management project in Ontario, Canada, showing a 1m cross-section profile, coloured by flightline.
SMART SUBSEA SOLUTIONS

Delivering data in most adverse conditions: underwater acoustic modems with advanced communication technology and networking


Accurate USBL and LBL positioning of underwater assets
Modem emulator and other cost-saving developer tools
Autonomous surface vehicle for bathymetry, monitoring, search & rescue, and AUV support
EvoLogics.de Meet us at OCEAN BUSINESS! 18- 20 April 2023 Southampton, UK STAND M4
sales@evologics.de sales-us@evologics.com
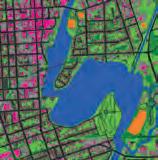
The future of coastal analysis, stormwater mapping and green infrastructure planning
AI-powered climate resilience
By Briana Brown, Ecopia AI, Canada
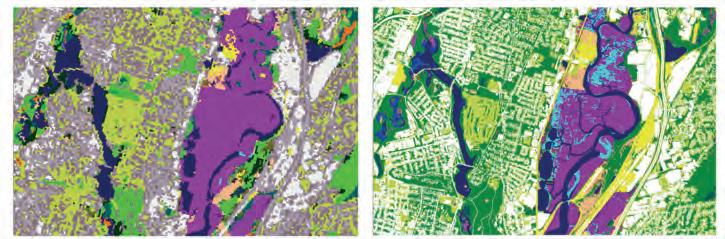
The use of AI in monitoring and modelling climate conditions is bringing about a revolution, especially in the field of geospatial data collection and mapping. With the help of AI-powered digitization, it has become easier to accurately represent real-world changes, enabling communities to better understand critical climate issues like coastal analysis, stormwater mapping and green infrastructure planning. While this level of detail was previously challenging for local communities, it is now possible for governments, commercial organizations and non-profits to develop and maintain a reliable source of truth for geospatial data, which can be used to combat climate change more effectively.
Artificial intelligence (AI) is revolutionizing how communities understand critical climate issues related to coastal analysis, stormwater mapping, green infrastructure planning and more. It’s no secret that geospatial data and mapping are powerful tools for understanding climate change and building resilience strategies. For decades, geographers have mapped areas at risk – not only in order to share information with the public, but also to model and predict future climate events.
Digitizing a changing climate
Geospatial data collection and curation has come a long way over the years, and AI will continue to play an increasingly important role in this evolution. Thanks to AI-powered mapping, the millions of images captured each day by satellites, aeroplanes, uncrewed aerial vehicles (UAVs or ‘drones’) and even street-view cars are now being efficiently and accurately digitized into actionable map features. This AI-based data is changing the way climate scientists map, track and analyse critical elements of the environment, such as rising sea levels, coastal erosion, stormwater infrastructure, green space and urban heat islands.
Before the recent advancements in AI, achieving this level of detail and accuracy was timeconsuming, expensive and difficult for local communities trying to maintain their own land cover database. Traditionally, these maps and classifications were created by geospatial
Issue 2 2023 21 Feature
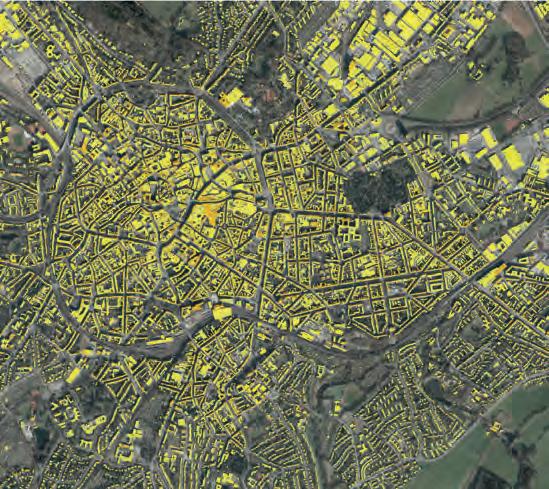
Full 2D and 3D land cover data of Atlanta extracted from geospatial imagery using AI-based mapping systems.
teams manually digitizing each feature in their imagery and adding relevant attribution, then doing it all over again once updated imagery became available. While this was feasible to produce generalized maps of climate conditions across large areas, it was insufficient for communities looking to boost their climate resilience by analysing their area in granular detail.
Nowadays, however, features that previously took years to manually digitize can now be extracted from imagery in just weeks using AI-based mapping systems. By helping organizations to digitize geospatial imagery efficiently, at scale and cost-effectively, such solutions enable governments and organizations to develop and maintain a source of truth for geospatial data that can be used to predict and mitigate climate change.
AI-powered coastal analysis
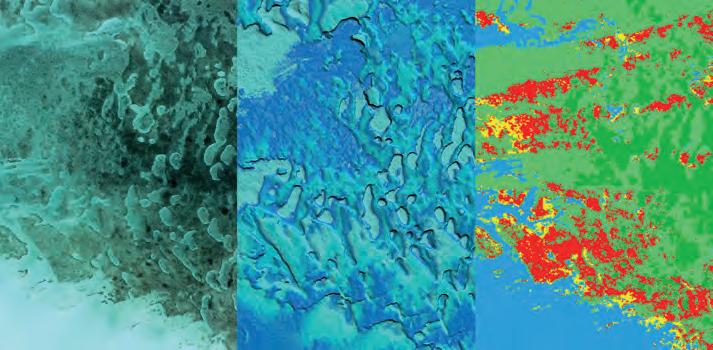
Coastal communities with a heavy reliance on the marine economy are especially vulnerable to the effects of climate change. In addition to sea level rise and its associated risks to property and infrastructure, wildlife
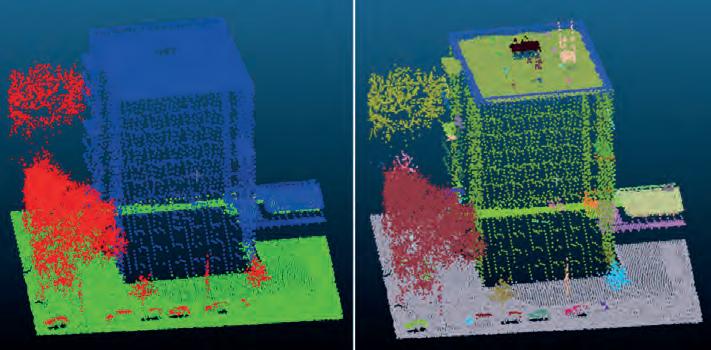
habitats and marine ecosystems are increasingly affected by climate change and urban sprawl. To help US coastal communities build resilience, the National Oceanic and Atmospheric Administration (NOAA) is using AI-powered geospatial data. With accurate, comprehensive and up-to-date land cover and land use data, coastal communities across the USA are able to identify populations, property and infrastructure that are vulnerable to climate events. They can also monitor and predict wildlife habitat loss due to climate change, and analyse its effects on the marine economy, which was responsible for about US$361 billion of the USA’s gross domestic product (GDP) in 2020.
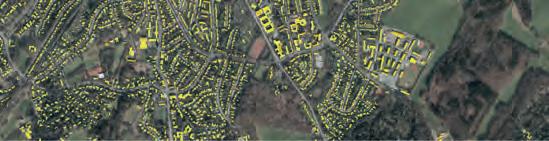
Before leveraging AI-based mapping to extract features for its land cover dataset, NOAA relied on 30m-resolution satellite imagery, providing public updates every five years. While this data proved incredibly useful in sharing climate change information with millions of people worldwide, it left coastal communities who faced frequent climate events looking for a more detailed and up-to-date solution. To enable coastal
areas with more detailed land cover and land use data, NOAA is now providing 1m-resolution data derived from aerial imagery using Ecopia’s AI-based systems. The increased resolution of the imagery means that communities now have the granularity of data they need for local mapping and modelling, and the AI-powered feature extraction leads to faster updates to accurately reflect changes in the real world.
This up-to-date, reliable land cover data is empowering coastal communities throughout the USA to understand flood risk, stormwater infrastructure, urban heat islands, tree equity and more critical elements of climate resilience. But without the efficiency provided by AI, this transition would not have been feasible, as manual digitization that maintains GIS-professional accuracy is typically expensive and timeconsuming.
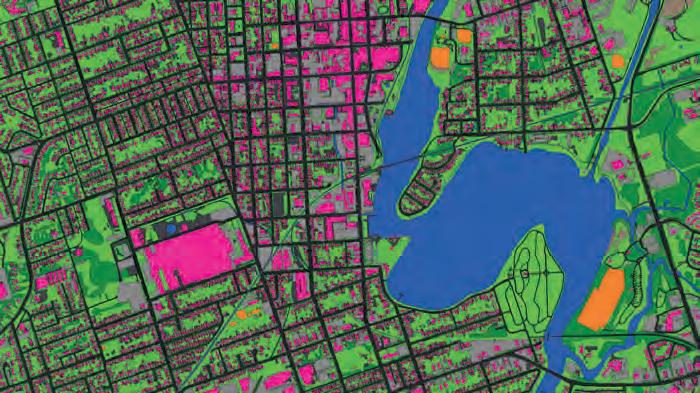
Enhanced stormwater mapping and flood modelling
Coastal communities are not the only areas leveraging these advancements in data and mapping to develop climate resilience. As climate change leads to increased stormwater events and overwhelmed infrastructure, even inland communities are turning to geospatial technology and AI in their mitigation and resilience efforts. AI is revolutionizing how municipalities map and classify impervious surfaces to model stormwater’s effect on an area. With accurate map features that detail the type of material of each surface, as well as those around it, engineers can better determine appropriate runoff coefficients for flood modelling. AI’s ability to regularly extract features with such granular detail means communities can maintain an up-to-date database of infrastructure to better predict and mitigate damage from stormwater events.
The Canadian community of Peterborough, Ontario is leveraging this AI-driven approach in its stormwater planning to enhance their flood models amidst a rapidly changing climate. Until AI-based feature digitization was introduced, Peterborough relied on a mix of 1D and 2D datasets of varying vintages and quality, making it difficult to accurately predict and prepare the community for stormwater events. Now, based on the extraction of both impervious surface and natural feature data supported
Issue 2 2023 22
NOAA’s original 30m land cover data (left) compared to its new, AI-powered 1m-resolution dataset (right).
Peterborough’s comprehensive land cover dataset was digitized using AI for use in stormwater management.
by AI, Peterborough’s hydrologists have developed a 2D surface mesh representing land cover, providing critical information related to water depth, velocity and surface roughness throughout the area. Peterborough now has a reliable database of land cover and highly detailed flood models to enhance its climate resilience.
In the USA, AI-based mapping technology is helping municipal governments design and fund stormwater infrastructure improvements that will similarly boost climate resilience. The City of Los Angeles, for example, is leveraging Ecopia’s data to repurpose traffic medians for water conveyance and infiltration by incorporating vegetating and stormwater infrastructure. Meanwhile, in Detroit, impervious surface data digitized by AI is being used to calculate equitable stormwater utility fees for each property, in turn funding the municipal government’s infrastructure and climate-resilience improvement projects.
Achieving net zero with AI-driven green infrastructure planning

While coastal analysis and stormwater mapping is critical for developing climate resilience strategies, it is equally important to leverage AI to optimize green infrastructure as a climate change mitigation tactic. As many nations, communities and organizations work to achieve net zero by 2050, having up-to-date, detailed and accurate maps of both the manmade and natural environments is changing the way society understands carbon neutrality.
Producing land cover data that represents the real world is one way AI is transforming green infrastructure planning. Through the creation and maintenance of comprehensive land use maps, governments and other organizations are understanding how land cover is distributed across an area and what that means for its climate resilience. Mapping impervious surfaces is a component of this, but to really analyse a community’s resilience to a changing climate, all land use must be accounted for.
To help calculate progress toward net zero, many communities are leveraging AI-based mapping data to compare the amount of green space to paved surfaces, provide insight into the urban heat island
Briana Brown is a geographer and writer specializing in geospatial storytelling. As director of content & product marketing at Ecopia AI – a spin-off from PhD research at the University of Waterloo in Canada –she works closely with organizations to share compelling applications of geospatial data to inspire innovation. Prior to joining Ecopia, Brown worked in various GIS-related roles at SafeGraph, Precisely and Esri. She has also volunteered her GIS and data expertise with the United Nations and Catholic Relief Services. She holds a master’s degree in GIS from Penn State University and a bachelor’s degree in Geography from Villanova University, USA.
effect, and map all green roofs or solar panels in an area. The level of detail AI is able to extract from geospatial imagery is critical, as many of these features are small and easily missed by other mapping solutions.
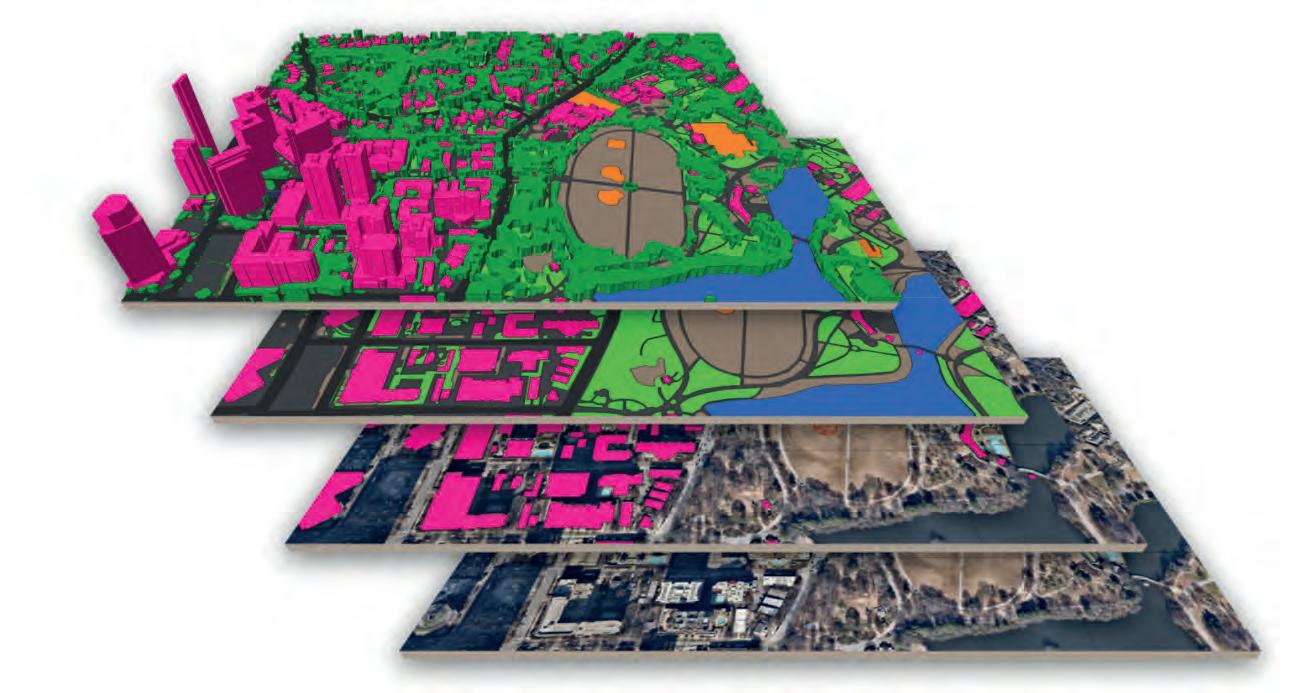
To support the Canadian government’s commitment to reach net zero by 2050, Sustainable Development Technology Canada (SDTC) funded a recent project to map Canada’s hundred largest cities (by population) in 3D using AI-based technology, providing communities with insight into land use that can be used to inform climate resilience strategies. The data is curated so that each layer is a different classification, enabling analysis of not only a bridge, but also the green space or the river that runs under it, for instance. The data is currently in production; once completed, each city will receive complimentary access to assist in their net zero targets.
SDTC has also funded similar digitization projects in other areas of the world to promote carbon neutrality. For example, humanitarian organizations in sub-Saharan Africa are currently leveraging Ecopia’s AI-powered maps to optimize routes between field sites, reducing wasteful carbon emissions that contribute to climate change.
Conclusion
Building climate resilience is complex and evolving, but AI is giving communities the tools they need to predict, mitigate and combat disastrous climate events. AI-based maps are providing an unprecedented level of detail and freshness for climate scientists, government officials and business strategists alike to use as they model and analyse rapidly changing climate conditions and plan the creation of green infrastructure.
Issue 2 2023 23 Feature
Further reading www.ecopia.ai https://coast.noaa.gov/digitalcoast
About the author
based mapping systems.


Can AI solve the puzzle of georeferencing title deeds?
Lantmäteriet digitizes Monrovia’s hand-drawn maps for the future
By Christopher Byren and Maria Brander, Liberia
The discovery of an old atlas with hand-sketched maps of Liberia’s capital, Monrovia, could become the basis for a unique digital cadastre. Since Liberia is a country that largely lacks spatial information, whether as hard-copy maps, cadastral data or otherwise, the finding of the atlas is remarkable. With support from Lantmäteriet, it has now been scanned and therefore preserved for the future.
Lantmäteriet, the Swedish Mapping, Cadastral and Land Registration Authority, is implementing a Swedish-funded bilateral project with the Liberia Land Authority (LLA) called ‘Capacity Building for Inclusive Land Administration and Management Project in Liberia’ (ILAMP). In late 2022, an atlas was discovered that had been produced by the World Food Programme and UNFPA between 1994 and 1997, during a lull in the Liberian civil war. The atlas, which was found in a Liberia Land Authority office, is a hand-sketched block mapping survey of the Liberian capital city of Monrovia and its environs. The block mapping of the atlas is in 3D, given that apartments have also been captured along with all individual properties.
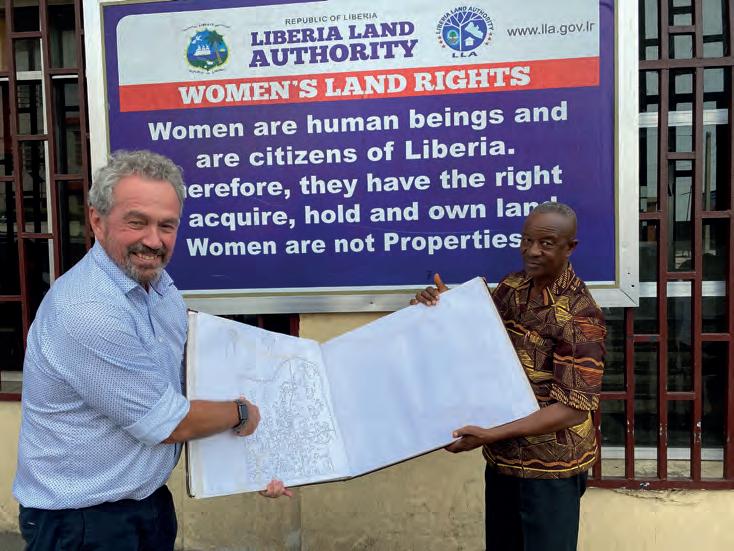
In conjunction with the atlas, two directories were discovered of principal occupants, commercial and private and public institutions that either owned or inhabited the properties at the time of mapping. The block mapping code implemented in the atlas links to the directories, associating the individual properties and apartments to the respective occupants (not necessarily owners) or institutions.
Spatial information lost due to civil war
This is a significant discovery, given that Liberia is a country that lacks spatial information, whether as hard-copy maps, cadastral data or otherwise. Much of the information has been lost due to the civil war. Therefore, after discussions with the management at LLA, the decision was made
to scan the atlas and accompanying directories with the objective to subsequently digitize the atlas. Utilizing OCR, the digitized properties can then be linked to the records from the two directories as attribute data associated to the individual properties. This will hopefully result in the creation of a digital cadastral map of Monrovia as it was in 1997.
Scanning performed in Sweden
Scanning the atlas and directories in Liberia presented a challenge due to the unusual format of the material. The scanning was therefore done by experts at Riksarkivet (the National Archives) in Sweden. Riksarkivet possesses both the expertise and the technology to be able to scan books without having to remove the pages from the volumes. This has been particularly important since only a handful of hard-copy versions are in existence, as
Issue 2 2023 25 Feature
Christopher Byren, ILAMP project manager, and Atty. J. Adams Manobah, chairman of the Liberia Land Authority, pictured with the atlas containing hand-drawn sketches of Monrovia.
far as LLA is aware. The atlas was printed in Lebanon in 1997 and the company that arranged that task is still up and running in Monrovia today. Through this company, Christopher Byren (ILAMP project manager) and his colleague Maria Brander managed to
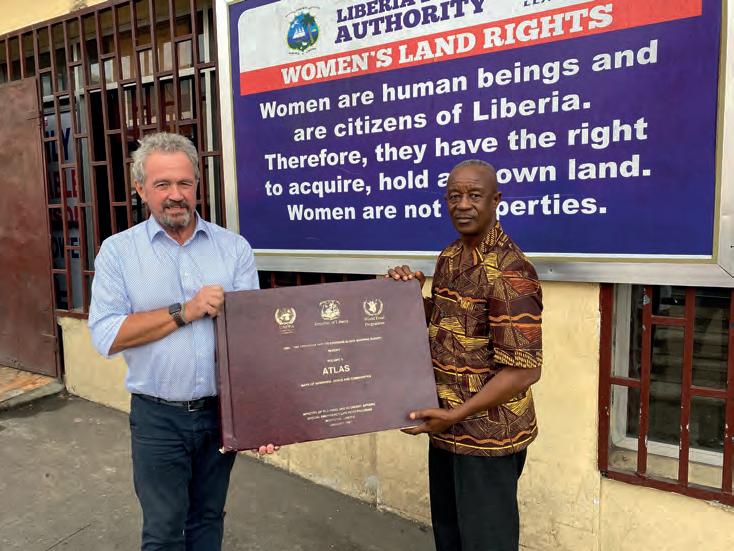
get their own copy of the atlas and transport it – and the directories – to Sweden for scanning.
The historical significance of this work cannot be underestimated. The atlas and directories
are now digitally preserved for the future and, more importantly, these hand-sketched maps could provide the basis for a digital cadastral map of Greater Monrovia that does not exist today.
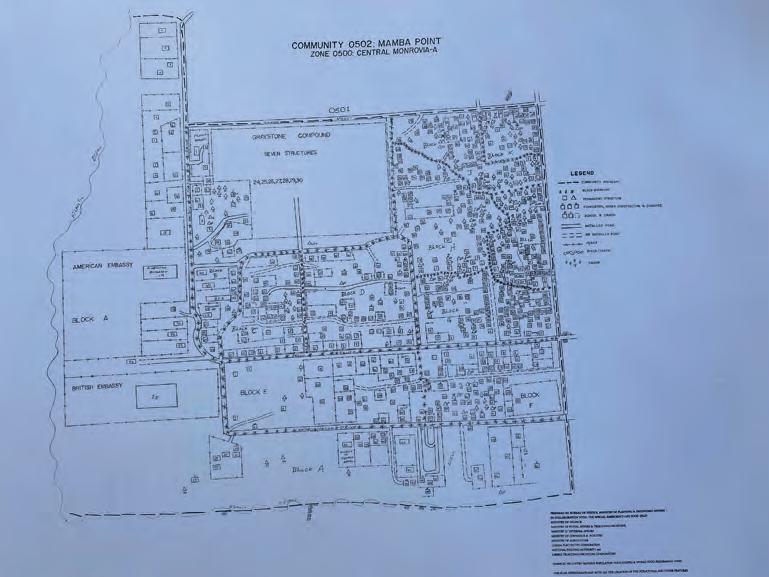
Linking database records to title deeds
Additionally, there are plans to leverage technology to further refine the digitized map data. The scanning will create the basis for further work related to resurrecting the now-obsolete Open Title digital title deed solution.
Open Title, an International Land Systems, Inc. (ILS) solution, was previously deployed at the Liberian Centre for National Documentation, Records and Archives (CNDRA) in Monrovia. The Open Title system provided an indexed, searchable repository for digitized title deeds, but regrettably fell into obsolescence. Lantmäteriet was fortunately able to source the original Open Title database. Work is now ongoing to re-establish the links between the database records and scanned title deed images.
To date, corresponding image files for approximately 35% of the records in the database have been located. Further data extraction from the three original rackmounted drives from CNDRA is planned, in addition to capturing approximately 39,000 scanned documents not yet registered in the database. Prominent features and ground control points in the digitized map data will also be surveyed to test the possible scale accuracy of the hand-drawn maps. Utilizing aerial imagery of Monrovia, it might be feasible to adjust and fit the map data to reality.
Next step is to use AI
The resurrection of what was Open Title, now installed at LLA, is being completed utilizing an alternative open-source database solution. Once the solution is as complete as possible in terms of matching historic database records with corresponding title deed image files, there will be the opportunity to cross-reference the database against the attribute data information from the digitized block mapping. This will hopefully make it possible to link some title deeds to properties, where the occupant at the time of the mapping was or might have been the property owner.
Additionally, given that historic title deed
Issue 2 2023 26
Christopher Byren, ILAMP project manager, and Atty. J. Adams Manobah, chairman of the Liberia Land Authority, are happy that the atlas is now digitally preserved for the future.
Given the scarcity of spatial data in Liberia, Lantmäteriet saw the opportunity to create the foundation for a digital cadastre by digitizing the hand-drawn sketches.
survey diagrams are captured as a bearing/distance between boundary points rather than being georeferenced, Lantmäteriet is investigating whether artificial intelligence (AI) might be leveraged to interpret survey diagrams, i.e. street names adjacent to properties, and to localize and georeference title deeds. The reconstituted digital title deed solution now also provides the ability to capture the geometry of new registered properties that are currently being surveyed with coordinates.
Capacity building
The work and effort by Lantmäteriet and LLA as described above forms only a part of the five-year ‘Capacity Building for Inclusive Land Administration and Management in Liberia’ (ILAMP) project. As the name implies, the focus is on building the capacity of the authority via knowledge and skills transfer. One example of the support provided to enhance local skills in the geospatial field is the financing of 20 surveying students currently completing their second or final year at the African Methodist Episcopal University in Monrovia. Training has also been provided on the latest survey methodologies, database administration and the workflow implemented to capture land parcels. Whilst this might be conceived as being rudimentary, substantial progress has already been made in building capacity at LLA, where equipment, systems and spatial data have previously been lacking.
Conclusion
ILAMP and Lantmäteriet were fortunate in discovering an old atlas with hand-drawn maps of Monrovia. Given the scarcity of spatial data in Liberia, Lantmäteriet saw the opportunity to create the foundation for a digital cadastre.
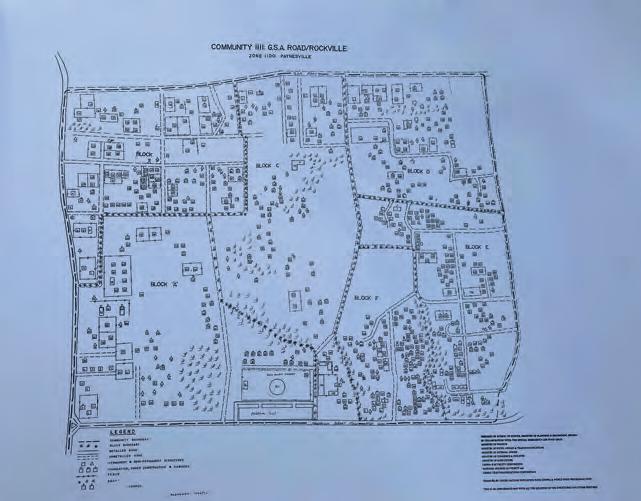
The first steps in the process have been completed with the scanning and digitization of the atlas and related directories. This work is not only invaluable in preserving a historic analogue cadastral map,
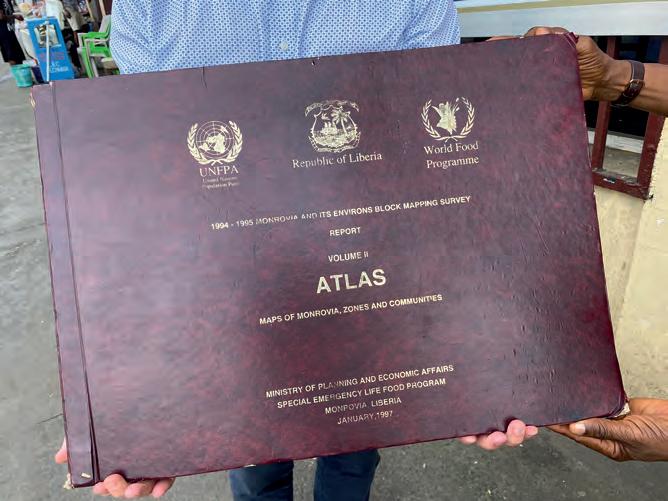
About the authors
Christopher Byren, ILAMP project manager, has been resident in Liberia since 2020. He is a technical land surveyor with over 30 years’ experience in the geospatial industry. He has previously held management positions at Esri South Africa, Leica Geosystems and Swedesurvey and has been registered as a Professional Geo-Information Science Practitioner (PrGIScP) with the South African Geomatics Council (SAGC).

Maria Brander is one of the resident long-term experts within ILAMP in Liberia. She is a communication expert who also works with change management and leadership. She has a background in journalism, has been an editor-in-chief in Sweden and was the press secretary at Lantmäteriet before moving to Monrovia.
but could also enable the georeferencing of digital title deeds from the resurrected alternative solution to what was Open Title. Much effort is still required in re-establishing and structuring cadastral information for Liberia, with the aim of creating a fit-for-purpose land administration system. It is hoped that leveraging AI will assist in finding the solution to this challenge.

Issue 2 2023 27 Feature
The Liberia Land Authority believes that only a handful of hard-copy versions of the atlas are in existence.
The hand-sketched maps of Monrovia have now been scanned in Sweden.
How the National Land Survey of Finland is exploring AI technology
By Lingli Zhu, Jere Raninen and Emilia Hattula, Finland
The National Land Survey of Finland (NLS) is a good example of how artificial intelligence (AI) is entering national mapping agencies. Approximately two years ago, NLS set up the Advanced Technology for National Topographic Map Updating (ATMU) project supported by funding from the Finnish Ministry of Finance. This project was focused on developing deep learning solutions for object detection and change recognition, for buildings, roads and hydrographic features (watercourses). By the end of the project, building detection achieved an accuracy of 97.9%, and 96% of building and road changes were correctly identified. The evaluations have been conducted by the NLS experts at the object level.
In November 2020, Finland launched the Artificial Intelligence 4.0 Programme, based on EU objectives and Finland’s strategy to promote the development and introduction of AI and other digital technologies in governments and companies. NLS was identified as one national government agency that could benefit from technological innovation and efficiency improvements. In the map production unit alone, up to a hundred employees work on the stereo models of aerial images for manually updating the topographic map each year. Besides that, many staff members are approaching retirement age. There is therefore an urgent need for new, high-
efficiency technology (e.g. AI) to fill the gap. Furthermore, NLS started a new aerial imagery programme (covering one-third of the country annually) and new national Lidar programme (covering one-sixth of the country) in 2020. This resulted in a huge amount of datasets needing to be processed for national topographic map updating.
Deep learning technology has been proven to be highly accurate and effective in object detection, and is regarded as one of the best solutions for reducing the labourintensive tasks in topographic map updating. Therefore, the ATMU project was launched as the first AI project in the NLS map
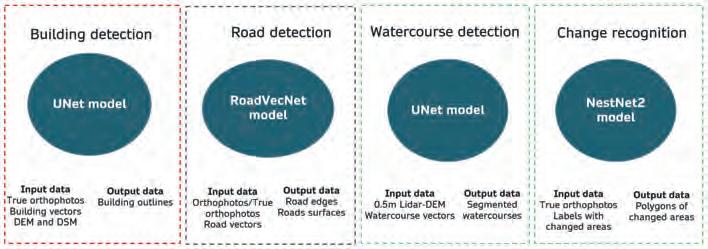
production department. Its goals were to develop deep learning solutions for object detection and change recognition, to reduce the amount of manual and routine work in GIS production, to improve the accuracy and up-to-datedness of geospatial data, to support the innovation of map production, and to provide high-quality training datasets for society.
Deep learning challenges and solutions
The deep learning technologies in the ATMU project consisted of three main components (Figure 1): input data (training data), neural networks, and output data. In addition, the computational environment is also an important support for deep learning technology.
i) Training data
Deep learning technology is a data-driven technology. Besides the selection of the proper neural network, the quality, quantity and diversity of training data must be considered in order to make very accurate predictions. The training data presented the main challenge at the beginning of the ATMU project.
Issue 2 2023 28
The ATMU project explained
Figure 1: An overview of deep learning technologies in the ATMU project.
For example, although orthophotos and building footprints were available in the NLS topographic database, they were not suitable to be used as training data for building detection. The building footprints in the NLS topographic database were collected from the base of a building, whereas the deep learning model detected the roof of a building from images (true orthophotos). This made it impossible to match the building footprints to the true orthophotos. The orthophotos generated from aerial images and digital elevation models (DEMs) in the NLS database created the effect of building tilting. When orthophotos from different years were compared, building roof projections on the orthophotos often varied due to the different camera angles on different aerial vehicles. Unlike orthophotos, true orthophotos eliminate the effect of building tilting since they capture a vertical view towards the surface of the Earth. As a result, pixels on a true orthophoto have a uniform scale, making them measurable. Therefore, the ATMU project decided to use true orthophotos (30cm spatial resolution) instead of orthophotos. The true orthophotos along with building vectors, DEMs and digital surface models (DSMs) were utilized as the training data for building detection. True orthophotos and DSMs were generated by SURE for ArcGIS (Esri product, formerly nFrames). Highly detailed building vectors needed to be collected manually from true orthophotos.
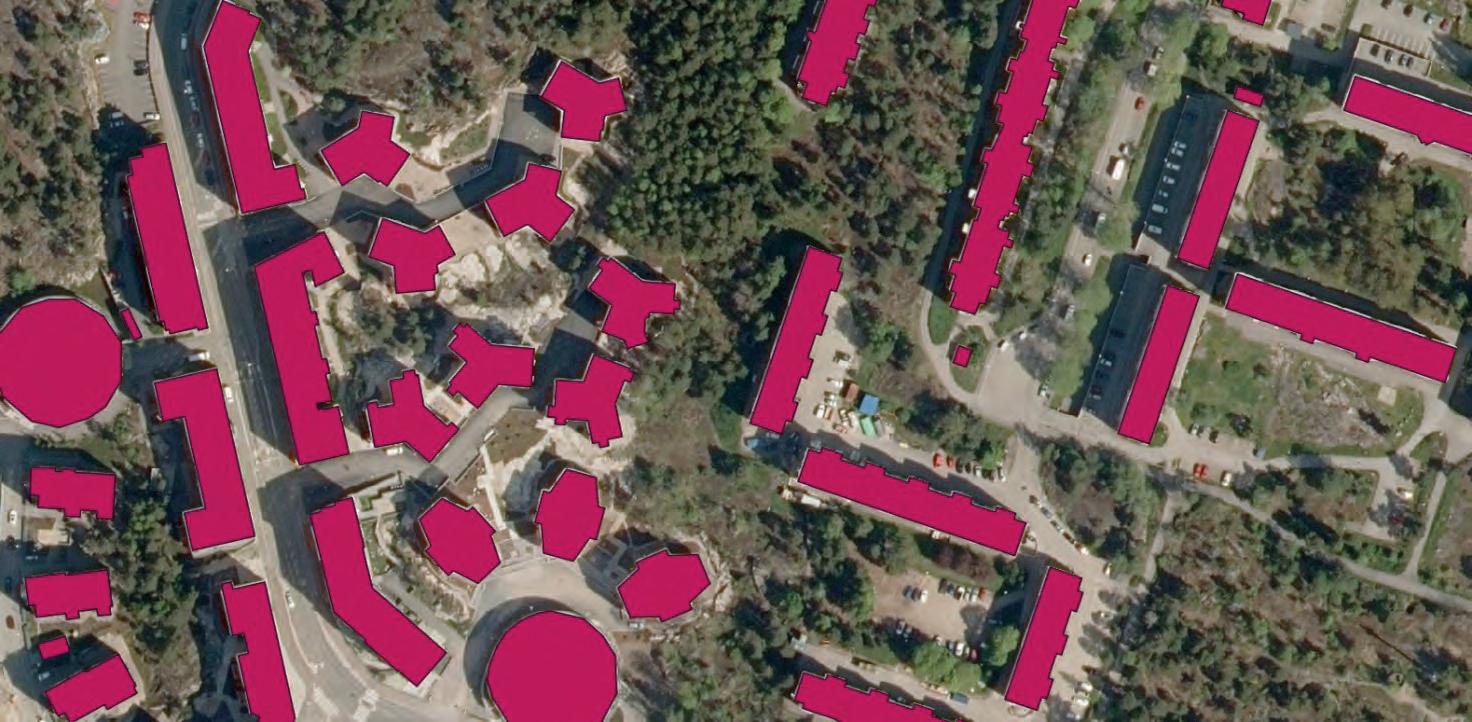
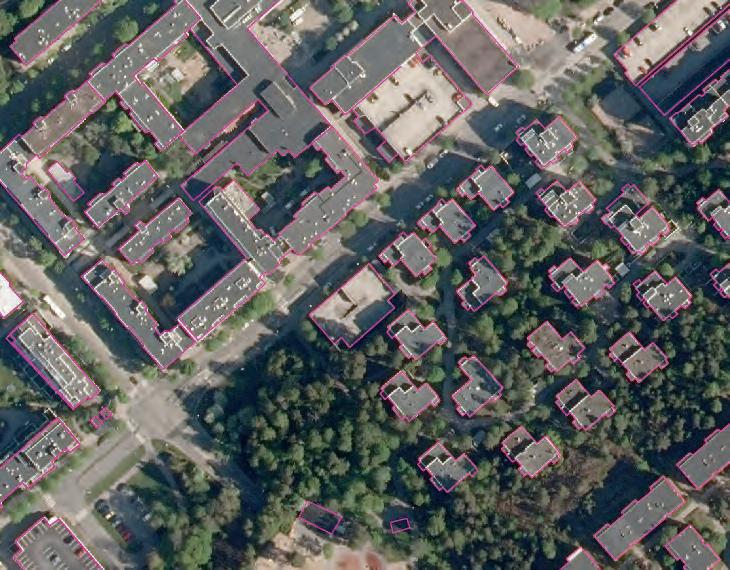
An initial UNet model was trained from scratch with all this training data (Figure 2). When the model could produce a good prediction, the predictions with manual correction were exploited as training
data collection was greatly reduced. This strategy ensured the quality, quantity and diversity of training data for high-quality predictions.
The existing resources in the topographic database were not accurate enough to be used as training data for watercourse detection. For watercourses, centrelines of all watercourses (<5m wide) from an area of 36km2 were therefore collected manually. 0.5m Lidar-DEM and watercourse labels with 1.5m buffer were rasterized and trained in the UNet model.
For road detection, orthophotos or true orthophotos (30cm spatial resolution) and road central lines with the width information were utilized as training data. For change recognition of buildings and roads, the training data included true orthophotos from different years, e.g. from 2015 and 2020 respectively, and the manually marked change areas.
ii) Neural networks
During the ATMU project, different neural networks – such as UNet, MaskR-CNN, DenseUNet, RoadVecNet, DSAMNet, MDESNet, Changer, NestNet and NestNet2 – were tested for object detection and change recognition. Different deep learning technologies were also studied, including transfer learning, multi-task learning and transformer/ attention mechanism. The neural networks performed as follows during the ATMU project:
• Building detection: UNet seemed to perform better with the NLS
Issue 2 2023 29 Feature
Figure 2: High-quality training data for building detection.
transfer learning techniques the result was approx. 5% more accurate when compared to the model trained from scratch. UNet in combination with the transformer did not seem to improve the result. The advantages of the use of a transformer might be clearer if a huge amount of training data were utilized.
• Road detection: UNet, DenseUNet and RoadVecNet were tested with orthophotos from differently coloured spaces. RoadVecNet in combination with RGB images performed the best and was applied to the project. Road detection employed multi-task learning techniques, which means that the neural network can have multiple inputs and multiple outputs. The multiple input data included images
Further reading
2020 true orthop
at CSC, Finland’s IT Center for Science. Supported by CSC’s capacity of CPUs and GPUs, Puhti has supercomputers for small and medium jobs. It has a total of 682 CPU nodes. Each node is equipped with two Intel Xeon processors with 20 cores each, i.e. 40 cores in total. The Puhti AI partition has 80 GPU nodes with 4 GPUs per node, totalling 320 NVIDIA Tesla V100 GPUs. CSC’s supercomputers have three main disk areas: home, projappl and scratch. The ‘home’ directory has a storage capacity of 10GiB, while ‘projappl’ has 50GiB and scratch has 1TiB.
Outcomes
from differently coloured spaces together with labels, while the outputs consisted of two parts: road surface segmentation and road edges.
• Watercourse detection: The UNet model was trained with 0.5m Lidar-DEM, and vectors and parameters of the network were optimized.
• Building and road change recognition: NestNet2 performed the best in predicting the changes in buildings and roads from true orthophotos captured in different years (Figure 4).
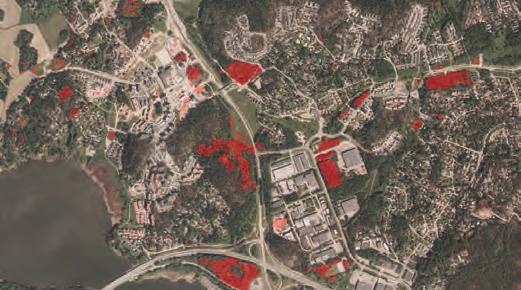
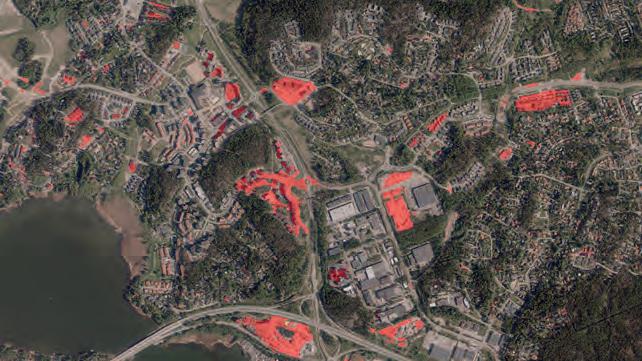
iii) Computational environment
The training process requires huge computational power. In the ATMU project, deep learning models were trained in Puhti
1. Finland, 2020. AI strategy: the Artificial Intelligence 4.0 Programme. https://tem.fi/en/-/ artificial-intelligence-4.0-programme-to-speed-up-digitalisation-of-business Accessed on 9 February 2023
2. Finland, 2021. Artificial Intelligence 4.0 First interim report: from launch to implementation stage. Publications of the Ministry of Economic Affairs and Employment Companies. 12.2021 https://julkaisut.valtioneuvosto.fi/bitstream/ handle/10024/163663/TEM_2021_53.pdf Accessed on 9 February 2023
3. CSC, 2023. www.csc.fi/ Accessed on 10 February 2023
4. Puhti-CSC, 2023. https://docs.csc.fi/computing/systems-puhti/ Accessed on 10 February 2023
By the end of the two years, the ATMU project had produced more than 100,000km2 of true orthophotos, and the UNet model for building detection had been trained with datasets covering an area of more than 60,000km2. According to the NLS expert evaluation, it has reached an accuracy level of up to 97.9% when compared to different reference data. It is now available for the practical use of map production. The option of integrating the ATMU building model with the new topographic database system is currently under discussion.
The AI model (RoadVecNet) for road detection likewise achieved a great result and further application is under consideration. Meanwhile, the preliminary results for watercourse detection using UNet provide a good basis for further research. In addition, expert evaluation of building and road change recognition had been implemented. The results showed that approximately 96% of changes from roads and buildings have been found from true orthophotos using the NestNet2 model. The change detection results can be used as pointers for the operators so that they do not need to check the changed areas across the entire image. This will significantly reduce the amount of manual work. Further application of the change detection method might need to be discussed in the coming year.
The ATMU project has been selected for inclusion in the EuroGeographics annual report representing Finland. In addition, the project has made high-quality training data for building detection publicly available, so it can be used to further boost AI development in the geospatial field.
Issue 2 2023 30
Figure 4: Building and road changes recognized by the NestNet2 model (top: 2015 true orthophoto; bottom:
hoto).
About the authors
Dr Lingli Zhu received her doctoral and master’s degrees in the field of Remote Sensing and Photogrammetry from Aalto University in 2015 and 2007, respectively. Currently, she is leading an AI group at the National Land Survey of Finland. She has published around 50 publications, including more than 20 Science Citation Index (SCI) journal papers, as the first author and contributed to three books, one chapter of which has been downloaded more than 3,800 times. She is specialized in 3D modelling and feature extraction in the fields of photogrammetry, computer vision, laser scanning, machine learning, remote sensing and GIS.


Jere Raninen has an MSc in Computer Science from the University of Eastern Finland. Currently, he is working as an IT expert at the National Land Survey of Finland (NLS). From 2021 onwards, he worked on the ATMU project at NLS focusing on using artificial intelligence methods, such as deep learning and multi-task learning, for automatic road segmentation from aerial images.

Emilia Hattula received her MSc degree from Aalto University, Finland, in 2022. Her current research interests are in the application of machine learning techniques in the field of remote sensing. Currently, she is working as an IT specialist for the National Land Survey of Finland.

Feature Issue 2 2023 31
Geomatics education broadens its scope
New mix of knowledge creates new competitive edge
By Frédérique Coumans, contributing editor, GIM International
Are the numbers of students in geomatics and land administration-related studies diminishing worldwide? Perhaps. Do the majority of graduates want a job in the IT sector rather than as surveying engineers? Maybe. Despite ‘measuring’ being key in our sector, it seems we have fewer facts available about professional education than you might expect. To find out more, GIM International spoke to several industry experts from academia: Dr Dimo Todorovski (the new chair of the FIG Commission on Professional Education), Prof Konrad Schindler from Zurich, Prof Bisheng Yang from Wuhan and Prof Francis Aduol from Nairobi.
What is the current situation on geomatics education at various universities around the world, and how are things changing? To answer that question, the new chair of the International Federation of Surveyors (FIG) Commission on Professional Education is a good place to start. Dr Dimo Todorovski has recently become its chair, until the end of 2026. “To meet the needs of our markets and communities, we are constantly identifying changes in the necessary requirements
and abilities. This also enables us to share timely updates with our members about educational innovations. Our priorities lie in developing academic networks for knowledge sharing. In those networks, the participants can show examples of more interactive teaching methods that could be innovative in many places.” As an example, Todorovski mentions the Latin America Land Administration Network (LALAN): a newly formed network of universities that have
decided to share their land administration curricula with one another in online webinars. “They will get new ideas from each other and will also exchange recorded lectures.” A similar network is active in Africa: the East Africa Land Administration Network.
During his period as chair he will also facilitate a structural worldwide exchange of experiences among young surveyors (<35 years of age) who are providing professional education or on-the-job training to others, alongside their own work. “I am certain this will be a new source of ideas. My aim is further to promote studentcentred education and share advanced learning methods. Blended learning, for example – a mix between face-to-face and online teaching – is the topic of our next FIG Commission publication.” The editors are the current commission chair and the previous one, Prof David Mitchell from Australia. Methods for life-long learning are also a priority on Todorovski’s programme to support adequate geomatics education.
Analysing the worldwide offering
The LALAN network counts eight universities at the moment. That sounds like a very small number. So how many educational institutions are actually currently teaching land administration, surveying or geomatics? Nobody knows. But this will soon change,
Issue 2 2023 32
Dimo Todorovski. (Image courtesy: VBB)
because Todorovski and his commission team are going to analyse the worldwide offering. “I think there will be more universities than we know of. The general feeling is that the number of students globally is diminishing in the core of our field. I think that is perhaps the case at ‘traditional’ universities, but that is compensated by new institutions – maybe with less demands on mathematics and science to attract more students. In my opinion, the societal and economic demand for enough graduates on every possible level in this sector is unquestionable. Nobody in this industry is without a job if they want one. The technological innovations are appealing to many: geo-related artificial intelligence, spatial IT programming, drones, 3D models, digital twins, etc. And there is an enormous range of chances to be able to contribute to today’s global challenges, in your own country,” he continues.
Todorovski, who coordinates the master’s specialization in geoinformation management for land administration at the University of Twente/ITC in the Netherlands, admits that interest among adolescents in doing a surveying engineering-oriented degree varies around the world. “There is perhaps less interest in the USA, parts of Australia and in Western Europe. But everywhere else, surveying education is core for national sustainable development and will as such be supported. When the students get attracted by the impact that they could make in the future, by the latest technological developments in our field and via student-centred interactive education, I believe there will be no shortage of well-educated surveying and land administration specialists to fulfil all the good work to be done.”
Spatial planning in Switzerland
“Classical surveying is still part of our geospatial engineering education, but it is now only one component in a broader portfolio. We have enough students for a sustainable curriculum since we have widened the scope,” says Professor Konrad Schindler from the ETH Zurich (24,500 students) in Switzerland. Schindler is head of the Geodesy and Photogrammetry group, one of ten institutes within the
 About the author
Frédérique Coumans is contributing editor for GIM International. For more than 25 years, she has been covering all aspects of spatial data infrastructures as editor-inchief of various magazines on GIS, data mining and the use of GIS in business. She lives near Brussels, Belgium.

Department of Civil, Environmental and Geomatic Engineering (1,400 students, 300 postdocs, one third are female). “We have moved to a broader definition of geomatics and spatial data science. This includes spatial planning, which is of high importance in a densely populated country like Switzerland with fragile natural resources. We annually attract about 40 new first-years to our geospatial engineering bachelor programme, and we have over 20 new master students in geomatics per year. Besides from our own Swiss bachelor graduates, we receive many applications for the master programme from all over the world, but we don’t have the capacity to accept all of them. Likewise at the level of doctoral students, we get dozens of applicants for a position. Here we benefit from the fact that ETH has a high position in university rankings, while at the same time not asking high tuition fees.” Almost all research positions are on a temporary basis. “Young people are supposed to move on. We are there to bring them further in their professional career.”
His group has learned to be agile and to react fast to changing needs. According to Schindler, today’s data-capturing tools on the hardware side are highly automated and user-friendly; they’ve become black boxes that you can quickly learn to use competently. “It is now more about data processing and management: big data analysis, machine learning, information extraction or ‘artificial intelligence’, as people now call it again. Even smaller companies who employ our graduates need and want those skills. Every single graduate must be able to programme. It’s about turning measurements into actual, useful information. There is a growing need to extract value from raw data to support the sustainable development of our living space, our environment and resources.” He observes: “This does of course increase the competition for the core surveying industry; surveying practices suddenly have to compete for personnel with software firms and consultancies. But that is also a sign that more employers see that our students bring valuable knowledge which isn’t available elsewhere. In fact, that competition affects us too; we are keen to hire strong graduates as doctoral researchers, but IT firms like Esri,
Issue 2 2023 33 Feature
Konrad Schindler.
‘It is now more about big data analysis, machine learning and artificial intelligence’
Google or Hexagon pay more. Meanwhile, the scene of small local companies and start-ups – in the drone industry and for autonomous driving, for instance – is also attractive for graduates.”
The focus in Schindler’s research projects is on the use of multi-sensor data for environmental monitoring, agriculture, climate change mitigation, etc. “This is a challenge our generation has to resolve. It is also a topic that many young students have an interest in, all around the world, so we can recruit our doctoral researchers internationally,” he states. In terms of numbers, there is a striking level of interest from Wuhan, China.
Number 1 in China
Is the number of master and doctoral students rising at Wuhan University? “No, per year it’s stable,” responds Professor Bisheng Yang. “About 29,000 out of a total of 58,000 students.” Yang, who was a PhD research fellow in Zurich 20 years ago, is now one of the directors of the Laboratory of Information Engineering in Surveying, Mapping and Remote Sensing (LIESMARS) at Wuhan University. “Seen over a longer period, we are producing more graduates, because today’s young people want as many degrees as possible in a shorter time than ten years ago,” he adds.

LIESMARS is the main geospatial research centre of Wuhan University. Divided over 14 research groups, it has about 900 master and doctoral students (one third are female), of which 105 are from abroad. About ten applicants apply for each PhD position but, as in Zurich, the university is high ranked and can therefore select the better students. Overall, Wuhan University is number ten in the national ranking of universities and the geospatial research centre is number one.
“A few years ago we still concentrated on methodology development and the more traditional surveying engineering. But the technological developments in data capturing, data analytics and GIS changed the way we could add value to society. Additionally, our students wanted to see the role IT plays in everyday life reflected in our educational offering, so we adjusted our curricula. Now we focus on artificial intelligence and the integration of position, navigation, timing, remote sensing and communication. We want to make a difference in areas such as feature extraction, intelligent navigation, industrial 3D measurements, multimedia communication, RFID in surveying and mapping, intelligent transportation, smart cities, carbon stock and other climate change-related challenges,” Yang explains.
“The students very much appreciate the interesting research projects we do for government and commercial parties. 50% of our students do their dissertation at Chinese IT companies such as Tencent, Baidu, Huawei and Qualcomm. Students are also attracted to the autonomous driving industry, governmental smart city projects and space information integration.” Yang makes another observation: “In general, graduates do not want to work outside China’s three
Issue 2 2023 34
Bisheng Yang.
Francis Aduol.
‘IT graduates will have a hard time competing with “our” graduates’
largest cities. Also, our graduates are mostly hired by the big IT companies.” And just as in Zurich, companies who can’t pay a high salary lose out.
Land management in Kenya
Things are no different in Nairobi, observes Professor Francis Aduol, academic team leader of the Department of Surveying and Geodetic Science and vice-chancellor at the Technical University of Kenya. “Moreover, graduates do not like to work in areas that involve the use of traditional and mundane technologies. They prefer to work in jobs that involve the application of high tech, IT and space technology.” That impacts on the curricula. “We will concentrate more than before on the use of sophisticated analytical tools in engineering surveying to cover wider applications in engineering, environment management and land management. Another interesting area is the use of maps and remote sensing data in people’s daily activities: in agriculture, intelligent transport, smart cities.”
As more and more students are gaining admission to the Technical University (now at 14,000 students), this is also reflected in the growing number of geospatial engineering students. In his department alone, there are 90 students finishing with an undergraduate-level degree each year. At the moment there are 20 postdocs and 10 master students, all on staff positions. “Most MSc and PhD students work on issues that revolve around land management, which is a serious problem in my country just now,” states Aduol.

Although there is steady growth in student numbers,, he does feel pressure to further ‘soften’ the curriculum. “What worries me is that there are more and more students opting for the ‘soft’ side of the geospatial engineering discipline, which is more IT-based, at the expense of the ‘hard’ part that focuses on surveying engineering. They consider IT to be fancy and believe that they will have more flexibility in finding employment, especially in the promising IT sector.” He further clarifies his concern: “The fact that students are avoiding the surveying engineering aspects means that the core of the discipline is likely to be lost in the near future. The focus on the IT part of the discipline tends to produce graduates who lack analytical rigour but are stronger in IT manipulation. In the long run this may not be sustainable since our graduates will be competing with dedicated IT graduates.”
Todorovski understands Aduol’s concerns and this is one thing urging him forward at FIG. “IT and geo are converging, as in every aspect of life. Young people who do not see the big picture may choose the IT sector, developing and testing all kinds of prototypes. I am convinced more people will become interested in modern geomatics studies – either early or later in their career – and will want to contribute to sustainable living conditions based on more extensive knowledge and a longer-term vision. Then the tables will turn; IT graduates will have a hard time competing with ‘our’ graduates.”
Feature
Issue 2 2023 35
Sensor fusion is key to improving data quality in poor GNSS conditions
Using Lidar to enhance urban navigation data quality
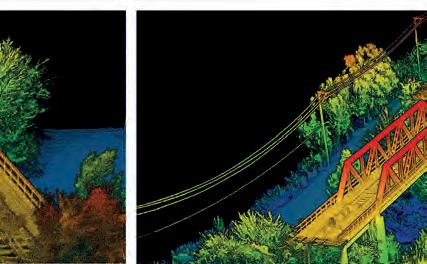
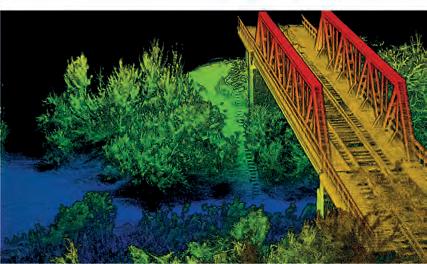
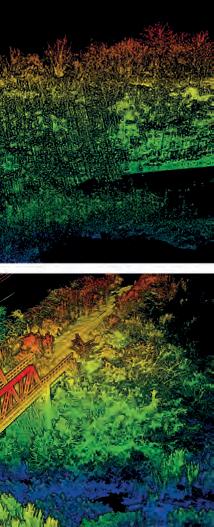
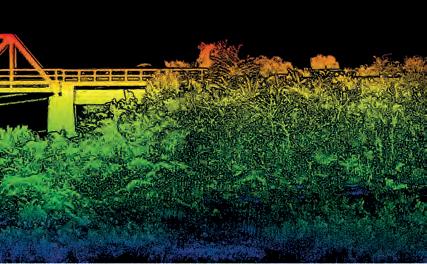
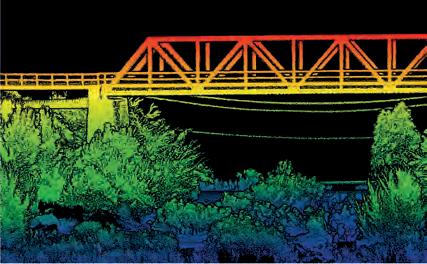 By Paris Austin, OxTS
At OxTS, in line with our brand promise of being inertial navigation experts, our commitment to our customers is that we will keep innovating until we can help them truly ‘navigate anywhere’ – with or without GNSS. We are advancing our products in that direction by first enhancing urban navigation data quality based on sensor fusion. Here, we explain how.
Without accurate positioning and orientation in all environments, many autonomous navigation and surveying applications are impossible to execute to the required level of quality. Whether for an advanced driver assistance (ADAS) feature validation test on the open road or a mobile mapping application to create HD maps of an entire city, navigation data is at the heart of ground-truthing and georeferencing applications. Without it, our customers would be unable to produce data with centimetre-level absolute accuracy in the global frame, preventing them from going to market with an ADAS feature or selling map data to their own customers.
Although customers do not obtain perfect GNSS on the open road and in dense urban environments, they require similar
levels of accuracy to what we deliver on an automotive proving ground. With our innovation work in 2023 and beyond, we therefore plan to offer improved navigation performance in such environments. Through this work, we will bring our customers closer to the goal of OxTS – which is to help them ‘navigate anywhere’ – as well as extending our capability to more customers in new applications.
Sensor fusion
Sensor fusion is at the heart of all of our
Clear and accurate navigation data is essential for applications such as infrastructure monitoring.
navigation work. The fusing of GNSS and inertial measurement unit (IMU) data originally gave OxTS the traditional inertial navigation system (INS) product that has served our customers for two decades. The addition of a wheel speed sensor in current applications enables further enhancement to navigation performance, but more sensors than ever
before are available and have the potential to aid the navigation solution we are offering. Using sensors with mutually exclusive sensing approaches means that error growth manifests in a way that allows for reliable validation and redundancy. If four sensors agree and one contradicts with them, it is an easy decision to reject the outlier. This is often
Paris Austin is head of product – new technology at OxTS. During his more than ten years of service at OxTS, he has taken on multiple roles within the Support and Application Engineering teams, giving him in-depth insight into customer use cases. Having made the move out of engineering into a business-focused role, he has been responsible for starting dedicated business functions to launch Lidar survey-specific products. He is now looking to the future of OxTS technology to ensure the products remain on the leading edge of navigation capability and continue to solve real-world customer problems.

better than using five of the same sensor with common error characteristics, since if one suffers a drop in performance based on an event, they all could.

Much more robust

The first step is to pick a sensor with mutually exclusive characteristics to GNSS and IMUs. Lidar’s growth in popularity for autonomous and survey applications means that Lidar sensors are prime candidates as aiding sensors due to their increasing performance levels and decreasing cost. The 3D nature of operation means that Lidar can be utilized to identify features in a complex environment over time and calculate a velocity vector. This can be used to constrain IMU drift
INS and Lidar have a number of mutually exclusive characteristics. Using Lidar to aid navigation is the next step in OxTS’s ‘navigate anywhere’ mission.
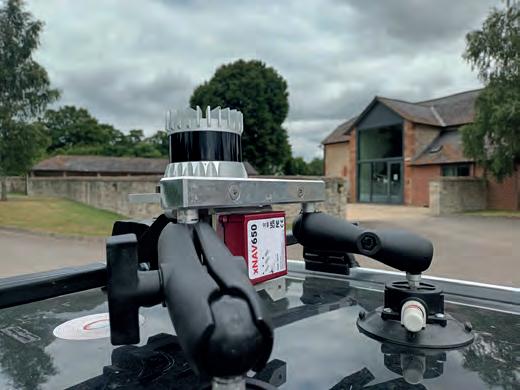
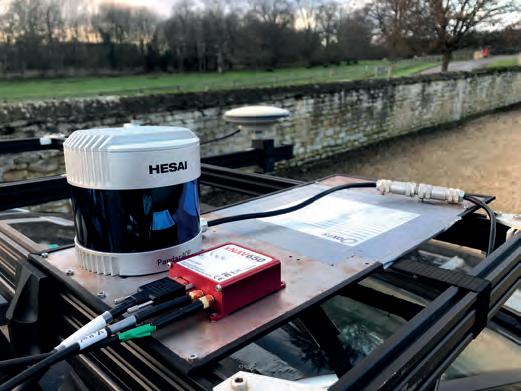


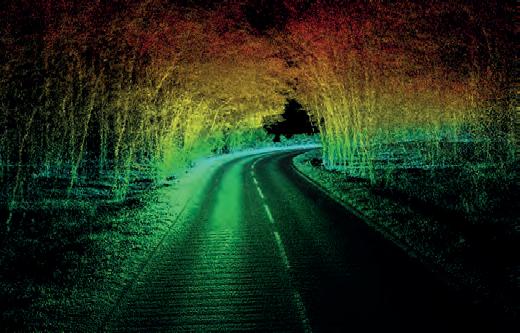
Sponsored article
Good navigation data is essential for many applications, including Lidar surveying.
Dense tree cover can affect navigation data.
About the author
in all axes of velocity through odometry updates, allowing for enhanced dead reckoning in GNSS-denied environments. Pair this with the advanced GNSS processing of OxTS’s gx/ix algorithm and in-house IMU design, and the navigation solution becomes much more robust in a GNSS-restricted environment.
Further information
If you’re interested in learning more about using sensor fusion to ensure position accuracy in all environments, contact us at info@oxts.com to arrange a confidential conversation about your project.
7 questions about the sensor fusion development journey at OxTS
1. What is the history of OxTS and what has led the development to this point?
OxTS has been delivering high-quality real-time inertial navigation systems to the market for over 20 years. Grounded by a strong technology development culture, we have been providing solutions to enable our customers to complete their work in many environments all over the planet. Sensor fusion as a concept has evolved over time, initially meaning just GNSS and IMU fusion, but now leading to more and more sensors being integrated to achieve a true ‘navigate anywhere’ goal.
best combination of sensor fusion will always be one of contrasting individual sensor capabilities. For example, whereas GNSS is low update rate and noisy (by comparison to its counterpart), an IMU is high update rate and very smooth output. Pairing them together gives a great result. Extend this to where Lidar and visual systems work well (e.g. urban environments) and this is a great match for GNSS. In environments where satellites are hard to detect and track reliably, a mutually exclusive sensor update is needed to help navigate to a high level of accuracy.
2. Why is it important for OxTS to help customers
‘navigate anywhere’
We believe our technology is transferrable to so many different applications while the core offering remains the same: navigation data. It doesn’t matter what your end goal is, if you need to know when/where you were at any point during your session, then we can enable that data to be provided in an easy-to-consume way, eventually leading to an intelligent, data-driven decision to be made.
3. What is sensor fusion?
The human senses are a brilliant example of sensor fusion. Vision, hearing and touch (and even smell and taste) can all help us ‘locate’ where we are and navigate from A to B. When one of those senses fails or is underperforming, the others are able to keep us on the right path – maybe not to the same level of accuracy, but maintaining a safe level of travel so that we can still get to our destination. To us at OxTS, sensor fusion is the integration of multiple sensors of different capabilities and operating characteristics (GNSS, IMU, WSS, etc.) to fuse their data intelligently, taking the best and discarding the worst data from each sensor. This can be done through sensor modelling and calibration, allowing the decision-making within the sensor fusion engine to know when to trust or distrust each sensor. More sensors mean a more complex – but also more robust – calculation that allows for operation in harsher navigation environments.
5. Which combination of sensors can be used in a sensor fusion ‘framework’?
The key is to strike a balance of engineering investment, time and cost of components to avoid diminishing returns. Using ten GNSS receivers would not give us ten times the performance of one GNSS receiver, so it does not make sense to use multiple receivers. But by pairing together two low-cost sensors that have different operation and error characteristics, it’s still possible to achieve better navigation performance in the environment you care about. A €4,000 GNSS receiver would be far better than a €10 GNSS receiver in a patchy but not totally denied GNSS environment. However, if we used the €10 GNSS receiver and a €10 IMU under a bridge or in a tunnel, we would still achieve better performance than the €4,000 GNSS receiver, which would give no output at all in this environment. There is also the practicality of building reliable hardware and calibrating it. Performance may be achieved for the purpose of a whitepaper, but the ability to reliably manufacture and ship systems that deliver consistent results for all of our customers is a big factor in what sensors we put into our products.
6. What results have been gained from the development tests so far?
4.
How can sensor fusion help OxTS to achieve its ‘navigate anywhere’ mission?
Sensor fusion allows us to break free from the simple navigation environments where a single sensor like an RTK GNSS receiver can do the majority of the job in open sky conditions. With the fusion of the IMU, we were able to seamlessly handle short to mid-term outages of GNSS. With the addition of wheel speed data, we can extend that duration even further. If we add additional aiding, such as Lidar or visual odometry, we can correct the IMU error over time while GNSS is absent to prevent error build-up and improve our dead reckoning even further. As a result of using these enhancements, we aren’t very far off the true path when good-quality GNSS returns. The
The latest work at OxTS has seen us prove that Lidar is a viable aiding source to the sensor fusion engine. Offering a 3D velocity update to help the INS in a GNSS outage, it improves dead reckoning performance in 3 axes and will allow our users in urban environments to get better ground-truth and mobile mapping data for their current and future projects.
7. What does the future hold for OxTS development in this area?
We are continuously iterating on this integration of Lidar as an aiding source with an internal roadmap of work that will lead to stronger open-road data collection performance over time. This work is currently focused on delivering in the post-process environment where our customers care about getting the best possible accuracy and where the immediate consumption of processed data is not required while still in the vehicle.
Trimble Dimensions+ User Conference 2022
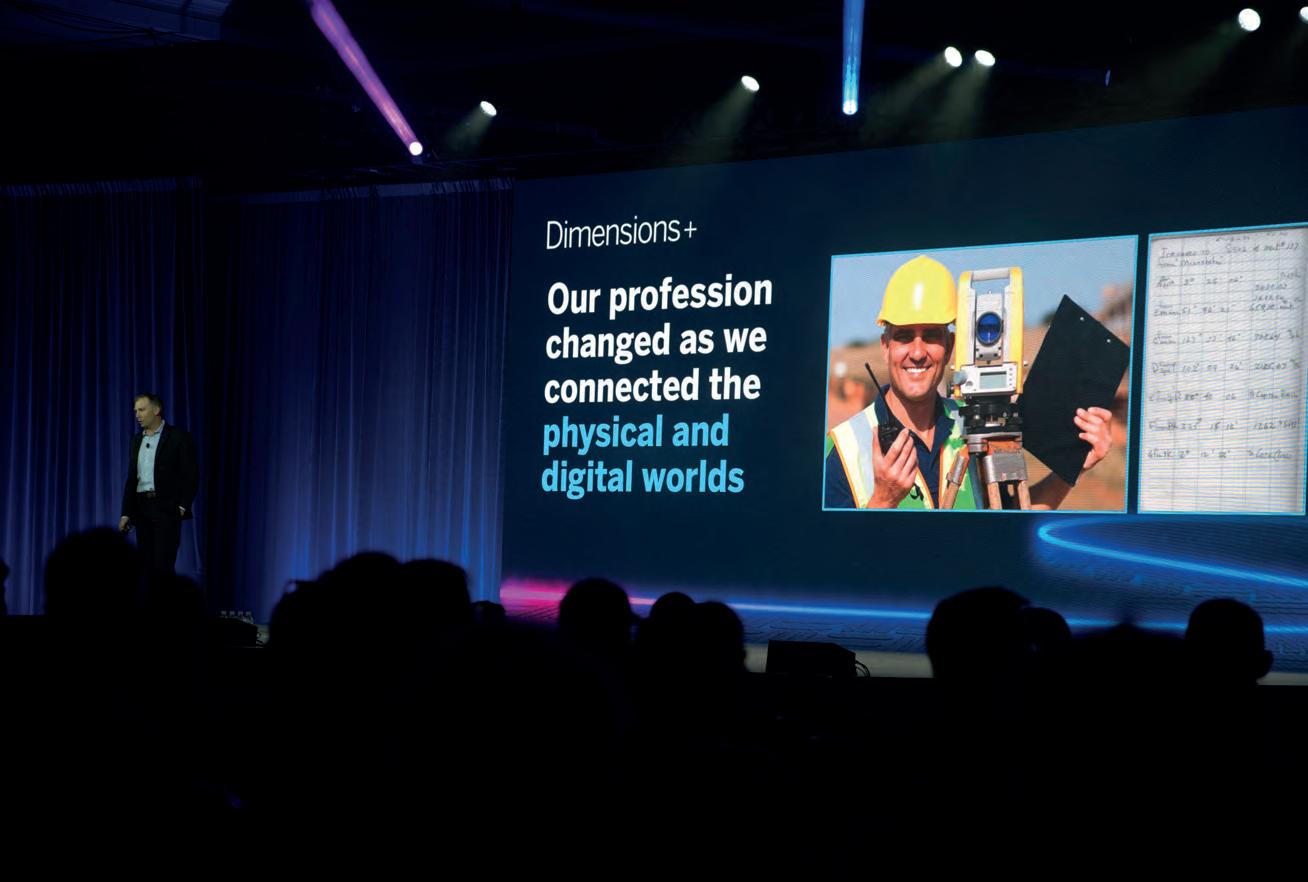
Unlocking possibilities and imagining a better future
By Johnson O. Oguntuase, Contributing Editor, GIM International
For anyone aiming to reposition their business outlook or career in civil engineering, industrial technology, surveying and mapping or geospatial information technology, the Trimble Dimensions+ User Conference would be a good place to start. Trimble hosts the conference annually, and most recently in Las Vegas with 5,750 people in attendance from 75 countries, where “the Trimble community gathered to unlock possibilities and imagine a better future”.
Trimble’s business portfolio and solutions cut across construction, agriculture, transportation, geodetic positioning and mapping. The pace with which the world has changed and is still changing is phenomenal, with astronomic growth in digital technology, big data and artificial intelligence. AI seems poised to drive developments never seen before in human history, and it seems natural for tech giants to get in on the game. Trimble’s singular vision is to leverage cloud computing power, broadband speed and new technologies for human advancements.
Keynote address
Trimble’s CEO, Rob Painter, piloted conference attendees beyond fourdimensional space to the ‘fifth dimension’, by which I mean a voyage into what
Trimble considers the future of modelbased design, project management and professional collaborations, all enabled by Trimble constructible software. Imagine a model with data connected to every object in 3D visualization: such technology is no longer fiction but a reality with Trimble technologies, making collaborations on such designs efficient and cost-effective. Data transmission in real time from the field to the office and project inspections using augmented reality are some features that Trimble software offers users. A notable aspect of Painter’s opening speech was a partnership with Microsoft, Esri and other tech companies in actualizing that dream.
The co-founder of Apple, Steve Wozniak, joined Painter on stage towards the end
of the keynote presentation to talk about his childhood and curiosity about how a computer works, his days at Hewlett Packard and his contributions to Apple. In his words: “You want to be the disrupter, not the disrupted, and Apple was good at that.” His message for rising professionals was heartwarming, and the attendees were left with a clear idea of his work ethic, doggedness, simplicity, humility, humane qualities and attitude to life in general.
Why big data and collaboration matter
The world is now a data machine, and we generate about 2.5 quintillion bytes of data daily. This number will only grow as more technological advancements are made, which explains why the future will be data-driven. Innovations and business
Issue 2 2023 39 Report
Scott Crozier, vice president surveying and mapping, zoomed in on the changing profession during his keynote at Trimble Dimensions+ 2022. (Photo: Trimble)
ideas will make comparable quantum leaps, and nations’ economies and maybe even our social construct will depend on how these data are managed and interpreted. A whopping US$79 trillion investment in global infrastructure is forecast for the next 15 years, bringing fantastic opportunities for the civil construction industry.
So, whether your business is in architecture, engineering, construction, surveying, mapping or infrastructure, there are opportunities to be had in contributing to global development while earning a fair share of the dollars. Doing so may require moving with the technological
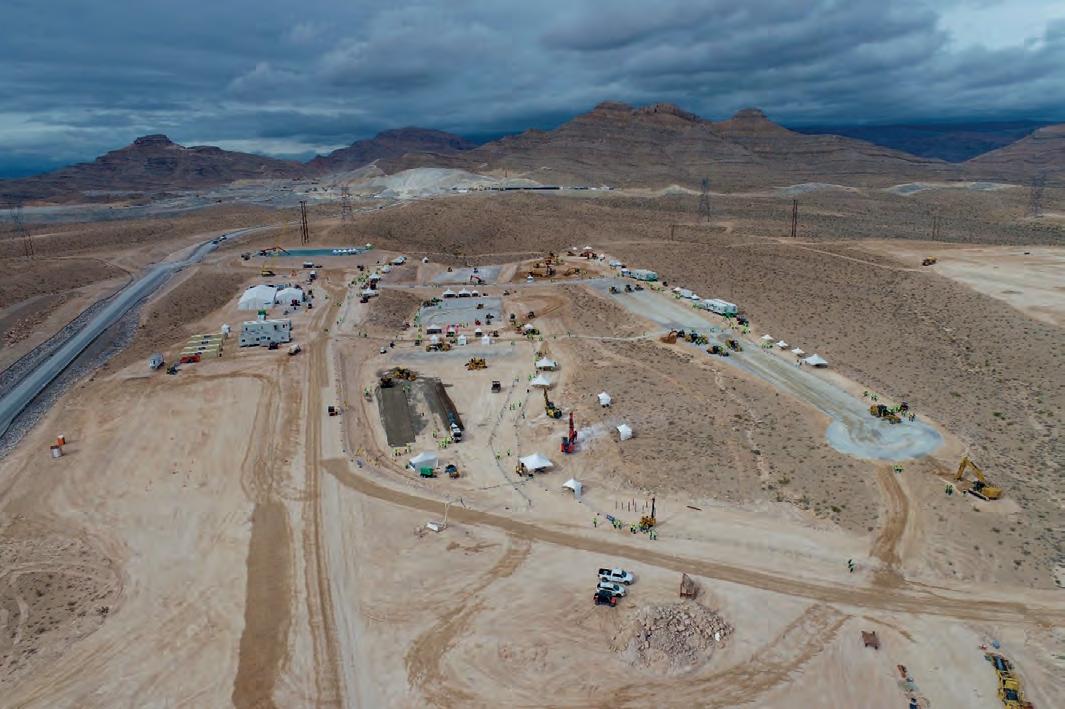
stakeholders. For example, stakeholder collaborations are made easy with the Trimble Connect platform, a cloud-based common data environment (CDE) designed for construction industry professionals, which presently connects over 20 million subscribers from 185 countries in 17 different languages. This is germane to a business model that will continuously satisfy the demands of a diverse clientele.
Machine control highlight
A significant highlight of the conference was machine control and autonomy. While the technology is still nascent, its future model is here. Experts and researchers are working


infrastructure. If I were to suggest future names for those machines, I would name them ‘road bots’ or ‘civil bots’. The future looks exciting, with amazing technologies coming from the ‘world beyond’.
At the Trimble Dimensions Offsite Expo, attendees saw an excavator, grader, roller, bulldozer, paver, trencher and pile driver operating remotely and autonomously. I am not sure that was an exhaustive list of all we saw. However, a fascinating point to note here is that Trimble envisions that machine control technologies will permit either remote or autonomous operation of these machines from anywhere in the world.
Issue 2 2023 40
Trimble CEO Rob Painter (left) delivering the keynote address, and the co-founder of Apple, Steve Wozniak (right).
Attendees at Trimble Dimensions 2022+ during one of the keynotes. (Photo: Trimble)
Business Centre, Trimble WorksManager and Trimble WorkOS software suites for managing civil construction projects, which usually involve project planning, project design, surveying and mapping, construction, as-built monitoring, earthworks estimation, site deformation analysis, project reporting and device reporting, to mention just a few aspects. Using the software mentioned above plus robotic total stations, geotechnical sensors and the previously-mentioned civil bots, construction professionals can measure their productivity in real time and connect other professionals worldwide to field datasets, allowing smooth workflows.
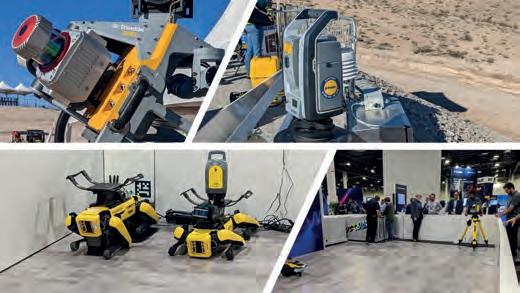
Expo Theater overview
A place to feed your curiosity, the Expo Theater hosted an array of technologies, including self-driving cars, robots, uncrewed hydrographic survey vessels, drones, 3D scanners and total robotic stations for varied applications. You cannot but imagine what the future holds with these technologies. Other technologies worth mentioning are the robotic printer capable of staking out construction marks on the floor and the neural link technologies. Imagine construction engineers controlling machines
with their minds or driving your car just by thinking about each action. This is no longer the realm of science fiction; the technology is here, though still evolving, and attendees saw how a model can be trained to learn human thought patterns for various actions. For example, the model learns how you think about the push and stop action via a headset connected to a computer. Once the neural link model masters your thought pattern, you think of pushing or stopping and a toy car responds. It is no big step to imagine that tech gurus will one day provide us with devices that help control machines with our minds.
Takeaways from the events

Behind all these technologies are the geospatial science discipline and mapping products on which most of these solutions rely. The fundamental discipline that underpins all geospatial sciences is surveying and geodesy, one of the oldest professions – dating back to ancient Egypt and probably beyond. Sadly, qualified professionals are becoming increasingly scarce in this field, and the average age of geodesists, if my guess is correct, is 45 to 50. Moreover, sustaining these emerging technologies, from satellites in space to robots on the
ground, requires the training and retraining of qualified professionals.
Unfortunately, however, 8% of licensed surveyors in the USA are retiring each year, and 50% of general contractors are worried about finding people to join their workforce. Will robots replace this noble profession? In the foreseeable future, we will still need to supervise robots for quality control and make human-centred decisions and policies, making qualified professionals unmissable. Nevertheless, we should expect changes in the role of professionals and blurred boundaries between related disciplines as technologies proliferate, allowing humans to do more.
The Allegiant Stadium farewell
The conference was not all work, and there was an opportunity to meet new people and become reacquainted with old friends. The Allegiant Stadium hosted attendees on the last night of the conference, with delicious food, games and music to top off the event. Looking back, it was a memorable and insightful conference that provided a wealth of information, and I see Trimble building a new future with professionals and clients worldwide.

Surprisingly, many students were interested to hear about my experience at the conference, especially how they can remain relevant in their careers for the next ten to 15 years. Hopefully, this article will reach such students not just in the western world but all around the globe, as the future of geospatial science has never been as bright as it is today. With Trimble fostering collaborations and developing new solutions, great things are on
horizon.
Issue 2 2023 41 Report
the
Johnson O. Oguntuase holds an MSc in Geodesy and Geodynamics from the University of Nigeria and a PhD in Hydrographic Science from the University of Southern Mississippi (USM). He teaches kinematic positioning, 3D positioning, applied bathymetry and applied acoustics at USM, where he also researches new technologies for precise positioning at sea. His new hobby is writing positioning and geomatics articles for GIM International.
3D scanner (top left), robotic total station (top right) and robots (bottom). Participants at the Allegiant Stadium, Las Vegas.
About the author
27 March – 24 April
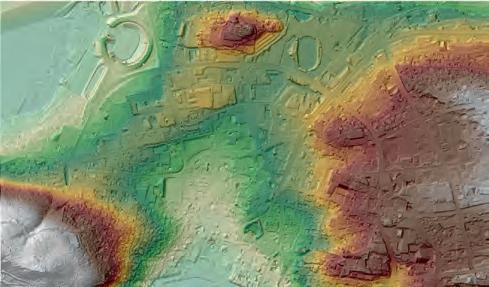


Technology Adoption Weeks

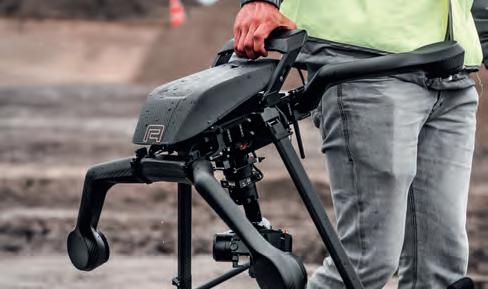


gim-international.com
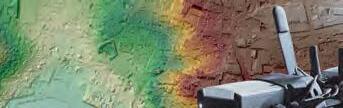
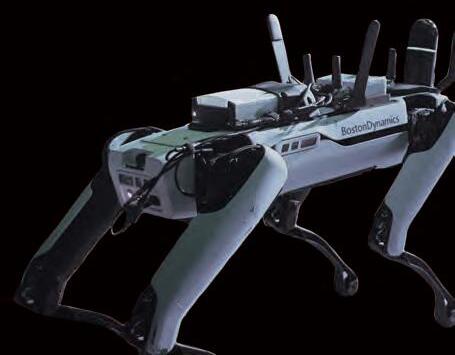


During the Technology Adoption Weeks, we will review the uptake of geospatial technological innovations – both among surveying and mapping professionals, and also in other industries such as construction, infrastructure and urban planning – in response to changes in spatial planning and land management. Which technologies have already been effectively adopted, and which new ones hold the potential to disrupt? The Technology Adoption Weeks are an online event, running from 27 March to 24 April 2023 on the GIM International website and supported by a themed newsletter once a week for the duration of the event.
The Technology Adoption Weeks are an ideal backdrop against which suppliers can help land surveyors, geospatial engineers and other mapping professionals understand how to leverage new technologies to gain maximum benefit, both for their business, for their clients and for society as a whole. For more details about advertising opportunities, contact Myrthe van der Schuit, she can be reached via myrthe.van.der.schuit@geomares.nl.
Software as a Service for streamlining point cloud processing workflows


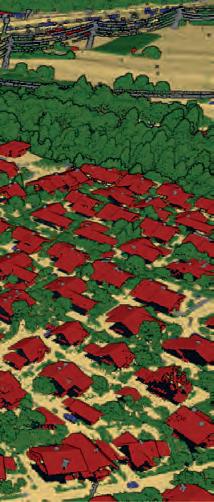
Leverage AI for automated point cloud processing
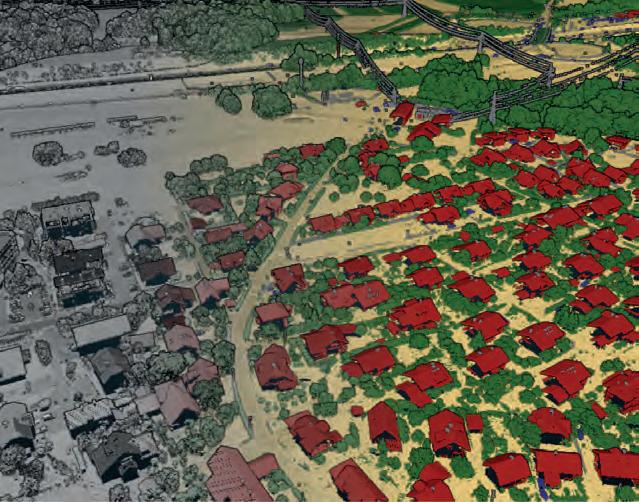 By Klemen Čotar, Flai, Slovenia
The creation of an accurately classified point cloud usually requires tremendous input from manual annotation. At Flai, we believe that all those repetitive procedures can be greatly reduced by using the latest innovations in artificial intelligence. We have developed a cloudbased web application that provides easy-to-use solutions for the classification, exploration and management of geospatial data, with a special focus on point cloud datasets.
Flai was created by a team of experts from various backgrounds, ranging from geodesy and physics to computer engineering and machine learning. By combining our expertise in processing large quantities of data utilizing the latest technologies with our understanding of customer needs, we have developed Flai as a solution to the increasing demand for the automation of common geospatial tasks and customized requests. Our solution enables companies working with point cloud data to shift from labour-intensive human processing to faster and more efficient autonomous flows powered by the latest machine learning (ML) and artificial intelligence (AI) techniques.
Those approaches are crucial to consistently delivering accurate products faster than ever before.
Web application and data ingestion
To make it easier to use our tools and be independent of the underlying hardware and operating system on which they would be run, all operations are available through the Flai web application. The application enables uploading, browsing and combining various geospatial datasets, such as point clouds, rasters, vectors and images. After uploading, the datasets are safely and securely stored in the cloud and are accessible only to the organization that initiated the data ingestion
procedure. When even greater security is requested and data cannot leave its country of origin or the data-producing company, the Flai environment can be deployed at the user’s own computing facility. In the case of processing large data volumes, we also offer on-site batch-processing services for specific tasks, without the need of using the web application.
The web application interface provides easy access to uploaded data and offers an intuitive interface for creating and running user-defined processing flows. Each flow can combine multiple input datasets of different types and simultaneously output countless new datasets
Sponsored article
The Flai automatic artificial intelligence algorithm transforms raw point clouds into fully annotated and ready-to-use datasets.
generated from input data. Focusing mostly on point cloud datasets, users can choose from a broad selection of predefined processing tools, ranging from simple operations such as class remapping and filtering to complex operations aimed at interpreting the data and creating higher-level results understandable by the wider public. The most sought-after tool is point cloud semantic segmentation that takes raw measurements and assigns a meaningful semantic label to every Lidar point. The generated set of labels depends on the selected field of interest and the required level of detail.
How does Flai point cloud classification work?
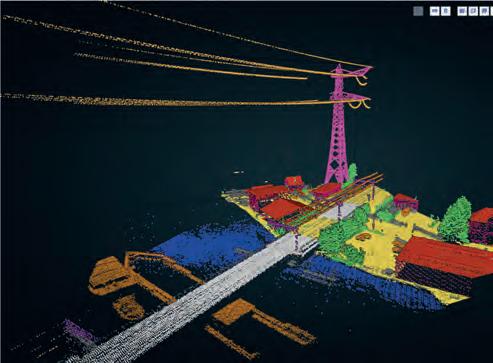
At Flai, we strive to use the latest approaches and best practices in all our data processing tasks. This is most pronounced in our point cloud classification task that uses state-of-theart AI and ML algorithms for working with point clouds. The most challenging part of working with such data comes from the unordered structure and data specifics, as even datasets acquired in a uniform way can have vastly different densities and height spans. To overcome these potential hazards, we first split a dataset into small overlapping sections, where each one gets treated individually. For the classification algorithm to understand relations between points, their exact cartesian coordinates, height above ground and additional Lidar attributes (intensity, return number, number of returns and RGB values) are passed to a pre-trained AI model. The model’s internal computations output perpoint classification labels whose meaning was predefined by our team based on average customer requirements and use cases.
The application includes ready-to-use AI models suitable for large-scale mapping, drone applications, forestry inventory creation and mobile mapping. They have been trained on an extensive collection of diverse point cloud scenes that were handpicked and skilfully annotated by our team of data engineers. This ever-growing set gets expanded whenever we encounter new types of structures, vegetation or terrain. For more advanced and specific use cases, we also offer an option to create user-tailored classification models that are trained on their data and classification labels. This feature is also available for all our users to try on their data and create their own custom models. The training process also includes an interactive
the author
Klemen

component that will suggest which data should be additionally labelled and added to a training set to improve prediction quality.
Manual point cloud annotation
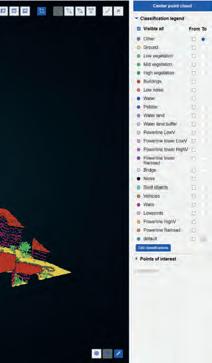
After the automatic classification procedure has been completed, results can be reviewed, edited and measured in the application. For this purpose, we embedded an intuitive three-dimensional viewer that allows users to seamlessly fly through even the largest datasets. At the same time, any identified misclassifications can be corrected by a range of point selection tools. Those include strip, box and polygonal selections that can be interchangeably combined to achieve desired results by remapping points of one or multiple labels into a new label. Additionally, the manual classification task can be distributed among multiple people in the user organization through virtual tiles that seamlessly split the dataset into smaller, more manageable chunks. Whenever any annotator has a problem deciding on an object type, they can initiate a conversation by placing a note directly in a point cloud.
How can I benefit from using Flai?
The possible applications for point clouds are diverse and go far beyond the described classification task. Flai is constantly developing and adding new tools that extract more informative and easier-to-manage vector products from point clouds. Our team can also develop custom solutions to simplify and speed up your current workflows to make it easier to digitalize construction sites, urban planning, mining operations and surveying, among other activities.
Large-scale aerial mapping
The majority of large Lidar acquisition companies still use semi-automatic scripts that can extract only the most basic and simple objects from the acquired point clouds. For extraction of additional classification labels and post-processing, they still rely on labour-intensive human-produced annotations. With the help of Flai, some of them are already leaving behind their old methodologies and replacing them with automated solutions. Since the production of digital elevation models is the main aim of
The Flai point cloud viewer offers multiple classification tools to easily set objects in a point cloud to any user-defined label.
About
Čotar studied electrical engineering and obtained his PhD in Physics by analysing large quantities of high-resolution stellar spectroscopic measurements. At Flai, he works as a computer vision engineer and data scientist and is responsible for implementing data processing tasks. He also created a data processing pipeline for the first Slovenian Earth observation microsatellite. This gives him knowledge of processing and an understanding of various geospatial datasets.
large-area mapping datasets, our main task for such extensive mapping projects is to extract reliable ground representation without any outliers. Additionally, depending on customers’ needs, we can also deliver annotations for buildings, vegetation, bridges, water, powerline infrastructure and all other remaining human-built structures. Over the course of the last year, our AI models enabled significant time savings for end clients. Regarding the time allocated to the manual annotation, reported time savings range between 30% and 80%, depending on the complexity of the use case.
Mapping with drones
The same approaches can also be applied to typically much denser datasets acquired by unmanned aerial vehicles (UAVs or ‘drones’). Here, we focus on processing small areas captured to understand a specific region. Those regions require high-frequency monitoring which is usually not feasible from the ground, or the ground measurements are too time-consuming to produce. Therefore, drone scanning combined with our automatic procedures is the optimal solution for the timely and constant delivery of reliable products for monitoring critical infrastructure and risk assessment. Our clients come from various different sectors such as mining, urban planning, landslides and rockface monitoring, transmission wire inspection and many others. Our application has helped multiple UAV mapping companies to complete their projects in a matter of days, rather than weeks as was previously the case.
Forest inventory
With the growing demand for sustainable processes and the need to account for and measure greenhouse gas sinks and sources, a growing number of initiatives are trying to produce as accurate forest inventories as possible. Extracting inventory information, such as tree size, diameter and species, is typically very labour-intensive and limited to only a few sample locations in vast forests. To make this work easier and produce more accurate results, a growing demand for extracting this information directly from point clouds has emerged. When the point density is high enough and an adequate number of Lidar points penetrate the canopy down to the ground level and hit tree trunks, they are ideal sources for the estimation of biomass at the individual tree level.
To ease the transition, we have developed a custom classifier that can discern forest volume into three important segments: tree canopy, trunks and understory. They are used to create accurate maps of individual tree top locations and heights, trace canopy outlines and compute vertical crown density profiles. Additionally, single trunk classification enables us to monitor tree trunks in the three-dimensional space, create radial profiles along their length and estimate individual volumes. The described approach has already helped multiple customers around the world to unlock the untapped potential for the use of AI and ML in forest inventory and carbon trading applications.
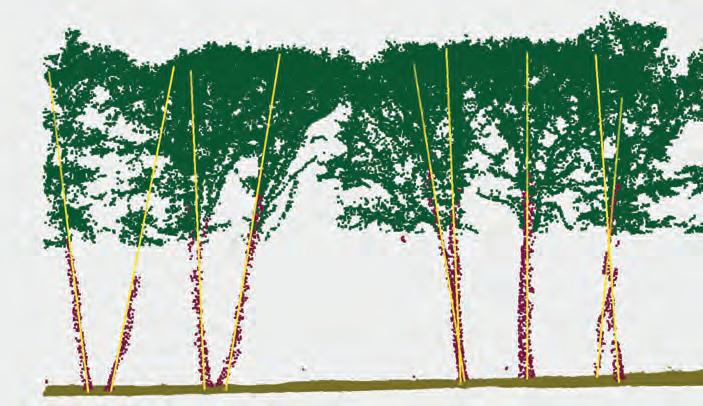
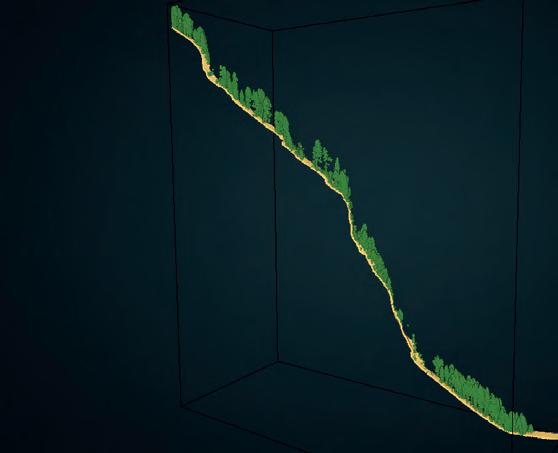
Conclusion
Flai’s web application has been proven useful for numerous use cases related to analysing point cloud data from diverse sources. Our application can handle any kind of data, from low-density aerial data to very high-density terrestrial scanning data. To enable you to test our application without any risk and understand how Flai can help your business, we offer a freemium plan with limited processing resources for all our existing tools. Simply create an account on our web page and give it a try.
Flai solution for single tree delineation can report all relevant tree information such as tree height, canopy distribution, trunk length and radius.
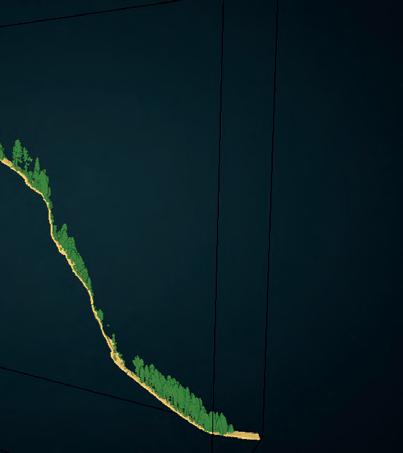
Sponsored article
Flai provides reliable ground extraction for even the most complex scenarios, such as overhangs, terraces and boulder-filled regions.
The
More information info@flai.ai
River monitoring network in northern Germany – a case study
In July 2022, an environmental disaster hit the Oder River, a vital waterway for both Poland and Germany. The mass die-off of fish triggered an extensive investigation into the possible causes, but could this tragedy have been prevented?
Early detection enables rapid feedback and effective countermeasures, so developing modern sensor networks for water quality monitoring is critical for the assessment, protection and restoration of aquatic ecosystems. A real-time monitoring network makes it possible to ascertain the extent of the water quality degradation and develop an appropriate response before an issue becomes a larger problem.
EvoLogics offers a wireless, low-maintenance monitoring network for tracking water parameters near industrial sites, and an overview of such systems and their future outlook and potential uses are provided below.
The problem
A mining industry client of EvoLogics wished to use live data from a monitoring network to measure the impact of its wastewater releases into a river in northern Germany. Several water parameters had to be measured with real-time remote access to the data. Other requirements were ease of deployment and low maintenance without the need for divers.
The solution: system overview
The monitoring network developed by EvoLogics consists of a number of autonomous underwater sensor stations on the riverbed, each paired with a buoy on the surface.
Each water-filled riverbed station carries several sensors, tailored to the client’s needs: in this case, a CTD multiparameter probe measures water conductivity (to estimate the salt content), temperature and depth, and an ADCP (acoustic Doppler current profiler) tracks the water current velocity. The station is equipped with an EvoLogics underwater acoustic modem for
wireless transfer of the sensor data to the surface buoy, and is powered with a highcapacity underwater battery.
The battery-powered buoy is a platform for the communication equipment: it carries GNSS, Wi-Fi and LTE antennas for connection to the client’s central server and an underwater acoustic modem for retrieving sensor data from the riverbed station. The system is therefore cable-free.
System operation
Optimal locations for station placement and the frequency of data sampling were established together with hydrographic surveyors, who were partners in the project, and the stations were spaced along the river downstream from the plant, with one station placed upstream to obtain control samples. This setup allows the tracking of small differences in water parameters from one station to the next.
The network takes measurements at a predefined sampling rate and provides insight into how the plant’s scheduled discharges are processed by the river’s ecosystem. The water quality data provided makes it possible to manage the plant’s discharge: in low waters with high concentrations of pollutants the output is reduced, while high water levels and strong currents mean it is safe to increase the volume of discharge. The data also makes it possible to separate the impact of a particular discharge from other sources of industrial pollution.
The riverbed station’s acoustic modem sends water quality data from the sensors to the modem on the surface buoy at pre-defined time intervals. Using an LTE connection, the surface buoys transmit geo-referenced data to the client’s servers. To conserve energy, the whole system powers off
 System overview drawing
between the sampling-transmission cycles: the EvoLogics modems are equipped with a ‘wake-up’ module that turns the system elements on and off into a ‘sleep’ mode. If for some reason the surface station cannot be reached over the underwater acoustic channel, the sensors continue operation and the data is stored onboard the riverbed station for later retrieval, so that no measurements are lost.
The monitoring network is cable-free and operates autonomously all year round, including at the high tide when the river is filled with debris. Maintenance is required approximately once a year. Recovery of the riverbed stations for maintenance does not require diver services, as each station is fitted with a detachable float and tether. The float release is triggered by an acoustic command from the buoy; it then surfaces and the station can be pulled up to the support vessel using the tether line. Maintenance procedures include changing the batteries, inspection for corrosion or bio-fouling (accumulation of unwanted biological material), software updates, sensor calibration and functionality testing.
EvoLogics and the project service partners have been operating the water monitoring network for over a year, 24/7, in various weather conditions and in high and low waters and strong currents. The only problem encountered was related to underwater dune migration near one of the stations that eventually required recovery and repositioning of the station. The team
gained valuable experience by exploring this issue. Otherwise, the autonomous network has presented no issues calling for immediate service actions.
Future outlook
River monitoring networks are proving crucial for the effective management of the environment. Science and business must therefore work together to further develop and expand these systems.
Rivers can be monitored for a variety of metrics and properties. Research-focused systems can be designed to investigate aspects of river hydrology and water quality to provide a better understanding of human impact. Examples of commercial applications are systems designed to monitor industrial impacts, such as turbidity during a dredging project, discharge and flow rates at a fish hatchery, or nutrient loads near an agricultural operation. A water monitoring network is also necessary for tracking the progress of ecological restoration efforts.
Whatever the nature of the application, the autonomous monitoring network described here can be easily adapted for various scientific or commercial activities, as the riverbed station can include any sensors required to track a particular set of parameters. The network also has great scalability potential: the networking features of EvoLogics modems can enable different architectures for underwater communication, where one surface buoy can receive data from several riverbed stations, or from
multiple stand-alone sensors interfaced with underwater acoustic modems. Moreover, monitoring stations can be equipped with underwater imaging sonars and/or cameras and enhanced with neural network modules with object recognition. Objects in the sonar or camera image/video feed can then be automatically recognized, for example to count or categorize them, opening up new opportunities for employment of the network.
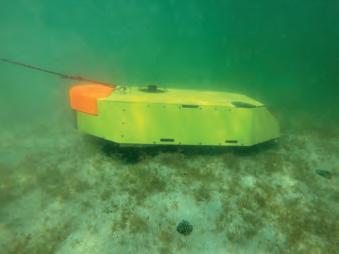
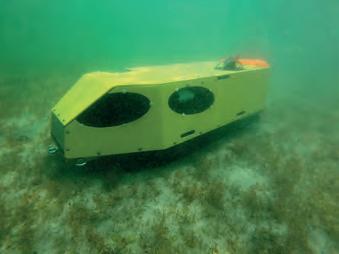
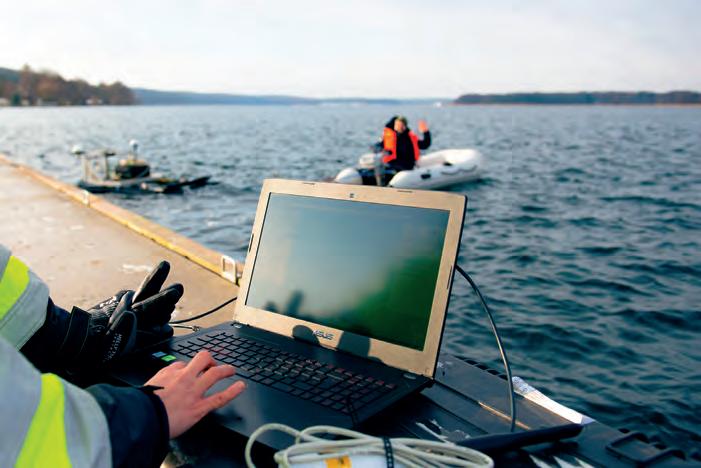
To summarize, a scalable multi-instrumental river monitoring network that provides multidimensional information about the quality of water can be a versatile tool for assessing the ecological status of an area. EvoLogics is looking into the further development of the concept for future and ongoing projects.
On 18–20 April 2023, the team will happily discuss the system and the company’s latest updates at Ocean Business 2023 in Southampton, UK – stand M4.
Sponsored article
System testing
Riverbed station
Riverbed station
More information EvoLogics.de sales@evologics.de sales-us@evologics.com
2026 ISPRS Congress in


Toronto
ISPRS Congress to return to Canada after 54 years

The XXV Congress of the ISPRS will take place in Toronto, Canada, from 4-11 July 2026. Hosted by the Canadian Remote Sensing Society – Société canadienne de télédétection (CRSS-SCT), this event represents the long-awaited return of the ISPRS Congress to the Americas. It will be held jointly with the 47th Canadian Symposium of Remote Sensing.
About Toronto

As the largest city in Canada and the fourthlargest in North America, Toronto is an ideal location to host the most significant ISPRS event. The city is a well-connected air transportation centre with direct flights to and from many international

destinations and offers a wide range of excellent accommodation, restaurants and entertainment. The UP Express train provides easy and direct transport from Pearson International Airport to downtown Toronto where the congress venue – the world-class Metropolitan Toronto Convention Centre – is located. Travel around the city is very easy thanks to extensive local and regional transit networks. Toronto has been recognized as the second safest city in the world and, according to BBC Radio, is the world’s most diverse city.
Congress theme
Our top priority is to host a high-quality scientific event. The theme of the Toronto Congress, ‘From Imagery to Understanding’,
encapsulates the role of ISPRS activities using imagery to represent and understand planet Earth, its complex processes and its diverse peoples in order to meet the many challenges the world faces. This highlights the legacy we plan to establish for the Toronto Congress: creation of materials that can be used by the ISPRS community to emphasize to funding agencies and others the critical role that we play in the world’s economic, environmental and health-related activities.

The ISPRS Congress will feature international experts presenting their latest research in photogrammetry, remote sensing and spatial information sciences. Attendees will be privy to leading-edge developments in artificial intelligence and machine learning, sensor fusion, autonomous sensing systems, digital construction and health analytics, among others. Highly engaged sponsors and exhibitors are essential for a successful congress, so the exhibition will be the centre of activities to maximize exhibitor and sponsor visibility and facilitate networking. The attendee experience is an important part of any large event, so we plan a comprehensive social programme with many options to allow full enjoyment of what Toronto and its surroundings have to offer. We look forward to welcoming you to Toronto in 2026!
By Derek Lichti, congress director More information
https://www.isprs2026toronto.com/
Issue 2 2023 48
There are many reasons why Toronto, Canada’s largest city, is an ideal location to host the ISPRS event.
Preparations for the FIG Working Week 2023

Meetings and inspiration for FIG Council members, session chairs and local organizers
Council meeting at FIG offices
At the beginning of February, the new FIG Council had its first on-site meeting. The FIG Council usually only meets in person once a year, at the main FIG event. However, to get the term off to a good start, FIG President Diane Dumashie brought together her council at the FIG offices in Copenhagen, Denmark, for a two-day meeting. The productive and inspiring meeting included the preparations for the new four-year work plan which will be presented at the General Assembly during the FIG Working Week 2023 in Orlando, Florida, USA.
Commission chairs working on the conference programme
In the subsequent days, the chairs of the FIG Commissions, FIG Networks and FIG Task Forces came together, likewise in Copenhagen. They had two creative days in which they focused on how to design, facilitate and chair good, varied and inspiring sessions in preparation for the upcoming Working Week in May. The open call for papers has inspired the chairs to create FIG’s own cinema sessions, and there will also be other new features during the conference days. The first draft programme will be published in March 2023.
Preparatory meeting in Orlando
It was unusually cold weather for January in Orlando when FIG President Diane Dumashie met with the local organizers from Florida and the representatives from the national host NSPS, Co-Conference Director John Hohol (president of FIG Foundation) and Tim Burch, CEO of NSPS (and chair of FIG Commission 1). In May, attendees can expect more decent outdoor temperatures as well as a hearty and warm welcome indoors from the local organizers. The conference centre is located within the Disney area and has the advantage that it is flanked by a Hilton hotel at each end (Signia by Hilton and Waldorf Astoria). Having everything under one roof will create an extra special atmosphere for the conference, for the sponsors and exhibitors, and for the expected 2,000 participants coming from across the Americas and elsewhere around the world.
The planned plenary sessions, which will set the scene at the beginning of each of the three conference days, are elaborating on the overall theme of ‘Protecting our World, Conquering New Frontiers’ with the following topics:
• Protecting our World / Climate and Sustainability
• Conquering New Frontiers
• Tackling the Global Challenges
The Working Week 2023 will include several pre-events, including a Young Surveyors Conference, a Multi-sensor Systems Workshop and a Reference Frames in Practice seminar. During the three conference days, there will be some sessions in Spanish, as FIG and the local host hope to attract a large Spanishspeaking attendance from the Americas in cooperation with the Pan American Association of Professionals of Surveying and Topography (APPAT). Additionally, a special National Geodetic Survey (NGS) programme will be offered on Wednesday 31 May about the US National Spatial Reference System (NSRS). Among other special sessions and happenings, one highlight will be a keynote presentation by NOAA NGS Director Juliana Blackwell.
 By Louise Friis-Hansen, FIG director
More information
www.fig.net/fig2023
FIG Working Week 2023, 28 May to 1 June 2023 Orlando (Florida), USA
FIG President Diane Dumashie (middle) with her council: (from right) Mikael Lilje, Daniel Steudler, Kwame Tenadu, and (from left) Winnie Shiu, ACCO representative Tim Burch and FIG Director Louise Friis-Hansen.
Issue 2 2023 49
The local organizers from NSPS and Florida, pictured here together with FIG President Diane Dumashie and FIG Director Louise Friis-Hansen, are looking forward to welcoming attendees in Orlando in May.
The International VLBI Service for Geodesy and Astrometry (IVS) Further advancing the technique for the best possible VLBI products
Accurate information about the orientation of the Earth in space is an essential prerequisite for every kind of navigation on Earth and in space. Very Long Baseline Interferometry (VLBI) is the only space geodetic technique capable of measuring the full set of Earth orientation parameters, i.e. the position of the rotation axis with respect to the sky, with respect to the Earth’s surface, and the rotation angle around the axis. In VLBI, globally distributed radio telescopes observe the signals from extragalactic radio sources (mostly quasars) billions of light years away. The signals are then time-tagged using hydrogen masers at the stations and sent to a correlator, where the difference in arrival time (delay) is determined by cross correlation. With a sufficiently large number of delays, Earth orientation parameters are determined in the analysis step as the result of an adjustment based on the leastsquares method. Of particular importance is the Earth’s rotation angle around its axis, because satellite techniques cannot derive this parameter. Actually, VLBI is able
to determine that angle (with respect to atomic time) with an accuracy of several microseconds, corresponding to millimetrelevel at the Earth’s surface.
Why is VLBI important?
VLBI is the technique for realizing the celestial reference system at radio wavelengths with positions of thousands of quasars in the sky. In the best cases, we reach accuracies better than 30 microarcseconds, which corresponds to a tennis ball on the Moon as observed from Earth. Unfortunately (for geodesists) – or interestingly (for astrophysicists) – the position and the structure of the quasars depends on frequency, i.e. it makes a small but significant difference whether we use bandwidth in the S, X, K or Ka band for the observations. In general, however, it is getting more and more difficult to find undisturbed frequencies for the observations because of the increasing amount of artificial signals emitted from ground and space in the microwave domain. Moreover, VLBI plays
an important role in the realization of the terrestrial reference system by coordinates and velocities of thousands of stations on the Earth’s surface. VLBI observations are particularly valuable for the determination of the size (scale) of the station network, which is of the utmost importance for measuring tiny effects, such as sea level rise.
The International VLBI Service for Geodesy and Astrometry (IVS) is coordinating all the tasks within the VLBI chain to derive the best possible VLBI products and to further advance the technique. These steps include the scheduling and performing of the observations with the network stations, data transfer and correlation, as well as analysis and distribution of the results.
The IVS is an international collaboration of organizations founded in 1999 as a service of the International Association of Geodesy (IAG) and of the International Astronomical Union (IAU).
 By Johannes Böhm, TU Wien, Austria
Issue 2 2023 50
Wettzell in Germany’s Bavarian Forest in one of about 40 sites with VLBI radio telescopes routinely contributing to IVS observations. (Image courtesy: BKG, Germany)
POSITIONING IN THE MOST DEMANDING CONDITIONS
ACCURATE
CERTUS EVO - RTK GNSS/INS
AI-Based Navigation System

Y: 183.78 ° P: 4.91 ° R: 0.12 ° Alt: 18 m Lat: -33.862687 Long: 151.208860 RTK GNSS / INS 0.05° Heading 0.03° Roll & Pitch 0.2° /hr MEMS gyroscope 1000 Hz Update Rate 10 mm RTK Positioning
